mining process data to detect aberrant test takers
TRANSCRIPT
Mining Process Data to Detect Aberrant Test TakersManqian Liao a, Je!rey Pattonb, Ray Yanb, and Hong Jiaoc
aDuolingo, Inc; bFinancial Industry Regulatory Authority; cDepartment of Human Development and Quantitative Methodology, University of Maryland, College Park
ABSTRACTItem harvesters who memorize, record and share test items can jeopardize the validity and fairness of credentialing tests. Item harvesting behaviors are di"cult to detect by the existing statistical modeling approaches due to the absence of operational de#nitions and the idiosyncratic nature of human behaviors. Motivated to detect the hard-to-de#ne aberrant test-taking beha-viors like item harvesting, we proposed a data-mining approach that utilized the process data and identi#ed the examinees whose test-taking processes deviate from the majority of examinees. Speci#cally, two steps were imple-mented in the proposed approach: First, archetypes of test-taking processes are learned with the k-means clustering algorithm; second, examinees whose behavioral patterns deviate from the archetypes are $agged for further inves-tigation. Given that the process data makes it possible to capture more subtle di!erences between the aberrant test-takers and normal examinees, the pro-posed approach is expected to be complementary of the statistical modeling methods, capture additional types of aberrant test-takers and increase the probability of discovering the elusive item harvesters.
KEYWORDS Process data; cheating detection; abnormal test- taking behavior; clustering; data mining
Introduction
Item harvesters who memorize, record and share test items can jeopardize the validity and fairness of credentialing tests and cause financial and reputational losses to testing companies. Unlike some other abnormal testing behaviors such as copying and cheating, it is hard to delineate a behavioral pattern of item harvesting. Although item harvesters may be characterized by intentionally failing or long sequences of incorrect responses (Thissen-Roe, 2016), these characteristics alone cannot distinguish item harvesters from normal low-ability examinees due to the idiosyncratic nature of human beha-viors. Fortunately, the availability of process data makes it possible to capture more subtle differences between the aberrant test-takers and normal examinees. Motivated to detect the hard-to-define aberrant test-taking behaviors like item harvesting, this study intends to develop a data-mining approach that utilizes process data to discover what the test-taking behavioral patterns are like for the majority of examinees (i.e., behavioral archetypes) and detect examinees whose behaviors deviate from the majority.
Process data, especially response times and erasure, have been used to detect abnormal testing behaviors (e.g., Marianti et al., 2014; Qualls, 2001; Van der Linden & Guo, 2008). Most of the previous studies on cheating detection used parametric methods based on strict assumptions and only limited types of process data. However, behaviors like item harvesting do not manifest themselves through a single variable and thus may require a more data-driven approach in order to be detected. To this end, we propose a two-step exploratory approach based on an unsupervised learning algorithm, k-means clustering (MacQueen, 1967). Specifically, we 1) use a clustering method to learn archetypes of the test-taking process and 2) identify examinees whose behavioral patterns deviate from the
CONTACT Manqian Liao [email protected] 5900 Penn Ave, Pittsburgh, PA 15206.
MEASUREMENT: INTERDISCIPLINARY RESEARCH AND PERSPECTIVES 2021, VOL. 19, NO. 2, 93–105 https://doi.org/10.1080/15366367.2020.1827203
© 2021 Financial Industry Regulatory Authority and Hong Jiao

archetypes. Table 1 shows the major types of process data analyzed in this study. A wider range of process data, if available, could be incorporated into the proposed approach. We expect the proposed approach to be complementary of the statistical modeling methods for detecting abnormal test-taking processes (e.g., Van der Linden & Guo, 2008; Van der Linden & Jeon, 2012), due to the following major differences between the existing statistical modeling methods and the proposed approach. On one hand, the nature of the abnormal test-taking processes discovered by these methods are different. The statistical modeling methods are designed to discover abnormal response processes with clear operational definition (e.g., response processes with lots of right-to-wrong answer changes) while the proposed method is intended to discover the abnormal response processes that are hard to oper-ationally define. On the other hand, the types of data utilized by these methods are different. The statistical modeling methods only utilized a limited variety of process data, if any, while the proposed method utilized a wide variety of process data. For example, the modeling method by Van der Linden and Guo (2008) is designed for being applied exclusively to response times, while the proposed method in this study utilizes the answer change and item revisit information in addition to response times. If additional types of process data were to be found useful, they could be easily incorporated as features in the proposed method as well. Given the differences between the statistical modeling methods and the proposed method, we expect the results obtained from these methods to be different.
The remainder of the paper starts with introducing the k-means clustering algorithm as the theoretical background. The proposed two-step approach is then elaborated along with an innovative way to represent the test-taking process. The proposed procedure was applied to a high-stakes and high-volume licensure exam data set. The configurations and results of the archetype learning and outlier detection procedures are presented. Finally, implications, limitations and future directions of this study are discussed.
Theoretical framework
The k-means clustering (MacQueen, 1967) is an unsupervised learning algorithm that divides data points into a number of non-overlapping clusters. While the k-means clustering is a popular technique, it has not been applied to detecting abnormal test-taking behaviors. Thus, the proposed approach is a novel application of the k-means clustering technique to address such educational measurement issues. Compared to the existing approaches on abnormal test-taking behavior detec-tion (e.g., Van der Linden & Guo, 2008; Van der Linden & Jeon, 2012), the proposed k-means-based method incorporates a wider variety of process data to detect the abnormal test-taking behaviors. Tang et al. (2020) have empirically proved that response processes contain much richer information than the binary item responses, advocating for leveraging the information from the process data. The proposed method is an original effort to leverage the information from the response processes
Table 1. Major types of process data analyzed in this study.
Process data type Description Example values
Response time Time (in seconds) elapsed between an examinee starting to view an item and leaving for another item
69.5, 125.4
Action type The category of response, such as an initial response or an answer change
BTR – changing answer from blank to right (i.e., answering an item correctly at the initial visit)
WTR – changing answer from wrong to right
NC – reviewing answer with no changeItem presentation order The presentation order of the item that an
examinee is viewing1, 2, 3
Number of item visits (NVISIT) The number of times an item is visited by an examinee
1, 2, 3
94 M. LIAO ET AL.

to detect abnormal test-taking behaviors. Many existing approaches for abnormal test-taking behavior detection (e.g., Van der Linden & Guo, 2008; Van der Linden & Jeon, 2012) are based on statistical modeling. One limitation of these existing methods is that they only utilized a limited variety of process data, if any, and could hardly incorporate additional types of process data. For instance, the modeling method proposed by Van der Linden and Guo (2008) is designed for being applied to response times, but it is challenging to generalize this method to incorporate additional useful information in the process data, such as item revisit. In contrast, the proposed k-means-based method utilizes the answer change and item revisit information in addition to the response times. Further, if additional types of process data were to be found useful, they could be easily incorporated as features in the proposed method.
Basics of k-means clustering
In the k-means clustering, data points belonging to the same cluster are deemed to share more similarity than other points in other clusters. The center of each cluster is referred to as centroid. The goal of the k-means clustering algorithm is to minimize the objective function, given by:
RSS àXK
kà1
XN
nà1xÖkÜn � ck�� ��2 (1)
where xÖkÜn is a data point that has been assigned to the kth cluster; ck is the centroid of the cluster; and xÖkÜn � ck
������ represents the distance between the data point and the centroid. This study chose to use
one of the most common types of distance, the Euclidean distance, as the distance measure. The Euclidean distance is calculated as the sum of the squared error between the two points in terms of various features. Assuming that the data are described by M features, the Euclidean distance is written as:
xÖkÜn � ck�� �� à
ÅÅÅÅÅÅÅÅÅÅÅÅÅÅÅÅÅÅÅÅÅÅÅÅÅÅÅÅÅÅÅÅÅXM
mà1ÖxÖkÜnm � ckmÜ
2
vuut : (2)
In general, the k-means algorithm works as follows:
(1) Set the number of clusters, K;(2) Select K points in the M-dimensional vector space as the initial centroids;(3) Assign each data point, xn, to the cluster whose centroid is the closest to the data point;(4) Recalculate the centroids of the clusters; and(5) Repeat Steps 3) and 4) until the positions of the centroids do not change any more.
Choice of the number of clusters
Since the number of clusters, K, needs to be pre-specified in the k-means clustering algorithm and could influence the clustering results, it is crucial to choose a reasonable number of clusters. A number of statistical methods have been proposed to determine the number of clusters. For example, in the “elbow method,” multiple rounds of k-means clustering with different numbers of K are run, and the percentage of variance explained is plotted against the number of clusters. One should choose a number of clusters at the “elbow point” of the plot where the increase in the number of clusters no longer leads to increase in the variance explained (Thorndike, 1953). In addition to the percentage of variance, other indices, such as the silhouette width (Rousseeuw, 1987) and Dunn index (Dunn, 1974), have also been used to assess the number of clusters. The
MEASUREMENT: INTERDISCIPLINARY RESEARCH & PERSPECTIVES 95
R package NbClust (Charrad et al., 2014) have used thirty indices for determining the number of clusters.
Stability of the clustering results
Since the clustering results can be dependent on the sample and be sensitive to the initial values (Pena et al., 1999), a number of methods have been used to ensure the stability of the clustering results. For instance, Ben-Hur et al. (2001) have defined stability as the pairwise similarity between clustering results based on different subsamples of the data, and they used the stability-based method to help choose an optimal number of clusters. Running k-means clustering with multiple initial values is also a common method to improve the stability of the clustering results (e.g., “K-means Cluster Analysis UC Business Analytics R Programming Guide,” n.d.).
The proposed approach
The proposed two-step approach utilizes k-means clustering to learn archetypes of the test-taking process and identify examinees with behavioral patterns that deviate from the archetypes. In general, three research questions can be answered by the proposed procedure: 1) How many test-taking process archetypes are there? 2) What are the characteristics of each archetype? 3) Which examinees display test-taking processes deviating from the majority?
Before going into detail about the proposed procedures of archetype learning and outlier detection, we introduce a way of representing the test-taking process. In particular, the test-taking process is represented as an action sequence or a behavioral sequence.
Test-taking process representation
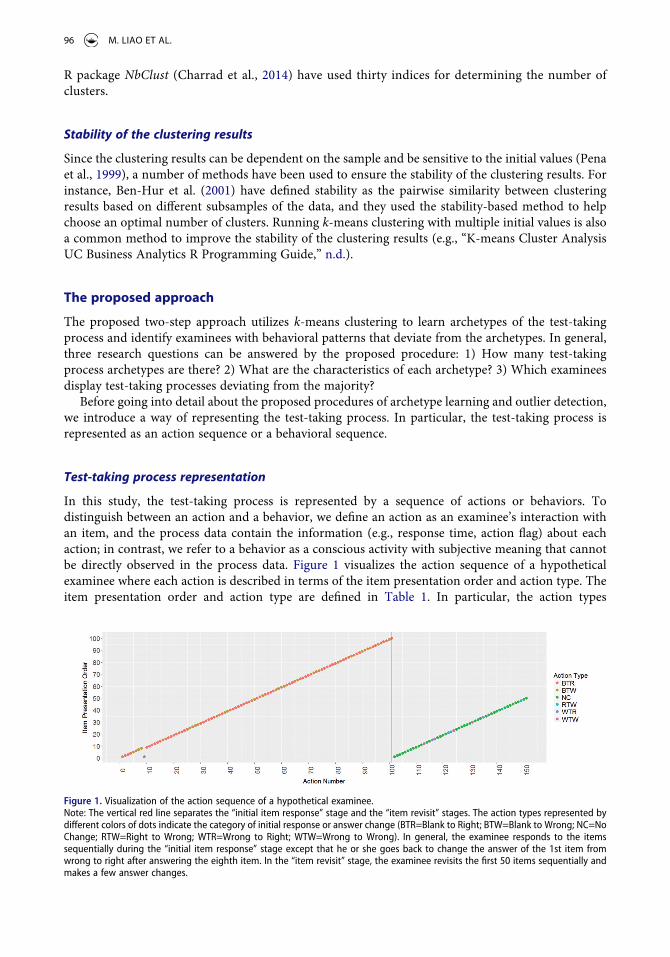
In this study, the test-taking process is represented by a sequence of actions or behaviors. To distinguish between an action and a behavior, we define an action as an examinee’s interaction with an item, and the process data contain the information (e.g., response time, action flag) about each action; in contrast, we refer to a behavior as a conscious activity with subjective meaning that cannot be directly observed in the process data. Figure 1 visualizes the action sequence of a hypothetical examinee where each action is described in terms of the item presentation order and action type. The item presentation order and action type are defined in Table 1. In particular, the action types
Figure 1. Visualization of the action sequence of a hypothetical examinee. Note: The vertical red line separates the “initial item response” stage and the “item revisit” stages. The action types represented by different colors of dots indicate the category of initial response or answer change (BTR=Blank to Right; BTW=Blank to Wrong; NC=No Change; RTW=Right to Wrong; WTR=Wrong to Right; WTW=Wrong to Wrong). In general, the examinee responds to the items sequentially during the “initial item response” stage except that he or she goes back to change the answer of the 1st item from wrong to right after answering the eighth item. In the “item revisit” stage, the examinee revisits the first 50 items sequentially and makes a few answer changes.
96 M. LIAO ET AL.

represented by different colors of dots in Figure 1 indicate the category of initial response or answer change. In this study, the action type variable has six possible values, including Blank to Right (BTR), Blank to Wrong (BTW), No Change (NC), Right to Wrong (RTW), Wrong to Right (WTR) and Wrong to Wrong (WTW). It can be seen that this examinee responds to most of the items sequentially. After seeing all the items at least once (indicated by the vertical red line), the examinee revisits the first 50 items sequentially and makes a few answer changes.
An alternative way of visualizing the action sequence is presented at the top of Figure 2 where each action is represented by an ellipse containing feature (e.g., action flag, item presentation order, response time) that describe the action. When multiple features are used to describe the action, information from different sources can be incorporated in the analyses. Representing the test-taking process as an action sequence minimizes the loss of information given that the feature values of each action are directly from the raw process data. However, it is hard to understand or interpret examinees’ intentions or cognitive states based on these raw action sequences without extracting more abstract information.
Inspired by the studies in the field of video action recognition (e.g., Ke et al., 2007; Van der Linden & Guo, 2008) where the raw video clips consisting of consecutive frames have been represented as a sequence of meaningful behaviors, we propose to represent the test-taking process as a behavioral sequence which is constructed by extracting the abstract information from the raw action sequence. Specifically, an analogy has been drawn between a video as a sequence of frames and a test-taking process as a sequence of actions. In a video, a behavior (e.g., running, walking) can be learned from several consecutive frames; in the test- taking process, a behavior is to be learned from several consecutive actions (i.e., action segments). An intuitive example of learning behaviors from consecutive actions is that when an examinee demonstrates several consecutive actions without answer changes and with very short response times, it may be inferred that this examinee is conducting a “clicking through without paying attention” behavior. The process of learning behaviors from raw action sequences is demonstrated in Figure 2 where the behaviors are referred to as “codewords” so that they can be further used in conjunction with text-mining techniques for learning examinee archetypes (e.g., Niebles et al., 2008). The process of learning behavioral archetypes and examinee archetypes is elaborated in the following section.
Learning test-taking process archetypes
Two rounds of k-means clustering are conducted: the first round is implemented at action-segment level, so the behavioral archetypes can be learned; and the second round is implemented at the person level, which learns the archetypes of examinees.
Segment 1
Action flow 1 8
BTW
1 1
WTR
1 13
BTR … … 1
94
BTR
1 95
BTW
1 100
BTR … … 1
1
BTW
1 2
BTR
1 7
BTW … … … …
Segment 2 Segment 20 Segmenting
Labeling Codeword A1 Codeword A1 Codeword A3
(7 actions) )snoitca7()snoitca7(
Figure 2. Procedure of behavioral archetype learning. Note: Each ellipse represents an action and contains the features used to describe the action (the response time is omitted in this figure). The acronym and number in an ellipse denote the action type and the corresponding item’s presentation order, respectively. Note that since item review is allowed, it is possible that an action flow contains several actions that are associated with one item. For example, there are two actions associated with Item 1 in this figure. The action flow is segmented every seven actions. Every action segment is assigned a codeword after behavioral archetypes are learned using k-means clustering.
MEASUREMENT: INTERDISCIPLINARY RESEARCH & PERSPECTIVES 97
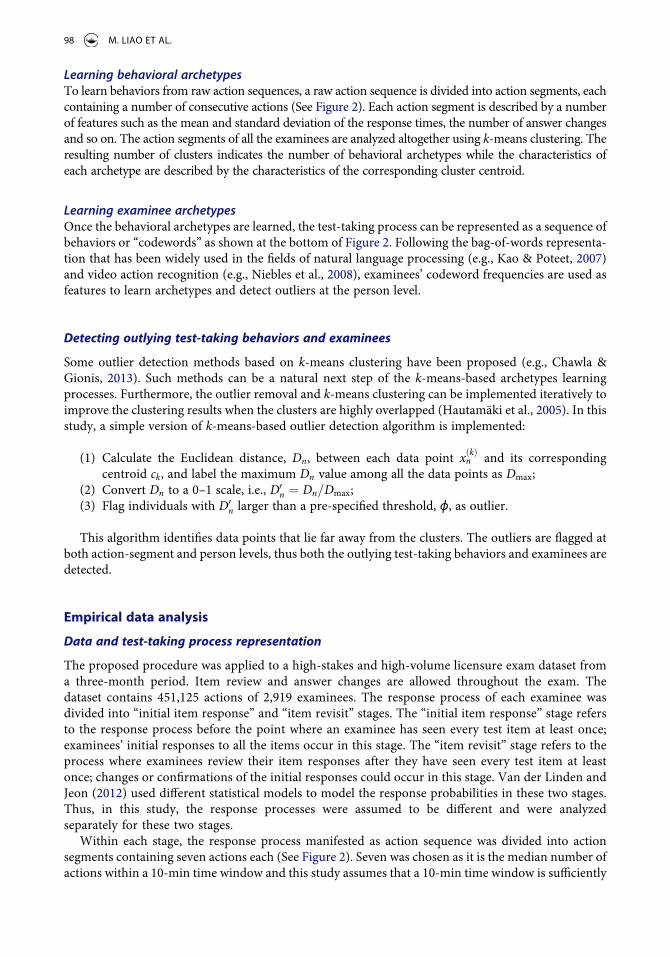
Learning behavioral archetypesTo learn behaviors from raw action sequences, a raw action sequence is divided into action segments, each containing a number of consecutive actions (See Figure 2). Each action segment is described by a number of features such as the mean and standard deviation of the response times, the number of answer changes and so on. The action segments of all the examinees are analyzed altogether using k-means clustering. The resulting number of clusters indicates the number of behavioral archetypes while the characteristics of each archetype are described by the characteristics of the corresponding cluster centroid.
Learning examinee archetypesOnce the behavioral archetypes are learned, the test-taking process can be represented as a sequence of behaviors or “codewords” as shown at the bottom of Figure 2. Following the bag-of-words representa-tion that has been widely used in the fields of natural language processing (e.g., Kao & Poteet, 2007) and video action recognition (e.g., Niebles et al., 2008), examinees’ codeword frequencies are used as features to learn archetypes and detect outliers at the person level.
Detecting outlying test-taking behaviors and examinees
Some outlier detection methods based on k-means clustering have been proposed (e.g., Chawla & Gionis, 2013). Such methods can be a natural next step of the k-means-based archetypes learning processes. Furthermore, the outlier removal and k-means clustering can be implemented iteratively to improve the clustering results when the clusters are highly overlapped (Hautamäki et al., 2005). In this study, a simple version of k-means-based outlier detection algorithm is implemented:
(1) Calculate the Euclidean distance, Dn, between each data point xÖkÜn and its corresponding centroid ck, and label the maximum Dn value among all the data points as Dmax;
(2) Convert Dn to a 0–1 scale, i.e., D0n à Dn=Dmax;(3) Flag individuals with D0n larger than a pre-specified threshold, ϕ, as outlier.
This algorithm identifies data points that lie far away from the clusters. The outliers are flagged at both action-segment and person levels, thus both the outlying test-taking behaviors and examinees are detected.
Empirical data analysis
Data and test-taking process representation
The proposed procedure was applied to a high-stakes and high-volume licensure exam dataset from a three-month period. Item review and answer changes are allowed throughout the exam. The dataset contains 451,125 actions of 2,919 examinees. The response process of each examinee was divided into “initial item response” and “item revisit” stages. The “initial item response” stage refers to the response process before the point where an examinee has seen every test item at least once; examinees’ initial responses to all the items occur in this stage. The “item revisit” stage refers to the process where examinees review their item responses after they have seen every test item at least once; changes or confirmations of the initial responses could occur in this stage. Van der Linden and Jeon (2012) used different statistical models to model the response probabilities in these two stages. Thus, in this study, the response processes were assumed to be different and were analyzed separately for these two stages.
Within each stage, the response process manifested as action sequence was divided into action segments containing seven actions each (See Figure 2). Seven was chosen as it is the median number of actions within a 10-min time window and this study assumes that a 10-min time window is sufficiently
98 M. LIAO ET AL.
long to provide meaningful behavioral information. As a result, the numbers of action segments are 49,169 and 13,065 in the “initial item response” and “item revisit” stages, respectively.
Behavioral archetypes
To learn behavioral archetypes, the k-means clustering was performed on the action-segment-level datasets, separately, from the “initial item response” and “item revisit” stages. The sets of features used to describe the action segments were slightly different between the “initial item response” and “item revisit” stages. In “initial item response” stage, the features include the mean and standard deviation of response times,1 the proportion of actions that involve initial item visit (i.e., NVISIT = 1) and the number of answer changes. In “item revisit” stage, the proportion of actions that involve initial item visit was excluded from the feature list as its value would be zero for all the action segments in this stage.
As the numbers of action segments are enormous in both response stages and it is intractable to run k-means clustering using all the action segments simultaneously, the k-means clustering was per-formed on subsamples of the action segments. To ensure the stability and representativeness of the results, five subsamples of action segments belonging to 100 randomly sampled examinees were created and k-means clustering was performed to each subsample; the final clustering results were obtained by pooling the results across the five subsamples.
To determine the number of behavioral archetypes (i.e., the optimal number of clusters for the whole action-segment sample), five replications of k-means clustering, each with a distinct set of initial values, were performed on each subsample; the mode of the optimal numbers of clusters (i.e., optimal k) suggested by the NbClust package (Charrad et al., 2014) was chosen as the optimal k for the subsample. Further, the mode of the optimal k across the subsamples was determined as the optimal number of clusters for the whole action-segment sample, indicating the number of behavioral archetypes. As a result, 3 and 4 behavioral archetypes were found in the “initial item response” and “item revisit” stages, respectively. The behavioral archetypes learned from the “initial item response” and “item revisit” stages were labeled as codewords A1-A3 and B1-B4, respectively. The stability of the clustering results was evaluated by the consistency of the optimal k’s across the five subsamples. The clustering results are more stable in the “item revisit” stage than those in the “initial item response” stage. Specifically, the optimal k values are consistently 4 for all the five subsamples in the “item revisit” stage; however, the optimal k values are 3 for three subsamples and 2 for two subsamples in the “initial item response” stage. Thus, we focus on interpreting the results from the “item revisit” stage.2
To learn the characteristics of the behavioral archetypes, the k-means clustering with k set at the number of behavioral archetypes (K’) was performed on each subsample, resulting in K’ centroids; each action segment in the whole action-segment dataset was then assigned to the cluster that has the closest centroid. The final cluster membership of an action segment is determined as the cluster to which this action segment is most frequently assigned, after resolving the label switching issue across subsamples.3 The final clustering centroid was defined as the “center” of all the action segments belonging to this cluster. The means of the feature values of all the action segments within a cluster were used to describe the quantitative characteristics of the cluster or the corresponding behavioral archetype; these mean values were further compared with some pre-specified cutoffs to describe the qualitative characteristics of the behavioral archetype.
Figure 3 displays the quantitative and qualitative characteristics of the four behavioral archetypes learned from the “item revisit” stage. The 30th and 70th percentiles of the feature values in the whole action-segment sample were used as cutoffs to distinguish low, moderate and high levels in terms of the feature. Each behavioral archetype is characterized by the levels of the features. For example, archetype B1 represents a type of behavior that, comparatively, has long mean response time, many answer changes, and moderate variation in response time. Among the action segments clustered into this archetype, the average number of answer changes is 3.55. The interpretation of other behavioral archetypes can be made in a similar manner.
MEASUREMENT: INTERDISCIPLINARY RESEARCH & PERSPECTIVES 99
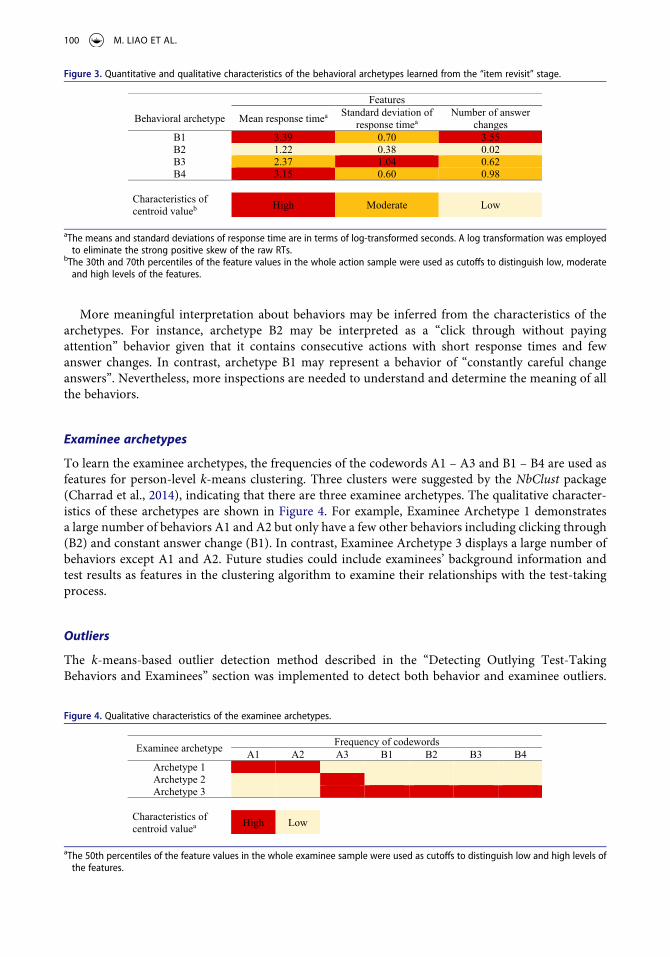
More meaningful interpretation about behaviors may be inferred from the characteristics of the archetypes. For instance, archetype B2 may be interpreted as a “click through without paying attention” behavior given that it contains consecutive actions with short response times and few answer changes. In contrast, archetype B1 may represent a behavior of “constantly careful change answers”. Nevertheless, more inspections are needed to understand and determine the meaning of all the behaviors.
Examinee archetypes
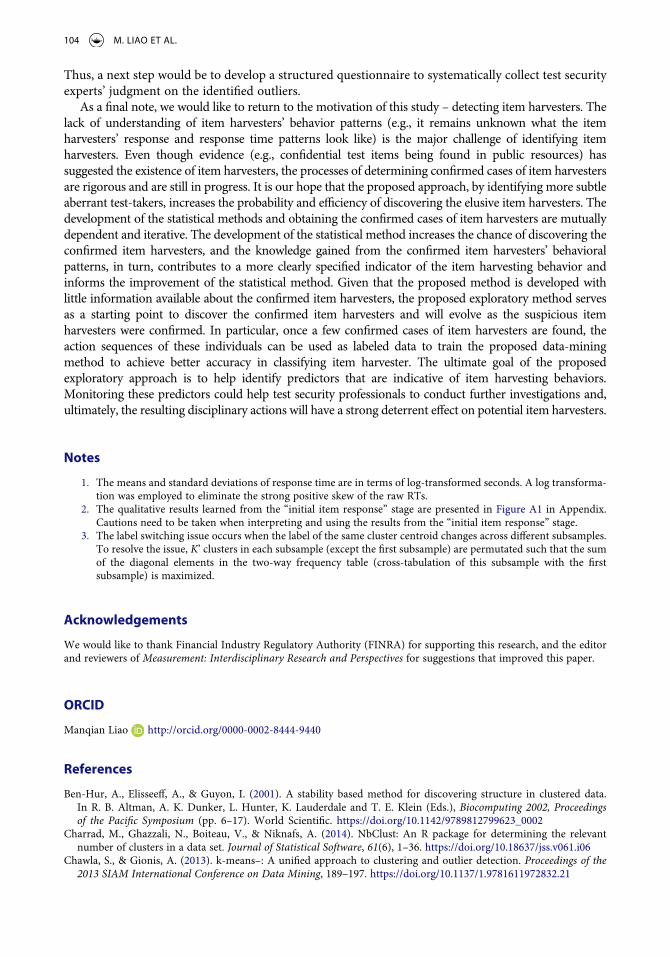
To learn the examinee archetypes, the frequencies of the codewords A1 – A3 and B1 – B4 are used as features for person-level k-means clustering. Three clusters were suggested by the NbClust package (Charrad et al., 2014), indicating that there are three examinee archetypes. The qualitative character-istics of these archetypes are shown in Figure 4. For example, Examinee Archetype 1 demonstrates a large number of behaviors A1 and A2 but only have a few other behaviors including clicking through (B2) and constant answer change (B1). In contrast, Examinee Archetype 3 displays a large number of behaviors except A1 and A2. Future studies could include examinees’ background information and test results as features in the clustering algorithm to examine their relationships with the test-taking process.
Outliers
The k-means-based outlier detection method described in the “Detecting Outlying Test-Taking Behaviors and Examinees” section was implemented to detect both behavior and examinee outliers.
Figure 4. Qualitative characteristics of the examinee archetypes.
Examinee archetype Frequency of codewordsA1 A2 A3 B1 B2 B3 B4
Archetype 1Archetype 2Archetype 3
Characteristics of centroid valuea High Low
aThe 50th percentiles of the feature values in the whole examinee sample were used as cutoffs to distinguish low and high levels of the features.
Figure 3. Quantitative and qualitative characteristics of the behavioral archetypes learned from the “item revisit” stage.
Features
Behavioral archetype Mean response timea Standard deviation of response timea
Number of answer changes
B1 3.39 0.70 3.55B2 1.22 0.38 0.02B3 2.37 1.04 0.62B4 3.15 0.60 0.98
Characteristics of centroid valueb High Moderate Low
aThe means and standard deviations of response time are in terms of log-transformed seconds. A log transformation was employed to eliminate the strong positive skew of the raw RTs.
bThe 30th and 70th percentiles of the feature values in the whole action sample were used as cutoffs to distinguish low, moderate and high levels of the features.
100 M. LIAO ET AL.

The threshold ϕ was set at 0.7. The threshold ϕ was chosen such that the proposed method can demonstrate the power to flag outliers while the number of outliers is within a manageable range for further investigations, given that qualitative analyses (e.g., human judgment of whether an individual is a confirmed item harvester based on revisiting the response processes, video and other relevant evidence) are to be conducted to the flagged outliers on a case-by-case basis. Specifically, we have compared the number of flagged outliers using different threshold ϕ specifications (i.e., 0.6, 0.7, 0.8 and 0.9) and determined that the number of flagged outliers using the threshold of 0.7 is optimal from the pragmatic perspective. In particular, using the threshold of 0.7, 15 examinees were found to display outlying test-taking behaviors based on the action-segment-level clustering while 19 were flagged as person outliers based on the person-level clustering. If a threshold of 0.8 or higher were used, fewer than 10 examinees would be flagged and the method may lack power; If a threshold of 0.6 or lower were used, more than 30 examinees would be flagged by each method and it would be costly to investigate all the outliers case by case. Note that the outliers identified by the person-level clustering do not necessarily contain the outlying behaviors detected by the action-segment-level clustering and vice versa, which implies that the two rounds of clustering may be complementary to each other.
Figure 5. Visualization of the action sequence of an example examinee who had 15 action segments identified as outliers. Note: The action types represented by different colors of dots indicate the category of initial response or answer change (BTR=Blank to Right; BTW=Blank to Wrong; NC=No Change; RTW=Right to Wrong; WTR=Wrong to Right; WTW=Wrong to Wrong). The outlying action segments are highlighted with rectangles. The vertical red line separates the “initial item response” stage and the “item revisit” stage.
MEASUREMENT: INTERDISCIPLINARY RESEARCH & PERSPECTIVES 101

To validate that the outliers identified by the data mining procedure are meaningful, we investi-gated the action sequences of each identified outlier (See Figures 3 and 4 for examples) and consulted the test security experts whether these action sequences are deemed unusual based on their profes-sional judgment. The confirmation from the test security experts serves as evidence to support that the outliers identified from the data mining procedure are substantive.
Figure 5 visualizes the action sequence of an examinee who has 15 action segments identified as outliers in the action-segment-level clustering. It can be observed that, in the flagged action segments (highlighted by the rectangles), this examinee constantly made answer changes with short response times, which was deemed unusual in a test-taking process by test security experts. Figure 6 visualizes the action sequence of an examinee who was identified as an outlier in the person-level clustering. In the “initial item response” stage, this examinee clicked back and forth as he or she moved toward the end of the exam. Such action sequences were also regarded as unusual by test security experts, but further investigation on these examinee outliers are needed to understand their behaviors and intentions.
Figure 6. Visualization of the action sequence of an example examinee who was identified as outlier in the person-level clustering. Note: The action types represented by different colors of dots indicate the category of initial response or answer change (BTR=Blank to Right; BTW=Blank to Wrong; NC=No Change; RTW=Right to Wrong; WTR=Wrong to Right; WTW=Wrong to Wrong). The vertical red line separates the “initial item response” stage and the “item revisit” stage.
102 M. LIAO ET AL.

Discussion
This study proposed a data-mining approach to examine test-taking behavior archetypes and detect abnormal test-taking behaviors. The proposed method utilizes a variety of process data and relies on fewer assumptions than the parametric methods, which makes it a powerful tool to discover subtle differences in behavior patterns between the aberrant test-takers and normal test-takers. The outliers flagged by the proposed method are also promising starting points to identify the hard-to-define aberrant test-taking behaviors like item harvesting.
The proposed method was applied to data from a licensure exam to learn behavioral and examinee archetypes as well as detect outliers. Three and four behavioral archetypes were learned in the “initial item response” and “item revisit” stages, respectively, based on the action-segment-level clustering. The clustering results were stable in the “item revisit” stage but lacking in stability in the “initial item response” stage. The meaning of the behaviors was inferred from the characteristics of the behavioral archetypes. For example, a behavior of “clicking through without paying attention” was identified as it consists of consecutive actions with short response time and few answer changes. Three examinee archetypes were found based on the person-level clustering. Outliers were identified at both action- segment and person levels. Action sequences of the examinees who displayed multiple outlying behaviors or were flagged as outliers at the person level were visualized and inspected. While the proposed approach is motivated to detect item harvesters, it is possible that these flagged outliers belong to other groups of aberrant test-takers (e.g., carelessness, low motivation). Thus, further investigations, such as examining the test center surveillance video, are needed to understand the motivation and intention of these examinees.
This study has some limitations and a number of directions remain to be explored in the future. First, the proposed method relies on an assumption that the majority of the examinees are normal and only a small percentage could be ill-intentioned. Although this assumption can hardly be tested in reality, simulation studies could be conducted to examine the effectiveness of the proposed method under the conditions with various mixing proportions of examinees.
Second, only a limited number of features were used at both the action-segment- and person-level clustering. More features could be incorporated in the future to make the proposed statistical method more powerful. Results obtained from other aberrant behavior detection methods (e.g., Van der Linden & Guo, 2008; Van der Linden & Jeon, 2012) could also be promising features to be incorpo-rated in the proposed data-mining procedure. However, it should be noted that there is not a golden rule for feature engineering. Insights and a large number of tryouts are needed to develop an effective feature engineering scheme. When a large number of features were created, feature selection methods could be applied to select useful features.
Third, we only examined the outliers’ action sequences recorded in the analyzed dataset. If the outliers are repeated test-takers or if they have taken other licensure exams, it is worthwhile to conduct some inter-attempt analyses, examining whether they display consistent behavioral patterns across attempts. If future researchers were interested in discovering examinees who display consistently suspicious behaviors or inconsistent behavioral patterns across tests, analyses of data from frequent exam combinations could be good starting points. Furthermore, some person-level characteristics of the outliers, such as the institutions they receive training from and the test centers they take exams in, could be investigated as the next step.
Fourth, the proposed method is a statistical method and it, as any other statistical methods, is subject to Type I and Type II errors. We would like to echo Van der Linden and Jeon (2012)’s proposition that results from the statistical tests should not be the only source of evidence for cheating and make analogy to the case of aberrant test-taker detection. The outliers flagged from our proposed data-mining method should not serve as the only evidence to determine aberrant test-takers, either. To implement the proposed data-mining procedure in production, it is suggested that each outlier identified by the data-mining method should be investigated by test security experts and decisions on aberrant test-taker classification should be based on both statistical results and qualitative analyses.
MEASUREMENT: INTERDISCIPLINARY RESEARCH & PERSPECTIVES 103
Thus, a next step would be to develop a structured questionnaire to systematically collect test security experts’ judgment on the identified outliers.
As a final note, we would like to return to the motivation of this study – detecting item harvesters. The lack of understanding of item harvesters’ behavior patterns (e.g., it remains unknown what the item harvesters’ response and response time patterns look like) is the major challenge of identifying item harvesters. Even though evidence (e.g., confidential test items being found in public resources) has suggested the existence of item harvesters, the processes of determining confirmed cases of item harvesters are rigorous and are still in progress. It is our hope that the proposed approach, by identifying more subtle aberrant test-takers, increases the probability and efficiency of discovering the elusive item harvesters. The development of the statistical methods and obtaining the confirmed cases of item harvesters are mutually dependent and iterative. The development of the statistical method increases the chance of discovering the confirmed item harvesters, and the knowledge gained from the confirmed item harvesters’ behavioral patterns, in turn, contributes to a more clearly specified indicator of the item harvesting behavior and informs the improvement of the statistical method. Given that the proposed method is developed with little information available about the confirmed item harvesters, the proposed exploratory method serves as a starting point to discover the confirmed item harvesters and will evolve as the suspicious item harvesters were confirmed. In particular, once a few confirmed cases of item harvesters are found, the action sequences of these individuals can be used as labeled data to train the proposed data-mining method to achieve better accuracy in classifying item harvester. The ultimate goal of the proposed exploratory approach is to help identify predictors that are indicative of item harvesting behaviors. Monitoring these predictors could help test security professionals to conduct further investigations and, ultimately, the resulting disciplinary actions will have a strong deterrent effect on potential item harvesters.
Notes
1. The means and standard deviations of response time are in terms of log-transformed seconds. A log transforma-tion was employed to eliminate the strong positive skew of the raw RTs.
2. The qualitative results learned from the “initial item response” stage are presented in Figure A1 in Appendix. Cautions need to be taken when interpreting and using the results from the “initial item response” stage.
3. The label switching issue occurs when the label of the same cluster centroid changes across different subsamples. To resolve the issue, K’ clusters in each subsample (except the first subsample) are permutated such that the sum of the diagonal elements in the two-way frequency table (cross-tabulation of this subsample with the first subsample) is maximized.
Acknowledgements
We would like to thank Financial Industry Regulatory Authority (FINRA) for supporting this research, and the editor and reviewers of Measurement: Interdisciplinary Research and Perspectives for suggestions that improved this paper.
ORCID
Manqian Liao http://orcid.org/0000-0002-8444-9440
References
Ben-Hur, A., Elisseeff, A., & Guyon, I. (2001). A stability based method for discovering structure in clustered data. In R. B. Altman, A. K. Dunker, L. Hunter, K. Lauderdale and T. E. Klein (Eds.), Biocomputing 2002, Proceedings of the Pacific Symposium (pp. 6–17). World Scientific. https://doi.org/10.1142/9789812799623_0002
Charrad, M., Ghazzali, N., Boiteau, V., & Niknafs, A. (2014). NbClust: An R package for determining the relevant number of clusters in a data set. Journal of Statistical Software, 61(6), 1–36. https://doi.org/10.18637/jss.v061.i06
Chawla, S., & Gionis, A. (2013). k-means–: A unified approach to clustering and outlier detection. Proceedings of the 2013 SIAM International Conference on Data Mining, 189–197. https://doi.org/10.1137/1.9781611972832.21
104 M. LIAO ET AL.

Dunn, J. C. (1974). Well-separated clusters and optimal fuzzy partitions. Journal of Cybernetics, 4(1), 95–104. https://doi. org/10.1080/01969727408546059
Hautamäki, V., Cherednichenko, S., Kärkkäinen, I., Kinnunen, T., & Fränti, P. (2005). Improving k-means by outlier removal. In H. Kalviainen, J. Parkkinen, & A. Kaarna (Eds.), Image Analysis. SCIA 2005. Lecture Notes in Computer Science (Vol. 3540). Springer, Berlin, Heidelberg. https://doi.org/10.1007/11499145_99
Kao, A., & Poteet, S. R. (2007). Natural language processing and text mining. Springer Science & Business Media.Ke, Y., Sukthankar, R., & Hebert, M. (2007). Spatio-temporal shape and flow correlation for action recognition. 2007
IEEE Conference on Computer Vision and Pattern Recognition, 1–8. Minneapolis, MN. https://doi.org/10.1109/CVPR. 2007.383512
K-means Cluster Analysis UC Business Analytics R Programming Guide. (n.d.). Retrieved February 24, 2019, from https:// uc-r.github.io/kmeans_clustering#kmeans
MacQueen, J. (1967). Some methods for classification and analysis of multivariate observations. Proceedings of the Fifth Berkeley Symposium on Mathematical Statistics and Probability, Volume 1: Statistics (pp. 281–297). University of California Press. https://projecteuclid.org/euclid.bsmsp/1200512992
Marianti, S., Fox, J.-P., Avetisyan, M., Veldkamp, B. P., & Tijmstra, J. (2014). Testing for aberrant behavior in response time modeling. Journal of Educational and Behavioral Statistics, 39(6), 426–451. https://doi.org/10.3102/ 1076998614559412
Niebles, J. C., Wang, H., & Fei-Fei, F.-F. (2008). Unsupervised learning of human action categories using spatial-temporal words. International Journal of Computer Vision, 79(3), 299–318. https://doi.org/10.1007/s11263- 007-0122-4
Pena, J. M., Lozano, J. A., & Larranaga, P. (1999). An empirical comparison of four initialization methods for the k-means algorithm. Pattern Recognition Letters, 20(10), 1027–1040. https://doi.org/10.1016/S0167-8655(99)00069-0
Qualls, A. L. (2001). Can knowledge of erasure behavior be used as an indicator of possible cheating? Educational Measurement: Issues and Practice, 20(1), 9–16. https://doi.org/10.1111/j.1745-3992.2001.tb00053.x
Rousseeuw, P. J. (1987). Silhouettes: A graphical aid to the interpretation and validation of cluster analysis. Journal of Computational and Applied Mathematics, 20, 53–65. https://doi.org/10.1016/0377-0427(87)90125-7
Tang, X., Wang, Z., He, Q., Liu, J., & Ying, Z. (2020). Latent feature extraction for process data via multidimensional scaling. Psychometrika, 85(2), 378–397. https://doi.org/10.1007/s11336-020-09708-3
Thissen-Roe, A. (2016). Some issues in retesting policy. http://www.comiratesting.com/testing-svcs/Retest.pdf Thorndike, R. L. (1953). Who belongs in the family? Psychometrika, 18(4), 267–276. https://doi.org/10.1007/BF02289263 Van der Linden, W. J., & Guo, F. (2008). Bayesian procedures for identifying aberrant response-time patterns in adaptive
testing. Psychometrika, 73(3), 365–384. https://doi.org/10.1007/s11336-007-9046-8 Van der Linden, W. J., & Jeon, M. (2012). Modeling answer changes on test items. Journal of Educational and Behavioral
Statistics, 37(1), 180–199. https://doi.org/10.3102/1076998610396899
Appendix
Figure A1. Qualitative characteristics of the behavioral archetypes learned from the “initial item response” stage.
Features
Behavioral Archetype
Mean response timea
Standard deviation of
response timea
Number of answer changes
Proportion of initial visit
A1A2A3
Characteristics of centroid valueb High Low
aThe means and standard deviations of response time are in terms of log-transformed seconds. A log transformation was employed to eliminate the strong positive skew of the raw RTs.
bThe 50th percentiles of the feature values in the whole action-segment sample were used as cutoffs to distinguish low and high levels of the features.
MEASUREMENT: INTERDISCIPLINARY RESEARCH & PERSPECTIVES 105