minimum wage systems and changing industrial relations … report for... · minimum wage systems...
TRANSCRIPT

Minimum Wage Systems and Changing Industrial Relations in Europe:
Comparative Report
Damian Grimshaw and Jill Rubery
October 2010
Prepared for the EC research project, ‘Minimum wage systems and changing industrial relations in Europe’ VS/2009/0159.
DG Employment, Social Affairs and Equal Opportunities.
European Work and Employment
Research Centre (EWERC) University of Manchester, UK

Comparative Report 2
Contents Introduction 3
1. Minimum wage policy and practice: a 9-country comparison
2. The changing value of the minimum wage
2.1. Country patterns
2.2. Country trends
3. Minimum wages and collective bargaining: complementarities and
tensions
3.1. Government, social partners and the minimum wage
3.2. Interaction between the minimum wage and collective
bargaining
4. Redistributive effects of the minimum wage on wage structure
4.1. The effect on low pay
4.2. Gender pay equity
5. Minimum wages and distributive pay bargaining: evidence from
four sectors in five countries
5.1. The characteristics of four sectors
5.2. Pay bargaining and the minimum wage
5.3. Features of an egalitarian pay bargaining approach
6. Conclusion
Appendix
References
7
15
15
19
26
26
32
37
37
40
43
44
52
58
64
68
71
Comparative Report 3
Introduction 1
All European member states have some form of minimum wage system. Minimum wages
may be applied using government legislation (currently found in 20 EU member states) or
they may be a by-product of social partner collective agreements (found in seven member
states) with supplementary statutory extension regulations in some cases. Within each of
these two basic models of minimum wages, countries display an enormous variety of rules
and conventions that shape the functioning, effectiveness and performance of a minimum
wage. There is variety in the use of single or multiple rates, in the roles of social partners and
government in minimum wage setting, in the value of the minimum wage and trends over
time, its interaction with welfare policy and its distributive effects on wage structure,
especially on the incidence of low pay and gender pay equity (Bazen 2000, Brosnan 2003,
EC 2008, Eyraud and Saget 2005, Freeman 1996, Funk and Lesch 2006, Schulten et al.
2006, Vaughan-Whitehead 2009a). Recent country developments highlight the diverse
functioning of minimum wages as well as their potential to spark conflict over policy
intervention. For example, in Hungary there is continuing debate about its initiative to use
multiple minimum rates differentiated by skill; in Germany there is vigorous debate over the
need for a new minimum wage system to protect low wage workers; in Croatia social
partners have conflicting views on a new uprating mechanism; trade unions and living wage
campaigners in the UK have been lobbying for a higher minimum wage; and the
government’s ambition for a higher minimum in Spain is presenting potential challenges for
collective bargaining.
No universal position on minimum wages or strategy towards the use of minimum wages
can be said to be followed either by governments or social partners. This applies both across
countries and within the same country across time periods. It is not even always the case that
employers oppose and trade unions favour a rise n the minimum wage. Employers may in
some circumstances be supportive of the introduction of or the raising of a statutory
minimum wage because it fits with their desire to weed out unscrupulous firms or to
establish a realistic benchmark in the labour market. In some circumstances, trade unions
1 We are very grateful to Andrew Chapman from the European Commission for providing encouragement, advice and critical comments throughout this 12-month project. This comparative report also benefits from input and corrections of earlier drafts from members of each of the five country teams in this project, as well as research assistance from Claire Shepherd.

Comparative Report 4
may be cautious about raising the minimum wage floor because if set too high it might erode
their bargaining power in negotiating collectively agreed wages. Also, at particular points in
time, governments may favour active intervention in minimum wage policy to further policy
objectives of reducing wage inequality or addressing high levels of working poverty. This
may apply even if the government still considers that increasing minimum wages may
involve risks of inflation or job loss.
In order to improve our understanding of why different approaches are taken by
governments and social partners across countries and over time this comparative research
project set out to interrogate the different rules and functions of minimum wages in their
country settings and to understand the interlinkages between a minimum wage system and a
country’s model of industrial relations. By shedding light on the way minimum wage
systems interact with the pay bargaining strategies of trade unions and employers, the
objective was to contribute to the Europe 2020 goals of more effective and sustainable policy
development in this area, particularly with regard to fair labour market outcomes and
enhanced processes of social dialogue.
The novelty of this project is its analysis of original comparative data on employer and union
approaches to wage bargaining (in national, sector and organisation level collective
agreements) in a context of developments in minimum wage policy. At the aggregate level
we know both that countries with strong collective bargaining coverage are less likely than
other countries to have a system of statutory minimum wage protection and that among those
countries with statutory minimum wage protection, stronger models of collective bargaining
(coordination and coverage) seem to support (or determine) a higher relative level of the
minimum wage (EC 2008). Cross-national comparative data also demonstrate a strong
negative relationship between the level of a minimum wage (relative to average earnings)
and the incidence of low pay and size of gender pay gap in a country (Vaughan-Whitehead
2009b). However, we understand far less about how these results are articulated through the
processes and outcomes of collective bargaining. For example, a rising minimum wage may
dovetail with trade union strategies to compress the wage structure among members,
generating an especially strong effect at the lower end by truncating the bottom tail of the
pay distribution among organised workers (for the UK, see Metcalfe et al. 2001). Similarly,
both employers and unions may seek to build on a minimum wage floor through
complementary efforts to address gender pay equity through pay bargaining (Colling and
Comparative Report 5
Dickens 1988, Dickens 2000). But how do wage bargaining strategies modify and shape the
spillover, or ‘ripple effect’ (Pollin et al. 2008), associated with a rising minimum wage? Do
social partners believe that the lowest paid in their particular sector or organisation ought to
be paid higher than the legally binding minimum wage? If so, what is an appropriate pay gap
- a ‘legitimate differential’ in Checchi et al.’s (2010) words - and ought this to be sustained
even during a period of above-average increases in the minimum wage? And in cases where
the base pay in a collective agreement is at or even below the legal minimum, what are the
reasons for this and do social partners negotiate other pay supplements?
Our detailed empirical evidence is drawn from five countries – Croatia, Germany, Hungary,
Spain and the UK – and supplemented by secondary data for four countries (Estonia, France,
Ireland and Sweden). Five national reports were conducted as part of this research project by
experts from each country2:
– Danijel Nestić and Ivana Rašić Bakarić for Croatia;
– Josep Banyuls, Ernest Cano and Empar Aguado for Spain;
– Gerhard Bosch and Claudia Weinkopf for Germany;
– László Neumann for Hungary; and
– Damian Grimshaw, Claire Shepherd and Jill Rubery for the UK
The results demonstrate the answers to such questions are shaped by the particular
circumstances of country and sector systems of social dialogue, collective bargaining
arrangements and product market conditions. Our choice of EU member states includes old,
new and candidate countries. Moreover, the five country reports analyse developments in
those sectors most relevant for minimum wage debates in the particular country. In this
comparative report, in addition to summarising differences at the national level, we collate
some of the key findings with respect to four sectors – retail, security, cleaning and
construction. Our objective is to critically analyse how different country minimum wage
systems function alongside union and employer wage bargaining strategies, how effective
they are in protecting the low paid and what capacity they have to enhance social dialogue.
The report is organised as follows. Section 1 reviews the differences in rules and
conventions governing minimum wage systems, as well as key moments of policy
development, among the nine European countries selected for analysis. Section 2 assesses
2 See the bibliography for full references. All reports available for download at http://www.mbs.ac.uk/research/ europeanemployment/projects/minimum-wage.aspx.

Comparative Report 6
inter-country patterns and trends in the relative value of the minimum wage, and covers
European data on statutory minimum wages as well as data on the value of sector minima in
Germany and Sweden. Section 3 draws on data for the nine European countries to elaborate
the tensions and complementarities between minimum wage policy and the country model of
industrial relations. It explores two issues: the approach of government, unions and
employers to the minimum wage; and the interaction with the relative coordination and
coverage of collective bargaining. Section 4 identifies – at an aggregate level - the
redistributive effects of minimum wages (following Freeman 1996) on two measures of pay
equity, the incidence of low pay and the gender pay gap. Section 5 compares and contrasts
original empirical evidence on pay bargaining drawing on the analyses in the five national
reports completed for this project. Finally, section 6 sets out four key issues for policy
consideration.

Comparative Report 7
1. Minimum wage policy and practice: a 9-country comparison
The fact that statutory minimum wage rules are applied in approximately 90% of countries
signed up to ILO membership (ILO 2009) suggests there is a near international consensus on
the value of this particular instrument of labour market intervention. Within Europe, 20 of
the 27 member states have some form of statutory minimum wage. Among the seven
countries without national legislation multiple minimum wage levels are instead agreed by
social partners in sector-based collective agreements, albeit with varying coverage of the
workforce. As with all labour market rules (see Freeman 1994), therefore, there is
considerable variety in minimum wage policy and practice. This section reviews the key
differences in approach, as well as moments of change, among the nine European countries
selected for analysis (see table 1 and figure 1).
Seven of the nine countries have a statutory national minimum wage (MW). The two
exceptions, Germany and Sweden, rely instead on different minimum rates negotiated in
separate sectoral collective bargaining agreements; Germany also applies sector-wide
minimum wages in several sectors through legally binding extensions. Among the group of
seven countries, a statutory national MW is in fact a relatively recent intervention in five
countries; it is only a little over a decade old in Croatia, Ireland and the UK and two decades
old in Estonia and Hungary. Differences in the age of this form of wage regulation, however,
do not appear to be related to the variety of rules in place today (table 1).
As well as a standard, or adult, national MW, many countries set alternative MW rates for
categories of workers who may be perceived as meriting special consideration. In most
cases, the categories are defined in objective terms. For example, France, Ireland and the UK
each specify youth rates, typically for workers aged 16 and 17 years old. The position of the
UK is notable given its notion of an adult worker as a person aged 21 years old and over
rather than the more conventional definition of 18 years old.3 In some cases, the exceptional
categories are more susceptible to changing definitions. For example, separate rates for
skilled and educated workers prevail in Hungary. During 2006-8 three tiers distinguished 3 In fact, until 2010 the UK government considered an adult worker as aged 22 years old and above, despite persistent recommendations over ten years from the independent Low Pay Commission to change the limit to 21 years.

Comparative Report 8
between a standard worker, a beginner-level skilled worker and a skilled worker with at least
two years experience. But following employer criticisms, this was subsequently simplified in
2009 to just two rates. Given that the skilled MW is 22% higher than the standard rate there
is a risk that employers may redesign jobs to reduce MW payments (Neumann 2010). The
rules in Croatia are also of interest since they set a separate ‘sub-minimum wage’ in four
industries that are singled out for special attention due to their difficult economic conditions.
This temporary sub-minimum was established in 2008 in the textile, clothing, wood
processing and leather industries and aims to reduce the possible job loss effects in these
industries from a higher standard MW.
Figure 1. Key moments in rules shaping minimum wage-setting, nine countries, 2001-2010
Table 1 also presents the different nominal levels of the MW. There is a wide range in hourly
rates, from €1.46 in Hungary to €8.86 in France4, which reflects both the cost of living of
each country and the relative level of the wage floor compared to the average or median
level of earnings, an issue we explore further below.5 There are also important country
4 Euro exchange rates applicable in July 2010. 5 Country differences in prices can be controlled for by applying Purchasing Power Parities for household consumption expenditures, as presented in figure 3 of the Eurostat ‘Statistics in Focus’ (2008) publication.
Croatia:
New MW Act makes substantial changes
2010200920082007200620052004200320022001
Croatia:
MW linked to unemployment
benefits
Estonia:
Agreement to raise MW to 41% of
average wage by 2008
France:
Decision to set up a new MW
Commission in 2010
Hungary:
Unprecedented rise in MW
Hungary:
New 3-tier MW system with 2 rates for skilled workers
Hungary:
Switch from 3 to 2-tier MW systemSpain:
MW delinked from welfare payments
Spain:
Government policy to raise MW during
2004-8
UK:
Low Pay Commission goal to raise MW relative to average
earnings 2003-7
UK:
New youth MW for 16-17 year
olds
UK:
Adult rate extended to 21 year olds
New apprentice MW
Germany:
Industry minimum wages agreed for selected sectors during 2008-10
Sweden:
ECJ Laval case rules against construction
workers’ trade union
Sweden:
New ‘Laval Law’implemented
Ireland
Minimum wage earners exempted from income
tax
Ireland
MW increased
without agreement of
employers

Comparative Report 9
differences in the conceptualisation of the minimum wage in terms of a monthly, daily or
hourly income guarantee. A monthly standard arguably meets the policy goal of establishing
a minimum basic wage income for a full-time worker, with pro rata conditions for part-time
workers adjusted for hours of work. A monthly minimum can be found in Croatia, Estonia,
Hungary and Spain; it is the most common form of payment in the EU (Eurostat 2009).
Indeed, in the case of Spain the fact that the MW was at a very low level for many years is
partly explained by its popular interpretation as a monthly minimum income to prevent
extreme poverty rather than as a benchmark for wage-setting. In contrast an hourly MW
applies an explicit notion that there ought to be a minimum reward for an hour’s work. This
applies in France, Ireland and the UK, as well as Estonia, which sets an hourly and a
monthly minimum.
In Germany and Sweden, the absence of a statutory national MW means that it is not
possible to report a single MW level. Instead there are multiple minimum wages set in the
various sector-based collective agreements. We present detailed data on these minimum rates
in section 2 below.
Our 9-country comparison,reveals a further variety of rules when we review the procedures
for fixing a minimum wage (table 1). There are three issues of interest. The first is the
timescale for adjusting the MW floor; all countries do this on an annual basis with the
exception of Ireland. Since its introduction in 2000 the Irish MW has been uprated after a
period of anywhere from 15 months to 20 months, such that the date of uprating also varies
from one year to the next (Nolan 2009: table 9.5). In the other countries, the timing is fixed;
although in 2010 the French government changed the month for uprating from July each year
to January in order to establish a more useful precedent for collective bargaining at sector
and company levels (Eironline 2010).
Second, there are differences in the use of automatic indexation. Among the seven countries
with a statutory MW there is no automatic indexation in five countries. Even in the two
countries with indexation, Croatia and France, in neither case can uprating be described as a
scientific process; both sets of rules are in practice contingent upon, or supplemented by,
political intervention. In Croatia, a new Act in 2008 intended to establish a rather complex
automatic rule - that the MW would be uprated each year such that the percentage rise in the
Kaitz index for the current year (defined as the ratio of the minimum wage to average
Comparative Report 10
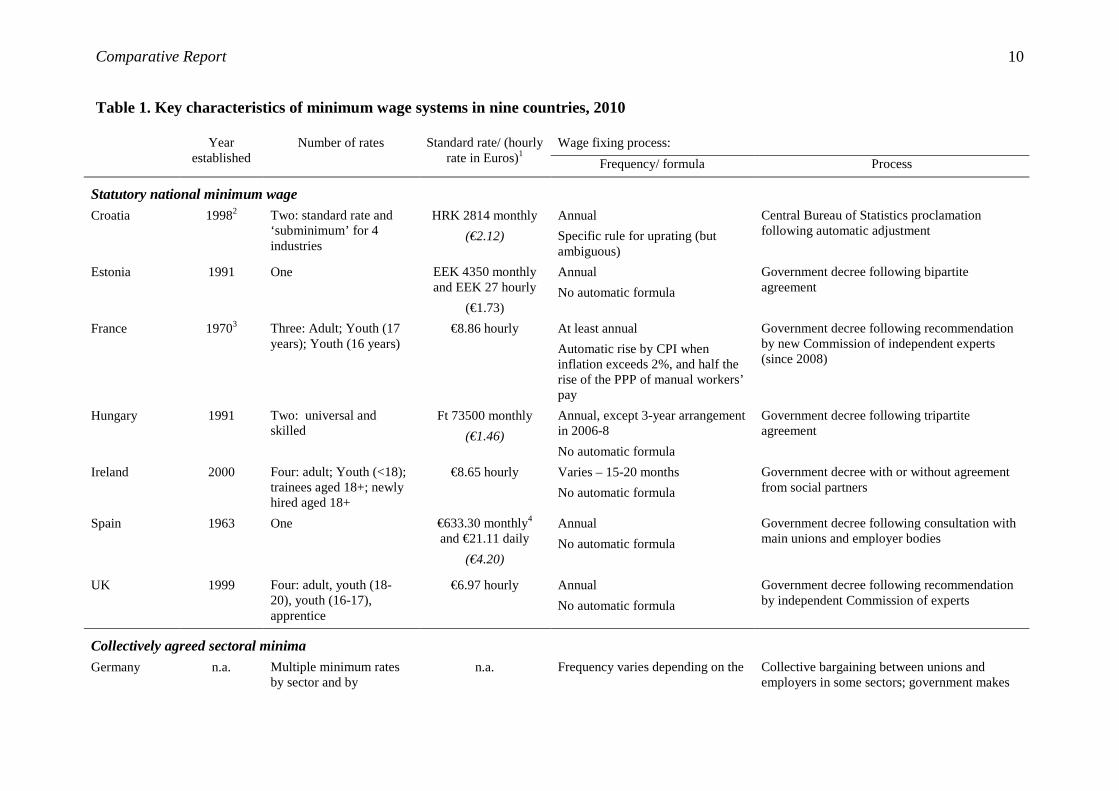
Table 1. Key characteristics of minimum wage systems in nine countries, 2010
Year established
Number of rates Standard rate/ (hourly rate in Euros)1
Wage fixing process:
Frequency/ formula Process
Statutory national minimum wage
Croatia 19982 Two: standard rate and ‘subminimum’ for 4 industries
HRK 2814 monthly
(€2.12)
Annual
Specific rule for uprating (but ambiguous)
Central Bureau of Statistics proclamation following automatic adjustment
Estonia 1991 One EEK 4350 monthly and EEK 27 hourly
(€1.73)
Annual
No automatic formula
Government decree following bipartite agreement
France 19703 Three: Adult; Youth (17 years); Youth (16 years)
€8.86 hourly At least annual
Automatic rise by CPI when inflation exceeds 2%, and half the rise of the PPP of manual workers’ pay
Government decree following recommendation by new Commission of independent experts (since 2008)
Hungary 1991 Two: universal and skilled
Ft 73500 monthly
(€1.46)
Annual, except 3-year arrangement in 2006-8
No automatic formula
Government decree following tripartite agreement
Ireland 2000 Four: adult; Youth (<18); trainees aged 18+; newly hired aged 18+
€8.65 hourly Varies – 15-20 months
No automatic formula
Government decree with or without agreement from social partners
Spain 1963 One €633.30 monthly4 and €21.11 daily
(€4.20)
Annual
No automatic formula
Government decree following consultation with main unions and employer bodies
UK 1999 Four: adult, youth (18-20), youth (16-17), apprentice
€6.97 hourly Annual
No automatic formula
Government decree following recommendation by independent Commission of experts
Collectively agreed sectoral minima
Germany n.a. Multiple minimum rates by sector and by
n.a. Frequency varies depending on the Collective bargaining between unions and employers in some sectors; government makes

Comparative Report 11
skill/region collective agreement
No formula
minimum rate binding in some sectors
Sweden n.a. Multiple minimum rates by sector and by age/experience/ occupation
n.a. Annual (usually as part of 2-3 year pay deals)
No formula
Collective bargaining between unions and employers
No legal extension to uncovered sectors
Notes: 1. 2010 gross value (Euro exchange rates applicable in July 2010). Italicised figures have been converted from the annual (Spain) or monthly (Hungary, Croatia)
rates to an hourly rate using European LFS data for average actual hours worked in the main job by full-time employees, second quarter 2009. 2. A form of minimum wage preceded the 1998 legislation known as the ‘guaranteed wage’ and was in operation during the socialist period and early transition
years. 3. The SMIC was preceded by a different minimum wage, the SMIG, ‘Salaire Minimum Interprofessionnel Garanti’ (see www.cerc.gouv.fr/rapports). 4. In Spain, the annual statutory minimum wage (€8866.20 in 2010) constitutes 14 monthly payments. Source: National reports for Croatia, Germany, Hungary, Spain and UK;.Gautié (2009) for France; Masso & Krillo (2009) for Estonia; Nolan (2009) for Ireland.

Comparative Report 12
earnings) matches the percentage rise in real GDP the previous year. Throughout 2009 and
2010, trade unions, employers and government arrived at different views as to what the
formula implied, in large part caused by differences of interpretation of the Kaitz index of
the current year. Also, when real GDP fell in 2009 there was debate over whether or not to
cut the MW; in the end it was frozen (Nestić and Bakarić 2010). In France, an automatic rule
links the MW both to the consumer price index (rises over 2%) and to at least half the annual
rise in purchasing power of manual workers’ average hourly pay. This automatic linkage to
prices and earnings growth is supplemented by a legally defined discretionary role of
government, known as the coup de pouce. During 1997-2005 the coup de pouce was
instrumental in boosting the MW, but has played no role at all during 2007-2010 (Gautié
20096; Eironline 2010).
The third issue is whether countries have institutionalised a process of social dialogue in
uprating the MW – with variation in government involvement and engagement with social
partners. Where, as in Germany and Sweden, there is no national statutory MW social
dialogue is likely to be important in the setting of minimum wages at the sector level. In
Germany only a few sectors have generally binding minimum wages but in all of these cases
the MW was first negotiated through a collective agreement and then extended to all firms in
the sector. The first sector to follow this path in Germany was construction. The collectively
agreed MW rates were established as generally binding in 1996 under the Law on Posting of
Workers. Following a political compromise agreed in 2005, other sectors followed suit
during 2007-2010. In July 2007 a MW in commercial cleaning was introduced and in 2009
industry-wide minimum wages were agreed in industrial laundries and mining specialists.
Further agreements were implemented in 2010 in the waste management sector and care
services (Bosch and Weinkopf 2010). In each case, MW rates are agreed by social partners
and the government declares them generally binding on the basis of the Law on Posting of
Workers.
In Sweden, minimum rates are set in all sectors through collective agreements. High
coverage of collective agreements – approximately 90% - ensures wide, national coverage of
sector-based minimum wages, even in low wage sectors (Skedinger 2009: 358-360). The
general stability of both country systems (notwithstanding the recent policy shifts in
Germany) is demonstrated by Visser’s (2009) scoring of the two countries in his
6 Plus more recent personal communication with Jerome Gautié.

Comparative Report 13
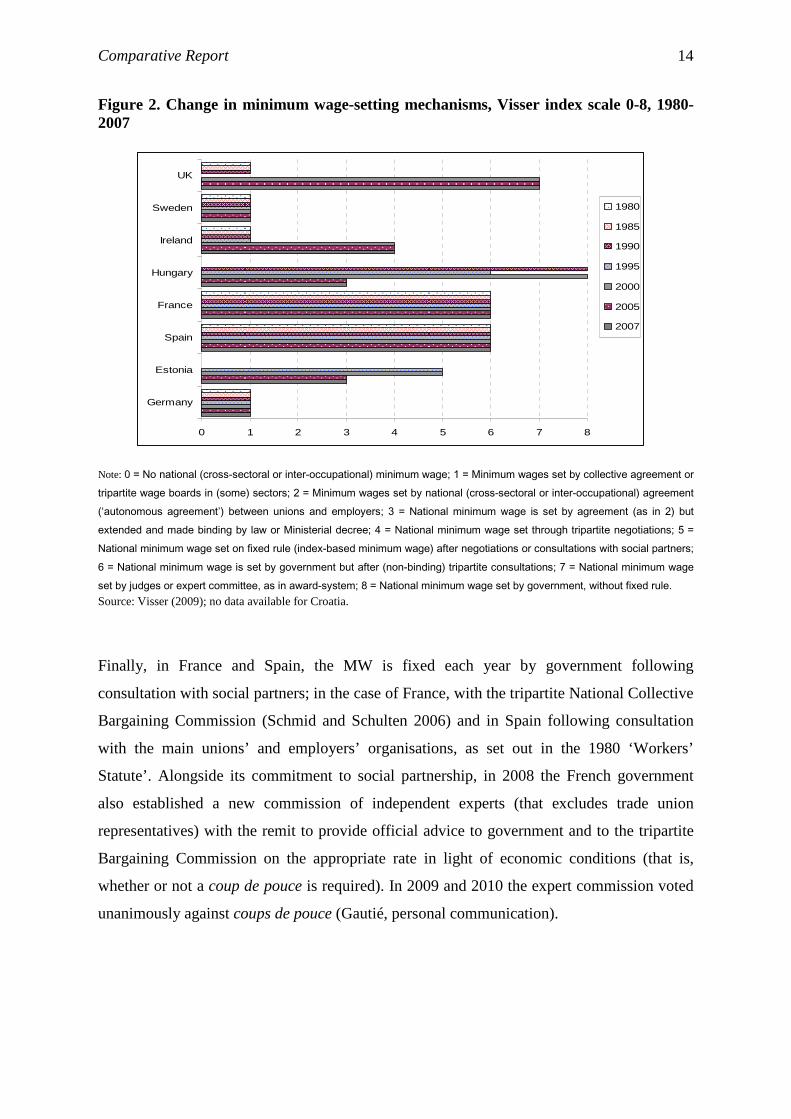
classification of minimum wage-setting mechanisms. Both Germany and Sweden score 1 on
a scale of 0-8 throughout the 1980-2007 period, defined as ‘minimum wages set by
collective agreement or tripartite wage board in some sectors’; see the note to figure 2 for a
full description of the different categories.
Croatia, Estonia and Hungary, like other former Communist countries, have had a variable
history of social dialogue around minimum wage setting, reflecting the significant changes
that have taken place in their minimum wage-setting rules (Kohl and Platzer 2007; Standing
and Vaughan-Whitehead 1995). In Estonia and Hungary the statutory MW was initially
introduced during the early transition as a successor to state wage-setting; it was used as an
instrument of containing wage growth (Kohl and Platzer 2007), although wage restraint
during this period was also strongly shaped by the economic conditions of recession and
high inflation. However in Estonia, a change in state engagement with social partners
occurred in 2001 with the signing of a bilateral agreement between the national employers’
federation and the larger of the two main trade union confederations (Kohl and Platzer
2006). In Hungary, tripartite negotiations underpinned the government decision on the
statutory MW during its first decade of life. There was a subsequent short period, 2000-
2002, when the government acted unilaterally, but since 2002 it has been set through
tripartite agreement (Neumann 2010). Croatia had a form of MW during its transition period
– known as the ‘guaranteed wage’ – but the statutory national MW in place today was
established later, in 1998, following the decision by a national collective agreement on low
wages (Nestić and Bakarić 2010).
Ireland and the UK both introduced a national statutory MW only very recently, but have
diverse rules concerning government engagement with social partners. In Visser’s (2009)
classification of MW systems (figure 2), Ireland scores 4 out of 8 and the UK 7.7 The
difference lies with the establishment of the Low Pay Commission in the UK - a permanent,
statutory, independent public body that advises the government on the basis of expert
opinion (unions, employers and academic an policy research) – and the reliance in Ireland on
either national agreement from unions and employers, or, when there is no agreement,
resolution through the Labour Court (Nolan 2009). In both countries, government reserves
the right to exercise discretion.
7 See the note to figure 2 for details of categories.
Comparative Report 14
Figure 2. Change in minimum wage-setting mechanisms, Visser index scale 0-8, 1980-2007
Note: 0 = No national (cross-sectoral or inter-occupational) minimum wage; 1 = Minimum wages set by collective agreement or tripartite wage boards in (some) sectors; 2 = Minimum wages set by national (cross-sectoral or inter-occupational) agreement (‘autonomous agreement’) between unions and employers; 3 = National minimum wage is set by agreement (as in 2) but extended and made binding by law or Ministerial decree; 4 = National minimum wage set through tripartite negotiations; 5 = National minimum wage set on fixed rule (index-based minimum wage) after negotiations or consultations with social partners; 6 = National minimum wage is set by government but after (non-binding) tripartite consultations; 7 = National minimum wage set by judges or expert committee, as in award-system; 8 = National minimum wage set by government, without fixed rule. Source: Visser (2009); no data available for Croatia.
Finally, in France and Spain, the MW is fixed each year by government following
consultation with social partners; in the case of France, with the tripartite National Collective
Bargaining Commission (Schmid and Schulten 2006) and in Spain following consultation
with the main unions’ and employers’ organisations, as set out in the 1980 ‘Workers’
Statute’. Alongside its commitment to social partnership, in 2008 the French government
also established a new commission of independent experts (that excludes trade union
representatives) with the remit to provide official advice to government and to the tripartite
Bargaining Commission on the appropriate rate in light of economic conditions (that is,
whether or not a coup de pouce is required). In 2009 and 2010 the expert commission voted
unanimously against coups de pouce (Gautié, personal communication).
0 1 2 3 4 5 6 7 8
Germany
Estonia
Spain
France
Hungary
Ireland
Sweden
UK
1980
1985
1990
1995
2000
2005
2007

Comparative Report 15
2. The changing value of the minimum wage
2.1. Country patterns
The Kaitz index provides a useful means of comparing the relative level of a country’s MW,
both over time and across countries. It is defined as the MW as a ratio of gross median
earnings. Both the OECD and Eurostat provide estimations of the Kaitz index for European
countries. Both datasets include estimations of the minimum as a ratio of median and mean
earnings. Because countries have varying differentials between their median and mean
earnings,8 we present both sets of ratios here. However, despite its wider European country
coverage, we do not present the Eurostat data because of doubts about its comparability
across countries. The OECD database estimates the Kaitz index for 18 EU member states
and uses gross earnings for full-time employees as the benchmark for median and mean
earnings. The Eurostat database covers all 20 member states with a statutory minimum wage
(it also includes Bulgaria and Malta) but unfortunately does not incorporate comparable
earnings data; for some countries part-time workers’ earnings are included and for others
excluded, while for several countries it is not clear which groups of workers are included in
the earnings estimation.9
According to figure 3, the three countries with a high MW – both as a ratio of median
earnings and mean earnings – are France, Belgium and Ireland. France stands significantly
above the second ranked country in both charts, with a MW estimated at 0.60 of median
earnings and 0.48 of mean earnings in 2009. Two countries register a high median wage as a
ratio of median earnings (Latvia and Portugal) but close to an average level MW as a ratio of
mean earnings. The reason is the large gap between median and mean earnings in these
countries; median earnings are only 74.8% of mean earnings in Latvia and just 69.3% of
mean earnings in Portugal (compared to 79.8% in France).
8 For example, median earnings are 79.8% of mean earnings in France but 87.8% of mean earnings in the Netherlands (OECD earnings database). 9 From the notes to the Eurostat (2009) publication the earnings estimates are for full-time employees only for Estonia, France and Hungary, but include full-time and part-time employees for Bulgaria, Czech Republic and Latvia. No information is provided for Ireland, Spain, Lithuania, Luxembourg, Malta, Poland, Romania, Slovakia and the UK.

Comparative Report 16
Figure 3. The value of the statutory minimum wage (Kaitz index), 2009 a. Minimum to median earnings
b. Minimum to average earnings
Notes: The estimation for the European average is a simple unweighted average for the 18 (19) countries included here. Average and median earnings refer to full-time employees only for all countries and generally include overtime and other supplementary pay. The OECD data for France refer to its hourly data and for the UK its Annual Survey of Hours and Earnings not the Labour Force Survey. Data for Croatia are not available on the OECD database and sourced separately. Source: OECD earnings database, kindly provided by Mark Keese. Data for Croatia from Nestić and Bakarić (2010).
0.25
0.30
0.35
0.40
0.45
0.50
0.55
0.60
Series1 0.360 0.413 0.430 0.441 0.442 0.449 0.453 0.454 0.461 0.472 0.478 0.482 0.490 0.508 0.511 0.519 0.537 0.601 0.472
CZ EE LU ES LT PO RO SK UK NL HU GR SI BE IE LV PT FR EU-18
0.25
0.30
0.35
0.40
0.45
0.50
0.55
0.60
Series1 0.300 0.317 0.327 0.344 0.348 0.349 0.353 0.355 0.362 0.362 0.366 0.372 0.381 0.388 0.413 0.415 0.433 0.441 0.480 0.374
CZ RO GR EE HU ES LU SK LT CR PO PT UK LV SI NL IE BE FR EU-19

Comparative Report 17
Countries with a consistently low value MW – again, both as a ratio of median and mean
earnings - are the Czech Republic, Romania, Estonia, Luxembourg and Spain. For all five
countries, the MW falls significantly below the average values for the 18 (19) countries
shown, 0.45 or less of median earnings and 0.35 or less of mean earnings, compared to total
country averages of 0.47 and 0.37, respectively. And again, two countries that rank very low
as a ratio of mean earnings (Greece and Hungary) fare better as a ratio of median earnings,
with a MW value marginally above the average.
Given their absence of a statutory MW, there is of course no Kaitz index for Sweden and
Germany. It is nevertheless possible to estimate the level of collectively agreed MW rates for
various sectors against average earnings for the economy. The data are not comparable with
those presented in figure 3. However, they do give an interesting impression of the
contrasting sectoral minima in these two countries.
The new binding collectively agreed minimum rates in the seven sectors shown in figure 4
include a lower rate for eastern Germany in five of the seven cases; a universal rate applies
in the painting and varnishing and the waste management sectors (table 2). Nevertheless the
Kaitz index for eastern Germany is higher at 57% to 83% compared to 49% to 69% of
average gross hourly earnings in western Germany. Thus although average earnings in
eastern Germany are significantly below those in western Germany (€11.50 compared to
€15.62), the rates are set at a comparatively higher level in eastern Germany. In both regions,
the lowest minimum rate is for the laundry sector, so this might therefore be taken as a proxy
for the minimum wage floor so far agreed for the two regions of the German labour market –
that is, 49% of average earnings in the west and 57% in the east. If we compare the
minimum rates set for the two regions instead to the average earnings for the whole of
Germany, the ratios are reversed (Table 2, third set of columns) with the sectoral minimum
wages set for western Germany ranging from 51% to 72% of average German earnings
while the minimum rates set for eastern Germany only account for 44% to 64% of average
German earnings. The MW values for laundries, the lowest paid sector, are 51% for western
Germany and only 44% for eastern Germany.

Comparative Report 18
Figure 4. Relative value of sector-based minimum wages in eastern and western Germany, 2010
Note: Estimated in relation to separate average earnings data for eastern and western Germany; see note to table 2. Source: Table 2. Table 2. Alternative estimations of the value of sector-based minimum wages in Germany, 20101
Note: 1. Hourly minimum rates are those agreed and implemented in 2010. We have used the most recently available average earnings data which are for 2008. Source: Bosch and Weinkopf (2010: table 1) and separate communication. For Sweden, we draw on data provided by Per Skedinger that updates work already
published (Skedinger 2009). Figure 5 presents the sector-based MW as a percentage of
average earnings for the economy in seven diverse sectors. It is unfortunately not possible to
draw a comparison with the results for German minimum wages since there is not a match of
sectors, except for construction. For Sweden, the lowest sectoral minimum is 49% of average
earnings (in local government) and the highest among the seven shown is 66% in the bakery
sector. The value of the MW floor in the construction sector in Sweden is 53%, lower than
the minimum in Germany for construction (see table 2).
0%
10%
20%
30%
40%
50%
60%
70%
80%
90%
Construction Electric trade Commercialcleaning
Laundries Painting &varnishing
Wastemanagement
Care services
West East
Relative to separate West Relative to average earningsHourly minimum rates (€) and East average earnings: for Germany:
West East West East West EastConstruction 10.8 9.25 69.2% 80.4% 72.4% 62.0%Electric trade 9.6 8.2 61.5% 71.3% 64.3% 54.9%Commercial cleaning 8.4 6.83 53.8% 59.4% 56.3% 45.8%Laundries 7.65 6.5 49.0% 56.5% 51.3% 43.5%Painting & varnishing 9.5 9.5 60.8% 82.6% 63.6% 63.6%Waste management 8.02 8.02 51.4% 69.7% 53.7% 53.7%Care services 8.5 7.5 54.4% 65.2% 56.9% 50.2%

Comparative Report 19
Figure 5. Relative value of sector-based minimum wages in Sweden, 2009
Note: Hourly minimum wage as a percentage of average total earnings for all employees. Source: Personal communication with Per Skedinger; see, also, Skedinger (2009).
2.2. Country trends
As documented in other studies, for many countries in Europe the decade preceding the
recession saw increases in the relative value of the MW (Vaughan-Whitehead 2009b),
marking a change from the 1990s when the general pattern was one of decline (Rubery et al.
2005). This change in fortunes can be demonstrated drawing on the OECD MW database
which covers 18 EU countries using average earnings for all full-time employees as the
harmonised reference wage (figure 6). Between 1991 and 2000, the Kaitz index (median
earnings) fell in 10 of the 12 countries included in the dataset, by more than ten percentage
points in Romania, the Czech Republic and Slovakia, and by 7 points for the 12-country
average. Then, from 2000 to 2009 falls were recorded in only 4 out of 18 countries and the
average unweighted Kaitz index for the 18 countries increased from 0.439 to 0.471. For the
restricted sample of 12 countries included in the dataset in 1991, the average Kaitz index
(median earnings) fell from 0.506 to 0.431 during the 1990s and then recovered, albeit
partially, to 0.472 by 2009. The Kaitz index measure using mean earnings (figure 6b) shows
a similar reversal of trends, with again only France and Luxembourg experiencing a rising
MW value in the 1990s and the majority of countries experiencing a rising MW in the 2000s.
The 2008-2009 recession does not appear to have upset overall trends. For all 18 countries,
the value of the MW relative to median earnings increased from 0.450 to 0.472 from 2007 to
2009. However, there is evidence of more mixed effects across countries with five
0%
10%
20%
30%
40%
50%
60%
70%
80%
90%
Engineering Bakery Slaughter-house
Construction Retail Hotels &restaurants
LocalGovernment

Comparative Report 20
registering a fall in their MW, ten a rise and three marginal change (less than half a
percentage point).
Figure 6. Trends in the value of the minimum wage (Kaitz index), 1991-2000-2009
a. Minimum to median earnings
b. Minimum to mean earnings
Note: The Kaitz index is estimated as the minimum wage as a percentage of median (chart a) and average (chart b) gross earnings for full-time employees. Source: OECD earnings database kindly provided by Mark Keese. Data for Croatia from Nestić and Bakarić (2010).
0.20
0.25
0.30
0.35
0.40
0.45
0.50
0.55
0.60
0.65
0.70
CZ EE LU ES LT PO RO SK UK NL HU GR SI BE IE LV PT FR EU-AVG
JA US
1991 2000 2009
0.20
0.25
0.30
0.35
0.40
0.45
0.50
0.55
0.60
0.65
0.70
CZ RO GR EE HU ES LU SK CR LT PO PT UK LV SI NL IE BE FR EU-AVG
US JA
1991 2000 2009

Comparative Report 21
As well as an overall upward trend, there is some evidence of convergence during the last
decade around the mean Kaitz indices of 0.471 (median earnings) and 0.374 (mean earnings)
for 2009. The standard deviation among the 17 European countries for which we have both
2000 and 2009 data has certainly reduced, from 0.094 to 0.053 (median earnings definition).
Part of the difference can be explained by the changing values of two outlier countries in
2000 – Ireland and Romania (see figure 6a); if we exclude these countries from our
estimates, we still find a significant fall in variation, from 0.068 to 0.055. There are
nevertheless countries that do not fit the pattern of convergence. In France the already high
value MW has continued to rise, in Spain a low MW failed to rise more than the average
percentage point rise and the MW in Lithuania a low value MW fell.
Japan and the US provide examples of opposing trends throughout the 1991-2009 period
with Japan consistently increasing its MW relative to median and mean earnings, albeit from
a very low value, and the US experiencing a fluctuating trend relative to median earnings
and a persistent drop in value relative to mean earnings. In 2009 the US ranks bottom among
the 20 OECD countries included in the dataset relative to mean earnings with a MW to mean
earnings ratio of just 0.270.
Alternative data provided by Eurostat confirm the positive general trend in the Kaitz index.
In Vaughan-Whitehead’s (2009b) assessment, a combination of Eurostat and national data
sources suggest that 10 out of 22 EU countries witnessed a rise in the Kaitz index of one
percentage point or more from the late 1990s to 2007 period, compared to 7 countries with a
decline of one point or more (op. cit.: figure 1.4).
An estimation of trends using separately collected national earnings data for the seven
countries with a statutory MW selected for this report provides complementary evidence for
the 2000-2009 period. Figure 7 presents the national earnings data with the value of the
minimum wage presented in relation to average gross earnings. Data trends are comparable
to the OECD data for five countries (Estonia, Hungary, Spain, France, UK), quite different
for Ireland, and they provide additional data for Croatia that are absent in the OECD
database. Our intention here is to assess the trends in more detail in light of the changing
context of minimum wage policy developments and economic and labour market conditions.
A first finding is that the upward trend in the value of the MW in five of the seven countries
is the clear result of an explicit policy objective; these changes can not be interpreted as

Comparative Report 22
unintended outcomes of some sort or other or even as an indirect result of other policies
(although France is an exception in this respect). Indeed, although in some cases the policy
change was driven by government, in most cases the change was brought about through
agreements among social partners and ratification by government. The periods during which
we can identify explicit efforts to uprate the relative level of the MW are associated with the
main increases shown in figure 7. The improvements in the Kaitz index and particular
periods of policy intervention for each country are as follows:
• Spain - 3 percentage points during 2004-8;
• UK - 4 points during 2003-7;
• Croatia - 4 points during 2007-9;
• Estonia - 5 points during 2001-8; and
• Hungary - 12 points during 2000-2.
Hungary is the clearest example of a unilateral government decision to increase the MW in a
bid to strengthen its relevance in the labour market (Neumann 2010: 6). Following a steady
decline during the 1990s from around 36% to 29% of average gross earnings (national data,
1992-2000), the then centre-right government took the unprecedented decision to increase
the MW from HUF25,500 to HUF40,000 in January 2001. The Kaitz index increased by ten
percentage points, with a further raise in 2002 bringing the MW to 41% of average earnings
(figure 7). The Spanish case is similarly rooted in government policy; this time a newly
elected centre-left government had the objective to improve conditions for low wage
workers. The goal set in 2004 was to raise the MW to 60% of average earnings over an
undefined medium term.10 Over a four-year period, the government raised the MW each year
by an amount significantly above inflation (starting with an increase of 11.4% in 2005 when
inflation was at 3.4%). However, the Kaitz index did not increase as much as anticipated
(from 33.6% to 36.5%), largely because this was a period of rapid growth in the economy
and rising real average earnings.
Croatia, Estonia and the UK provide examples where the active policy intervention arose out
of combinations of trade union campaigns, social dialogue and government support. In
Croatia, tripartite discussions gave rise to a new Act in 2008 that substantially improved the
relative level of the minimum wage – a nominal rise of 19.5% (12.5% in real terms),
10 The 60% target was ostensibly selected in line with the European decency threshold which is defined in the Social Charter. However since 1994 this threshold has referred to net earnings and is as such difficult to estimate.

Comparative Report 23
compared to a 1% rise in real average earnings in the Croatian economy, bringing the Kaitz
index up to 36.2% in 2009, from 32.6% in 2007. In Estonia, a period of rising real earnings
led employers and unions in 2001 to agree to raise the MW to 41% of the national average
wage by 2008 (a substantial hike from its 2000 level of 28.5%).11 This setting of an actual
target for the Kaitz index to guide policy (Masso and Krillo 2009) was in part motivated by
an objective of aligning the MW with the average EU level. Although a significant upward
trajectory was established during 2001-4, the target was not reached (only 34% by 2008) in
part because 2005 and 2006 witnessed higher than expected increases in average earnings
caused by favourable economic conditions and labour scarcity (op. cit.: 119). The UK
scenario is similar. The independent Low Pay Commission changed its approach in 2003 and
for four years recommended rises in the MW that were purposefully designed to improve its
level relative to average earnings. No target was set, but through this approach the Kaitz
index rose four points from 35.7% to 39.8% during 2003-7. There is no evidence, however,
that LPC members believed that the UK ought to be able to pay a MW at a level closer to the
EU average. However, the LPC did publish its view that a series of increases were consistent
with its aim ‘to have a minimum wage that helps as many low paid people as possible
without any adverse impact on the economy’ and that the alternative approach of
recommending a series of rises in line with inflation would instead ‘lead to a steady
withering of the minimum wage’ (LPC 2003: 173).
France and especially Ireland do not fit this pattern of explicit and transparent policy
intervention. The increases in the MW in France registered up to 2006 were in part a result
of government coups de pouce (under both left-wing and right-wing governments during
1997-2005), which might be described as reflective of a government desire to use the MW to
boost conditions of low wage workers. However, unlike the five countries reviewed above,
the coups de pouce were not guided by a strategic approach towards the MW uprating nor
were they responsive to a negotiated agreement among social partners. Moreover, an
alternative assessment of the earnings data suggests that it was in fact the reduction in
working time following the Aubry laws I and II (and not the coups de pouce) that generated,
indirectly, most of the rise in the Kaitz index during the first half of the 2000s (Gautié 2009:
153, 176). The case of unintended outcomes is even more pronounced in Ireland. The
fluctuating trend in figure 7 is partly a result of the uneven frequency of upratings. For 12 A controversial decision since the Treaty on the Function of the European Union states that the legal competence of the EU does not extend to the field of labour law with regard to pay and labour relations (Alber 2010).
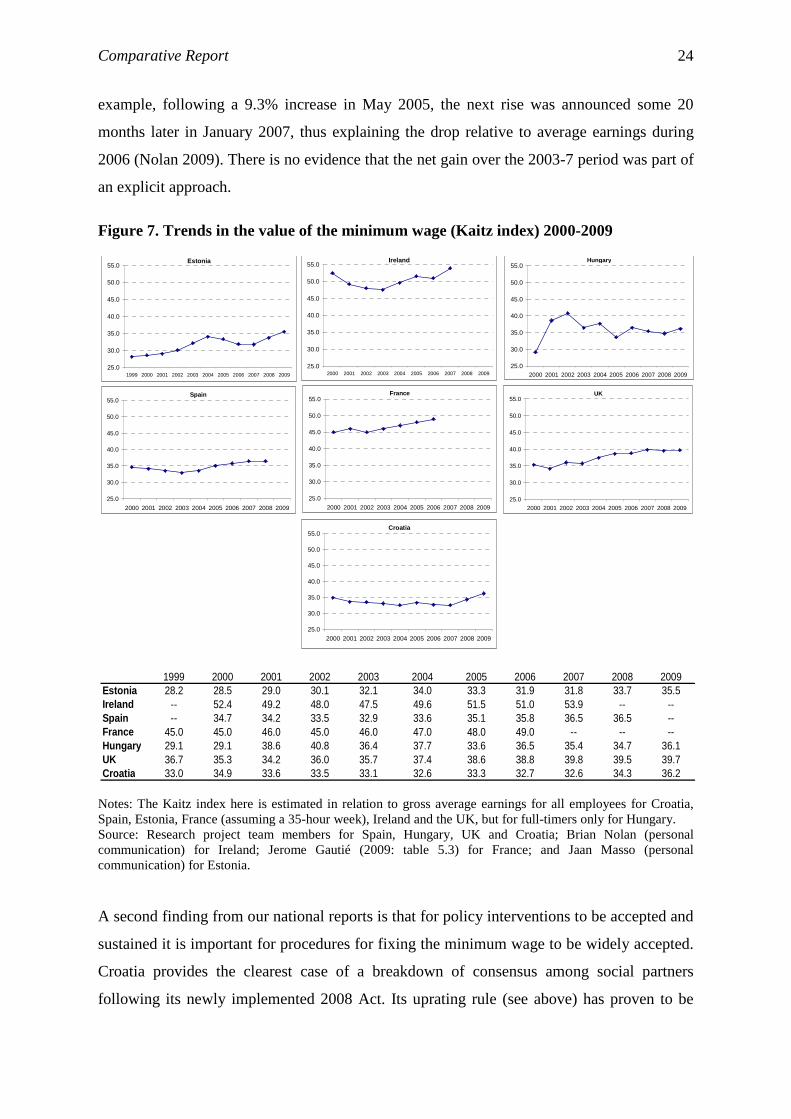
Comparative Report 24
example, following a 9.3% increase in May 2005, the next rise was announced some 20
months later in January 2007, thus explaining the drop relative to average earnings during
2006 (Nolan 2009). There is no evidence that the net gain over the 2003-7 period was part of
an explicit approach.
Figure 7. Trends in the value of the minimum wage (Kaitz index) 2000-2009
Notes: The Kaitz index here is estimated in relation to gross average earnings for all employees for Croatia, Spain, Estonia, France (assuming a 35-hour week), Ireland and the UK, but for full-timers only for Hungary. Source: Research project team members for Spain, Hungary, UK and Croatia; Brian Nolan (personal communication) for Ireland; Jerome Gautié (2009: table 5.3) for France; and Jaan Masso (personal communication) for Estonia.
A second finding from our national reports is that for policy interventions to be accepted and
sustained it is important for procedures for fixing the minimum wage to be widely accepted.
Croatia provides the clearest case of a breakdown of consensus among social partners
following its newly implemented 2008 Act. Its uprating rule (see above) has proven to be
Estonia
25.0
30.0
35.0
40.0
45.0
50.0
55.0
1999 2000 2001 2002 2003 2004 2005 2006 2007 2008 2009
Spain
25.0
30.0
35.0
40.0
45.0
50.0
55.0
2000 2001 2002 2003 2004 2005 2006 2007 2008 2009
France
25.0
30.0
35.0
40.0
45.0
50.0
55.0
2000 2001 2002 2003 2004 2005 2006 2007 2008 2009
Hungary
25.0
30.0
35.0
40.0
45.0
50.0
55.0
2000 2001 2002 2003 2004 2005 2006 2007 2008 2009
UK
25.0
30.0
35.0
40.0
45.0
50.0
55.0
2000 2001 2002 2003 2004 2005 2006 2007 2008 2009
Croatia
25.0
30.0
35.0
40.0
45.0
50.0
55.0
2000 2001 2002 2003 2004 2005 2006 2007 2008 2009
Ireland
25.0
30.0
35.0
40.0
45.0
50.0
55.0
2000 2001 2002 2003 2004 2005 2006 2007 2008 2009
1999 2000 2001 2002 2003 2004 2005 2006 2007 2008 2009Estonia 28.2 28.5 29.0 30.1 32.1 34.0 33.3 31.9 31.8 33.7 35.5Ireland -- 52.4 49.2 48.0 47.5 49.6 51.5 51.0 53.9 -- --Spain -- 34.7 34.2 33.5 32.9 33.6 35.1 35.8 36.5 36.5 --France 45.0 45.0 46.0 45.0 46.0 47.0 48.0 49.0 -- -- --Hungary 29.1 29.1 38.6 40.8 36.4 37.7 33.6 36.5 35.4 34.7 36.1UK 36.7 35.3 34.2 36.0 35.7 37.4 38.6 38.8 39.8 39.5 39.7Croatia 33.0 34.9 33.6 33.5 33.1 32.6 33.3 32.7 32.6 34.3 36.2

Comparative Report 25
ambiguous and open to multiple interpretations; social partners have sought legal advice on
the issue and the government established a special working group. In France, increasing
conflict among government, unions and employers about the appropriateness of the
discretionary government interventions led to the setting up of a new independent
commission which since 2009 reviews each year the effectiveness of the index links and the
need for a coup de pouce. However, disagreement persists about the role of the minimum
wage as a tool of active incomes policy or simply as a floor to the wage structure (Gautié
2009: 176). By contrast, the UK appears to have a relatively strong set of foundations for its
approach to MW policy intervention. One ex-member (and academic) makes the case that
the institutional arrangement for setting the MW (the Low Pay Commission) is both
reflective and constitutive of a new industrial relations settlement, characterised by more
confident unions and more pragmatic employers – the ingredients for a consensus approach
(Brown 2000, 2009). However, the response to the recession has revealed the fault-lines to
this new consensus; 2008 saw recommendations for a MW freeze from employers and strong
appeals from unions to ignore such requests (Grimshaw 2010: 11-12).

Comparative Report 26
3. Minimum wages and collective bargaining:
complementarities and tensions
The setting of a statutory MW is one of a number of instruments of public policy at the
disposal of governments - along with maximum working hours and minimum paid holidays,
for example - to set basic legal standards in the labour market. As the ongoing debate in
Germany demonstrates, however, such standard setting is not always supported by social
partners who may perceive the government to be stepping outside its boundaries of public
policy into areas of regulatory responsibility controlled by unions and employers (see, also,
Hassel 2006: ch3). Nor is a statutory wage floor always supported by government. For some
political parties government intervention in wage-setting is seen as impeding the private
activities and decisions in the labour market by individual and collective bodies. This
position was deployed to great effect in the UK during the 1980s and early 1990s and
resulted in the abolition of wages councils that set sector-specific minimum wages. These
arguments also accounted for the low rates of minimum wages set in the transition
economies in Europe in the early 1990s. However it is important not to focus only on
debates for and against government regulation in explaining MW developments;
developments in Germany and in other European countries demonstrate that the wider
country system of industrial relations matters enormously in understanding the role and
effectiveness of MW policy. In this section of the report we draw on our data for nine
European countries to elaborate on the possible tensions and complementarities between
MW policy and the country model of industrial relations. We explore two issues:
• the approach of government, unions and employers to the MW; and
• the interaction between the MW and the strength of collective bargaining coverage.
3.1. Government, social partners and the minimum wage
While a majority of countries in Europe have established a statutory MW, the
operationalisation of the policy is likely to be a continuing source of conflict and tension.
Indeed across Europe the continuing change in the direction of MW policy and the regular
debates and conflicts over the appropriate uprating of the minimum demonstrate the raft of

Comparative Report 27
tensions among the interests of government, unions and employers and their approaches to
the MW. Table 2 sets out the main tensions and complementarities for each of the three
social actors.
One source of such tensions is the perceived potential conflicts between a statutory MW and
other objectives of government policy: for example, there may be a fear that it will price
low-skilled workers out of the labour market and lead to firms closing where low levels of
productivity are not aligned with a higher wage floor. However the perception of such risks
may have decreased after the early 1990s work in the US (eg. Card and Krueger 1995) and
the UK (Machin and Manning 1994) that appeared to refute the longstanding expectation
among economists that a MW necessarily causes significant negative employment effects. A
second major risk that governments may perceive is that of inflation caused by a rising MW
coupled with large spillover effects, or ripple effects, further up the wage structure. The size
of this risk depends, however, on the level of the MW and its interaction with the country
model of wage-setting. Freeman (1996: 645) argues that in countries with a MW at a low-to-
medium level and a pattern of weak collective bargaining ‘it is difficult to see how a
minimum could set off general wage inflation’. Alongside these potential tensions there are
several possible areas where complementarity between minimum wages and government
policy goals can be identified. Where a government seeks a more equal society, with a
narrower gap between the rich and poor, a MW can contribute by raising the wage floor
(Heymann and Earle 2010). A MW also establishes a transparent floor to wage competition
among firms and reduces (or prevents, depending on the level) the risk of workers living
below subsistence income levels. The fewer the number of workers living below subsistence,
the less pressure on government to top up household income through means-tested benefit
payments, such as in-work tax credits for example (Freeman 1996: 644-5, Sachdev and
Wilkinson 1998). A higher MW can also contribute to ‘making work pay’ and reducing
incentives to remain on unemployment benefits.
The principle of a statutory MW can also be said to both complement and conflict with trade
unions’ general approaches to wage bargaining. On the one hand it potentially dovetails with
union strategies to compress the wage structure among members (Turner 1952) and chimes
with both the Webbs’ notion of a common rule to wages and US unions’ strategy of ‘wage
standardisation’ (Metcalfe et al. 2001). It may also fit with a union’s strategic approach to
wage equality. For example, unions may seek to boost low pay by negotiating ‘bottom-

Comparative Report 28
loaded wage agreements’ that truncate the wage structure (Heery 2000: 59), or may
campaign for ‘living wages’ defined at a level above the statutory wage floor (Erickson et al.
2002). MW policy also complements union efforts to improve gender pay equity through
gender equality bargaining (Dickens 2000), especially in light of women’s over-
representation among the lowest paid (Rubery et al. 2005). On the other hand, MW policy
may also conflict with trade unions’ approach to wage bargaining if it is perceived to
undermine collective bargaining and to inhibit its spread among unorganised workers. A
statutory wage floor pitched too low may generate concerns among unions that it could pull
down higher minimum rates negotiated in collective agreements. And where workers
perceive a national MW is effective in providing protection it may act as a disincentive
among those in low wage jobs to join a trade union.
Table 2. Minimum wage policy and the interests of government, unions and employers Potential tensions Potential complementarities Government - fear of job loss and the pricing out of
long-term unemployed - risk of inducing wage-led inflation - increases labour costs in public sector - not the best instrument to tackle poverty - not the best instrument to raise productivity
- fits with goal of income redistribution - prevents bidding down of labour costs below subsistence level and reduces risk (and costs to government) of working poverty - can be used as part of a policy of wage restraint to guide inflation - raises tax revenue (more income tax and lower in-work benefits) and reduces risk of poverty traps by decreasing reliance on means-tested benefits - encourages low productivity firms to improve standards - chimes with gender equality objectives - makes work pay
Unions - undermines voluntarist model of collective bargaining of wages - reduces incentive among low paid to join a union
- fits with a ‘common rule’ approach to wage-setting - ‘bottom-loaded’ wage agreements and living wage campaigns can build on the statutory wage floor - complements a gender equality approach
Employers - Tends to truncate the wage structure, so that wages do not reflect productivity differences - reduces competitiveness in tradeable sectors - unable to pass on wage increases in prices to customers/clients - unable to raise worker performance/productivity in line with pay - risk of firm closing
- limits free-riding by informal, ‘cowboy’ competitor firms - sets a realistic benchmark in the labour market to attract suitable recruits - improves workers’ perceptions of fairness and contributes to better performance - provides a catalyst for skill development

Comparative Report 29
Finally, while employers are often assumed to be resistant to MW legislation the opposite
may also be the case. The bulk of employers may in fact welcome a properly enforced
system of minimum standards that makes it difficult for low cost firms to compete on the
basis of very low wages and/or informal payment methods. Also, in line with studies of
experimental labour markets (Falk et al. 2005), they may anticipate that a MW should
improve norms of fairness among workers, raising their commitment and contribution to
firm performance. And employers may also perceive a MW as a necessary component in
their ‘quality enhancing’ approach to work organisation with investment in training and
higher pay the ingredients for lower staff turnover and high productivity (McLaughlin 2010).
But several conflicts with employer interests may still be present. Employers may be
unwilling to accept any constraints on a voluntarist or market-led process of wage-setting
which in their view enable them to match pay with individual productivity. Employers may
also worry that it introduces pressures outside their control to pass on price rises to their base
of customers. Many low-wage sectors are characterised by intense cost competition. Where
this involves international competition, dependence on powerful customer firms or
competition with firms operating illegally, employers may experience real difficulties
passing on the costs (Grimshaw and Carroll 2006).
Evidence from five countries
The five country reports reveal contrasting approaches to MW policy among government,
trade unions and employers (table 3). In the four countries with an already established
statutory MW, governments espouse a generally supportive approach albeit for different
reasons. Perhaps the most active policy support and guidance from government is apparent
in Spain where a newly elected social democratic government in 2004 has sought to use the
MW as an instrument to improve low incomes and strengthen social cohesion. The Spanish
government has argued for a medium-term rise in the MW up to a level of 60% of average
earnings, which would make it by far the highest MW in Europe. In Hungary and Croatia, it
is widely assumed that employers in the grey economy pay workers a MW topped up by an
‘envelope payment’ in order to minimise tax payments. These inter-relationships with the
practice of informal, ‘envelope’ payments therefore figure quite significantly in each
government’s assessment of the statutory MW. In this context a rise in the MW may be an
effective way to increase tax receipts. In both countries, the government has to balance this
incentive to use minimum wages to raise taxes with the disincentives that stem from the fact
that a higher MW also implies higher welfare payments; in Croatia the MW is linked to

Comparative Report 30
unemployment benefits and in Hungary to unemployment benefits, sickness benefits and
others. The only government in our sample of five countries explicitly opposed to a statutory
minimum is in Germany. It argues that a MW would drive out jobs, that it is not an
appropriate activity for public policy and that wage-setting ought to be governed by the
private actions of private employers and unions.
Table 3. The outlook of unions, employers and government towards minimum wage policy Trade unions Employers Government
Statutory national minimum wage
Croatia Progressive: -Favour steady uprating of MW relative to average earnings -Largest union association (UATUC) opposes sectoral differentiation but favours skill differentiation
Conservative: -Do not favour raising the Kaitz index measure -Wish to use MW as bottom rate in collective agreements
Cautious: -Seeks to balance union and employer views -Focus on net impact of MW policy on government tax and spending (informal/ envelope payments; links with unemployment benefits)
Hungary Progressive: -Emphasise the social policy meaning of the MW (link to subsistence level) -Bargained successfully for skilled worker MW -Oppose automatic uprating mechanism -Campaign for a higher MW (up to 60% of average wage)
Conservative: -Emphasise competitiveness and adverse job effects -Oppose multiple MW rates by skill -Oppose automatic uprating mechanism
Constructive: -Uses the MW to reduce informal economy, make work pay and increase income tax revenues -3-year deal good for stability
Spain Supportive: -Favour the delinking from welfare payments -Limited attention to MW due to its low level
Conservative: -Oppose high MW increases proposed by government -Limited attention to MW due to its low level
Progressive: -Uses the MW to improve the spending power of low wage workers and enhance social cohesion -Goal of 60% Kaitz index
UK Progressive: -Recognise importance of MW in context of weak role of unions in wage-setting -Most unions campaign for increase in relative level of MW -Some unions work to build on MW in collective agreements
Pragmatic: -Support the principle but increasingly emphasise the cost pressures on firms -Active in consultative/partnership process of Low Pay Commission
Supportive: -Supports independent role of Low Pay Commission and generally accepts recommended rates
Collectively agreed sectoral minima
Germany Supportive: -Service sector unions especially supportive of a new statutory MW
Supportive: -Many employers support new binding minimum wages in several sectors - Predominantly unsupportive towards a new
Cautious: - Pragmatic support for binding sector minima - Argue a new national statutory MW would drive out jobs

Comparative Report 31
national statutory MW Source: Five national reports: Banyuls et al. (2010), Bosch and Weinkopf (2010), Grimshaw et al. (2010), Nestić and Bakarić (2010) and Neumann (2010).
Unions are supportive in all five countries and can be said to offer progressive, or strongly
interventionist, support in three countries – Croatia, Hungary and the UK. Union support in
Germany is a relatively recent phenomenon, with a public joint demand for a statutory MW
by the German Trade Union Confederation only voiced in 2006, following longer-running
campaigns by the service sector unions. A similar delay in support for a national MW
occurred among British unions as it became clear in the 1970s and 1980s that falling
collective bargaining coverage did not provide appropriate protection for workers in low
wage sectors (Blackburn 1988). Today unions in the UK are strongly supportive of the
statutory MW and most campaign for a significant increase in its level, particularly the
unions Unison (the largest public services union) and the Public and Commercial Services
union, the fifth largest union in the UK. Trade unions in Hungary, although facing shrinking
bargaining power, have been active in shaping MW policy, most notably with their
successful lobbying for the introduction of an additional statutory minimum for skilled
workers in 2006, pitched at around 20% higher than the standard MW.
Employers are not explicitly opposed to a statutory MW in Croatia, Hungary, Spain and the
UK and instead lobby in a conservative, or pragmatic, style for changes in policy to fit with
an emphasis on cost-based competitiveness and an approach that keeps the MW as a wage
floor rather than a redistributive tool. Only in Germany are most employer associations
openly opposed to a legally enforced country-wide MW, arguing that it would make
Germany’s labour costs internationally uncompetitive. Nevertheless, employers in Germany
have supported the binding coverage of minimum wages in several sectors. The caution
exercised by employers and government in Germany contrasts with their counterparts in the
relatively liberal market environment of the UK which, according to one former member of
the Low Pay Commission and industrial relations expert, adopted a pragmatic approach to
social partnership with unions in light of the newly introduced MW (Brown 2009); on many
issues of MW policy development, Brown argues that it would be difficult for an outside
observer to identify the allegiance of a member of the Low Pay Commission to the union or
employer side. There are interesting exceptions in Germany, such as the employer body for
the cleaning sector (Bundesinnungsverband des Gebäudereiniger-Handwerks, BIV), which

Comparative Report 32
not only supports a binding collectively agreed MW for the sector but also lobbies for a
statutory national MW on the basis of equality and fairness so as to prevent social dumping
across sectors (Bosch and Weinkopf 2010):
While employers in the cleaning sector are obliged to pay minimum wages that are
above usual pay rates in several other industries, other companies around the corner
in sectors without minimum standards can pay [cleaners] much lower wages. This is
not fair and even endangers the acceptance of and compliance with the minimum
wages in the cleaning sector (BIV representative cited in Bosch and Weinkopf 2010:
30).
3.2. Interaction between the minimum wage and collective bargaining
Previous comparative studies make two general observations about the inter-relationship
between a statutory MW and the model of collective bargaining (EC 2008: chapter 3,
Schulten 2006, Vaughan-Whitehead 2009a). First, countries with strongly coordinated
collective bargaining and high levels of coverage tend not to have a statutory MW. The
group of European countries without a statutory MW includes Austria, Denmark, Germany,
Finland, Italy, Cyprus and Sweden. Austria implemented a new MW in 2009 (a gross
monthly wage of €1,000 or €14,000 per year accounting for the 14 monthly payments) as
part of a national, cross-sectoral agreement negotiated by social partners. It is not a statutory
requirement and this has raised questions regarding lack of coverage of workers in sectors
and regions where social partners have not concluded a collective agreement (Hofbauer and
Adam 2009). Also, while collective bargaining coverage in five of the six countries shown in
figure 8 is at least 80%, this is not true of Germany, thus largely explaining why the issue of
a statutory MW has now risen to the top of the industrial relations agenda. For the others,
strong collective bargaining has traditionally provided a functional equivalent to statutory
MW protection, ensuring the lowest paid receive adequate protection (Schulten 2006: 12).
However, as other studies show (Bosch and Kalina 2009, Bosch and Weinkopf 2010,
Skedinger 2009, Woolfson and Sommers 2006, Woolfson et al. 2010), a trend towards
liberalisation of the European services industry coupled with increased labour migration
present challenges to this model of collectively bargained protection for the lowest paid. In
2007 the European Court of Justice ruled that a Latvian construction firm (Laval un Partneri)
could not be forced to enter into collective negotiations with a Swedish union on rates of pay

Comparative Report 33
for its posted workers. Moreover, in a controversial legal decision, the strike was ruled
illegal because it was said to have precluded the company’s freedom to provide services with
its posted employees.12 The decision affirmed the criteria of the Posted Workers Directive
which requires firms from other member state countries to comply with a national MW set
through legislation. As with the rulings in the Viking and Rőffert cases, a minimum rate
established through collective bargaining that is not extended nationally is not considered as
a minimum rate of pay by the ECJ, thus leading to the claim that the Court’s rulings are not
neutral concerning the different institutions of member states but are biased against
collective agreements (Alber 2010: 28). In a context of increasing numbers of posted
workers, these rulings pose a serious dilemma for labour relations and wage bargaining in
those countries without either a statutory MW or extended collective agreements.
Figure 8. Collective bargaining coverage in countries with and without a statutory minimum wage, 2006 (EU-27 plus Croatia)
Note: Data for Romania missing. 2006 data except Greece and Hungary (2005). Source: ICTWSS (Visser 2009); except Croatia (Nestić and Bakarić 2010) and Ireland (eironline 2007); see appendix table A1.
A second general observation about the relationship between minimum wages and collective
bargaining is that among countries with a statutory MW, the stronger the collective
12 A controversial decision since the Treaty on the Function of the European Union states that the legal competence of the EU does not extend to the field of labour law with regard to pay and labour relations (Alber 2010).
0
10
20
30
40
50
60
70
80
90
100
DE
CY
DK FI
SE IT AT
Ave
rage LT LV EE
BG
UK
HU
PO
SK
CZ IE
MA LU CR PT
ES NL
GR
FR
BE SI
Ave
rage

Comparative Report 34
bargaining the higher the relative value of the MW (see figure 9). The two institutions thus
appear to be complementary. The estimated correlation between the two variables shown in
figure 9 is moderately positive (0.457). Countries classified as having either an ‘inclusive’ or
‘dual’ model of industrial relations (following the definitions set out in Gallie 2007; see,
also, Visser and Checchi 2009) tend to be in the upper right-hand corner of the graph with
above-average collective bargaining and an above-average value of the MW. Other countries
classified as having an exclusive industrial relations model are more likely to be located in
the bottom left-hand corner of the graph. There are exceptions to this pattern. In particular,
both Spain and Greece have relatively high levels of collective bargaining coverage but
sustain a relatively low value of their statutory MW.
Figure 9. The value of a statutory minimum wage and the level of collective bargaining coverage
Note: Correlation between the variables of 0.457; Countries are colour coded to fit type of collective bargaining: blue diamond = exclusive; green
square is dual; and white triangle is inclusive; Collective bargaining data refer to 2006, except 2007 for Ireland and 2005 for Greece and Hungary.
Minimum wage data refer to 2009. Source: OECD minimum wage database for ratio of minimum wage to mean earnings; Collective bargaining
data from ICTWSS (Visser 2010) except Ireland collective bargaining data from eiro.online.
LT
HU
BE
CZ
EE
GR
ES
FR
SK
IE
LU
LV
NL
POPT
SI
UK
28
30
32
34
36
38
40
42
44
46
48
0 10 20 30 40 50 60 70 80 90 100Collective bargaining coverage
Rat
io o
f min
imum
wag
e to
mea
n ea
rnin
gs

Comparative Report 35
One reason for the positive relationship is that strong collective bargaining coverage is
associated with a more compressed wage distribution, which in principle raises the relative
level of low wages. This compression in bargained rates is likely to have an upwards effect
on the setting of the MW level as well (EC 2008: 83). It is also possible that social partners
are in a stronger position to argue for a higher national MW – either because this suits their
pay equity strategy or, as the EC (2008) study argues, because it avoids low wage
competition which might damage centralised wage agreements.13
However, there is also a dynamic feature to these cross-national patterns, which may alter
the positioning of countries. This concerns a third less well-known observation that the value
of the MW has tended to increase more in those countries with weak collective bargaining
(figure 10).
Figure 10. Change in minimum wage value (2000-9) and strength of collective bargaining coverage (averaged over 1995-2006)
Note: Correlation between variables of -0.648; The level of collective bargaining coverage is averaged over the period 1995-2006, except Croatia
which refers to an estimate for 2010 (Nestić and Bakarić 2010); The change in the minimum wage level refers to the difference in percentage points between the
Kaitz index in 2000 and in 2009 – except Ireland, 2001-2009, and Slovenia, 2005-2009. Source: OECD minimum wage database plus data for Croatia from (Nestić and Bakarić 2010); Collective
bargaining data from ICTWSS (Visser 2009) except Croatia (Nestić and Bakarić 2010) and Ireland (eironline).
13 Our findings complement the EC (2008) study which report various statistically significant correlations between the Kaitz index and industrial relations variables including employer density (0.741), union density (0.600) and bargaining centralisation (0.581).
0
10
20
30
40
50
60
70
80
90
100
LV EE HU UK PO FR LU CZ PT SK ES LT CR IE BE SI NL GR
Ave
rage
col
lect
ive
barg
aini
ng c
over
age
-4
-3
-2
-1
0
1
2
3
4
5
6
7
8
9
Cha
nge
in v
alue
of m
inim
um w
age
CB coverage (avg 1995-2006)MW change (2000-09)

Comparative Report 36
The data plotted in figure 10 suggest a relatively strong negative relationship between the
change in MW value during 2000-2009 and the strength of collective bargaining coverage
(averaged over the 1995-2006 period); the estimated correlation between variables is -0.648.
Seven out of eleven countries that experienced a rising MW were countries with an exclusive
model of industrial relations – that is, weak (and generally uncoordinated) collective
bargaining coverage. It appears that governments and/or social partners have intervened to
improve the statutory MW in a context of weak collective bargaining strength. France,
Luxembourg and Portugal are the main exceptions, combining dual models of industrial
relations with a rising MW. On the other hand, countries that have experienced declines in
the MW value during 2000-2008 tend to have a relatively high level of collective bargaining
coverage. This group of countries includes Belgium (with its inclusive model of industrial
relations) and the dual models of Slovenia, the Netherlands and Greece. As such, mirroring
our comments in section 2 above, we can conclude that there is evidence of convergence
trends in the level of the MW, albeit with notable country exceptions.

Comparative Report 37
4. Redistributive effects of the minimum wage on wage structure
A MW can play an important role in achieving greater equality in the labour market and thus
contribute to the goals of Europe 2020 to improve social cohesion across Europe. The
findings of international comparative research have consistently identified a strong positive
relationship between the strength of wage bargaining institutions, including the presence and
level of a MW, and the degree of wage equality. In a recent detailed study of the impact of
labour market institutions on earnings inequality in OECD countries, Sniekers (2010) finds
the Kaitz index measure of a MW has had an increasingly negative effect on wage inequality
at the bottom of the wage structure over the last two decades. Other studies support this
general conclusion with respect to the particular measures of gender pay equity (eg.
Rowthorn 1992, Blau and Kahn 1992, Rubery and Fagan 1995) and the incidence of low pay
(eg. Bosch et al. 2010, Grimshaw 2010, Lucifora et al. 2005, Salverda and Mayhew 2009).
In this section we identify the redistributive effects of MWs (following Freeman 1996) on
these two measures of pay equity, the incidence of low pay and the gender pay gap.
4.1. The effect on low pay
The empirical evidence suggests a negative relationship between the value of a country’s
MW and the incidence of low wage employment, defined as the percentage of employees
earning less than two thirds median earnings. Data for 19 European countries are graphically
presented in figure 11. The estimated correlation index is -0.432. Countries with a higher
MW relative to average earnings, such as Belgium and France, generally have a lower
incidence of low wage work than countries with a low value MW. There is of course some
variation. For example, Spain and Lithuania have a similar relative value of the statutory
MW, at around 35% of the average wage, but Spain has only half the incidence of low wage
work among full-timers as does Lithuania, 15% and 28%, respectively.
But the general pattern is a negative relationship. Indeed, it appears that a necessary
condition for a low incidence of low wage work (for instance less than 15% of the full-time

Comparative Report 38
workforce) is the maintenance of a high value MW, of at least 42%. This only prevails in
three countries – Belgium, France and the Netherlands.
Figure 11. The value of the minimum wage and the incidence of low pay (full-timers)
Note: Full-timers only covered in the definition of low wage work, 2006 data; 2009 minimum wage data using minimum wage as a ratio of mean earnings. Source: OECD minimum wage database. Structure of Earnings Survey (2006) for low wage incidence. Croatia data from Nestić and Bakarić (2010).
But there may also be an upper threshold to the value of the MW beyond which it
encroaches on other aspects of labour market performance, such as job creation, or on the
freedom of social partners to set wages and address low pay through collective bargaining.
This kind of argument is central to the French experience where in recent years the high
level of the statutory MW has been blamed for the persistent high rate of unemployment and
crowding out of collective bargaining (Gautié 2009), despite its welcome effect in reducing
the incidence of low wage work. However, few countries enjoy the comfort of debating how
to adjust a MW in a scenario where the statutory minimum is valued at around half average
earnings and the incidence of low wage work is less than 10% of the full-time workforce.
Unlike France, in most countries it would appear there is still a lot more to be gained by
improving the value of the MW and thereby reducing the socio-economic costs associated
with a high volume of low wage work.
Aside from its direct impact in raising the pay of low wage workers, a MW can also have
‘ripple effects’, or wage spillover effects, that improve the pay of many low wage workers
UK
SK
SI
RO
PTPO
NL
LV
LT
IE HU
GR
FR
LUES
EE
CZ
CR
BE
28
32
36
40
44
48
5 10 15 20 25 30 35
Incidence of low pay
Min
imum
wag
e as
a r
atio
of m
ean
earn
ings

Comparative Report 39
earning just above the MW level. Ripple effects refer to wage increases at levels of pay
above the statutory MW introduced to restore, at least partially, pay differentials between
workers earning the MW and those earning somewhat above the minimum (for the US, see
Pollin et al. 2008). Such differentials may underpin differences in job status, seniority or
skill and may be vital for the collective sense of fairness which feeds into workers’ morale
and their commitment to good performance. At the same time, however, if all pay
differentials are perfectly restored all the way up the wage scale then a MW rise fails in its
redistributive objective and the incidence of low pay remains the same (Freeman 1996).
Unlike MW rises, ripple effects are not mandated. One of the major uncertainties, therefore,
in understanding the consequences of MWs for low wage employment, relates to the
variation in size of ripple effects. We can expect country differences. For example, in
countries where workers’ pay tends to be covered by collective bargaining it is likely that
ripple effects are significant since trade unions (and employers) can negotiate changes to a
formal pay structure and may be particularly interested in building on the advantage
presented by a MW rise and arguing for the restoration of wage differentials that relate to
differences in experience, job responsibility, skill or qualification or the profitability of the
enterprise or sector. Conversely, in countries without the protection of joint regulation of
wages ripple effects are likely to be considerably smaller.
In her analysis of the effects in the retail industry in the United States, where the MW has a
strong bite, Wicks-Lim (2008: table 11.1) found that the ripple effect extended up to the 40th
wage percentile at a point where the wage is 25% higher than the MW (incorporating both an
immediate and a lagged effect in the calculations). The wage elasticity at this level was 0.14,
equivalent to a 1.4% rise for a 10% rise in the MW. As such, the estimates point to a strong
compression effect of a rising MW among the lowest deciles of the wage distribution (op.
cit.). How do these findings relate to efforts of policy-makers and/or social partners to reduce
low wage employment? One issue concerns the balance between raising the wage floor
relative to the median and the risk of increasing the concentration of workers paid at or only
slightly above the MW. In the absence of ripple effects, raising the MW will not contribute
much to reducing the share of low wage workers, unless of course the MW is raised above
the low wage threshold (two thirds of the median wage). But what is the optimum size and
distribution of ripple effects needed to maximise the redistributive effect of a rising MW?

Comparative Report 40
4.2. Gender pay equity
Women are more likely than men to benefit from the protection afforded by a MW because
they are over-represented in low wage employment. Better protection for female low wage
workers can potentially improve women’s total average earnings and therefore contribute to
a narrowing of the gender pay gap (Rubery et al. 2005; Grimshaw 2010). New estimates
from the EU-SILC data for full-time equivalent hourly earnings show that for all 27
countries (including Norway and Iceland but not France and Malta) women consistently face
a higher risk of low wage employment than men (figure 12). In 23 countries, the share of
low wage employment among women exceeds 20% but this is only true for men in one
country, Latvia. The average share of low wage employment among women across countries
(unweighted) is 26.9%, while for men it is 12.9% (and 19.2% for all workers in the 27
countries).
Figure 12. Incidence of low wage employment by gender (full-time equivalent), 2008
Note: Low wage employment defined in the usual way as two thirds of median earnings. Average hourly full-time equivalent earnings data estimated from annual earnings corrected with monthly data on full-time and part-time employment status along with ELFS average working hours for full-timers and part-timers for each country. Weighted estimates. Source: EU-SILC (2008). Data compiled and provided by Anthony Rafferty, EWERC, Manchester Business School.
The incidence of low pay among female employment is highest in Germany: close to four in
ten women in employment are low paid according to the EU-SILC 2008 data. This may be
somewhat surprising in light of its long-established model of collective bargaining, but the
data fit with recent studies on low wage employment in Germany which point to the fast-
0.00
0.05
0.10
0.15
0.20
0.25
0.30
0.35
0.40
DE LT CY UK LV IE AT LU GR NL RO EE IS BG PT PL ES CZ SK HU SI SE NO BE IT DK FI
Male Female

Comparative Report 41
rising incidence of low wage work and the strong gender divide (Bosch and Weinkopf 2008,
Gauié and Schmitt 2010). Women’s very high risk of low pay in Germany, more than double
that of men, is the result of a mix of factors: there is no statutory national MW; there is
evidence of gendered sectoral variation in collectively bargained minima (eg. lower minima
in cleaning and hospitality sectors); there is also gendered bargaining coverage with
coverage in female-dominated activities in the private sector tending to be lower or absent
altogether; and many part-time workers fall outside the protection of collective bargaining
largely due to difficulties of enforcing agreements in areas with many mini-jobs (Bosch and
Weinkopf 2010).
Other studies have investigated the relationship between the presence and level of a MW and
women’s incidence of low-wage employment. Rubery et al.’s (2005) cross-national
comparative analysis suggests there are benefits for gender pay equity associated with
improvements in the relative level of a country’s statutory MW. We might expect that
raising the MW floor would compress the bottom half of the wage distribution (Sniekers
2010) and thereby level out some of the differences between women’s and men’s propensity
to be low paid. We provide a simple test of this proposition in figure 13 by comparing
country measures of the value of the MW (as a percentage of average earnings) and the
percentage difference between women’s and men’s incidences of low wage employment.
There is a moderately strong negative relationship between the two variables (a correlation
measure of -0.49), such that in general the higher the MW the lower the gender gap in
incidence of low wage employment. Slovenia, the Netherlands and Belgium are illustrative
of countries where a relatively high value MW appears to act is a preventive measure against
women incurring a very high low wage penalty; in these countries women’s risk of low pay
is contained at or below twice that of men’s. Also, the countries where women face the
highest gender bias in the distribution of low wage employment are among those with the
lowest value MW. This includes: the Czech Republic where women face a four-fold risk of
low wage work (according to the EU-SILC full-time equivalent earnings data) and the level
of the MW is the lowest in Europe (see figure 3 above) and Estonia, Slovakia and Spain
where women’s risk of low wage work is high compared to men and the MW is among the
lowest.

Comparative Report 42
Figure 13. The value of the minimum wage and women’s risk of low pay compared to men, 2008
Notes: Low wage data as in figure 12 above. The correlation measure between variables is -0.489. Source: EU-SILC (2008) for low wage incidence (provided by Anthony Rafferty) and OECD minimum wage database. Among the seven European countries without statutory MW protection there is a polarisation
of outcomes. In Italy and the three Scandinavian countries (Denmark, Finland and Sweden)
women’s risk of low pay compared to men is low – less than twice the risk. The reason lies
in part with the high minimum rates in collective bargaining agreements and the low
dispersion of minima by sector, as well as a comparatively compressed wage structure that
includes narrow gender wage differentials at the lowest quintile wage (Rubery et al. 2005).
In contrast to these countries, women in Germany, Austria and Cyprus face higher penalties
compared to men, 2.1, 2.4 and 4.0, respectively. As we saw in section 2 above there is a high
dispersion of minimum rates in collective agreements with female-dominated sectors the
least likely to enjoy high minima. In west Germany, the female-dominated commercial
cleaning, laundries and care services sectors have sector-based minimum rates of between
49-54% of average earnings, whereas the male-dominated painting and varnishing and waste
management have minima of 51-61% (table 2 above).
CZ
SKES
EE
UK
IE
LTLU
PT
BE
GR
NL
PO
LV
SI
HU
28
30
32
34
36
38
40
42
44
46
1.0 1.5 2.0 2.5 3.0 3.5 4.0 4.5
Women's risk of low pay compared to men
Val
ue o
f MW
as
a ra
tio o
f mea
n ea
rnin
gs

Comparative Report 43
5. Minimum wages and distributive pay bargaining:
Evidence from four sectors in five countries
Building on the comparative, country level insights presented in the above sections, this
section compares and contrasts original empirical evidence from five countries on the way
MW systems interact with pay bargaining strategies of trade unions and employers. The
general aim is to understand better how the kinds of patterns detected in our country-level
comparative analysis – between presence of a statutory MW, MW levels, strength of
collective bargaining and pay equity measures – are articulated through sector and company
levels of pay bargaining. As we explored in section 3.1 above, government, unions and
employers have varying (and often conflicting) views about MW rules. Here, we are
concerned to understand how concrete developments in MW policy inter-relate with the
processes and outcomes of collective bargaining. Several inter-related questions are
addressed in the course of our analysis, including:
• Does a rising MW complement or conflict with trade union and employer pay
strategies?
• How does pay bargaining modify and shape the gap between collectively bargained
base rates (at sector or company levels) and the statutory MW?
• Do unions and employers have an explicit approach, or set of strategies, to raise the
position of low paid workers covered by their pay agreement?
• Is there evidence that MW developments can be a positive influence on social
dialogue?
• What are the pay strategies in situations where the level of the statutory MW
exceeds base rates of pay in collective agreements?
Our analysis draws directly on selected findings from the country reports produced for this
project for Croatia, Germany, Hungary, Spain and the UK. Details of research methods – the
number of interviews with social actors, sources of data on pay agreements, and so on – are
included in each country report and are summarised in an appendix to this report (table A2).
We begin by reviewing the characteristics of four sectors and then analyse the detailed
evidence of pay bargaining strategies.

Comparative Report 44
5.1. The characteristics of four sectors
The character of pay bargaining and its inter-linkages with MW policy developments are
influenced to a great extent by the general characteristics of each sector of economic activity.
We selected four sectors for comparative analysis in this report and for each sector we draw
on empirical evidence from between two and four countries, as follows:
o Cleaning: Germany, Spain and the UK
o Security: Hungary and the UK
o Retail: Croatia, Hungary, Spain and the UK
o Construction: Croatia, Germany and Hungary
The reason our choice of four sectors does not cover evidence from all four countries is
because the research design required each country team to select three sectors that suited
both the particular country context and the need for comparative data. For example, the
Croatia team investigated the retail and construction sectors to meet the comparative agenda
of the project, as well as the clothing sector since this is the largest low wage sector in the
country. As such, each country researched a unique mix of sectors. The choice of cleaning,
retail, security and construction sectors for this comparative report includes sectors that
cover large numbers of low-wage workers and/or are closely related to MW policy
developments. Also, the four sectors cover both female-dominated and male-dominated
economic activities, varying use of part-time and full-time employment contracts and
different types of product market environments. It is possible to identify certain general
features of each sector that hold true to a greater or lesser extent, in all four countries for
which we report data. A summary of key features is provided in table 4.
The cleaning and retail sector are female-dominated and are more likely to organise
employment into part-time jobs than is the case for the economy as a whole. In Spain, for
example, the retail sector has a 63% female share and cleaning a 65% share, compared to the
national average of 44%. Part-time work is especially over-represented among cleaning jobs;
in Germany, 80% of the cleaning sector workforce are part-timers with 53% classified as
‘mini-jobbers’ paid a monthly wage less than €400. In Hungary, where the national average
share of part-timers is only between 5% and 7% - there is still an over-representation of
part-time work in cleaning, of 19% among manual workers.

Comparative Report 45
By contrast, security and construction are male-dominated activities and regular hours are
longer, especially in the security sector where guards may be required to cover long shifts,
such as the traditional Friday evening to Monday morning shift. In Hungary it is in fact legal
for employers to set a 60-hour week in jobs requiring ‘stand-by’ duty on agreement between
employer and employee. Unions are campaigning to have the stand-by element removed
from the job description since it conflicts with the 174 hours standard defined in the MW
regulations. The main challenge in the construction sector is the high use of contingent
employment contracts, involving the coordination of networks of self-employed, casual and
temporary personnel.
Table 4. Employment and product market characteristics of four sectors
Cleaning Security Retail Construction
Male/female composition?
Female-dominated Male-dominated Female-dominated Male-dominated
Use of full-time/part-time?
High part-time use; very short hours common
Long full-time hours (although reduced during recession)
High part-time use Full-time standard
Contingent employment contracts?
-- Some fixed-term employment contracts (to match client contracts)
-- High share of self-employed; High use of casual/ informal contracts
Sector structure? High share of small firms but growth of specialist contract cleaning firms
Very high share of small/micro firms
Informal practices
High share of small firms (and informal practices) but global firms dominate
Complex networks/chains of contractors and dominant lead firms
Product market type?
Domestic market
Competitive cost-led bidding for contracts with clients
Domestic market
Competitive cost-led bidding for contracts with clients
Domestic market
Competition for market share
Domestic market
Competitive price-led bidding for contracts
Competitive pressures?
Multinational services firms expanding market share
Opportunities to upgrade technologies to offer higher value services
Downgrading risk of informal/grey economy competition
Small firms squeezed out by growing oligopoly retail chains
Especially strong negative impact of recession
Vulnerable to competition from posted workers
Note: These characteristics are generally true of all five countries covered in this section with some exceptions Source: Five national reports.
The structure of firms has certain distinctive features in each of the four sectors. Dominant
large firms are most evident in retail and construction. In retail, for example, large domestic

Comparative Report 46
and multinational chains tend be enjoying growth in their market share at the expense of the
smaller retailers. In Croatia, for example, the leading Croatian retailer, Konzum, increased
its market share from 8% to 24% during 2001-2008 and other chains such as the German-
owned Kaufland and Lidl have established a new presence with a combined market share of
11% in 2008. Medium and large-sized specialist firms are also evident in the cleaning and
security sectors and have experienced fast growth as a consequence of outsourcing by firms
of so-called periphery activities in the last two decades. Nevertheless, there remains a large
pool of small and micro-sized companies and an associated feature of informal (and illegal)
business practices.
A domestic product market prevails in all four sectors. The construction sector has been
hardest hit by the recession since 2008 and is the sector that faces the most difficult
challenge of adapting to competition from posted workers. Firms in the cleaning and security
sectors operate in a context of strong price-led bidding for contracts for services provision.
The client business typically plays a very important role in setting the boundaries on the
quantity and quality of services provision and, in the absence of certain forms of product
market regulation or sectoral wage agreements, may place downwards pressure on unit
prices and encourage informal business practices. In Hungary, for example, Neumann (2010:
50) reports that, ‘The format for procurement takes the service fee as the only criterion and
forces companies to undertake commissions at such low prices that they can not cover the
MW, or the related social contributions.’ Finally, in all four sectors there is evidence of firms
relying upon networks of suppliers and contractors. The ‘lead firms’ (Gereffi 2005) are more
likely to agree higher rates of pay and in some cases to recognise unions, whereas the
smaller firms at the wrong end of the network offer worse conditions under more
competitive pressures.
Unlike the commonalities found in the general employment and product market features of
the four sectors across countries, the prevailing collective bargaining arrangements in the
four sectors are reflective of the country context rather than being sector specific. Among the
five countries investigated there is a fundamental difference between negotiations in
countries with multi-employer wage bargaining compared to those with single-employer
wage bargaining (Traxler et al. 2001). Where a sector agreement is in place, collective
bargaining potentially takes place at both sector and company levels. Where one is not in

Comparative Report 47
place then only the company level is relevant. Table 5 sets out the general arrangements for
collective bargaining in the five countries.
Table 5. General arrangements for collective bargaining in five countries Sector level Company level Collective bargaining
coverage1
Croatia Several examples but weak compliance outside public sector
Predominant arrangement 61%
Germany Predominant arrangement Strongly shaped by sector level agreement
63%
Hungary Several examples but weak compliance outside public sector and utilities
Predominant arrangement 35%
Spain Predominant arrangement Only partially governed by sector agreement
83%
UK Not used outside public sector
Predominant arrangement 34%
Source: National reports and supplemented by Traxler et al. (2001); 1. ICTWSS database and for Croatia the project national report (Nestic and Bakarić 2010).
Sector-level bargaining provides a potentially important forum for social dialogue and wage-
setting. It is the predominant arrangement in Germany and Spain, of moderate/limited use in
Hungary and Croatia and non-existent outside the public sector in the UK. Sector agreements
may cover the whole country or be limited to a particular region or province. Spain has the
most complex and varied pattern of sectoral agreements with dozens of agreements for each
sector, each covering a particular province and also a particular segment of the sectoral
activity. There is a similarly strong tradition of sector agreements in Germany and, as we
described above, several of these have provided the foundations for new legally binding
sector-specific MWs, established under the Law on the Posting of Workers. Company
bargaining is the predominant arrangement in Croatia, Hungary and the UK. The interaction
between sector- and company-level agreements depends on the procedural provisions that
govern interaction between the two levels. These interactions tend to have a strong influence
in Germany but a weak influence in Spain, Croatia and Hungary. This arises largely because
the responsibilities of the different actors is not well defined in some sectors (Arrowsmith
and Marginson 2008; national reports). The position of unions on company versus sector
level bargaining is complex. They may seek to discourage company pay bargaining and
lobby instead for new agreements to be negotiated at the sector level. Or, as our data for the

Comparative Report 48
five countries appear to suggest, they may seek to establish improvements in conditions at a
company level because negotiations at a sector level are more difficult and at risk of delays.
Arrangements for collective bargaining in the four selected sectors reflect to a large extent
the national patterns (table 6). In Croatia, while there are sector agreements in both the
construction and retail sectors there is varying quality of social dialogue. The construction
sector was the first sector during the transition to conclude a sectoral collective agreement
(in 1991) and both union and employer representatives report favourably on the practice of
social dialogue at the sector level and have regularly agreed revisions to the agreement. By
contrast, the retail sector is characterised by less participative activity among social partners;
the agreement was first concluded in 1998 and has only been amended once in 2005. Both
sector agreements have been declared legally binding with the support of social partners who
view extension as the best means of minimising unfair competition. Indeed employer
members of the retail employers’ body appear to express stronger support than their trade
union counterparts, arguing that all companies ought to operate under the same rules in the
sector so as to prevent unfair competitive advantage. Company bargaining has been a key
goal of unions in the retail sector because there has been a failure to regularly update the
sector agreement.
In Germany, there are sector agreements in both the cleaning and construction sectors.
Extension of these agreements is the way by which sector-wide MWs are established in
Germany. During the 1990s construction boom of unified Germany, the high labour cost
construction sector was the target of firms using posted workers employed on their home
country terms and conditions. Construction employer and union bodies lobbied for extension
of a collectively agreed minimum and, with help from the Federal Ministry of Labour,
successfully overturned the refusal by the BDA, the National Federation of German
Employers’ Associations, to make the agreement legally binding. Industry-specific minimum
wages for construction have been declared binding since 1996 and continue to attract support
by employers and unions, although somewhat less among employers in eastern Germany.
The picture in Hungary is quite fragmented with sector agreements in construction (legally
binding) and security (not currently legally binding) and a mix of company and multi-
employer bargaining in retail (some 100 single company agreements and 56 multi-employer
agreements). The conditions that led to the extension of the agreement in the construction
sector included the presence among the social partners of both an employer organisation

Comparative Report 49
with a relatively strong reputation of legitimacy and a long-established trade union coupled
with active intervention by the government in the interest of combating illegal activities. In
security, an extension procedure was initiated in 2009 but came to a halt in May 2010 due to
conflicts among employer bodies and an insufficiently supportive government. Union
density is weak in all three sectors and this raises significant problems of compliance, as well
as presenting problems of bargaining power at the company level. Unions are not present in
the majority of companies and therefore they face strong challenges of improving
mobilisation. Moreover, compared to sector agreements, there is a greater risk at company
level that a weak trade union is unable to establish a sufficient countervailing authority when
bargaining with a large employer. For their part, employers may view the capacities and
resources of unions at company level as below the level required for professional
negotiations.
In Spain, the cleaning and retail sectors are typical of all sectors in Spain in that they have
dozens of multi-employer agreements each covering a particular province and, in some
cases, a particular segment of the sectoral activity. For example, in retail in the province of
Valencia there is a specific agreement for meat products, as well as for textile, iron and
furniture products. There is little evidence of formal coordination. One of the employer
representatives in the retail sector is quoted as stating, ‘Each collective agreement in retail is
discussed in its own context. … We just look for our own interests. ... What is happening in
other retail activities is not my business’ (cited in Banyuls et al. 2010: 22). Aside from the
lack of formal coordination there is nevertheless some evidence of processes and outcomes
in one agreement being used informally to influence those in another. A union official in the
cleaning sector is reported as arguing, ‘We need to use those workplaces where we exercise
some power to achieve broader targets. By making a comparison [with other workplaces] we
try to extend these conditions, using it as a reference’ (cited in Banyuls et al. 2010: 28).
Collective bargaining coverage nationally is weakest in the UK among our five countries. It
is the only country with no sector agreement among those selected for investigation and,
furthermore, there are few company agreements. An interesting development has occurred in
the private cleaning sector as the result of new extensions of public sector collective
agreements to private firms that contract for outsourced ancillary services. However, the
procedures for translating sector conditions to a company level are weak. Moreover private
companies typically do not seek to establish a single company agreement for the provision of

Comparative Report 50
public cleaning services, preferring instead a raft of different agreements for each public
sector client (hospital, local authority, etc.). The three company case studies analysed in the
UK national report illustrate the complexity of collective bargaining in a context of weak
unions and weak employers’ associations. In the security company, for example, there are
dozens of pay agreements between the union and this single employer because it is the client
that enjoys power in setting the price for the contracted services and thus the pay. The report
cites a range of £5.80 to £7.50 basic wage for the same job employed on contracts with
different clients. A senior HR manager from the case-study security firm explained the
reasoning as follows, ‘It’s all contract led. We have no national [company] pay negotiations
because we can’t. Because one client might give us a 2% pay rise and another client may
give us a 10% pay increase so we can’t apply a 5% increase across the board.’ (cited in
Grimshaw et al. 2010: 36).
Table 6. Features of collective bargaining in four sectors investigated in five countries Cleaning Security Retail Construction
Croatia -- -- Sector agreement
Legal extension
Low union density and weak union bargaining
power
Sector agreement
Legal extension
Strong reputation of social dialogue
Germany Legally binding sector MWs (indoor/outdoor cleaning)
5% union density
45% CB coverage (business cleaning services)
-- -- Legally binding sector minimum wages (skilled/standard,
east/west)
72% CB coverage
Hungary -- Sector agreement but extension procedure
halted.
Weak unions & employer bodies
26% union density
11% CB coverage
Weak social dialogue/ no sector agreement
Company bargaining predominant.
Weak unions
10% union density
12% CB coverage
Legally extended sector agreement (although
problems of compliance)
6% union density
25% CB coverage
Spain National sector agreement (for job categories not
wages) & multiple provincial agreements
-- Multiple agreements by province, retail product,
company
--
UK Limited bargaining except extended public sector agreement to private
contractors
Weak union density
Few company collective agreements
Complex contract-led company bargaining
Weak union density, 12%
Few company collective agreements
--
Note: Some cells are blank since the country report did not investigate this particular sector. For Hungary,
union density and CB coverage figures are for companies employing more than four people. Source: Compiled from the five country reports.

Comparative Report 51
The intensification of cost-led competition for contracted services in the cleaning,
construction and security sectors appears to have encouraged a new mobilisation among
employers to lobby for, or to support, the extension of sector agreements. The rationale is
that this can provide a basis for the coordination of prices both to shift the focus to non-price
factors and, by raising the bar, to discourage informal/illegal company activities. In Hungary,
for example, employers in the security and construction sectors argue that the solution to
improving conditions lies in limiting price competition by setting a minimum floor for the
basic hourly fee. And in the UK, employers in the private cleaning sector supported the
‘Two Tier Code’ that extended public sector terms and conditions to private sector
contractor firms. However, it is also important to recognise limitations to the practice of
extending a sector agreement in a context where the unbundling and outsourcing of firm
activities often blurs simple lines of sector differentiation. For many jobs, there is a mix of
in-house and specialist contractor provision that produces competition across sectors. For
example, a cleaning job may be internally organised by a manufacturing firm or by a
specialist cleaning company. In this case, a binding collective agreement for the cleaning
sector only sets a minimum common floor for cleaning companies and does not prevent the
organisation of in-house cleaning on a potentially cheaper basis that undercuts sector
standards. Such is the case in Germany where there are some examples of public sector
organisations bringing outsourced cleaning services back in-house because it is in fact
cheaper. This kind of example helps explain why the employer body for the cleaning sector
now campaigns for a national statutory minimum wage14. The opposite scenario applied to
the UK for many years. Public sector organisations were regulated by sector agreements but
no such agreement existed among cleaning companies, which therefore enjoyed an unfair
cost advantage to bid for the outsourcing of cleaning services. After several years of trade
union campaigns, this problem was addressed by a government decision in 2005 to extend
the pay and employment conditions of public sector agreements to private and voluntary
sector contractors, thus providing a more level playing field. At the time of writing it is not
clear how durable this extension is as a legally binding agreement in a context of a newly
elected Conservative government determined to cut public expenditures by at least 25% over
the next four years.
14 The situation is more complex than this. Cleaning employers assume there is a need for a binding MW but realise that the sector is likely to fail the required target of 50% collective bargaining coverage as a precondition for a sector-wide MW according to the Law on Posting of Workers.

Comparative Report 52
5.2. Pay bargaining and the minimum wage
A key question for our analysis is the extent to which pay bargaining is influenced by
developments in the MW. For four countries this means changes in the level of the statutory
national MW and for Germany it means developments in legally binding sector minimum
wages. In this section we explore the patterns of differentials, or wage gaps, between
collectively bargaining base rates of pay (for a particular sector or company) and the MW.
Our concern is to compare and contrast country and sector differences in this wage gap in a
general effort to appreciate the strength of interaction between MW policy and collective
bargaining in the different contexts. The analysis also contributes to an understanding of
variations in the spillover or ripple effect of a rising minimum at the bottom of the wage
structure. In the following section 5.3 we explore some of the conditions underpinning the
variation by focusing on particular pay bargaining strategies. We report the evidence for the
four selected sectors reviewed above drawing on details from the five national reports.
What is striking from the case studies presented in the national reports is the diversity of
patterns characterising the collectively-agreed base wages relative to the statutory MW (we
discuss four countries with national minimum wages here and return to the case of Germany
below). There are examples of base rates negotiated at levels far below the statutory national
MW, examples of base rates set at a rate equivalent to the minimum and examples (the
majority) where base pay is set higher than the statutory minimum. Table 7 sets out the basic
details, distinguishing by sector and country case study (including sector and company
bargaining agreements).
From the various sector and company case studies, there is one notable example – that of the
retail sector agreement in Croatia – where the base wage is set at a level significantly lower
than the statutory MW. The lowest base wage was set at 23% less than the MW when the
sector agreement was first concluded in 2005. Then, in the context of the raising of the
statutory minimum in 2008, the negative gap widened to 43% by 2010. Pay bargaining at
company level does not appear to impact upon this negative gap very much. The case-study
company reported in the national report negotiated a base wage at 40% less than the
statutory minimum in 2010. So how (and why) is the negative gap sustained?

Comparative Report 53
Table 7. Examples of gaps between the statutory national minimum wage and collectively bargained base wages (sector and company levels)
Base wage < MW Base pay = MW Base pay > MW
Cleaning --
-- Spain – sector/province agreements
UK – case-study company
Security -- Hungary – sector agreement
UK – case-study company
Retail Croatia – sector agreement
Croatia – company agreement
-- Hungary –case-study company agreement (but below the skilled MW)
Spain – sector/province agreements
UK – case-study company
Construction -- Hungary – sector agreement
Croatia – sector agreement
--
Source: Compiled from the four national reports. Germany is excluded from the table since it dos not have a
statutory national minimum wage. The base wage refers to the basic rate excluding pay enhancements for unsocial hours, seniority, performance, and so on.
The analysis in the national report suggests three reasons. First, as in other sectors in Croatia,
the base wage is enhanced by a number of pay supplements, in this case especially for
seniority and for difficult working conditions, as well as unsocial working hours. Because
the MW in Croatia applies to total remuneration not the basic wage, these supplements
generally lift the pay of workers in low skilled jobs above the statutory MW (especially in
large companies) and where this is not the case the company must comply with the
legislation. However, these pay supplements appear to have been an easy target during the
recession and unions report drops of up to 30% in the total wage as a result. The second
factor is the MW increase in 2008 which massively outpaced changes in the sector base
wage and caused a significant widening of the negative wage gap. And thirdly, weak unions
(a combination of low union density and weak bargaining power) have failed to exert
sufficient pressure on employers to uplift base wage rates. The result of these three
conditions is a falling value of the total wage packet compared to the statutory minimum,
eroding the wage premium that used to be enjoyed by a standard sales assistant. Applying
the relevant coefficients to the base wage for a sales assistant with 5 years experience and
eligible for the standard bonuses and allowances demonstrates that at the case-study
company the premium above the MW has shrunk considerably from close to 30% in 2005 to

Comparative Report 54
less than 10% in 2010 (see box 1 for a comparison with the UK case study company
agreement).
Box 1. Shrinking gaps between the wage for sales assistant jobs and the statutory national minimum wage, Croatia and the UK Although both examples of retail company agreements for Croatia and the UK display a positive gap between the wage paid to a sales assistant and the statutory MW, the gap has declined significantly in recent years. In the Croatian company agreement the base wage for a sales assistant is estimated as the base rate in the collective agreement (set below the MW) multiplied by a coefficient for the job of sales assistant. The gap with the MW has declined considerably from 50% in 1999 to 8% in 2010. Similarly, in the UK company agreement, there has been a steady trend decline in the wage premium enjoyed by a sales assistant, from a 23% gap in 1999 to 15% in 2010.
Source: adapted from national reports.
Table 7 lists three examples where the collectively agreed base rates are equivalent to the
statutory MW - the construction sector in Croatia and Hungary and the security sector in
Hungary. The construction sector agreement is legally binding in Croatia and Hungary and
in both countries the base rate has been set at a level at, or close to, the statutory MW. In
Croatia annual rises in the base rate have closely followed developments in the MW, and in
2007 the link was in fact made explicit in an annex to the agreement; since then the two rates
have been equivalent. Given the large hike in the national MW in 2008 this linkage has
benefited the lowest paid in the construction sector and raised the wage level relative to
average earnings. And in Hungary, the lowest base wage for unskilled workers when
introduced in 2005 was set at a level approximately equal to the statutory MW. During 2006-
2010 the gap has fluctuated marginally between 0% and 4%.
If the base rate is tied to the statutory MW, then it raises the question as to whether or not
wage rates for higher paid job categories defined in the collective agreement increase by a
CROATIA (monthly wage data) UK (hourly wage data) MW Company
base rate % Gap MW Company
base rate % Gap
1999 1500 2252 50.1 £3.60 £4.44 23% 2000 1700 2252 32.5 £3.70 £4.58 24% 2001 1700 2252 32.5 £4.10 £4.95 21% 2002 1800 2477 37.6 £4.20 £5.16 23% 2003 1859 2477 33.2 £4.50 £5.32 18% 2004 1951 2601 33.3 £4.85 £5.56 15% 2005 2081 2731 31.2 £5.05 £5.84 16% 2006 2170 2731 25.8 £5.35 £6.02 13% 2007 2298 2866 24.7 £5.52 £6.26 13% 2008 2441 2866 17.4 £5.73 £6.50 13% 2009 2747 3026 10.2 £5.80 £6.66 15% 2010 2814 3026 7.5 £5.93 £6.81 15%

Comparative Report 55
similar amount each year or whether there is evidence of compression of wage differentials.
The data for the Hungarian construction sector suggest there has been some compression
among the bottom two grades, unskilled and semi-skilled, but the differentials between
unskilled and skilled categories have widened over the 2006-2010 period (table 8). Pay
bargaining in Hungary must also contend with a statutory minimum for skilled workers.
Analysis of the construction sector agreement suggests a shrinking gap. The lowest skilled
base rate in the sector agreement (skilled with less than two years’ experience) started with a
14% wage premium, dipped to 2% below in 2009 and regained a 6% premium in 2010 (table
8). Company bargaining provides some positive wage drift. For example, at the case-study
company in the Hungarian national report the rate for unskilled jobs is 13% higher and for
semi-skilled 21% higher than the sector base rates.
Table 8. Trends in collectively bargaining wage rates relative to the statutory minimum wage, Hungary, construction sector, 2006-2010
2006 2007 2008 2009 2010 Unskilled % of standard MW 100.8 102.3 104.3 100.7 100.3
-- -- -- -- -- --
Semi-skilled % of standard MW 112.0 114.5 115.9 111.9 108.8 % of unskilled rate 111.1 111.9 111.1 111.1 108.5
Skilled with less than 2 years experience
% of skilled MW 114.2 111.0 102.7 97.7 106.1 % of unskilled rate 119.0 119.4 118.1 118.1 128.9
Skilled with at least 2 years experience
% of skilled MW 116.3 119.4 120.8 114.9 111.7 % of unskilled rate 127.0 134.3 138.9 138.9 135.7
Master skilled worker % of skilled MW 145.3 152.5 157.0 149.4 145.3 % of unskilled rate 158.7 171.6 180.6 180.6 176.4
Source: adapted from Neumann (2010: table 17).
In most cases, the collectively agreed base wages are higher than the statutory MW. This is
true of agreements for both sectors reported for Spain. In part, this is a reflection of its
relatively low statutory MW rather than the high level of collectively agreed base rates.
There were improvements in the MW during 2004-2008 (see above) but over the 2000-2009
these were outpaced by upratings in Croatia, the UK and Hungary (see figure 3b above). For
the Valencian province, the gap with the MW in 2009 was 35% in the building cleaning
sector agreement and 26% in the general retail agreement. As with other sectors, there is
significant variation by province, with a gap of 25% in the building cleaning agreement for
Alicante for example, and by sub-sector, with a gap of 10% in the meat retail agreement for
Valencia-Castellón for example. For the most part, base rates in the Spanish agreements did
Comparative Report 56
not keep up with the improvements in the MW during 2004-2008: compared to an average
increase of 5.6% in the statutory MW the average annual increase in the base rate for an
experienced grocery assistant in the Valencia province was 3.4% and for a cleaning labourer
in Valencia 4.4%. Trade unions recognise their inability to restore the larger gap with the
MW floor and this has been accentuated by the crisis when unions are less able to make
credible threats of strike action.
In the UK, both case study company agreements, for cleaning and security, also have base
rates higher than the statutory MW. In cleaning, this is very untypical; the Low Pay
Commission reports the cleaning business as the sector with the highest share of workers
paid the MW, estimated at around 22% in 2008 (LPC 2009). The case study reveals the
significant impact of the 2005 ‘Two Tier Code’ in raising the base rate paid by the private
company in its contract for outsourced services with public sector hospitals. Prior to the
code, cleaners employed by private firms were typically either paid the MW or the
collectively agreed wage if they had transferred from the public sector organisation under
TUPE (Transfer of Undertakings Protection of Employment) regulations. The new code
harmonised wage payments and by 2010 had established a gap of 18% above the statutory
MW. However, this base rate is not agreed as part of a company-wide collective agreement.
It only applies to those workers employed to deliver services to the particular public sector
client. In contracts with private sector clients, the same company pays workers a range of
different wage rates. It is a peculiar approach to wage setting (and is also mirrored in the
security sector case study) that grants a determining role to the financial value and profit
margin of each contract for services.
A final example of a positive wage gap is the case study of a company agreement in the
Hungarian retail sector. Unlike the construction and security sectors there is no retail sector
agreement so it is very likely that the statutory MW serves as the going rate in smaller retail
companies. In addition, the introduction of a statutory MW for skilled workers in 2006 (22%
higher than the standard minimum) had a major impact on retail companies because cashiers
and various other job positions required particular qualifications and were therefore
considered skilled workers. Wage differentials became more compressed and employers
lobbied against the application of the skilled MW. The dispute with trade unions contributed
to a breakdown in social dialogue on wages at a sector level. In response, the government
intervened to cancel the qualification requirement for various retail jobs in particular

Comparative Report 57
branches of the retail business (amounting to around 10% of the retail workforce).
Employers are confident this will act as a catalyst to the cancellation of qualifications for
many other sales assistant job positions and therefore the application of the standard rather
than the skilled MW. In the case-study company, the majority of employees are classified as
unskilled. For their part, unions emphasise the damaging effect this change poses for the
reputation of the sector:
It will lead to the further devaluation of the profession and of vocational training in
commerce and eventually to the worsening of the situation of all employees in this field. .. It
will disadvantage buyers too; employing unskilled labour will lead to more consumer
protection problems (cited in Neumann 2010: 34).
In terms of the wage gap at the case study company, the base rate of pay was set at a level
above the skilled MW when it was first introduced in 2006, then at the same level of the
skilled minimum in 2007, and during 2008-2010 it was negotiated at a level below the
skilled MW.
The examples of sector agreements for Germany are distinctive since there is no backdrop of
a statutory national MW. It is of course the sector agreement that sets the legally binding
MW for construction and cleaning companies. There is therefore no ‘gap’ of the sort
described for the other four countries. Nevertheless, there is interesting variation in the
influence of the collectively agreed (and extended) minimum base rate across companies,
compared to the use of higher base rates for skilled workers. The results of a survey of
construction trade union members (from IG Bau), for example, show that the minimum base
rate acts as the going rate for companies in eastern Germany but plays only a minor role in
western Germany. More than three in four employees surveyed in eastern Germany were
paid the minimum base rate or a wage closely linked to the minimum, while in western
Germany less than one in three employees were paid such rates (Bosch and Weinkopf 2010:
figure 8). It appears there is a serious problem among companies in eastern Germany where
many skilled workers are not paid the collectively bargained rate for their skill and
qualifications.
Extensions of the collective agreements in the German cleaning sector have a long tradition,
but only in 2004 were uniform wage rates established for the two western and eastern
regions of Germany. This was a controversial development since employers pressured for
the reduction in wage rates in high paying states (in Bavaria, for example). The new

Comparative Report 58
agreement contains nine wage rates for different job positions, with separate rates for west
and east. There are two MW rates, one for indoor cleaning and another for outdoor cleaning.
Most workers – an estimated two thirds - earn the MW for indoor cleaning.
5.3. Features of an egalitarian pay bargaining approach
Various pay bargaining strategies, at company, sector and national levels, shape the observed
interaction between collectively bargained base rates of pay and developments in the MW.
As we showed above, pay bargaining is not always effective in establishing and sustaining a
positive gap with the statutory MW. Social dialogue between employers and trade unions
bolsters efforts to protect the low paid, but it is not always easy to build upon areas of
agreement and cooperation. Nevertheless, there appear to be certain features of a pay
bargaining approach that protect and/or improve the position of the lowest paid. These
features are not universal but it may be that examples from one sector in a particular country
context can provide lessons for application in other contexts. In this section, we identify five
different features that can be said to characterise an egalitarian pay bargaining approach.
i) Establishing binding standards
The case study of a UK cleaning company providing outsourced services to public hospitals
best illustrates the power of an extension agreement to protect and improve the position of
low wage workers. It is an unusual example for the UK and represents the first type of wage
extension for around 25 years, since the abolition in 1983 of the Fair Wage Resolution
(which required companies contracting with public authorities to meet the terms and
conditions set in national collective agreements). The new extension agreement was
implemented in 2005 after many years of trade union campaigns, with strong involvement by
the public services union, Unison, as well as the peak organisation, the TUC. The focus of
campaigns was on improving low pay in private sector contractor companies. Unions
collected and disseminated evidence of a ‘two-tier workforce’, collected data on numbers
earning less than £5 per hour and balloted for strikes (Grimshaw 2004). Moreover, the TUC
made the introduction of a new Fair Wage Resolution a key objective. On the employer side,
there were mixed views. The employer body for business services firms adopted a pragmatic
approach and recognised the need to break out of the price-led competition for contracts.
However, the peak employer body, the CBI, opposed any new regulation (op. cit.).
Ultimately, the union view won. As the Unison representative explained:
We went to the government and said not only is it unfair but also severely destabilising that
you have the employed staff of the National Health Service on [collectively agreed pay rates]

Comparative Report 59
and outsourced workers who are doing essential work but are on minimum wage and in fact
a few cases are being paid below the National Minimum Wage (cited in Grimshaw et al.
2010: 31).
The wording of the new extension brings the UK position close to the ILO Labour Clauses
(Public Contracts) Convention No. 94. It requires private contractors to provide new recruits
with terms and conditions of employment which are ‘no less favourable’ than those of
workers employed in the public sector. As a result, where private contractors typically paid
the MW to cleaning staff, they now pay a wage premium of 18% to those cleaning public
hospitals - a significant improvement.
Legally binding standards are also especially notable in the case of Germany where they
provide the basis for sector minimum wages following the application of both social
partners. In each collective agreement, the MW provides a base point in the wage grid. In
western Germany, in all cases except construction, the sector minima fall below the usual
threshold for low wage work (two thirds of median earnings for all employees).
Nevertheless, they are far higher than the level of statutory national minimum wages which,
as we saw in section 2, average at around 47% of median earnings for full-time employees
across Europe (OECD data). Moreover, comparing the extended sector minimum for
cleaning in Germany with the extended public sector agreement that covers cleaning in the
UK shows that the German minimum is higher relative to average earnings for the economy
– 54% in western Germany and 49% in eastern Germany compared to 47% in the UK.
ii) Passing on higher wage costs to clients
Two of the four sectors examined, cleaning and security, are low wage business services
sectors and a third, construction is composed of fragmented networks of contractors that bid
for work through a series of contracts. A key obstacle to improving pay in these conditions is
the absence of a framework of rules through which organisations share an approach towards
the passing on of higher labour costs to clients. Client organisations do not always attach
value to non-core activities such as cleaning and security and while they may operate in high
value-added markets of the economy, they may nevertheless be willing to select a specialist
contractor on the basis of most competitive price per unit of service. Unlike other pay
bargaining strategies, this issue very often unites employers and unions, albeit in opposition
to representatives from the client side.

Comparative Report 60
In the Hungarian security business, the employer body and the professional chamber have
agreed a minimum level of service fees that ought to be charged to client organisations. A
minimum hourly fee of HUF900 enables payment of the skilled MW (HUF515) and
associated tax and social security contributions. Nevertheless, there is limited compliance
and the employer and trade bodies lack the power to exercise sanctions. The going rate for
security services is estimated at around HUF600-700. According to the head of the employer
body for the security sector (MBVMSZ) this is insufficient for a profit-making company to
provide legal employment. A similar recommendation was established for the construction
sector by the Hungarian collective body of contractors (ÉVOSZ). Jointly with trade unions,
ÉVOSZ recommends its members to establish a minimum hourly service fee of HUF1900-
2000 in order to avoid illegal employment. Again, despite this recommendation being
published in a bulletin on procurement guidelines, compliance is believed to be weak.
Similarly, in the UK, where there are few pockets of effective social dialogue among social
partners, the case-study employer established a strong partnership approach with the GMB
union in an effort to encourage clients to accept higher prices for contracted services as
wages have increased. One of the senior managers explained their approach:
We have been working with our union to see how we can increase our pay rates for the
employees in that division [security services], how we can get those [clients] buying security
to see the value of it and get them to pay a reasonable amount of money for it (cited in
Grimshaw et al. 2010: 34).
But to date, the UK security company has had limited success. Some clients pay low fees,
others high fees and the company argues this means they have to discriminate in the wages
paid to security guards. On some contracts, security guards earn close to the MW whereas on
other contracts pay is significantly higher as a result of the client pressuring for programmes
of skill development and uprating of pay. The result is an extreme fragmentation of pay rates
for the same job within the same company.
iii) Bottom-weighted pay strategies
A bottom-weighted pay settlement involves a larger pay increase for the lowest paid
compared to higher paid groups. While this strategy may be the direct result of an effort by
one or both social partners to redistribute pay, our empirical evidence from the five countries
suggests in recent years it has been a response to the rising statutory MW and the need to
restore differentials at the bottom.

Comparative Report 61
In Croatia, the falling base rates in sector agreements, relative to the rising statutory MW,
have led to the increasing use of lump-sum allowances to ensure that workers’ total wage is
at least equivalent to the MW. Among the lowest paid workforce, this practice has resulted
in a more compressed wage distribution. In the Hungarian retail sector a bottom-weighted
pay strategy was implemented in response to both a higher MW and changes in tax rules that
adversely affected workers earning less than a particular monthly threshold. Also, in an
investigated series of company wage agreements, the unions have successfully negotiated
bottom-weighted agreements in five successive years that award low wage employees a
percentage raise and higher paid employees a relatively smaller lump sum payment. In the
2010 agreement, this was modified, such that the lowest paid were awarded a lump-sum and
higher paid employees no pay rise. Moreover, the trade union favours imposing a maximum
limit to pay increases for senior managers and redistributing the income to the lowest paid.
Finally, in the UK, use of bottom-weighted pay deals was evident in the cleaning, security
and retail case study companies. In the cleaning and retail cases, unions pressed for
elimination of bottom pay grades as a direct means of raising the pay for the lowest paid.
And in the cleaning and security case study companies, the pay agreement included various
examples of lump sum deals for the lowest paid that exceeded the pay settlement for other
workers.
In each case, while the lowest paid benefit at the expense of higher paid colleagues, there is a
risk that such a strategy leads to a compression of the pay structure among the lowest paid
workers rather than a redistribution of income from the highest to the lowest paid. The case-
study retail company in the UK is illustrative. As a direct result of its bottom-weighted pay
bargaining approach (the successive elimination of bottom grades), the retail sector trade
union, Usdaw, is now grappling with the consequences of having a broad mix of jobs from
cleaners and trolley staff to check-out workers employed at the same rate of pay. Company
managers say this meets their ‘one team’, multi-skilling approach and requires all new
employees to be trained in the different roles. But the union argues that multi-skilled staff
ought to win a pay enhancement.
iv) Union mobilisation and industrial action
The background to some of the changes in pay bargaining for the low paid has involved
industrial action and/or recruitment of new trade union members in an effort to strengthen
bargaining power. In the German cleaning sector, for example, the main trade union (IG

Comparative Report 62
Bau) organised a surprisingly effective strike action in response to a highly controversial pay
bargaining round in the summer of 2009. The union viewed the employers’ pay offer as too
low and organised a successful strike – referred to as a ‘rebellion of the invisibles’ - that was
significant in winning popular support from the German media. Thus, despite union density
of less than 10% in the sector, the union won the strike and established the grounds for the
successful negotiation of the sector agreement later that year. It is also notable that the
employer body (BIV) did not denounce the strikes but instead argued they ought to be
viewed as an ‘effective public demonstration’.
In the UK security sector, the GMB union set out to increase union membership as an
explicit precondition for gaining the bargaining power needed to raise low rates of pay
among security guards. The union trained a special team of 25 representatives (the ‘GMB at
Work Team’) in the art of winning new members and each attended induction sessions for
new recruits at the case-study company. A 90% success rate in signing new recruits
increased the 20% union membership to 50% from 2007 to 2010. The employer contributed
to the success both by facilitating time off for union representatives to undertake four days of
training in recruitment methods and in inviting them to induction sessions to meet new
recruits to the company.
v) Changing the balance of pay enhancements
The final feature to an egalitarian pay bargaining approach involves attention to pay
enhancements that can provide a considerable uplift to low basic rates of pay. The case-study
data suggest this is an especially important issue in Croatia where collectively bargained
base wages fall below the statutory MW and workers therefore rely on the application of a
range of pay enhancements to raise their total pay. In the construction sector, for example,
the seniority bonus alone is estimated to add an average 12.5% to a worker’s base wage; all
combined the various enhancements can add up to 30-35% and are significant even for an
inexperienced worker employed in a relatively unskilled job.
However, in this and other cases it appears that pay enhancements are often more exposed to
the risk of cuts. In Croatia, the balance of basic pay and pay enhancements is a contested
terrain among construction unions and employers. In past negotiations employers proposed
raising the basic rate in exchange for eliminating the seniority bonus, but this was not
accepted by unions possibly because of a perceived risk that it would set a precedent for
other sectors. Also, in the UK retail case-study company pay enhancements for unsocial

Comparative Report 63
working hours have been reduced or eliminated altogether in line with the employer’s goal
of simplifying the pay structure; employees in this case have therefore witnessed a shrinking
wage premium relative to the MW and loss of pay enhancements, including the loss of a
50% overtime premium and a reduced Sunday and public holiday premium from 100% to
50%.

Comparative Report 64
6. Conclusion: Key policy issues
The complex interaction between MW systems and industrial relations goes some way to
explaining the diverse country experiences in the functioning, effectiveness and performance
of its MW. This report has reviewed much of the data for Europe on trends and patterns in
the level of the MW, the aggregate interaction with models of collective bargaining and the
implications for wage equity measures – namely, the incidence of low wage work and the
gender pay gap. It also reports findings from a novel analysis of collective bargaining in
selected sectors in five European countries where developments in minimum wages have had
a significant impact in recent years. A summary of our key findings can be found in the
Executive Summary to this report. Here, we conclude the report by discussing some of the
key policy issues that arise from our analysis.
The first issue concerns prospects for MW policy. All five countries have witnessed key
moments of policy development in the last decade. For the four countries with statutory MW
protection such developments are indicative of policy renewal and adaptation in light of
changing socio-economic conditions as well as changing political goals – not least the desire
by government and/or social partners to use the MW to improve the status of low wage
work. Croatia reinvigorated its MW with a new Act in 2008, Hungary has instigated large
one-off upratings and introduced a new MW for skilled workers, Spain raised the MW in a
direct effort to improve the Kaitz index and similarly in the UK the Low Pay Commission
raised the MW over a four-year period in an effort to address doubts about its ‘bite’ in the
labour market. The economic crisis has stalled further policy development and it is unclear
whether or not government and social partners will revisit objectives to raise the relative
level of the MW. The Spanish government, for example, set a target to raise the monthly
MW to €800 by 2012 but given that it only increased from €600 to €633 during 2008-2010
the authors of the national report for Spain argue this target will almost certainly not be met.
Yet the level of the statutory MW in all four countries remains relatively low – all below the
European average of 41% as a percentage of average earnings (figure 3a above). And the
share of low wage workers is relatively high – ranging from 15% in Spain to almost 25% in
Hungary (EU-SILC data in figure 11 above).
Comparative Report 65
Germany is of course in the midst of the most controversial set of MW policy developments
with strongly conflicting positions among social partners about the appropriate path of
institutional development, between maintaining the status quo of autonomous collective
bargaining on the one hand and, on the other, implementing new forms of wage protection in
sectors with weak (or no) collective bargaining. Not all employers oppose statutory
intervention; the employers’ body representing companies in the cleaning sector (BIV)
supports the introduction of a statutory national MW. To date, the process of establishing
sector-based minimum wages in Germany has not been straightforward. The authors of the
German national report predict slow progress in the coming years:
‘The institutional mechanisms devised for the implementation of industry-specific minimum
wages provide numerous intended and unintended possibilities for politics, employers and
competing unions to block their practical application. Minimum wages in Germany are thus
very slow in their realisation and a patchwork of different minimum wages together with
large unregulated zones of wage-setting without binding minimum standards will be the
result in the short to medium term’ (Bosch and Weinkopf 2010: 37).
A second key policy issue concerns compliance. Enforcement of the MW is especially
challenging in Croatia and Hungary, but the empirical evidence point to problems in the
other three countries also. The evidence from Hungary identifies problems with enforcing
the statutory MW in small firms using illegal labour, as well as issues in larger firms where
employers redefine jobs as unskilled in order not to comply with the higher skilled MW rate.
Similarly in eastern Germany the evidence for the construction sector points to the
possibility that companies can redefine jobs (or redesign work organisation) to shift the
composition of workers from high wage skilled rates to low skilled minimum rates. In
Hungary, the problem lies partly with intensive price-led competition for contracts, which
encourage bidding at unrealistic unit prices that make compliance with MW regulations
difficult. The author of the national report for Hungary calls for a regulatory intervention that
would ‘guarantee service fees that cover the MW and prevent the evolution of economically
unjustified subcontracting chains’ (Neumann 2010: 53-54). In Croatia, the evidence suggests
many employers register the payment of minimum wages to their employees and top up the
wage informally with ‘envelope payments’ so as to avoid payment of social security
contributions on a higher rate of pay. In Spain union representatives from the retail sector
complained about weak compliance among the many small shops and suggested that workers
paid less than the national MW are in a weak position to complain about their employer in a
Comparative Report 66
context of high unemployment (Banyuls et al. 2010: 30). And in Germany interviews with
representatives from the inspection body (FKS) reveal dissatisfaction with the resources
made available for monitoring and enforcement of sectoral minimum wages. Moreover, the
role of Works Councils is limited by their small presence among the large number of small
companies, especially in the construction sector (Bosch and Weinkopf 2010: 29).
The third policy issue is that an active MW policy appears to be beneficial for social
dialogue. In Germany, where an industry minimum standard has been established the
empirical evidence in the national report suggests that social dialogue has been strengthened.
And especially in the UK, with its tradition of adversarial industrial relations, the 11 years
experience of a statutory national MW demonstrates that an independent tripartite body, the
Low Pay Commission, can command a strong reputation among all social partners and, it is
claimed, generate a positive spillover effect for social dialogue more generally. Professor
William Brown, a founder Member of the Low Pay Commission (1999 until 2007), claims
the Low Pay Commission has functioned as a successful forum for social dialogue between
unions and employers and has made a positive contribution to social partnership in the UK
(Brown 2000). The strongly consultative style of the Low Pay Commission and its
reputation as a leading exemplar of evidence-based policy making means that active policy
developments in MW regulation in the UK enjoy relatively stable foundations.
The fourth issue concerns the links with pay equity policy goals. Many studies identify a
relatively strong set of inter-linkages between MW policy (especially concerning the relative
level of the MW), the model of collective bargaining and pay equity measures such as the
gender pay gap and the incidence of low wage work. Our review of European wage data
(section 4) provides further confirmation of a relatively strong negative relationship between
the level of the MW and the incidence of low wage work and a moderately strong negative
relationship with the risk of low wage work faced by women compared to men. The data at
the company and sector levels analysed in section 5 provide some indication as to how these
aggregate inter-linkages are articulated through processes and outcomes of pay bargaining.
In Spain, for example, the authors of the national report call attention to widespread
undervaluation of jobs that are female-dominated, resulting in low pay for ‘female skills’;
‘Jobs in retail, hospitality and cleaning are considered to be low skill activities that largely
reflect ‘female skills’ and which are not reflected in professional skills. This social
construction of skill is what has traditionally made these activities low wage activities’

Comparative Report 67
(Banyuls et al. 2010: 30). The German cleaning sector collective agreement provides a
valuable illustration of the gender bias in pay grading. Unlike most other sector-specific
minimum wages in Germany it contains two minimum wages, which appear to have been
designed in part to account for the gender difference among workers employed to clean
indoors and outdoors. In 2010, the male-dominated job of ‘outdoor cleaning’ (eg. windows
and shopfronts) earned a minimum hourly rate of €11.13 and the female-dominated job of
‘indoor cleaning’ a rate of €8.40 (rates for western Germany) – a gender pay gap of 25%.
Remarkably, the gap is even wider (29%) among supervisors of the respective jobs with
rates of €14.20 and €10.04, respectively.
The UK data provide further clues as to why the rising statutory national MW during 2003-
2007 did nothing to reduce the incidence of low wage work: bottom-weighted pay deals in
some cases overly compressed pay differentials among the low paid rather than
redistributing income from the highest to lowest paid; and the power of clients in contracting
for low paid business services sometimes frustrated employer-union efforts to upgrade pay
and skills. Finally, in Germany, while in principle a rising sector MW ought to generate a
strong ripple effect due to the collectively bargained wage grid, in practice a smaller ripple
effect occurs because of problems with compliance and the changing classification of jobs so
as to pay lower wage rates.

Comparative Report 68
Appendix
Table A1. Union membership and collective bargaining coverage, 2006
Inclusive model Dual model Exclusive model Union
density CB
coverage Union
density CB
coverage Union
density CB
coverage Belgium 54 96 Austria 32 99 Czech Rep. 21 44 Denmark 69 82 Germany 21 63 Hungary 18 35 Finland 72 90 Greece 23 85 Ireland 31 44 Sweden 75 92 Spain 15 80 Lithuania 14 12 France 8 95 Latvia 16 20 Italy 33 80 Poland 14 35 Netherlands 22 82 Slovakia 24 35 Portugal 18 62 UK 29 34 Slovenia 41 100 Estonia 13 22 Luxembourg 40 60 Croatia 34 61 Average 68 90 Average 26 80 Average 20 31 Source: ICTWSS dataset (Visser 2010), except Croatia (Nestic and Bakarić 2010) and Ireland (eiro data).

Comparative Report 69
Table A2. Summary of interviews undertaken by the five country teams
Sector Employer/trade bodies Trade unions Companies/local unions Other Croatia Construction: Construction employers’ association
(HUP-UPG) Trade union of construction industry (SGH)
Clothing: Textile and leather industry employers’ association (HUP-UTKI)
Croatian trade union for textile, footwear, leather and rubber (TOKG)
ClothCo
Retail: Employers’ trade association (HUP-UT)
Commercial trade union (STH) RetailCo
Total number of interviews: 12
Germany Construction: Construction employer associations (HDB, ZDB, ZVOB, BVMB)
Construction trade union (IG BAU)
Cleaning: Cleaning sector employer association (BIV)
Cleaning trade union (IG BAU)
Temp agency: Temp agency employer associations (BZA and IGZ)
German federation of trade unions (DGB) Large temp agency company (round table with several managers and works council)
Total number of interviews: 16
Hungary Retail: National Commerce Federation (OKSZ)
Trade Union of Commercial Employees (KASZ)
Local union at Retailco
Construction: National Federation of Hungarian Contractors (EVOSZ)
Federation of Building, Wood and Material Workers’ Unions (ÉFÉDOSZSZ)
BuildCo manager
Small business owner
Local union at BuildCo
Security: Employer Association of Hungarian Security Companies (MBVMSZ)
National Alliance of Property Security Trade Unions (VSZOSZ)
Two security firms
Local union at SecurityCo
Total number of interviews: 13
Spain Retail: Valencian retail employers’ association (FEMEVAL, FEDACOVA, COVACO)
Retail trade union representatives (CCOO and UGT)
Union representative in the Economic and Social Council (CES)
Hospitality: Valencian hospitality employers association (FEHV)
Hospitality trade union representatives (CCOO and UGT)
Research centre on tourism in Valencia
Cleaning: Valencian cleaning employers’ association (APELVA), National employers association (ASPEL)
Cleaning trade union representative (CCOO)
Total number of interviews: 13

Comparative Report 70
UK Retail: -- Usdaw, Senior pay negotiator
Usdaw, Research team leader
RetailCo, Senior HR manager
Cleaning: British Institute of Cleaning Science, Chief Accreditation Officer
Unison, Senior pay negotiator (NHS)
Unison, Senior pay negotiator (private contractors)
CleanCo, Senior HR manager
ServiceCo, Senior HR manager
SMECleanCo, Managing Director
Security: British Security Industry Asociation, General manager
GMB, Senior pay negotiator SecurityCo, Senior HR manager (Europe region)
SecurityCo, Senior HR manager (UK)
SecurityCo, Senior HR manager (security services division)
SMESecureCo, Managing Director
Total number of interviews: 15

Comparative Report 71
References The five national reports undertaken for this research project are as follows: (All reports available at: www.mbs.ac.uk/research/europeanemployment/projects/minimum-
wage.aspx.) Banyuls, J., Cano, E. and Aguado, E. (2010) ‘Minimum wage systems and changing
industrial relations: National report Spain’.
Bosch, G. and Weinkopf, C. (2010) ‘Minimum wage systems and changing industrial relations: National report Germany’.
Grimshaw, D., Shepherd, C. and Rubery, J. (2010) ‘Minimum wage systems and changing industrial relations: National report UK’.
Nestić, D. and Bakarić, I. R. (2010) ‘Minimum wage systems and changing industrial relations: National report Croatia’.
Neumann, L. (2010) ‘Minimum wage systems and changing industrial relations: National report Hungary’.
All other references: Addison, J. T., Bailey, R. and Siebert, W. S. (2003) ‘The impact of deunionisation on
earnings dispersion revisited’, IZA Discussion Paper No. 724.
Alber, J. (2010) ‘What – if anything – is undermining the European Social Model?’ WZB Discussion Paper, No. SP I 2010 – 202, WZB Berlin.
Arrowsmith, J. and Marginson, P. (2008) ‘Wage flexibility in Europe’, EIRO, available at http://www.eurofound.europa.eu/eiro/studies/tn0803019s/tn0803019s.htm.
Bazen, S. (2000) ‘The impact of the regulation of low wages on inequality and labour market adjustment: a comparative analysis’, Oxford Review of Economic Policy, 16 (1): 57-69.
Blackburn, S. (1988) ‘The problem of riches: From trade boards to a national minimum wage’, Industrial Relations Journal 19 (2): 124–38.
Blau, F.D. and L.M. Kahn (1992) ‘The Gender Earnings Gap: Learning from International Comparisons’, American Economic Review, 82, 2: 533-38.
Bosch, G. and Kalina, T. (2009) ‘What role for minimum wages on low wage work?’ in D. Vaughan-Whitehead (ed.).
Bosch, G., Mayhew, K. and Gautié, J. (2010) ‘Industrial relations, legal relations and wage setting’, in J. Gautié and J. Schmitt (eds.).
Bosch, G. and Weinkopf, C. (eds.) (2008) Low-Wage Work in Germany, New York: Russell Sage Foundation.
Brosnan, P. (2003) ‘The political economy of the minimum wage’, in B. Burchell, S. Deakin, J. Michie and J. Rubery (eds.) Systems of Production: Markets, Organisation and Performance, London: Routledge.
Brown, W. (2009) ‘The process of fixing the British National Minimum Wage’, British Journal of Industrial Relations, 47 (2): 429-443.
Brown, W. (2000) ‘Putting partnership into practice in Britain’, British Journal of Industrial Relations, 38 (2): 299-316.
Card, D. and Krueger, A. (1995) Myth and Measurement: the New Economics of the Minimum Wage, Princeton.

Comparative Report 72
Checchi, D., Visser, J. and van de Werfhorst, H. G. (2010) ‘Inequality and union membership: The influence of relative earnings and inequality attitudes’, British Journal of Industrial Relations, 48 (1): 84-108.
Colling, T. and Dickens, L. (1998) ‘Selling the case for gender equality: Deregulation and equality bargaining’, British Journal Of Industrial Relations, 36: 389-411.
Dickens, L. (2000) ‘Collective bargaining and the promotion of gender equality at work: Opportunities an challenges for trade unions’, Transfer, 6 (2): 193-208.
EC (2008) Industrial Relations in Europe, Brussels: European Commission.
Eironline (2010) ‘Fourth year without a boost in statutory minimum pay’, www.eurofound.europa.eu/eiro/2010/01/articles/fr1001039i.htm, (accessed July 2010).
Eurostat (2009) ‘Minimum wages in January 2009’, Eurostat Data in Focus, 29/2009.
Eurostat (2008) ‘Minimum wages 2008’, Statistics in Focus, 105/2008.
Erickson, C., Fisk, C., Milkman, R., Mitchel, D. and Won, K. (2002) ‘Justice for janitors in Los Angeles: Lessons from three rounds of negotiations’, British Journal of Industrial Relations, 40 (3): 543-567.
Eyraud, F. and Saget, C. (2005) The Fundamentals of Minimum Wage Fixing, Geneva: ILO.
Falk, A. and Huffman, D. (2007) Studying labor market institutions in the lab: minimum wages, employment protection and workfare, Journal of Institutional and Theoretical Economics, 163 (1): 30-45.. Freeman, R. B. (ed.) (1994) Working under Different Rules, NBER Research Volume. New
York: Russell Sage Foundation Press.
Freeman, R. B. (1996) ‘The minimum wage as a redistributive tool’, Economic Journal, 106 (May): 639-649.
Funk, L. and Lesch, H. (2006) ‘Minimum wage regulations in selected European countries’, Intereconomics, 41 (2): 78-92.
Gallie, D. (2007) ‘Production regimes, employment regimes and the quality of work’, in D. Gallie (ed.) Employment Regimes and the Quality of Work, Oxford: OUP.
Gautié, J. (2009) ‘France: Towards the end of an active minimum wage policy?’, in D Vaughan-Whitehead (ed.).
Gautié, J. and Schmitt, J. (2010) Low-Wage Work in the Wealthy World, New York: Russell Sage Foundation.
Gereffi, G. (2005) ‘The global economy: organization, governance and development’, Chapter 8 in N. Smelser and R. Swedberg (eds.) Handbook of Economic Sociology, Princeton: Princeton University Press.
Grimshaw, D. (2010) ‘What do we know about low wage work and low wage workers?’, ILO Working Paper, Geneva: ILO (forthcoming).
Grimshaw, D. (2004) ‘British living wage and low wage campaigns’, in D. Figart (ed.) Living Wage Movements: Global Perspectives, New York: Routledge. Grimshaw, D. and Carroll, M. (2006) ‘Adjusting to the National Minimum Wage:
constraints and incentives to change in six low paying sectors’, Industrial Relations Journal, 37 (1): 22-47.
Hassel, A. (2006) Wage-Setting, Social Pacts and the Euro: A New Role for the State, Amsterdam: Amsterdam University Press.
Heery, E. (2000) ‘Trade unions and the management of reward’, in G. White and J. Drucker (eds.) Reward Management: Critical Perspectives, London: Routledge.

Comparative Report 73
Heymann, J. and Earle, A. (2010) Raising the Global Floor: Dismantling the Myth that we Can’t Afford Good Working Conditions for Everyone, Stanford University Press.
Hofbauer, I. and Adam, G. (2009) ‘New monthly minimum wage for private sector’, EIRO online (accessed June 2010).
ILO (2009) Global Wage Report 2008/2009: Minimum Wages and Collective Bargaining, Towards Policy Coherence, Geneva: ILO.
Kohl, H. and Platzer, H.-W. (2007) ‘The role of the state in Central and Eastern European industrial relations: The case of minimum wages’, Industrial Relations Journal, 38 (6): 614-635.
Kohl, H. and Platzer, H.-W. (2006) ‘Minimum wages in Central and Eastern Europe’, in T. Schulten, R. Bispinck and C. Schäfer (eds.).
LPC. (2009) National Minimum Wage. Low Pay Commission Report 2009, London: The Stationery Office.
LPC. (2003) The National Minimum Wage: Building on Success. Fourth Report of the Low Pay Commission, (March) London: The Stationery Office (Cm 5768).
Lucifora, C., McKnight, A. and Salverda, W. (2005) ‘Low-wage employment in Europe: a review of the evidence’, Socio-Economic Review, 3 (2): 259-292.
Machin, S. and Manning, A. (1994) ‘The effects of minimum wages on wage dispersion and employment: Evidence from the UK Wages Councils’, Industrial and Labor Relations Review, 47: 319-329.
Masso, J. and Krillo, K. (2009) ‘Estonia, Latvia and Lithuania: Minimum wages in a context of migration and labour shortages’, in D. Vaughan-Whitehead (ed.).
McLaughlin, C. (2009) ‘The productivity-enhancing impacts of the minimum wage: Lessons from Denmark and New Zealand’, British Journal of Industrial Relations, 47 (2): 327-348.
Metcalfe, D., Hansen, K. and Charlwood, A. (2001) ‘Unions and the sword of justice: Unions and pay systems, pay inequality, pay discrimination and low pay’, National Institute Economic Review, 176: 61-75.
Nolan, B. (2009) ‘Ireland: A successful minimum wage implementation?’, in D. Vaughan-Whitehead (ed.).
Pollin, R., Brenner, M., Wicks-Lim, J. And Luce, S. (2008) A Measure of Fairness: The Economics of Living Wages and Minimum Wages in the United States, Cornell University Press.
Rowthorn, B. (1992) ‘Centralisation, employment and wage dispersion’, The Economic Journal, 102: 506-523.
Rubery, J. and Fagan, C. (1995) ‘Comparative industrial relations research: towards reversing the gender bias’, British Journal of Industrial Relations, 33 (2): 209-236.
Rubery, J., Grimshaw, D. and Figueiredo, H. (2005) ‘How to close the gender pay gap in Europe: Towards the gender mainstreaming of pay policy’, Industrial Relations Journal, 36 (3): 184-213.
Sachdev, S. and F. Wilkinson (1998) ‘Low pay, the working of the labour market and the role of a minimum wage’, London: Institute of Employment Rights.
Salverda, W. and Mayhew, K. (2009) ‘Capitalist economies and wage inequality’, Oxford Review of Economic Policy, 25 (1): 126-154.

Comparative Report 74
Schmid, B. and Schulten, T. (2006) ‘The French minimum wage (SMIC)’, in T. Schulten, R. Bispinck and C. Schäfer (eds.).
Schulten, T. (2006) ‘Statutory and collectively agreed minimum wages in Europe: An international perspective’, in T. Schulten, R. Bispinck and C. Schäfer (eds.).
Schulten, T., Bispinck, R. and Schäfer, C. (eds.) (2006) Minimum Wages in Europe, Brussels: ETUI-REHS.
Skedinger, P. (2009) ‘Sweden: A minimum wage model in need of modification?’, in D. Vaughan-Whitehead (ed.).
Standing, G. and Vaughan-Whitehead, D. (1995) Minimum Wages in Central and Eastern Europe: From Protection to Destitution, Budapest: Central European University Press.
Sniekers, F. (2010) ‘The impact of labour market institutions on earnings inequality’, Mimeo, Amsterdam: AIAS.
Traxler, F., Blaschke, S. and Kittel, B. (2001) National Labour Relations in Internationalised Markets, Oxford: OUP.
Turner, H. A. (1952) ‘Trade unions, differentials and the levelling of wages’, The Manchester School, 20 (3): 227-282.
Vaughan-Whitehead, D. (ed.) (2009a) The Minimum Wage Revisited in the Enlarged EU, Geneva: ILO.
Vaughan-Whitehead, D. (2009b) ‘Minimum wage revival in the enlarged EU: explanatory factors and developments’, in D. Vaughan-Whitehead (ed.).
Visser, J. (2010) ‘Institutional Characteristics of Trade Unions, Wage Setting, State Intervention and Social Pacts (ICTWSS) Database’, Amsterdam: AIAS. www.uva-aiasnet.
Visser, J. (2009) ‘The ICTWSS database: Database on institutional characteristics of trade unions, wage-setting, state intervention and social pacts in 34 countries between 1960 and 2007’, Version 2, Amsterdam Institute for Advanced Labour Studies. http://www.uva-ias.net/uploaded_files/regular/TheICTWSSDatabaseandcodebook.pdf.
Visser, J. and Checchi, D. (2009) ‘Inequality and the labour market: unions’, in W. Salverda, B. Nolan and T. Smeeding (eds.) Oxford Handbook on Economic Inequality, Oxford: OUP.
Wicks-Lim, J. (2008) ‘Mandated wage floors and the wage structure: new estimates of the
ripple effects of minimum wage laws’, in Pollin et al. (ed.).
Woolfson, C. and Sommers, J. (2006) ‘Labour mobility in construction: European implications of the Laval un Partneri dispute with Swedish labour’, Journal of Industrial Relations, 12 (1): 49-68.
Woolfson, C., Thornqvist, C. and Sommers, J. (2010) ‘The Swedish model and the future of labour standards after Laval’, Industrial Relations Journal, 41 (4): 333-350.