minimum sand transportation conditions in multiphase
TRANSCRIPT
Minimum sand transportation conditions in multiphase pipelines: an assessment exercise
Zhang Zhou and Liyun Lao Oil and Gas Engineering Centre, Cranfield University, Bedfordshire, MK43 0AL, United Kingdom
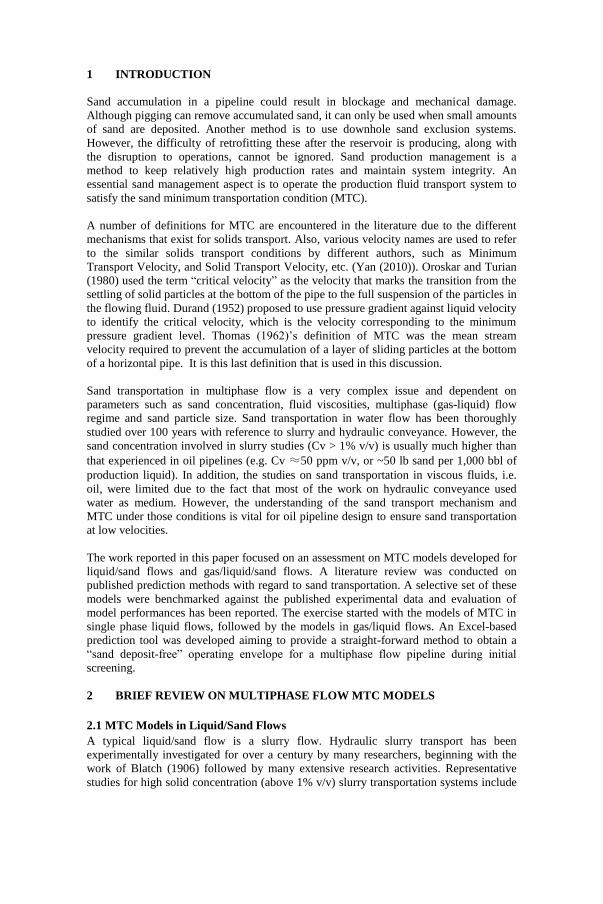
NOMENCLATURES
d particle diameter m f fanning friction factor - g gravitational acceleration m·s-2 qs volumetric flow rate per bed width m3·s-1
m, n constants - s particle density/liquid density -
uo* friction velocity at MTC for infinite dilution m·s-1
uc* friction velocity at minimum transport condition m·s-1
ut terminal settling velocity m·s-1 Cv sand volume fraction, v/v - D pipe diameter m FL Durand coefficient - Fr Froude number -
GVF gas void fraction - K coefficients m·s-1
MTC minimum transport condition - Vm mixture flow velocity m·s-1 Vc critical transport velocity m·s-1 Vs particle slip velocity m·s-1 VL single phase liquid velocity m·s-1 VSL superficial liquid velocity m·s-1 VSG superficial gas velocity m·s-1
δ laminar sublayer thickness m μl liquid viscosity Pa·s ν kinematic viscosity m2·s-1 ρg gas density kg·m-3 ρl liquid density kg·m-3
ρp particle density kg·m-3
sφ dimensionless sand transport rate -
Ω function of CV - Ψ Wicks’ dimensionless group -
L dimensionless liquid flowrate -
1 INTRODUCTION
Sand accumulation in a pipeline could result in blockage and mechanical damage.
Although pigging can remove accumulated sand, it can only be used when small amounts
of sand are deposited. Another method is to use downhole sand exclusion systems.
However, the difficulty of retrofitting these after the reservoir is producing, along with
the disruption to operations, cannot be ignored. Sand production management is a
method to keep relatively high production rates and maintain system integrity. An
essential sand management aspect is to operate the production fluid transport system to
satisfy the sand minimum transportation condition (MTC).
A number of definitions for MTC are encountered in the literature due to the different
mechanisms that exist for solids transport. Also, various velocity names are used to refer
to the similar solids transport conditions by different authors, such as Minimum
Transport Velocity, and Solid Transport Velocity, etc. (Yan (2010)). Oroskar and Turian
(1980) used the term “critical velocity” as the velocity that marks the transition from the
settling of solid particles at the bottom of the pipe to the full suspension of the particles in
the flowing fluid. Durand (1952) proposed to use pressure gradient against liquid velocity
to identify the critical velocity, which is the velocity corresponding to the minimum
pressure gradient level. Thomas (1962)’s definition of MTC was the mean stream
velocity required to prevent the accumulation of a layer of sliding particles at the bottom
of a horizontal pipe. It is this last definition that is used in this discussion.
Sand transportation in multiphase flow is a very complex issue and dependent on
parameters such as sand concentration, fluid viscosities, multiphase (gas-liquid) flow
regime and sand particle size. Sand transportation in water flow has been thoroughly
studied over 100 years with reference to slurry and hydraulic conveyance. However, the
sand concentration involved in slurry studies (Cv > 1% v/v) is usually much higher than
that experienced in oil pipelines (e.g. Cv ≈50 ppm v/v, or ~50 lb sand per 1,000 bbl of
production liquid). In addition, the studies on sand transportation in viscous fluids, i.e.
oil, were limited due to the fact that most of the work on hydraulic conveyance used
water as medium. However, the understanding of the sand transport mechanism and
MTC under those conditions is vital for oil pipeline design to ensure sand transportation
at low velocities.
The work reported in this paper focused on an assessment on MTC models developed for
liquid/sand flows and gas/liquid/sand flows. A literature review was conducted on
published prediction methods with regard to sand transportation. A selective set of these
models were benchmarked against the published experimental data and evaluation of
model performances has been reported. The exercise started with the models of MTC in
single phase liquid flows, followed by the models in gas/liquid flows. An Excel-based
prediction tool was developed aiming to provide a straight-forward method to obtain a
“sand deposit-free” operating envelope for a multiphase flow pipeline during initial
screening.
2 BRIEF REVIEW ON MULTIPHASE FLOW MTC MODELS
2.1 MTC Models in Liquid/Sand Flows
A typical liquid/sand flow is a slurry flow. Hydraulic slurry transport has been
experimentally investigated for over a century by many researchers, beginning with the
work of Blatch (1906) followed by many extensive research activities. Representative
studies for high solid concentration (above 1% v/v) slurry transportation systems include

Durand and Condolios (1953), Durand (1953), Thomas (1962), Wicks (1971), Oroskar
and Turian (1980) etc. As mentioned above, typical sand loading or sand volumetric
concentration in offshore or subsea applications are much smaller than most industrial
slurry transport applications (Yan (2010)). There have only been a few experimental
studies focused on solid/liquid transportation at relatively low solid concentration levels
to date, including Thomas (1962), Robinson and Graf (1972), Al-lababidi et al. (2012)
and Yan(2010).
MTC modelling for liquid/sand flows was therefore initiated for slurry flows. Durand and
Condolios (1953) developed a MTC prediction correlation based on their tests on the
critical velocity with the particle diameters ranging from 0.2 mm to 25 mm. Solid
concentration ranged from 2% to 23% and the pipe diameter ranged from 37.5 mm to
700 mm. The proposed correlation to predict Vc was based on the Froude number of the
pipe as follows:
𝑉𝐶 = 𝐹𝐿√2𝑔𝐷(𝑠 − 1) (1)
where FL is the Durand factor based on the particle size and volumetric concentration.
Thomas (1962)’s MTC correlation considered two aspects when analysing the vertical
distribution of particles in suspended flow. The first was the ratio between terminal
settling velocity and the friction velocity (𝑢𝑡/𝑢0∗); the second was the thickness of the
laminar sublayer and buffer layer as well as the turbulent core. This (𝑢𝑡/𝑢0∗) denotes the
particle settling tendency relative to the turbulence driving force to keep particles
suspended. Thomas also proposed the lower model and the upper model with the criteria
of whether the particle size is bigger than the thickness of the sublayer. His correlation
for the friction velocity 𝑢𝑜∗ , the friction velocity at minimum transport conditions for
infinite dilution, were presented as follows:
𝑢𝑜∗ = [100𝑢𝑡 (
𝜈
𝑑)
2.71
]0.269
, 𝑑 < 𝛿
and
𝑢𝑜∗ = [0.204𝑢𝑡 (
𝜈
𝑑) (
𝜈
𝐷)
−0.6
(𝑠 − 1)−0.23]0.714
, 𝑑 > 𝛿
Thomas then developed the correlation between 𝑢𝑐∗, the friction velocity at the MTC, and
𝑢𝑜∗ . The correlation, based on experimental data of his 1-inch facilities and other data,
was:
𝑢𝑐∗ = 𝑢0
∗ [1 + 2.8 (𝑢𝑡
𝑢0∗)
0.33
√𝐶𝑣] (2)
The actual MTC velocity is obtained by using:
𝑉𝐶 = 𝑢𝑐∗/(𝑓/2)0.5 (3)

where 𝑓 is the Fanning friction factor. Note that the velocities used in the Thomas MTC
model are in foot/second.
The MTC correlation proposed by Turian et al (1987) was also mainly focused on slurry
flow and takes similar form to Equation (1). Particles are treated as non-colloidal. Flow
velocity lower than the critical velocity would result in sand bed formation. Sand is
considered to deposit under the condition of fully suspended flow and particles are
assumed to be regularly shaped with uniform size. The correlation is as follows:
𝑉𝐶 = 1.7951𝐶𝑣0.109(1 − 𝐶𝑣)0.25 [
𝐷𝜌𝑙√𝑔𝐷(𝑠−1)
𝜇]
0.0018
(𝑑
𝐷)
0.06623√2𝑔𝐷(𝑠 − 1) (4)
Based on turbulence theory, Davies (1987) developed his MTC prediction correlation.
Davies calculated the sedimentation force and the eddy fluctuation force and assumed
that, below the MTC, the two forces are balanced. MTC velocity is calculated using:
𝑉𝑐 = 1.08(1 + 3.64𝐶𝑣)1.09(1 − 𝐶𝑣)0.55𝑛ν−0.09𝑑0.18[2𝑔(𝑠 − 1)]0.54𝐷0.46 (5)
where n is the correction index due to the sand concentration.
Salama (2000)’s predictions of MTC also uses the approach based on the theory of
turbulence. Some of its parameters were determined according to experimental data, and
the final correlation was given as:
𝑉𝑐 = (𝑉𝑠𝐿
𝑉𝑚)
0.53𝑑0.17𝜈0.09(𝑠 − 1)0.55𝐷0.47 (6)
where 𝑉𝑠𝐿/𝑉𝑚 is the ratio between liquid superficial velocity and mixture velocity of
multiphase flows. The equation covers the cases of both the liquid/sand and the
gas/liquid/sand flows.
Danielson (2007)’s MTC correlation for liquid/solid flows was developed considering
the pipe inner diameter and properties of solid and fluid. The critical assumption of the
theory is that there is a slip velocity between the liquid velocity and the sand velocity and
that the slip velocity would remain relatively constant over a wide range of liquid
velocities. Based on this assumption, the correlation for single phase could be written as:
𝑈𝐶 = 𝐾𝜈−𝑛
2−𝑛d𝑛
2−𝑛(𝑔𝐷(𝑠 − 1))1
2−𝑛 (7)
The best fit to experimental data gives K = 0.23 and n = 1/5. This correlation is
dimensionally consistent in terms of velocity.
From what has been reviewed here, it can be seen that the predictions of sand transport
are mainly based on two approaches. The first is focused on analysing forces on single
particles (gravity, lift, drag forces and buoyancy) which could roll the particle
downstream. The other approach is based on the theory of turbulence which is energy
dissipated from turbulent eddies. Both approaches result in similar models.

2.2 MTC Models in Gas/Liquid/Sand Flows
The MTC models involving liquid/gas/sand have also been reviewed during this study,
and a few of the typical models are briefly introduced below.
King, Fairhurst and Hill (2001) Model (referred as KFH model) King et al. developed a model based on the concept of minimum pressure gradient. This
model is an extension from the Thomas (1962) minimum transportation condition
prediction in single phase to two-phase MTC prediction, as shown in Section 2.1. After
the friction velocity is obtained using Thomas correlations, the friction pressure drop at
MTC could be calculated using:
|∆𝑃
∆𝑥|
𝑀𝑇𝐶=
4𝜌𝑙(𝑢𝑐∗)2
𝐷 (8)
where 𝑢𝑐∗ = (𝑓/2)0.5𝑉𝐶 is the friction velocity corresponding to the MTC critical
velocity. In two-phase gas-liquid pipelines, if the pressure drop calculated using Beggs &
Brill correlations is greater than the pressure drop at MTC, particles would be
transported.
Yan (2010) Model Yan developed a new correlation for friction velocity in his paper which is an extension
of the KFH model. Two correlations were used to differentiate the effects of particle
volume concentration, as follows:
𝑢𝑐∗ = 𝑢𝑜
∗ + 0.7176𝐶𝑣0.5099, 𝐶𝑣 < 0.0005 (9)
𝑢𝑐∗ = 𝑢𝑜
∗ + 0.0776𝐶𝑣0.2032, 𝐶𝑣 ≥ 0.0005 (10)
Then Equation (8) was used to calculate the critical pressure gradient for keeping sand
particles in suspension in the liquid.
Oudeman (1993) Correlation Oudeman developed his correlation based on a series of experimental data. In his model,
he created two dimensionless parameters: the sand transport rate 𝜑𝑠 and the fluid flow
rate Ψ𝐿.
𝜑𝑠 =𝑆′
√𝑑𝑝3𝑔(𝑠−1)
(11)
Ψ𝐿 =𝑈𝑏
2
𝑔𝑑𝑝(𝑠−1) (12)
where 𝑆′ is the transport rate which could be defined as volume of sand transported per
second per sand bed width in metres. 𝑈𝑏 is the fluid drag velocity. The sand transport rate
𝜑𝑠 could be described as a function of the fluid flow rate Ψ𝐿.
𝜑𝑠 = 𝑚Ψ𝐿𝑛 (13)
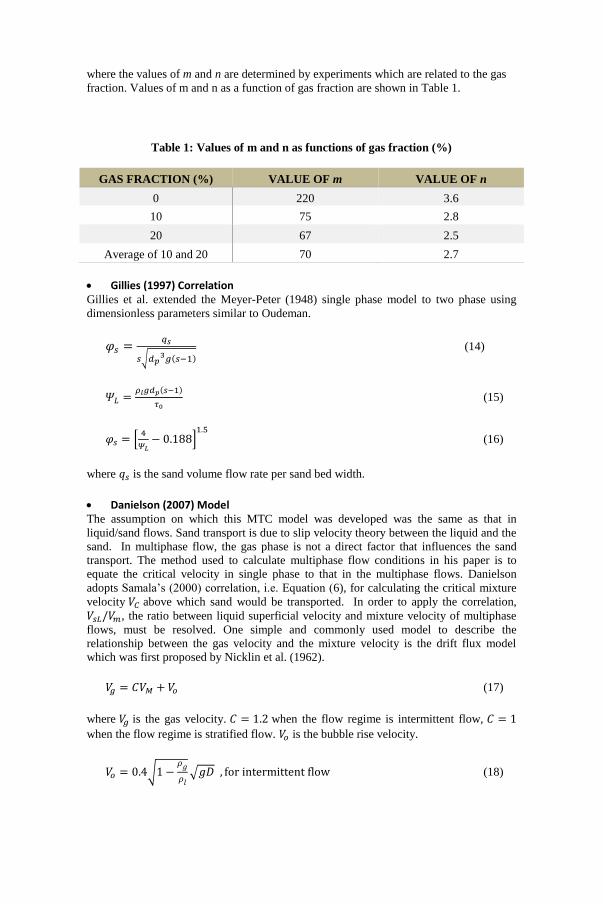
where the values of m and n are determined by experiments which are related to the gas
fraction. Values of m and n as a function of gas fraction are shown in Table 1.
Table 1: Values of m and n as functions of gas fraction (%)
GAS FRACTION (%) VALUE OF m VALUE OF n
0 220 3.6
10 75 2.8
20 67 2.5
Average of 10 and 20 70 2.7
Gillies (1997) Correlation Gillies et al. extended the Meyer-Peter (1948) single phase model to two phase using
dimensionless parameters similar to Oudeman.
𝜑𝑠 =𝑞𝑠
𝑠√𝑑𝑝3𝑔(𝑠−1)
(14)
𝛹𝐿 =𝜌𝑙𝑔𝑑𝑝(𝑠−1)
𝜏0 (15)
𝜑𝑠 = [4
𝛹𝐿− 0.188]
1.5 (16)
where 𝑞𝑠 is the sand volume flow rate per sand bed width.
Danielson (2007) Model The assumption on which this MTC model was developed was the same as that in
liquid/sand flows. Sand transport is due to slip velocity theory between the liquid and the
sand. In multiphase flow, the gas phase is not a direct factor that influences the sand
transport. The method used to calculate multiphase flow conditions in his paper is to
equate the critical velocity in single phase to that in the multiphase flows. Danielson
adopts Samala’s (2000) correlation, i.e. Equation (6), for calculating the critical mixture
velocity 𝑉𝐶 above which sand would be transported. In order to apply the correlation,
𝑉𝑠𝐿/𝑉𝑚, the ratio between liquid superficial velocity and mixture velocity of multiphase
flows, must be resolved. One simple and commonly used model to describe the
relationship between the gas velocity and the mixture velocity is the drift flux model
which was first proposed by Nicklin et al. (1962).
𝑉𝑔 = 𝐶𝑉𝑀 + 𝑉𝑜 (17)
where 𝑉𝑔 is the gas velocity. 𝐶 = 1.2 when the flow regime is intermittent flow, 𝐶 = 1
when the flow regime is stratified flow. 𝑉𝑜 is the bubble rise velocity.
𝑉𝑜 = 0.4√1 −𝜌𝑔
𝜌𝑙√𝑔𝐷 , for intermittent flow (18)

𝑉𝑜 = 𝑉𝑠𝑙√1 −𝜌𝑔
𝜌𝑙 , for separated flow (19)
Assuming the liquid holdup 𝐻𝑙 is known, the liquid velocity can be obtained by using:
𝑉𝑙 = 𝑉𝑠𝑙/𝐻𝑙 (20)
The overall hold-up 𝐻𝑜 is calculated as
𝐻𝑜 = 𝐻𝑙 + 𝐻𝑠 (21)
where 𝐻𝑠 is the sand hold-up, usually a very small value. In this MTC, instead of the
local liquid velocity 𝑉𝑙 , Danielson considered the slip velocity (𝑉𝑙 − 𝑉𝑠), where 𝑉𝑠 is the
sand velocity. Thus,
𝑉𝑐 = 𝑉𝑠𝑙/(𝐻𝑜 − 𝐻𝑠) − 𝑉𝑠𝑠/𝐻𝑠 (22)
or
𝑉𝑐𝐻𝑠2 + (𝑉𝑠𝑙 + 𝑉𝑠𝑠 − 𝑉𝑐𝐻𝑜)𝐻𝑠 − 𝑉𝑠𝑠𝐻𝑜 = 0 (23)
where 𝑉𝑠𝑙 and 𝑉𝑠𝑠 are the liquid and sand superficial velocities respectively. Combining
the Equations (6) and (17-23), the critical velocity can be obtained.
To our knowledge, the Danielson model and KFH models are widely used in the oil and
gas industry for the initial screening of sand deposition risk in pipelines; thus, in this
study the models (including the modified models) were selected to be benchmarked
against the published experimental data.
3 RESULTS
3.1 Liquid/Sand Flows
Typical MTC correlations for liquid/sand flows were compared. Two experimental
datasets chosen for benchmarking were Yan (2010) and Robinson (1972). Yan (2010)
data includes the results from the tests in a 2-inch pipe with sand concentrations varying
from 5 lb/1000bbl (~5 ppm v/v) to 50 lb/bbl (~0.05 v/v) and in a 4-inch pipe with sand
concentrations also varying from 5 lb/1000bbl (~5 ppm v/v) to 50 lb/1000bbl (~50 ppm
v/v). The particle nominal size was 200 µm. Robinson’s (1972) data includes the results
from tests in a 4-inch pipe with nominal particle sizes of 450 µm and 880 µm; the sand
concentration ranges were 5 to 650 ppm v/v and 0.0012 to 0.05 v/v, respectively.

a) Models vs. Yan (2010), 2-inch i.d., sand nominal size of 200 µm
b) Models vs. Yan (2010), 4-inch i.d., sand nominal size of 200 µm

c) Models vs. Robinson (1972), 4-inch i.d., sand nominal size of 450 µm
d) Models vs. Robinson (1972), 4-inch i.d. sand nominal size of 880 µm
Figure 1: Comparisons between the predicted MTC and experimental results
As sand concentration is an important factor which influences the transport velocity and
it is the main variable in the experiments, it was chosen to be the horizontal axis. Figure 1
(a) and Figure 1 (b) show the comparisons between the predictions by different MTC
models and Yan (2010) data. Figure 1 (c) and Figure 1 (d) show the comparisons
between the MTC model predictions against Robinson (1972) data.
With regard to the experimental data above, the prediction performance of MTC models
can be assessed by examining the plots in Figure 1 using the ‘mean square error’ method
which indicates the level of deviation of predictions. Overall, the Turian (1987)
correlation gives the best fit with regard to all of the test data sets. The Thomas (1962)

correlation was consistent with experimental data but has a larger deviation than that of
Turian (1987). It has no specific term for concentration factor but the prediction still
varies against the particle concentration, due to settling velocity being included in the
model. The Davies (1987) correlation changes fairly gradually with the solid
concentration. The Danielson (2007) correlation has no factor related to solid
concentration; thus, the prediction stays at a constant value.
3.2 Gas/Liquid/Sand Flows
3.2.1 Danielson (2007) MTC model
The datasets chosen to evaluate the performance of the Danielson (2007) model were
those from Yan (2010) and Najmi (2015). Yan’s data covers 2-inch and 4-inch pipes with
sand concentrations varying from 15 lb/1000bbl (~15 ppm v/v) to 500 lb/1000bbl ((~500
ppm v/v); the nominal particle size was 200 microns. Najmi’s data includes 2-inch and 4-
inch pipes with sand concentrations varying from 0.01% to 0.1% (v/v) in volume
fraction; the nominal particle size was 300 microns. The comparison between the
predicted results and Yan’s experimental results are shown in Figures 2. Likewise the
comparison between the predicted results and Najmi’s experimental results are shown in
Figures 3. Since Danielson’s model omitted the effect of sand concentration, the test data
presented in each figure cover different sand concentrations.
a) Tests of 2 inch pipe with sand nominal size of 200μm

b) Tests of 4 inch pipe with sand nominal size of 200μm
Figure 2: Danielson’s prediction vs. Yan (2010) experimental results
The correlation of gas and mixture velocities in the intermittent flow regime was used. It
can be seen from the plots that the trend of Danielson’s prediction is gentle when the gas
superficial velocity is low and then begins to decline more sharply when the gas
superficial velocity increases. When it increases further, the curve becomes gentle again.
The model gives reasonable predictions compared to Yan (2010) data. However, the
prediction performance is less satisfactory when compared to Najmi’s data. This is
potentially owing to the difference in the definition of sand transport conditions. Yan
(2010)’s definition was “preventing the formation of a sliding sand layer”, where Najmi’s
definition was “all particles are moving in suspension”. In nature, sand transportation
observed by Najmi should be higher than that by Yan at similar conditions. Yan’s data
mainly focused on the intermittent flow regime with the gas superficial velocity for the
majority of points staying below 4 m/s. This is exactly the correlation mentioned in
Danielson (2007). Najmi’s data points mainly stay above the gas superficial velocity of 4
m/s which enters a separated flow regime and correlations for intermittent flow is not
suitable.

a) Tests of 2 inch pipe with sand nominal size of 300μm
b) Tests of 4 inch pipe with sand nominal size of 300μm
Figure 3: Danielson’s prediction vs. Najmi (2015) experimental results

a) 2 inch, 200 µm experiment
b) 4 inch, 200µm experiment
Figure 4: Extended Danielson’s prediction vs. Yan (2010) experimental results

a) 2 inch, 300μm experiment
b) 4 inch, 300μm experiment
Figure 5: Extended Danielson’s prediction vs. Najmi (2015) experimental results
An extension to the Danielson model proposed by Najmi et al (2016) was to apply the
correlation, Equation (19), for the separated flow regimes. Annular flow is one of the
separated flow regimes with high gas rates, thus the extended Danielson model is used,
and the results are presented in Figures 4 and 5. The extended Danielson model gives an
improved prediction performance when compared with the Yan (2010) and Najmi (2015)
test data, when at high superficial gas velocities.
Data gathered from both Yan (2010) and Najmi (2015) are focused on low sand
concentration, Danielson’s extended model can be considered to have a good prediction
performance for general low concentration conditions.

3.2.2 KFH models
For comparison, experimental data identical to that compared with the Danielson Model
are also used to benchmark the KFH models, which include both the original KFH model
and two modified KFH models as follows: (1)Yan (2010) model (a modified KFH model
by 𝑢𝑐∗ calculated using Equations (9) and (10); (2)Turian (1987) based model (a
modified KFH model by 𝑢𝑐∗ calculated using 𝑢𝑐
∗ = (𝑓/2)0.5𝑉𝐶 in combining with
Equation (4)).
Table 2: Mean discrepancy1 between the predicted results of KFH model, Yan
(2010) model, Turian based KFH model and Danielson model against the
benchmark data sets
Datasets
Test Conditions KFH Model Yan’s
Model
Turian
Based
Model
Danielson
Model
Yan
(2010),
200μm
2-inch, 15 lb/1000bbl 0.2817 0.2091 0.1937 0.1584
2-inch, 50 lb/1000bbl 0.4562 0.3141 0.2657 0.2094
2-inch, 100 lb/1000bbl 1.0884 0.7888 0.7092 0.0831
2-inch, 200 lb/1000bbl 1.2898 0.8863 0.8253 0.2991
2-inch, 500 lb/1000bbl 1.7530 1.0418 1.0893 0.7130
4-inch, 15 lb/1000bbl 0.1435 0.0549 0.2235 0.4022
4-inch, 200 lb/1000bbl 0.3702 0.0198 0.5051 0.3064
4-inch, 500 lb/1000bbl 0.3914 0.0270 0.2384 0.1019
AVERAGE 0.7218 0.4177 0.5063 0.2842
Najmi
(2015),
300μm
2-inch, 0.01% 2.6293 2.0308 1.3795 0.7610
2-inch, 0.1% 3.3645 2.0308 1.3795 1.0787
4-inch, 0.01% 2.4828 2.0015 0.8189 0.7221
4-inch, 0.1% 3.1061 1.2233 0.5689 1.3499
AVERAGE 2.8957 1.8216 1.0367 0.9779
The results of the mean discrepancy between the benchmark data sets and the predictions
using the KFH models, including the extended Danielson’s model, are illustrated in
Table 2 and Figure 6. For the convenience of comparison, the mean discrepancies
between the benchmark data sets and the predictions using the extended Danielson model
are also illustrated in Table 2 and Figure 6.
From the comparisons above, Danielson’s model demonstrated a good prediction
performance in general. As for the other three, Yan’s model and the Turian based KFH
1 The mean discrepancy is defined as the square root of the standard deviation resulted
from the differences between model predictions and test results.

model performed fairly well when compared to the Yan (2010) data. Yan’s model is
slightly better because as this model was based on his own data. When compared to
Najmi’s data, the distinctive difference of mean discrepancies demonstrated that the
Turian based KFH model was the best. The comparison with Yan’s data illustrates that
Yan’s model and the Turian correlation-based KFH model are both applicable for
industry prediction.
a) Yan (2010)’s datasets b) Najmi (2015)’s datasets
Figure 6: Mean discrepancy between the predicted results of KFH model, Yan
(2010) model, Turian based KFH model and Danielson model against the
benchmark datasets
4 CONCLUSION AND RECOMMENDATION
This paper has reviewed typical existing MTC models in liquid/sand flows and
gas/liquid/sand flows. Four liquid/sand models, including the Danielson (2007)
correlation, the Turian et al (1987) correlation, the Davies (1987) correlation and the
Thomas (1962) correlation, were selected for assessment. Yan (2010) data and Robinson
(1972) data are used for benchmarking. The Turian et al (1987) correlation appeared to
have the best performance. In gas/liquid/sand flows, the Danielson (2007) model and the
KFH models, including the Yan (2010) model and the Turian correlation-based model,
were selected to be evaluated against the test datasets by Yan (2010) and Najmi (2015). It
appeared that the Danielson model demonstrated the best performance in terms of
average discrepancy against the benchmark datasets.
It is worth noting that the sand transport conditions observed in experiments depend on
the definition of sand transport conditions used by different researchers. Both
Danielson’s model and the Turian correlation-based KFH model demonstrated a
reasonable prediction of sand transport conditions in multiphase flow as compared to
existing experimental data. It is also interesting to note the following differences
regarding the models: a). Danielson’s model is based on the assumption that the slip
velocity between the liquid and the particle would remain relatively constant for a wide
range of liquid velocities, while the KFH model uses the minimum pressure drop
assumption; b). In Danielson’s model, the flow regime needs to be determined (e.g. with
Taitel and Duckler method) prior to using the sand transport model; then different drift
velocity calculation methods can be applied accordingly for sand transport velocity

calculation, while with KFH model (or the modified version), the flow regime was
obtained from the Beggs and Brill correlation, which is essentially based on Froude
number criteria. Nonetheless, both models appear good for being used as initial screening
tools to determine sand deposit-free pipeline operating conditions. The Turian
correlation-based KFH model provides more flexibility for model tuning and field data
matching, owing to its fundamental “energy equivalency” concept.
ACKNOWLEDGEMENT
The authors would like to thank Dr. Wei Yan, Petrofac Ltd, for the helpful advices and
discussions during this study.
REFERENCES
(1) Al-lababidi, S., Yan, W., and Yeung, H., 2012, “Sand Transportation and Deposition
Characteristics in Multiphase Flows in Pipelines,” ASME Journal of Energy
Resources Technology, 134(3), pp. 1–13
(2) Al-Mutahar, Faisal, (2006), “Modeling of Critical Deposition Velocity of Sand in
Horizontal and Inclined Pipes”, MSc Thesis, Department of Mechanical
Engineering, The University of Tulsa, Tulsa.
(3) Angelsen, S., Kvernvold, O., Lingelem, M., Olsen, S., (1989), “Long-Distance
Transport of Unprocessed HC Sand Settling in Multiphase Pipelines”, Proceedings
of The Fourth International Conference on Multiphase Flow, Nice, France, June,
pp.19-21.
(4) Beggs, H. D. and Brill, J. P., (1973), “A Study of Two-Phase Flow in Inclined
Pipes”, J. Pet. Tech., pp. 607-617
(5) Blatch, N.S., 1906, “Discussion of ‘Works for the purification of the water Supply
Washington D.C.’”, Trans Amer. Soc. Civil Engrs., Vol.57, pp. 400-409.
(6) Charles, M. E., (1970), “Transport of Solids by Pipelines”, Hydrotransport 1, pp.
A3-A25.
(7) Condolios, E. and Chapus, E. E., (1963), “Transporting Solid Materials in
Pipelines”, Chem. Eng., Vol. 24, pp. 93-98.
(8) Davies, J.T., (1987), “Calculation of Critical Velocities to Maintain Solids in
Suspension in Horizontal Pipes”, Chem. Eng. Sci, Vol. 42, 7, pp. 1667-1670.
(9) Durand, R., (1953), “Basic Relationships of the Transportation of Solids in Pipes
Experimental Research”, Proceedings Minnesota International Hydraulics
Convention, pp. 89-103.
(10) Durand, R. and Condolis, E., 1953, “Basic Relationships of the Transportation of
Solids in Pipes—Experimental Research,” The Minnesota International Hydraulics
Convention, University of Minnesota, Minneapolis, MN, pp. 89–103.
(11) Fairhurst, C. P. & Baker, P. J., (1983), “Multiphase Sand Transport in Oil
Production Flowlines”, Draft report on BHRA Project RP D00935, BHRA,
Cranfield, Bedfordshire, UK.
(12) Friedel L., (1979), “Improved Friction Drop Correlations for Horizontal and
Vertical Two-Phase Pipe Flow”, European Two-Phase Flow Group Meeting, paper
E2, Ispra, Italy.
(13) Gillies, R.G., McKibben, M.J. and Shook, C.A. (1997), “Pipeline Flow of Gas,
Liquid and Sand Mixtures at Low Velocities”, J.Can.Pet.Tech, Vol. 36, pp. 36-42.
(14) Hughmark, G. A. (1961), “Aqueous Transport of Settling Slurry”, Industrial and
Engrg. Chem, Vol. 55, pp. 389-390.
(15) King, M.J.S., Fairhurst, C.P. and Hill, T.J., (2001), “Solids Transport in Multiphase
Flows Application to High Viscosity Systems”, Energy Sources Tech Conf, New

Orleans, pp. 14-17.
(16) Kokpinar, M.A., and Gogus, M., (2001), “Critical Flow Velocity in Slurry
Transporting Horizontal Pipelines”, Journal of Hydraulic engineering, Vol. 127, pp.
763-771.
(17) Lockhart R.W., Martinelli R.C., (1949), “Proposed Correlation of Data for
Isothermal Two-phase Two-component in Pipes”, Chem. Eng. Process, Vol. 45, pp.
39–48.
(18) Meyer-Peter, E. and Müller, R., (1948), “Formulas for Bed-load Transport”,
Proceedings of the 2nd Meeting of the International Association for Hydraulic
Structures Research, pp. 39-64
(19) Najmi, K, Hill, A.L., McLaury, B.S., Shirazi, S. A. and Cremaschi, S. (2015),
“Experimental Study of Low Concentration Sand Transport in Multiphase Air–
Water Horizontal Pipelines”, Journal of Energy Resources Technology 137(3), pp.
032908-1–032908-10
(20) Najmi, K, McLaury, B.S., Shirazi, S. A. and Cremaschi, S. (2016), “Low
concentration sand transport in multiphase viscous horizontal pipes: An
experimental study and modeling guideline”, AIChE Journal, Vol. 62, pp. 1821–
1833
(21) Nakayama, Y.; Boucher, R.F., ―Introduction to Fluid Mechanics, Elsevier, 2000
(22) Nicklin, D.J., Wilkes, J.O., and Davidson, J.F., “Two-Phase Flow in Vertical
Tubes,” Trans. Instn. Chem. Engrs., Vol. 40, pp. 61-68, 1962.
(23) Oroskar, A. R., and Turian, R. M., (1980), “The Critical Velocity in Pipeline Flow
of Slurries”, AIChE Journal, Vol. 26, pp. 550-558.
(24) Oudeman, P., (1993), “Sand Transport and Deposition in Horizontal Multiphase
Trunklines of Subsea Satellite Developments”, SPE Production & Facilities,
pp.237-241.
(25) Robinson, M.P., Graf, W.H., 1972, “Critical Deposit Velocities for Low-
Concentration Sand Water Mixtures,” ASCE National Water Resources
Engineering Meeting, January 24-28.
(26) Salama, M.M., (2000), “Sand Production Management” ,Journal of Energy
Resources Technology, Vol. 122, pp. 29-33.
(27) Salama, M. M., and Venkatesh, E. S., (1983), ‘’Evaluation of API RP 14E
Erosional Velocity Limitations for Offshore Gas Wells’’ Proc., 15th Offshore
Technology Conference, Paper OTC 4485
(28) Stevenson, P., Thorpe, R.B., Kennedy, J.E. and McDermott, C., (2001a), “The
Similarity of Sand Transport by Slug Flow and Hydraulic Conveying”, Proceedings
of 10th Int. Conf. on Multiphase Flow, BHRA, France, pp. 249-260.
(29) Thomas, D.G. (1962), “Transport Characteristics of suspensions Part VI. Minimum
Transport Velocity of Large Particle Size Suspensions in Round Horizontal Pipes”,
AIChE J., Vol. 8, 3, 373-377.
(30) Thomas J. Danielson, (2007), “Sand Transport Modeling in Multiphase Pipelines”,
Offshore Technology Conference, OTC paper 18691.
(31) Wasp, E.J., Aude, T.C., Kenny, J.P., Seiter, R.H., Jacques, R.B., (1970), “Deposition
Velocities, Transition Velocities and Spatial Distribution of Solids in Slurry
Pipelines”, Proceedings of Hydrotransport 1, BHRA Fluid Engineering, Cranfield,
Bedford, England, Paper H4.
(32) Yan, W. (2010), “Sand Transport in Multiphase Pipelines”, PhD Thesis,
Department of Process and Systems Engineering, Cranfield University, UK.
(33) Wicks, M., (1971), “Transport of Solids at Low Concentrations in Horizontal
Pipes”, In Zandi, I (Ed.), Advances in Solid-Liquid Flow in Pipes and its
Applications, Pergamon Press, pp.101-123.