minerals of the future: lithium in...
TRANSCRIPT

United Nations Conference on Trade and Development
10th MULTI-YEAR EXPERT MEETING ON COMMODITIES AND
DEVELOPMENT
25-26 April 2018, Geneva
Minerals of the future: Lithium in Argentina
By
Horacio Jurado, Director, Directorate of Mining Value Chain, Ministr of Energy
and Mining of the Republic of Argentinea
The views expressed are those of the author and do not necessarily reflect
the views of UNCTAD.

Dirección de Cadena de Valor Minera
Subsecretaria de Sustentabilidad MineraContact: [email protected]
Minerals of the future:Lithium in Argentina: trends, challenges…

3
Lithium…what is?
• Lithium is a soft, silver-white metal, with a symbol Li and atomic number 3
• Highly reactive, not found in Earth in elemental form
• Lightest of all metals
• Least dense solid element
• Highest specific heat capacity
• High electrochemical potential

4
Lithium 2022 7.700 MM USD
2.000 MM USD
95.000 MM USD
125.000 MM USD
Lithium
Copper
Gold
The total Lithium market
is a little part vs. Copper
and Gold
Lithium is not a standard commodity. The prices of lithium
carbonate and hydroxide are negotiated individually through
contracts between buyers and sellers – there is little
transparency in pricing, but some price recognition is available
through analysis of trade statistics
Gold Lithium
Copper
48%
30% +80%While for Gold and Copper 10 producers have only 30% and 50%
market share.
4 Lithium producers have more than 80% market share
Source: Subsecretaría de Desarrollo Minero

5
The Global Lithium Mining Market segments
➢Source:
• Brines (continental,
geothermal, and oil field)
• Hard rocks
➢Type:
• Lithium carbonate (
Li2CO3)
• Lithium hydroxide
(LiOH)
• Lithium Chloride
(LiCl)
➢Application:
➢Batteries
➢Glass
➢Ceramics
➢Air conditioning
equipment
➢Greases
➢Pharmaceuticals

6
Potential sources of Lithium worlwide
Worlwide Lithium deposits
Salars
Pegmatites and Granites
Clays
Petroleum brines
Geothermal brines
Zeolites
Argentina
Zimbabwe
China
Portugal
Czech. Rep.Austria
Germany
58%Salars
26%Pegmatit
es & Granites
7%…
3%…
3%…3%
Zeolites
% Lithium deposits distribution
Canada
EEUU
Mexico
Bolivia
Chile
Finland
Serbia
Australia
Brazil
Source: Subsecretaría de Desarrollo Minero

7
Lithium Resources and Reserves
Reserves 2016 (67,4 MM t LCE)
China 25%
(17,1 MMt)
Argentina9%
(5,1 MM t)Bolivia 0%
Chile 50%(34,1 MM t)
Australia 10%
(7,2 MMt)
Rest of the world
6% (3,9 MM t)
Bolivia 30%(47,9 MM t)
Chile 21%(34,1 MM t)
China 17%(27,1 MM t)
Rest of the world8%
(12,6 MM t)
Australia 7%
(11,6 MM t)
Argentina 17%
(26,8 MM t)
Resources 2016
(160,2 MM t LCE)
Source: Subsecretaría de Desarrollo Minero
The Lithium
Triangle
68%

8
Production 2016(202 Mt LCE)
Reserves(68,5 MM t LCE)
Argentina 9%
Bolivia 0%
Chile 50%
Australia 10%
Rest of the world 6%
China 25%
Lithium production vs Reserves
Source: Subsecretaría de Desarrollo Minero
76064
74468
30851
122342128 5319 1064
China6%
Chile
38%
Australia
38%
Argentina
38%

9
Batteries demand evolution
Ceramic and Glass: 15%
Other uses: 15%Other Uses: 11%
Air conditoning
Polymers: 5%
Metalurgy: 6%
Grease & lube:9%
Ceramic and Glass: 35%
Batteries
29%
Ohter uses: 10%
Air conditioning 3%Polymers: 5%
Metalurgy: 5%
Grease and lube: 8%
Ceramic and Glass: 30%
Batteries: 39%
20262012 2016
Batteries: 70%

10
Al-Li
Aircraft
Materials
Lithium: From deposits to final use
DEPOSITS
Brines
Mineral
concentrate
Air
conditioning
Glass &
CeramicsPharmaceutical
Lithium
Grease
Non-
recharge
Batteries
CO2
Scrubbing
Catalysts
Primary
Batteries
Elastomer
Production
Lithium
Hydroxide
Lithium
Carbonate
Lithium
Chloride
Metallic
Lithium
Steel continuos
casting
Aluminium
Industry
Li-ion Batteries
Mineral
deposit
s
END USES AND APPLICATIONSPRODUCTS

11
Lithium production, some facts.
• Battery grade lithium products have significantly higher costs to produce from mineral
sources than from salt lake brines
• But brine operations have significant lead times to develop and ramp-up production
• Mineral operations’ higher cost of production is driven by a technically more complex and
energy intensive process to reach battery grade lithium carbonate and hydroxide products
• Brine operations also exploit economies of scale and don’t have the associated expenses
of hard rock deposits

12
Lithium Price evolution (LCE)
3870 4220 4390 50506500
7475
9100
16500
8% 4%13%
22%13%
18%
45%
0%
20%
40%
60%
80%
100%
120%
140%
0
2000
4000
6000
8000
10000
12000
14000
16000
18000
2011 2012 2013 2014 2015 2016 2017 2018
Lithium price - LCE USD/ton
$ USD % Acumulated variation
Source: Metalary.com

13
Lithium demands - Car batteries
Y Country Proposal Status
2025
Norway
Change to taxes and incentives to
achieve only zero or low emission
sales
Agreement amongst all
relevant parties
Netherland
s
Change to taxes and incentives to
achieve only zero or low emission
sales
Passed by
parliament's
lower house –
needs approval
by upper house
EEUU
No country-wide proposal although
California aims to have a 1.5 million
ZEV fleet
State approved
mandate
China“New energy” vehicles to make up at
least 20% of vehicle sales
Approved in latest five
year plan
2030
Japan50 to 70% of vehicle sales to be of
“next-generation” vehicleGovernment set target
India End the sale of petrol and diesel cars Policy proposal
Germany
Change to taxes and incentives to
achieve only zero-emission vehicle
sales EU-wide
Non-binding resolution
by parliament's upper
house
2040
FranceEnd the sale of cars emitting
greenhouse gasesPolicy proposal
England
End the sale of all new
conventional petrol and diesel
cars and vans
Policy proposal
Source: woodmac.com/Metals & Mining
• Since 2010, battery costs have fallen by more than 70%
• The viability of electric vehicles will ultimately depend on how well each
car can compete across segments and geographies
• EV stock around the world to increase from 2 million in 2016 to 125 million
in 2035
• By 2035, 1.8 million b/d of global oil demand will be displaced by Evs
• Buses LIB can be push the demand

14
Lithium demands – BESS (Battery Energy Storage Station)
Tesla world´s largest Li-On battery
South Australia
100 MW/ 129 MWh.
Capacity: 30.000 homes for an hour
AES & SIEMENS – Escondido, California,
EEUU
30 MW/ 120 MW/h
Capacity: 20.000 homes for about 4 hours

15
The Lithium Triangle (Argentina, Bolivia and Chile)
Chil
e
Boli
via
Source: Dirección de Infraestructura Minera/ Subsecretaría de Sustentabilidad minera

16
Argentina Lithium mines and projects status
2 mines in Production. Both expanding
production capacity
2 mines under Construction
10 projects from Feasibility to Advanced
Exploration
> 40 projects in Early-Stage Exploration
phase, 6 of them from pegmatites deposits

17
3818
20
50
50
2515
2016
25
20
35 331
0
50.000
100.000
150.000
200.000
250.000
300.000
350.000
2017Production
capacity
Amp. Olaroz Cangrejillos
Jujuy
Caucharí-Olaroz
Rincón Pozuelos Sal de los Ángeles Centenario
Salta
GallegoProject
Sal de Vida Amp. Mina Fénix TresQuebradas
Catamarca
2022 Projectedcapacity
Ton
so
fLC
E
FMC
Lit
hiu
mC
orp
.
Gal
axy
Res
ou
rces
Lim
ited
Eram
et
Lith
ium
-XEn
ergy
Co
rp.
Ab
erd
een
Inte
rnat
ion
alIn
c.
Po
sco
-Li
thea
Enir
giG
rou
pC
orp
.A
DY
Res
ou
rces
Ltd
Lith
ium
Am
eric
as–
SQM
-JE
MSE
Oro
cob
re L
td–
JV–
Toyo
taTs
ush
oC
orp
.
Oro
cob
re L
tdTo
yota
Tsu
sho
Co
rp.
JEM
SE
Ever
ligh
tR
eso
urc
es
Neo
Lith
ium
Ltd
.
18
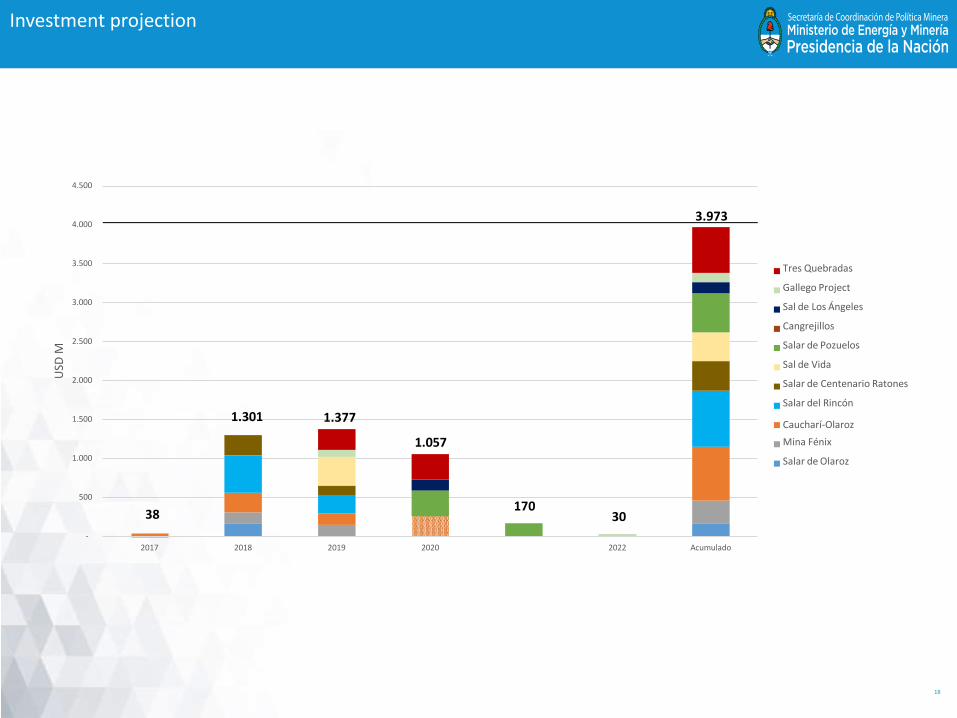
Investment projection
-
500
1.000
1.500
2.000
2.500
3.000
3.500
4.000
4.500
2017 2018 2019 2020 2022 Acumulado
USD
M
Tres Quebradas
Gallego Project
Sal de Los Ángeles
Cangrejillos
Salar de Pozuelos
Sal de Vida
Salar de Centenario Ratones
Salar del Rincón
Caucharí-Olaroz
Mina Fénix
Salar de Olaroz
38
1.301 1.377
1.057
17030
3.973

19
Employment projection
0
500
1.000
1.500
2.000
2.500
3.000
3.500
4.000
2017 2018 2019 2020 2021 2022
Emp
loye
es
Tres Quebradas
Gallego Project
Sal de Los Ángeles
Cangrejillos
Salar de Pozuelos
Sal de Vida
Salar de Centenario Ratones
Salar del Rincón
Caucharí-Olaroz
Mina Fénix
Amp. Olaroz
Olaroz483 483
1.193
2.538
2.838
3.408

20
Lithium exports projection (MM USD)
0
500
1000
1500
2017 2018 2019 2020 2021 2022
USD
(M
M)
253 253305
801
1412
2000
At 75% of projected production capacity and 9.000 USD/t LCE price
1848

21
NOA Region opportunities…and challenges
Source: Dirección de Infraestructura Minera/ Subsecretaría de Sustentabilidad minera
Prices are still rising…
• Infrastructure (Roads, railways, gas,
electricity, telecomunicacions)
• Skills development for the specific salar
production system
• Accelerate the process between projects and
production
• Local development plans
• Consider seriously the impact in local and
aboriginal communities.
• Hydrogen cells and graphene can be
competitors.
• Recycling by 2040 would cover 50% of the
demand for lithium.
• Australia alone could supply the demand for
world lithium for the next 60 years.
• Technological advances can create new
sources.

22
Commissioning and process residence times are a specific risk to brine production and will hamper the progress of
expansion. These obstacles for new brine developments may sustain the current market deficit in the short term.
Q3
2010
Definitive
Feasibility
Published
Scoping Study
Published
Sept May
2008 2009
Initial Orocobre
drilling program
Sept
2016
Nameplate
production 17.5
kt/a battery grade
lithium carbonate
forecast
Mar
2015
Construction and
commissioning
completed
Orocobre and
Toyota Tsusho
Announce JV to
develop the project
Jan
2010
The provincial
government take an
equity interest in
the project and
construction is
approved
Jun
2012
Project Financing
Completed
US$229M including
70% debt provided
by Mizuso
Dec
2012
AUD$50M
placement
announced to
fund ramp-up
working capital
requirements
Feb
2015
Mar
2016
AUD$85M
placement
announced to
meet debt
obligations
LOCATION