mineral resource availability and the...
TRANSCRIPT
MINERAL RESOURCE AVAILABILITY
and the
FUTURE OF INDUSTRIAL CIVILIZATION
John L. Berry John Berry Associates, Austin,TX
©John Berry Assoc.
Slide 1 of 45

MINERAL RESOURCE AVAILABILITY
OUTLINE
• Introduction
• Arguments
• History of Real Prices and Production
• Definitions
• Ore Grades, Resources and Life Expectancies
• Lognormal distribution of ore deposit sizes, grades, and locations
• Classical Economics views and problems with them
• External Costs and their Growth
• Competition for Land
• World-Wide Access to Minerals by Trade: Strategic Minerals
• “Ore is where you find it”
• Market concentration by country and company
• China and REE
• Role of Technology
• Role of capital requirements
• Examples: Iron, Copper, Titanium (Magnesium)
• Minerals and the Law of Supply and Demand
• Deposit Types, Prices and Volumes
• Implications of “Lumpy” Supply Curve
• Technological advances in Exploration, Mining, and substitution.
• Conclusions: Future of Minerals Availability
©John Berry Assoc.
Slide 2 of 45

MINERAL RESOURCE AVAILABILITY
INTRODUCTION
CIVILIZATION:
Tools: Stone>> Bronze>> Iron >>Machines (Alloys)>> Semi-conductors (Exotics)
ALL are based on mineral resources: Mining goes right back to the beginning
©John Berry Assoc.
Slide 3 of 45
Grime’s Graves ©Nic McPhee: 3000BC;433 shafts, 96 ac.
INDUSTRIAL CIVILIZATION:
Fossil Energy is the basic enabler:
Petroleum production has not increased since 2003.
Petroleum usage per person peaked in 1979 (R. Duncan, 2000) Pre-contact
Copper Mining, Kansanshi, Zambia

MINERAL RESOURCE AVAILABILITY ©John Berry Assoc.
Slide 4 of 45
ARGUMENTS
Availability:
Inverse of Opportunity Cost, or what other goods must be given up to obtain a mineral commodity.
Real prices of a commodity Opportunity costs availability (Tilton, 2001).
In the Past:
Real prices of most mineral commodities have been flat or gone down almost continuously
since the beginning of the industrial revolution. This was due to three factors:
• Increased areas of land to explore
• Increased use of fossil energy to replace human labor
• Continually advancing technology.
In the future:
• No new frontiers left to explore
• Increasing energy prices
• Exponentially increasing production
• Asymptotically decreasing ore grades
• Increasing competition for land
• Exponentially increasing external costs
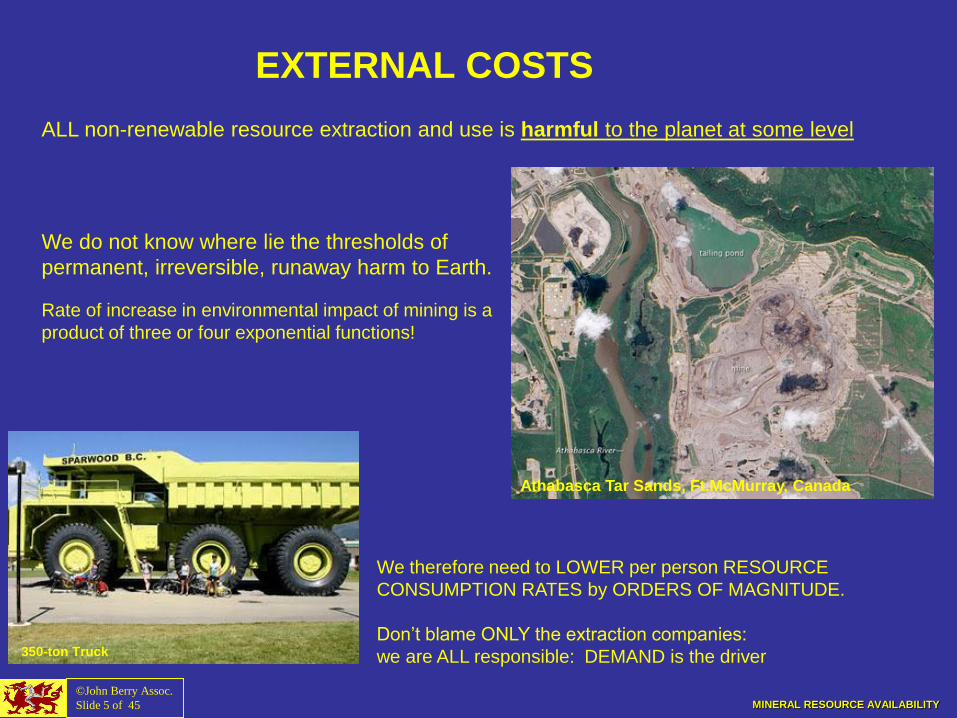
EXTERNAL COSTS
ALL non-renewable resource extraction and use is harmful to the planet at some level
MINERAL RESOURCE AVAILABILITY
©John Berry Assoc.
Slide 5 of 45
350-ton Truck
Athabasca Tar Sands, Ft.McMurray, Canada
We do not know where lie the thresholds of
permanent, irreversible, runaway harm to Earth.
Rate of increase in environmental impact of mining is a
product of three or four exponential functions!
We therefore need to LOWER per person RESOURCE
CONSUMPTION RATES by ORDERS OF MAGNITUDE.
Don’t blame ONLY the extraction companies:
we are ALL responsible: DEMAND is the driver
MINERAL RESOURCE AVAILABILITY ©John Berry Assoc.
Slide 6 of 45
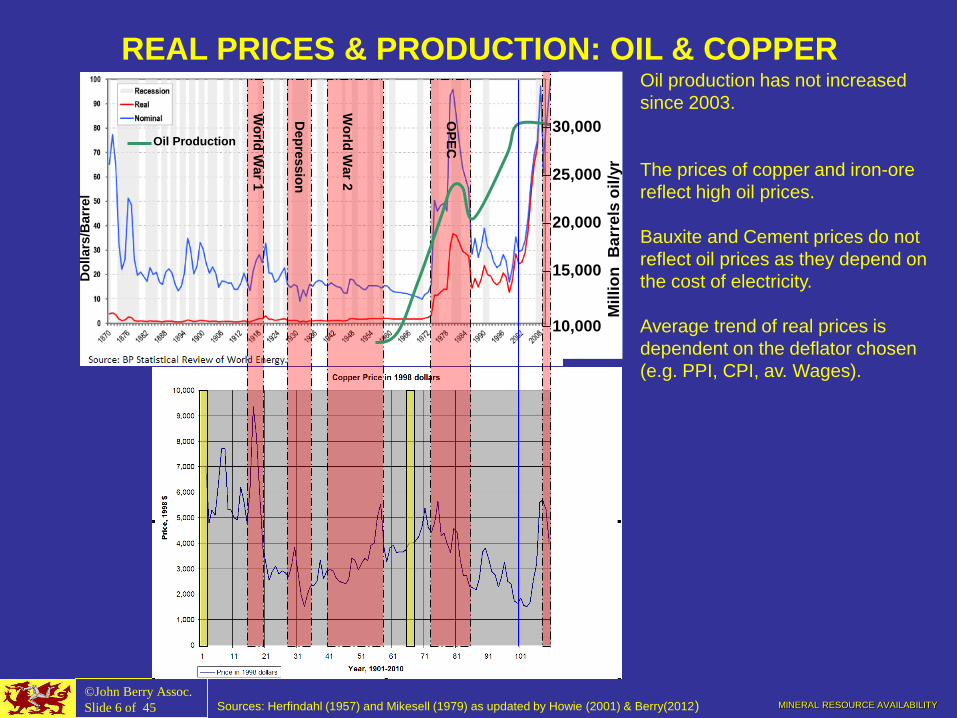
REAL PRICES & PRODUCTION: OIL & COPPER
Sources: Herfindahl (1957) and Mikesell (1979) as updated by Howie (2001) & Berry(2012)
Do
llars
/Barr
el
10,000
30,000
25,000
20,000
15,000
Mil
lio
n
Ba
rre
ls o
il/y
r
Oil Production
Wo
rld W
ar 1
Wo
rld W
ar 2
Dep
ressio
n
OP
EC
Oil production has not increased
since 2003.
The prices of copper and iron-ore
reflect high oil prices.
Bauxite and Cement prices do not
reflect oil prices as they depend on
the cost of electricity.
Average trend of real prices is
dependent on the deflator chosen
(e.g. PPI, CPI, av. Wages).
MINERAL RESOURCE AVAILABILITY ©John Berry Assoc.
Slide 7 of 45
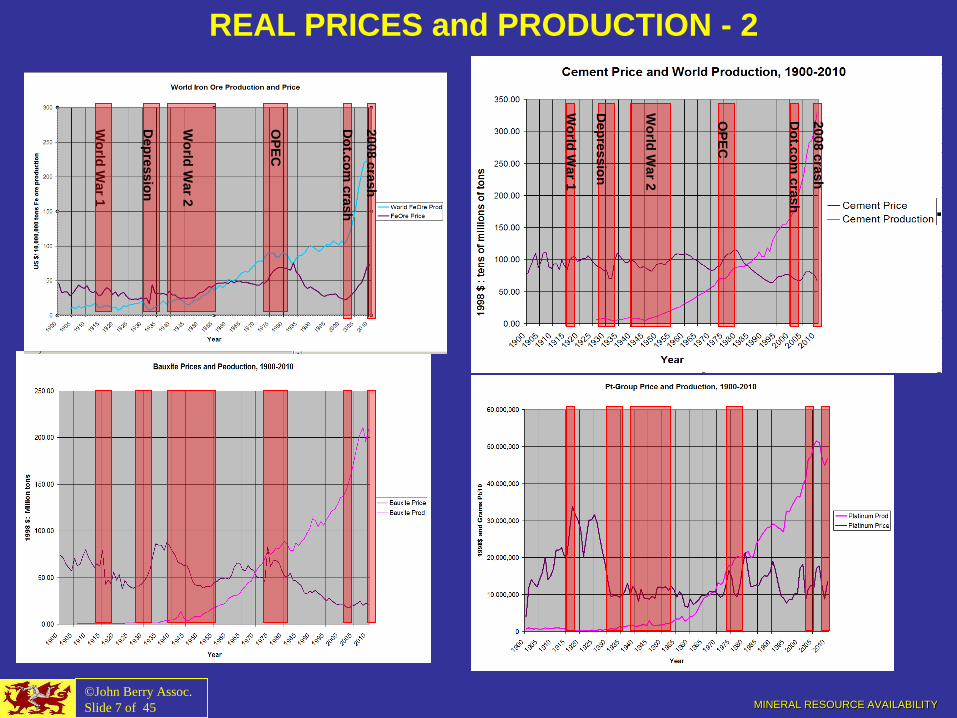
REAL PRICES and PRODUCTION - 2
Wo
rld W
ar 1
Dep
ressio
n
Dep
ressio
n
Wo
rld W
ar 1
Wo
rld W
ar 2
Wo
rld W
ar 2
OP
EC
OP
EC
Do
t.co
m c
rash
Do
t.co
m c
rash
2008 c
rash
2008 c
rash
MINERAL RESOURCE AVAILABILITY
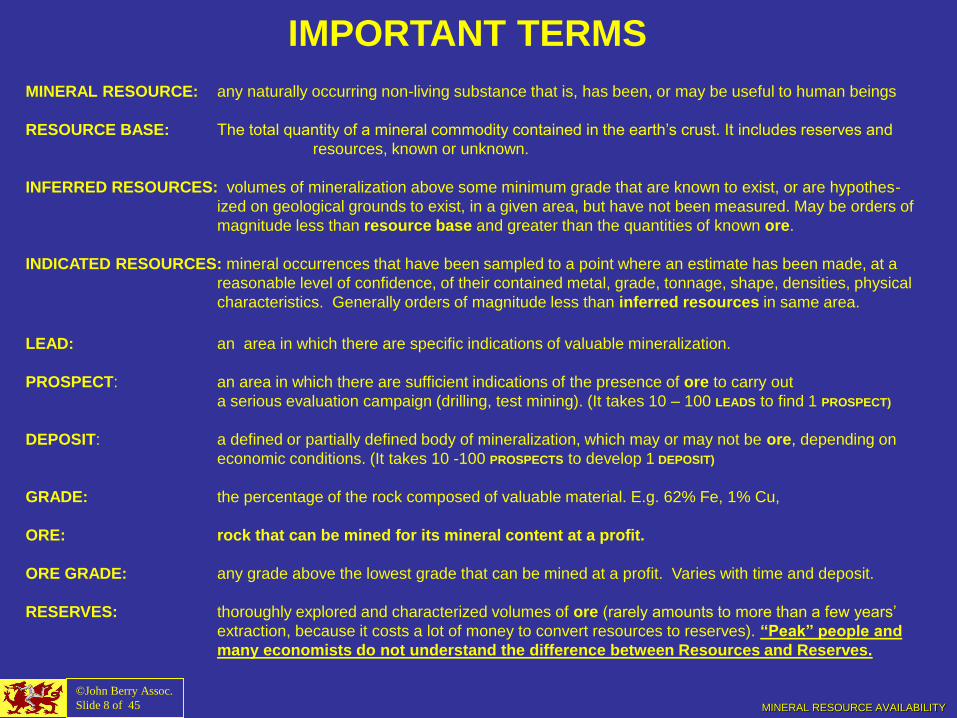
IMPORTANT TERMS MINERAL RESOURCE: any naturally occurring non-living substance that is, has been, or may be useful to human beings
RESOURCE BASE: The total quantity of a mineral commodity contained in the earth’s crust. It includes reserves and
resources, known or unknown.
INFERRED RESOURCES: volumes of mineralization above some minimum grade that are known to exist, or are hypothes-
ized on geological grounds to exist, in a given area, but have not been measured. May be orders of
magnitude less than resource base and greater than the quantities of known ore.
INDICATED RESOURCES: mineral occurrences that have been sampled to a point where an estimate has been made, at a
reasonable level of confidence, of their contained metal, grade, tonnage, shape, densities, physical
characteristics. Generally orders of magnitude less than inferred resources in same area.
LEAD: an area in which there are specific indications of valuable mineralization.
PROSPECT: an area in which there are sufficient indications of the presence of ore to carry out
a serious evaluation campaign (drilling, test mining). (It takes 10 – 100 LEADS to find 1 PROSPECT)
DEPOSIT: a defined or partially defined body of mineralization, which may or may not be ore, depending on
economic conditions. (It takes 10 -100 PROSPECTS to develop 1 DEPOSIT)
GRADE: the percentage of the rock composed of valuable material. E.g. 62% Fe, 1% Cu,
ORE: rock that can be mined for its mineral content at a profit.
ORE GRADE: any grade above the lowest grade that can be mined at a profit. Varies with time and deposit.
RESERVES: thoroughly explored and characterized volumes of ore (rarely amounts to more than a few years’
extraction, because it costs a lot of money to convert resources to reserves). “Peak” people and
many economists do not understand the difference between Resources and Reserves.
©John Berry Assoc.
Slide 8 of 45
MINERAL RESOURCE AVAILABILITY
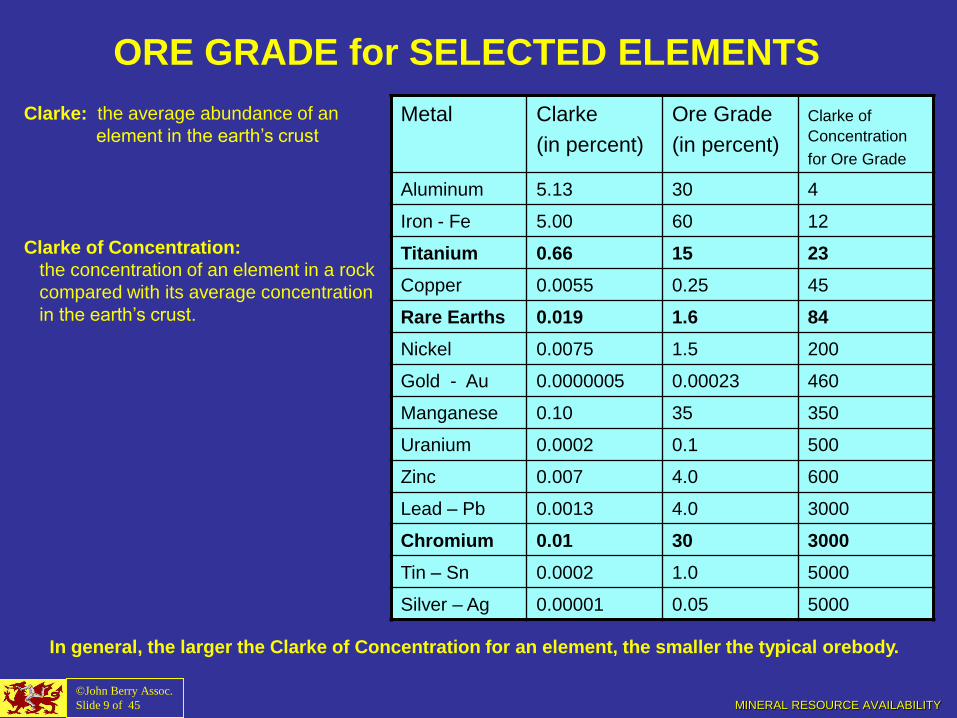
ORE GRADE for SELECTED ELEMENTS
Metal Clarke
(in percent)
Ore Grade
(in percent)
Clarke of Concentration
for Ore Grade
Aluminum 5.13 30 4
Iron - Fe 5.00 60 12
Titanium 0.66 15 23
Copper 0.0055 0.25 45
Rare Earths 0.019 1.6 84
Nickel 0.0075 1.5 200
Gold - Au 0.0000005 0.00023 460
Manganese 0.10 35 350
Uranium 0.0002 0.1 500
Zinc 0.007 4.0 600
Lead – Pb 0.0013 4.0 3000
Chromium 0.01 30 3000
Tin – Sn 0.0002 1.0 5000
Silver – Ag 0.00001 0.05 5000
Clarke: the average abundance of an
element in the earth’s crust
Clarke of Concentration:
the concentration of an element in a rock
compared with its average concentration
in the earth’s crust.
©John Berry Assoc.
Slide 9 of 45
In general, the larger the Clarke of Concentration for an element, the smaller the typical orebody.
MINERAL RESOURCE AVAILABILITY
©John Berry Assoc.
Slide 10 of 45
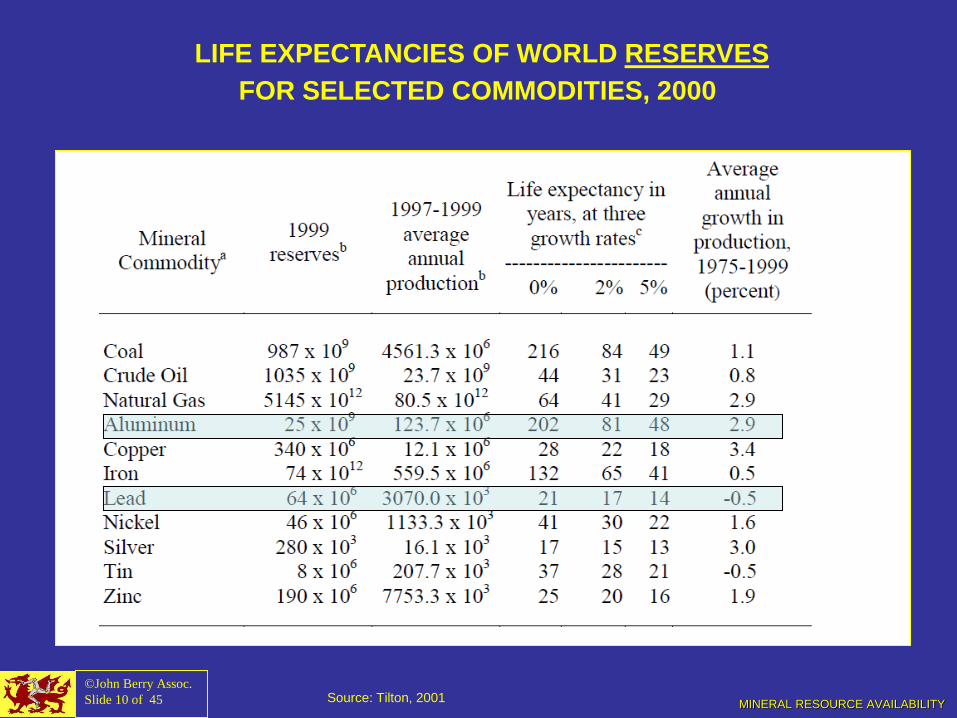
LIFE EXPECTANCIES OF WORLD RESERVES
FOR SELECTED COMMODITIES, 2000
Source: Tilton, 2001
MINERAL RESOURCE AVAILABILITY
©John Berry Assoc.
Slide 11 of 45
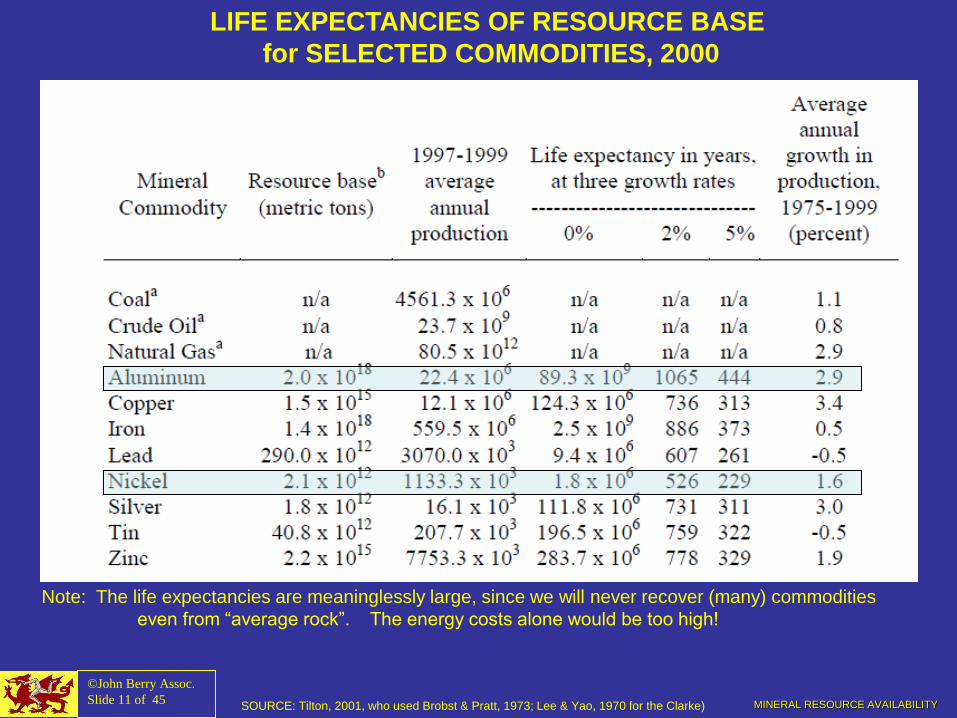
SOURCE: Tilton, 2001, who used Brobst & Pratt, 1973; Lee & Yao, 1970 for the Clarke)
LIFE EXPECTANCIES OF RESOURCE BASE
for SELECTED COMMODITIES, 2000
Note: The life expectancies are meaninglessly large, since we will never recover (many) commodities
even from “average rock”. The energy costs alone would be too high!

MINERAL RESOURCE AVAILABILITY ©John Berry Assoc.
Slide 38 of 45
THE LOG-NORMAL DISTRIBUTION
“A continuous probability distribution of a random variable whose logarithm is normally distributed”
VIRTUALLY ALL GEOLOGICAL PHENOMENA ARE LOG-NORMALLY DISTRIBUTED, including SIZES AND GRADES OF
MINERAL DEPOSITS. Thus MOST OF THE SUPPLY IS IN A FEW VERY LARGE or VERY HIGH-GRADE OREBODIES.
Most of the World’s Mineral Supply is in A FEW BIG MINES:
For the distribution above, the threshold for the top 2.3% of the deposits is
4 times the Median. This is “equivalent” to a normal distribution with
¯x=100, σ=150
A log-normal distribution with original scale (a) and with logarithmic scale (b).
Shaded areas = 1 and 2 σ (from http://stat.ethz.ch/~stahel/lognormal/bioscience.pdf)
Clarke
Massive
sulfides Veins
Grade
To
nn
age
Multimodal distribution of
elements in Earth’s crust

MINERAL RESOURCE AVAILABILITY
Laws of Deposit Size and Grade:
• Ore grade and tonnage statistical
distributions are lognormal, both
within deposits and across deposits:
• Most ore is thus in a few very large
deposits.
• For Copper - Mines
#1: Escondida, Chile: 8% 1.3 Mt 2008
#2: Chuquicamata, Chile: 6% 0.9 Mt 2006
#3: Grasberg, Indon: 4% 0.6 Mt 2006
Bingham Canyon, UT: 265,600 t 2006
Highland Valley, BC: 119,300 t 2008
The top 3 mines produce around 18% of the
world’s copper
• For Copper – Production by country, 2009 Chile: 5,941,000 Mt 34% 34%
Peru: 1,407,000 Mt 8%
USA: 1,302,000 Mt 7%
China: 1,171,000 Mt 7%
Indonesia: 1,098,000 Mt 6% 62%
Australia: 941,000 Mt 5%
Russia: 745,000 Mt 4%
Zambia: 614,000 Mt 4%
Canada: 540,000 Mt 3%
Poland: 484,000 Mt 3%______ 81%
Example: Porphyry Copper Deposits. Lognormal
Distribution of Ore Deposit Tonnage. These are
the largest class of copper deposits, and also
contain Au, Ag, and Mo. The vertical lines indicate
the 10th, 50th and 90th percentile of deposits.
©John Berry Assoc.
Slide 39 of 45 http://www.copper.org/resources/market_data/pdfs/annual_data.pdf
P90/median = 6.3

MINERAL RESOURCE AVAILABILITY
Source: Singer ©John Berry Assoc.
Slide 41 of 45
DEPOSIT TYPES, GRADES AND TONNAGE: GOLD
1850-1920
Viable at $24/oz
1890-1990
Viable at $35/oz
1980-Present
Viable at $300/oz
Gold is a by-product
Price barely matters
NOTES:
Not shown: Since 1980 there has been a modern gold rush for SH/HS Gold in Nevada, but it
takes ~500 of these deposits to replace the output from 1 Witwatersrand deposit,
Their average grade is 1/7 that of the Witwatersrand, which is a “Paleoplacer”.
MINERAL RESOURCE AVAILABILITY ©John Berry Assoc.
Slide 12 of 45
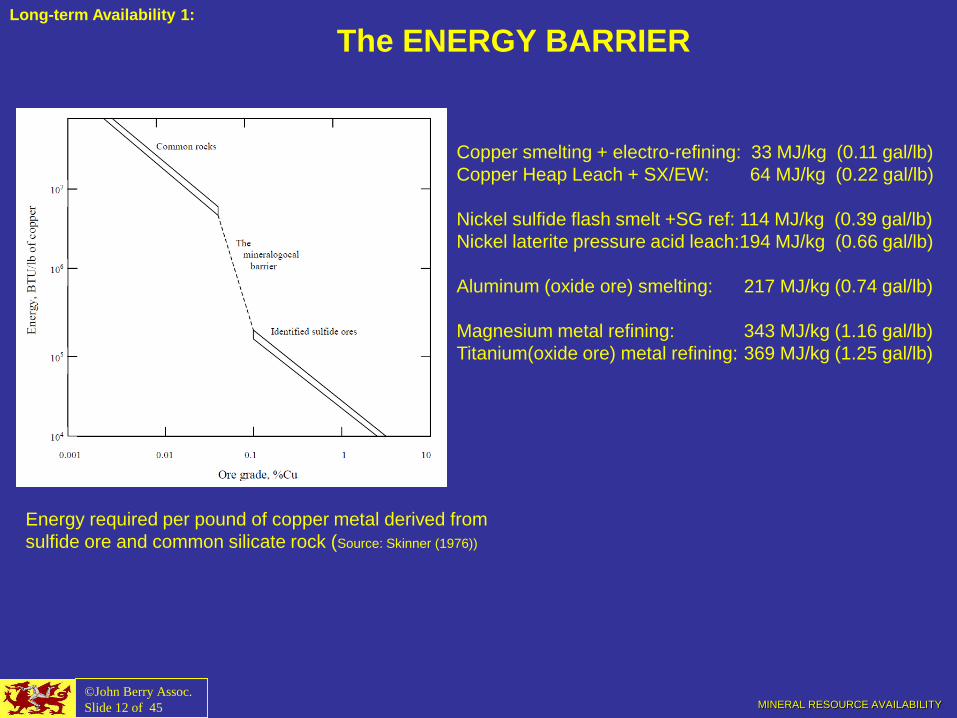
The ENERGY BARRIER
Energy required per pound of copper metal derived from
sulfide ore and common silicate rock (Source: Skinner (1976))
Long-term Availability 1:
Copper smelting + electro-refining: 33 MJ/kg (0.11 gal/lb)
Copper Heap Leach + SX/EW: 64 MJ/kg (0.22 gal/lb)
Nickel sulfide flash smelt +SG ref: 114 MJ/kg (0.39 gal/lb)
Nickel laterite pressure acid leach:194 MJ/kg (0.66 gal/lb)
Aluminum (oxide ore) smelting: 217 MJ/kg (0.74 gal/lb)
Magnesium metal refining: 343 MJ/kg (1.16 gal/lb)
Titanium(oxide ore) metal refining: 369 MJ/kg (1.25 gal/lb)

MINERAL RESOURCE AVAILABILITY ©John Berry Assoc.
Slide 13 of 45
TWO CLASSICAL ECONOMICS VIEWS
Two approaches to analyzing exhaustion and depletion
Physical: Mineral resources occur as deposits in the earth that were formed in geologic time
and cannot be duplicated in human time. Removal of ore directly depletes the
resource.
The Pure Theory of Exhaustion (the Gray-Hotelling Theory), has been developed to
fit this physical view. (p.457)
Economic Approach:
“Minerals … have not limited society’s welfare in the past. Nor do they have the potential
for limiting the welfare of mankind in the future, so long as certain conditions are
maintained.
• Internalization of external environmental damages,
• Access to the earth’s crust for exploration,
• Worldwide trade access to raw materials and,
• Prevention of market control by either sellers or buyers.
“If these rules … are followed, markets will provide supplies and ration use so that minerals and
materials will be available to meet society’s needs without significantly increasing costs for a very long
time, probably for ever. (p.457)” VOGELY, William A., Nonfuel Minerals and the World Economy.
Chapter 15 in REPETTO, Robert, ed., 1985: The Global Possible.
Resources, Development, and the New Century. Yale UP, New Haven.
MINERAL RESOURCE AVAILABILITY ©John Berry Assoc.
Slide 14 of 45
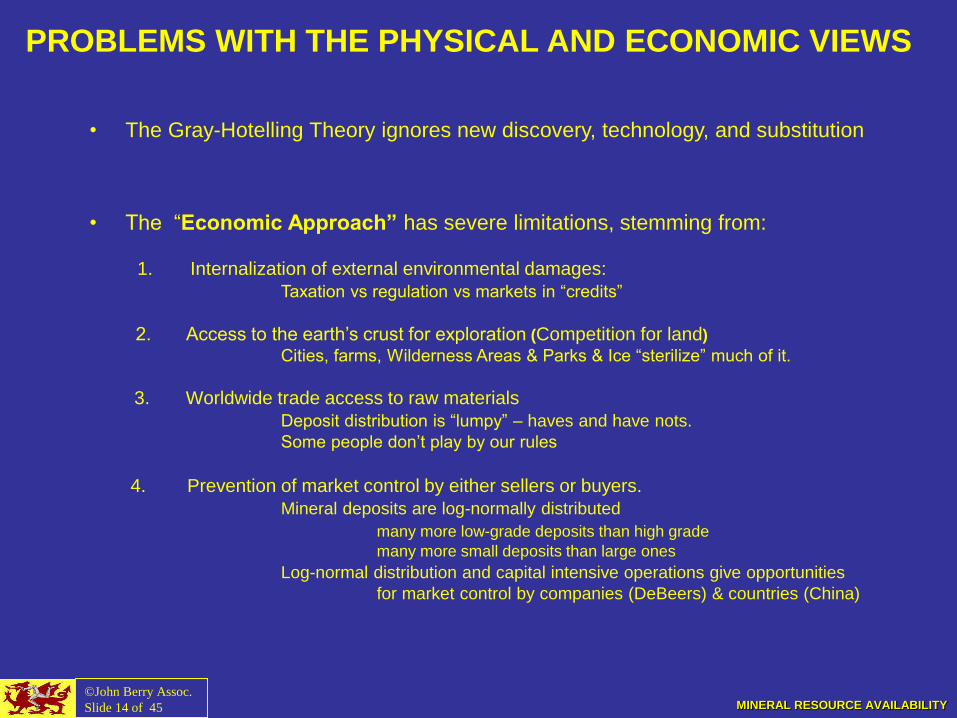
PROBLEMS WITH THE PHYSICAL AND ECONOMIC VIEWS
• The Gray-Hotelling Theory ignores new discovery, technology, and substitution
• The “Economic Approach” has severe limitations, stemming from:
1. Internalization of external environmental damages:
Taxation vs regulation vs markets in “credits”
2. Access to the earth’s crust for exploration (Competition for land)
Cities, farms, Wilderness Areas & Parks & Ice “sterilize” much of it.
3. Worldwide trade access to raw materials
Deposit distribution is “lumpy” – haves and have nots.
Some people don’t play by our rules
4. Prevention of market control by either sellers or buyers.
Mineral deposits are log-normally distributed
many more low-grade deposits than high grade
many more small deposits than large ones
Log-normal distribution and capital intensive operations give opportunities
for market control by companies (DeBeers) & countries (China)
soil
overburden
MINERAL RESOURCE AVAILABILITY
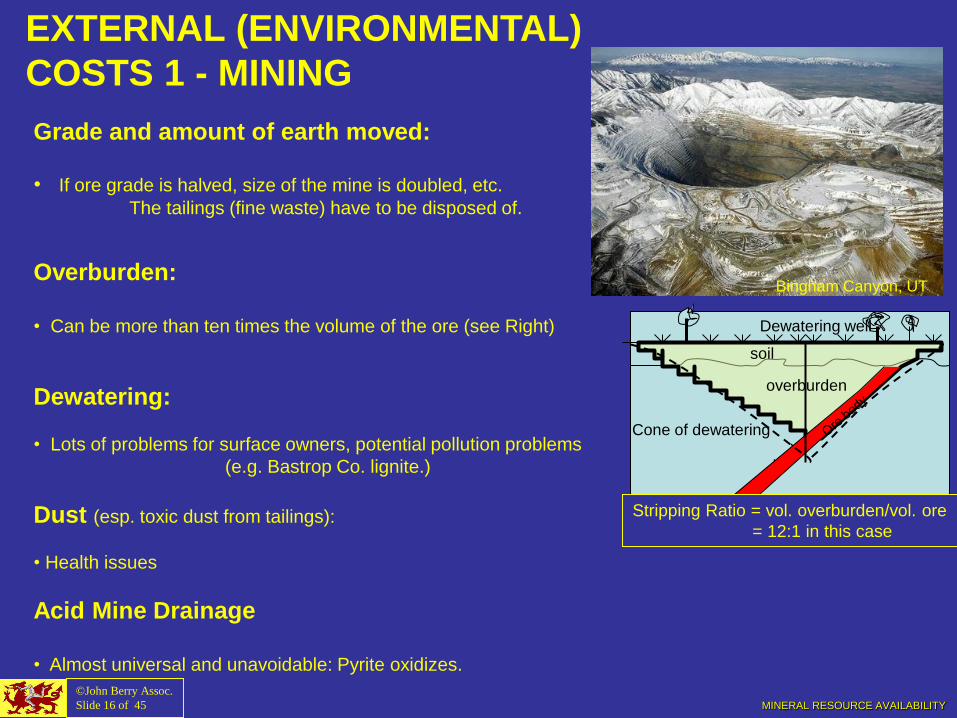
EXTERNAL (ENVIRONMENTAL)
COSTS 1 - MINING
Grade and amount of earth moved:
• If ore grade is halved, size of the mine is doubled, etc.
The tailings (fine waste) have to be disposed of.
Overburden:
• Can be more than ten times the volume of the ore (see Right)
Dewatering:
• Lots of problems for surface owners, potential pollution problems
(e.g. Bastrop Co. lignite.)
Dust (esp. toxic dust from tailings):
• Health issues
Acid Mine Drainage
• Almost universal and unavoidable: Pyrite oxidizes.
Stripping Ratio = vol. overburden/vol. ore
= 12:1 in this case
Dewatering well
Cone of dewatering
Bingham Canyon, UT
©John Berry Assoc.
Slide 16 of 45
MINERAL RESOURCE AVAILABILITY ©John Berry Assoc.
Slide 17 of 45
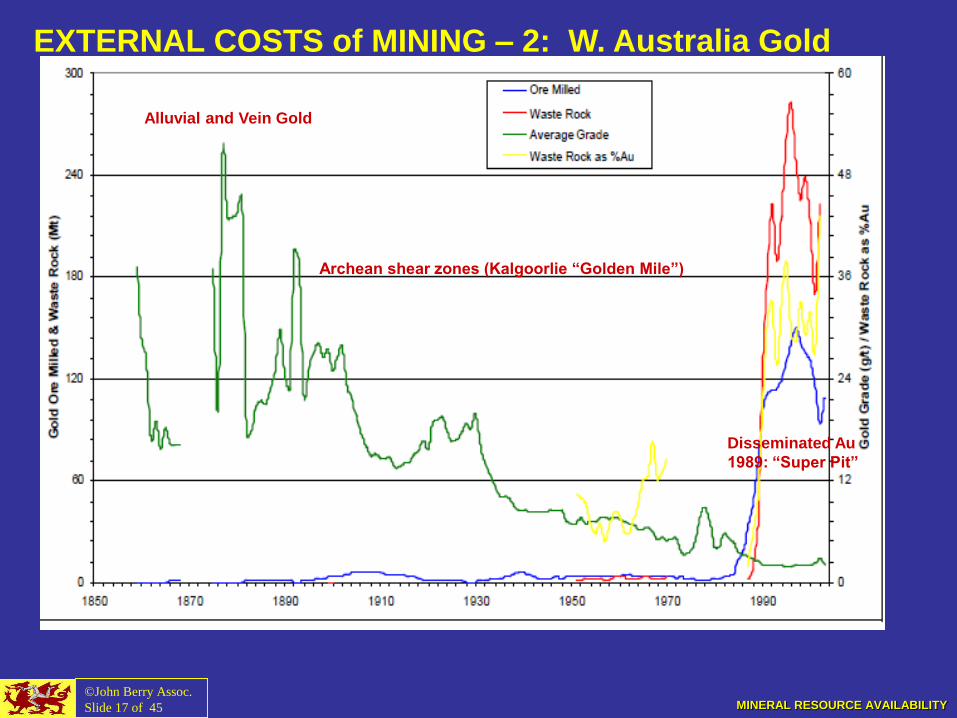
EXTERNAL COSTS of MINING – 2: W. Australia Gold
Alluvial and Vein Gold
Archean shear zones (Kalgoorlie “Golden Mile”)
Disseminated Au
1989: “Super Pit”

MINERAL RESOURCE AVAILABILITY ©John Berry Assoc.
Slide 18 of 45
EXTERNAL COSTS 3: SMELTING AND REFINING
Water Pollution:
Cadmium: Imperial Zinc, Bristol Channel, UK
Mercury: Minami Bay, Japan
Soil Pollution:
Coweeta Forest Research Station, NC: 1% SO4 80 mi downwind of Ducktown, TN
Ducktown, TN: Completely deforested by Cu in soil.
Nkana, Zambia: 0.5% Cu in surface soil after 25 years.
Air Pollution:
Nkana, Zambia: 550 tons CuSO4/mo
Rockdale, TX: Fluorosis from Al smelter?
Solutions:
Taxation (Europe), Regulation (USA),
Cap-and-Trade schemes(USA/EU)
Not very specific; subject to corruption & politics;
no $ value for damage

MINERAL RESOURCE AVAILABILITY ©John Berry Assoc.
Slide 19 of 45
MODEL FOR GROWTH OF TOTAL EXTERNAL COSTS
Rate of Growth of External Costs = Rate of Increase of Population x rate of increase in GDP per person x
rate of increase in intensity of use x rate of increase in stripping ratio
divided by the rate of decrease in average ore grade
dWP * dGDPind * dI * dS
dE dt dt dt dt
---- = ----------------------------------- integrated over all countries & commodities
dt dG
dt
Where E = environmental and other external costs
WP = World Population
GDPind= income per person
I = Intensity of use of each commodity
S = Average stripping ratio
G = average ore grade for each commodity.
This can be simplified to :
dP * dS
dE dt dt
---- = --------------- integrated over all commodities and types of impact.
dt dG
dt
where P = total world production of a commodity
A very rough estimate of this would be = 1.10 * 1.05 * 1/0.985 = 1.17 or 17% per year; doubling time of 3.3 years
MINERAL RESOURCE AVAILABILITY
©John Berry Assoc.
Slide 20 of 45
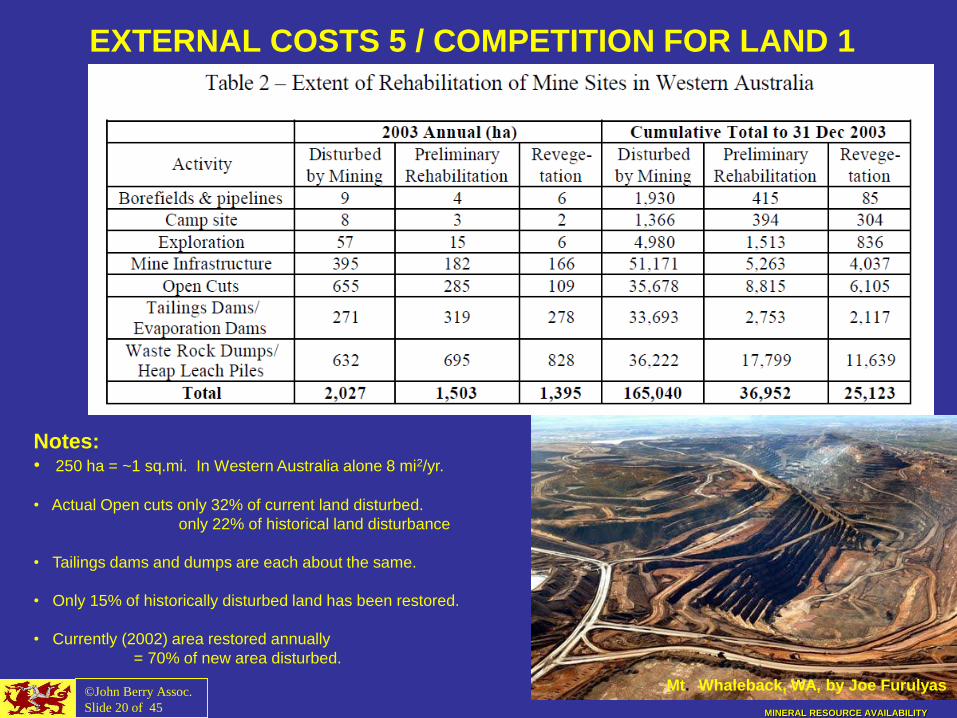
EXTERNAL COSTS 5 / COMPETITION FOR LAND 1
Mt. Whaleback, WA, by Joe Furulyas
Notes: • 250 ha = ~1 sq.mi. In Western Australia alone 8 mi2/yr.
• Actual Open cuts only 32% of current land disturbed.
only 22% of historical land disturbance
• Tailings dams and dumps are each about the same.
• Only 15% of historically disturbed land has been restored.
• Currently (2002) area restored annually
= 70% of new area disturbed.

MINERAL RESOURCE AVAILABILITY ©John Berry Assoc.
Slide 21 of 45
Commodities Ranked by Worldwide Area of Land Disturbed per Year
0 2,000 4,000 6,000 8,000 10,000 12,000 14,000 16,000 18,000
Peat
Zirconium
Feldspar
Nickel
Lead
Molybdenum
Industrial sand
Manganese
Vanadium*
Kaolin
Fluorspar
Zinc
Gypsum
Lime
Gold
Clays
Petroleum
Bauxite
Boron
Lignite
Iron Ore
Chromites
Crushed rock
Copper
Cement
Phosphates
Diamonds
Coal
Sand/grav
Co
mm
od
ity
Square Kilometers
800 1600 2400 3200 4000 4800 5600 6400 sq.mi.
COMPETITION FOR LAND 2

MINERAL RESOURCE AVAILABILITY
©John Berry Assoc.
Slide 22 of 45
“ORE IS WHERE YOU FIND IT” or “If it isn’t there you won’t find it”
• Ore deposits are rare
• If you make a mineral deposit inaccessible (e.g.ANWR), you can’t replace it.
• There has to be favorable geology
You can’t move a deposit from where you don’t want it to somewhere else.
Some countries have it all, some have none (Strategic Minerals)
• Exploration requires access to lots of land
Rule of thumb: 100 leads > 10 prospects >1 mine
(This also implies a need for large companies)
It usually takes 5 exploration campaigns
to delineate a mineable deposit.
DiaVik Diamond Mines, NWT, Canada
COMPETITION FOR LAND 3
Kansanshi, Zambia: old head frame
Copper Flower
MINERAL RESOURCE AVAILABILITY ©John Berry Assoc.
Slide 23 of 45
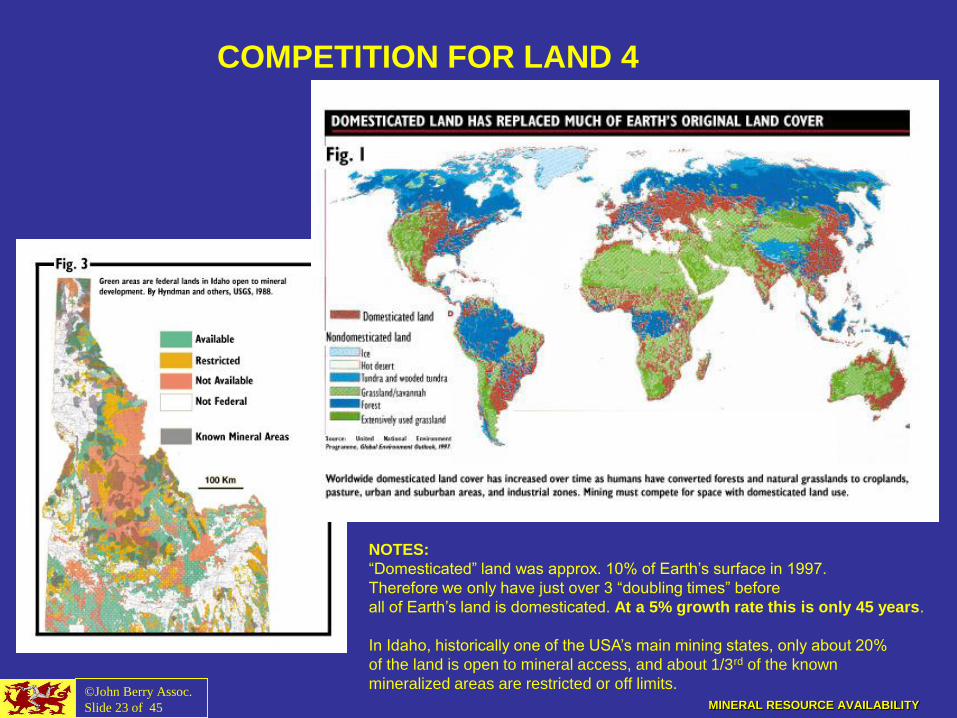
COMPETITION FOR LAND 4
NOTES:
“Domesticated” land was approx. 10% of Earth’s surface in 1997.
Therefore we only have just over 3 “doubling times” before
all of Earth’s land is domesticated. At a 5% growth rate this is only 45 years.
In Idaho, historically one of the USA’s main mining states, only about 20%
of the land is open to mineral access, and about 1/3rd of the known
mineralized areas are restricted or off limits.

MINERAL RESOURCE AVAILABILITY
©John Berry Assoc.
Slide 24 of 45
WORLD-WIDE FREE ACCESS 1:
STRATEGIC MINERALS
Data: USGS, Mineral Commodity Summaries, 2011.
Definition: Minerals essential to the national
defense for which during war we are
wholly or partly dependent upon
sources outside the continental
limits of the United States
Most critical: Platinum Group Metals (PGM),
NAS (2007) Rare Earths (REE) (La>Nd>Dy>Tb)
Indium,
Manganese
Niobium (Columbium) (ColTan)
Beryllium
Uranium
Chromium
Cobalt
Tungsten
Petroleum
Source: http://www.helium.com/items/
1949042-what-are-strategic-minerals

MINERAL RESOURCE AVAILABILITY
STRATEGIC MINERALS - 2
• Thus, different mineral commodities are Strategic for different countries
(e.g. China: copper, chromium, platinum
Europe: almost everything)
• Strategic Mineral Endowment and War:
1925: geologist C.K.Leith predicted WWII and the line-up because:
• USA, the USSR, The British and French Empires were virtually self-sufficient in
mineral resources,
• Germany, Italy, and Japan were lacking in all but a few.
(C.K.Leith. Political Control of mineral resources, Foreign Affairs, July 1925.)
©John Berry Assoc.
Slide 25 of 45
Free Access to Minerals 2:
MINERAL RESOURCE AVAILABILITY
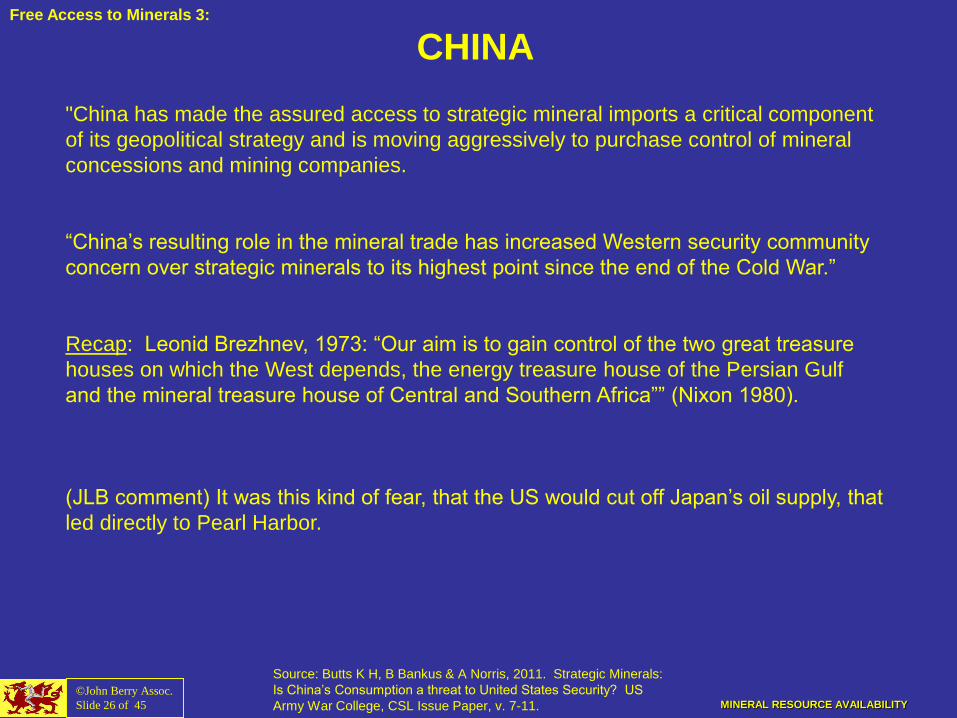
CHINA
"China has made the assured access to strategic mineral imports a critical component
of its geopolitical strategy and is moving aggressively to purchase control of mineral
concessions and mining companies.
“China’s resulting role in the mineral trade has increased Western security community
concern over strategic minerals to its highest point since the end of the Cold War.”
Recap: Leonid Brezhnev, 1973: “Our aim is to gain control of the two great treasure
houses on which the West depends, the energy treasure house of the Persian Gulf
and the mineral treasure house of Central and Southern Africa”” (Nixon 1980).
(JLB comment) It was this kind of fear, that the US would cut off Japan’s oil supply, that
led directly to Pearl Harbor.
Source: Butts K H, B Bankus & A Norris, 2011. Strategic Minerals:
Is China’s Consumption a threat to United States Security? US
Army War College, CSL Issue Paper, v. 7-11.
©John Berry Assoc.
Slide 26 of 45
Free Access to Minerals 3:
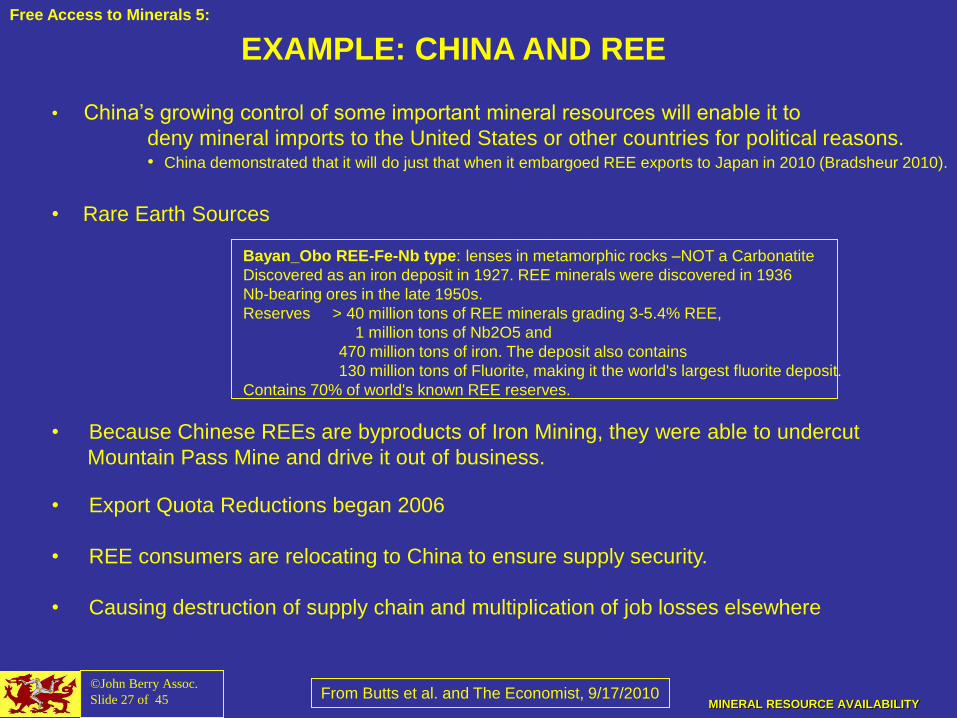
• China’s growing control of some important mineral resources will enable it to
deny mineral imports to the United States or other countries for political reasons. • China demonstrated that it will do just that when it embargoed REE exports to Japan in 2010 (Bradsheur 2010).
• Rare Earth Sources
Bayan_Obo REE-Fe-Nb type: lenses in metamorphic rocks –NOT a Carbonatite
Discovered as an iron deposit in 1927. REE minerals were discovered in 1936
Nb-bearing ores in the late 1950s.
Reserves > 40 million tons of REE minerals grading 3-5.4% REE,
1 million tons of Nb2O5 and
470 million tons of iron. The deposit also contains
130 million tons of Fluorite, making it the world's largest fluorite deposit.
Contains 70% of world's known REE reserves.
• Because Chinese REEs are byproducts of Iron Mining, they were able to undercut
Mountain Pass Mine and drive it out of business.
• Export Quota Reductions began 2006
• REE consumers are relocating to China to ensure supply security.
• Causing destruction of supply chain and multiplication of job losses elsewhere
MINERAL RESOURCE AVAILABILITY
©John Berry Assoc.
Slide 27 of 45
EXAMPLE: CHINA AND REE
From Butts et al. and The Economist, 9/17/2010
Free Access to Minerals 5:

MINERAL RESOURCE AVAILABILITY
©John Berry Assoc.
Slide 28 of 45
Problems for New REE Mining Ventures:
Rare Earths occur with radioactive thorium or uranium.
Extraction, separation and refining are difficult. (Ion-exchange, fractional Xtallisation and liquid-liquid X)
Requires lots of water, acid and electricity
Handling the radioactive and chemical waste produced in the process adds significantly to the cost.
(The Economist, 9/17/2010)
A “Rare Earth Rush” is developing in the west, with major exploration projects in the USA, Alaska,
Canada, Australia, Greenland, Vietnam, and Estonia.
This will lead to a Rare Earth mining “bubble”, which will depress prices for many years.
Mining more rare earths in the West is just the beginning.
Rebuilding the downstream supply chain for them is equally important (Steve Jobs, 2010):
purification, alloying, fabrication, end usage (batteries, screens, etc).
Otherwise processing and fabrication will be in China!
CHINA AND REE ELEMENTS (Cont)
From Butts et al.
Free Access to Minerals 6:
MINERAL RESOURCE AVAILABILITY ©John Berry Assoc.
Slide 30 of 45
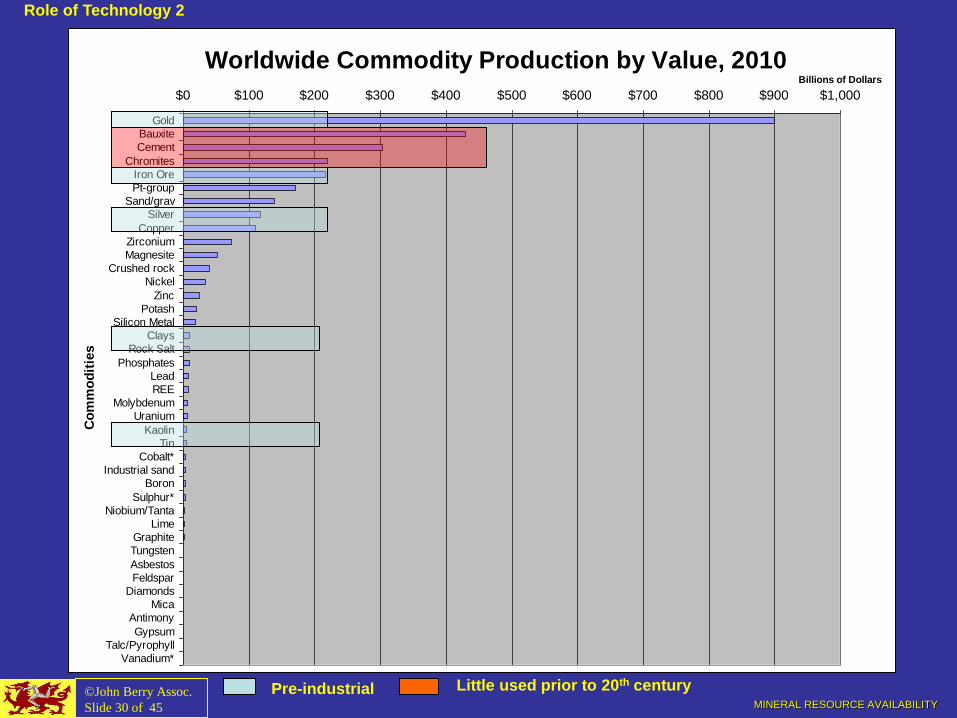
Worldwide Commodity Production by Value, 2010
$0 $100 $200 $300 $400 $500 $600 $700 $800 $900 $1,000
Gold
Bauxite
Cement
Chromites
Iron Ore
Pt-group
Sand/grav
Silver
Copper
Zirconium
Magnesite
Crushed rock
Nickel
Zinc
Potash
Silicon Metal
Clays
Rock Salt
Phosphates
Lead
REE
Molybdenum
Uranium
Kaolin
Tin
Cobalt*
Industrial sand
Boron
Sulphur*
Niobium/Tanta
Lime
Graphite
Tungsten
Asbestos
Feldspar
Diamonds
Mica
Antimony
Gypsum
Talc/Pyrophyll
Vanadium*
Co
mm
od
itie
sBillions of Dollars
Role of Technology 2
Pre-industrial Little used prior to 20th century
MINERAL RESOURCE AVAILABILITY
©John Berry Assoc.
Slide 31 of 45
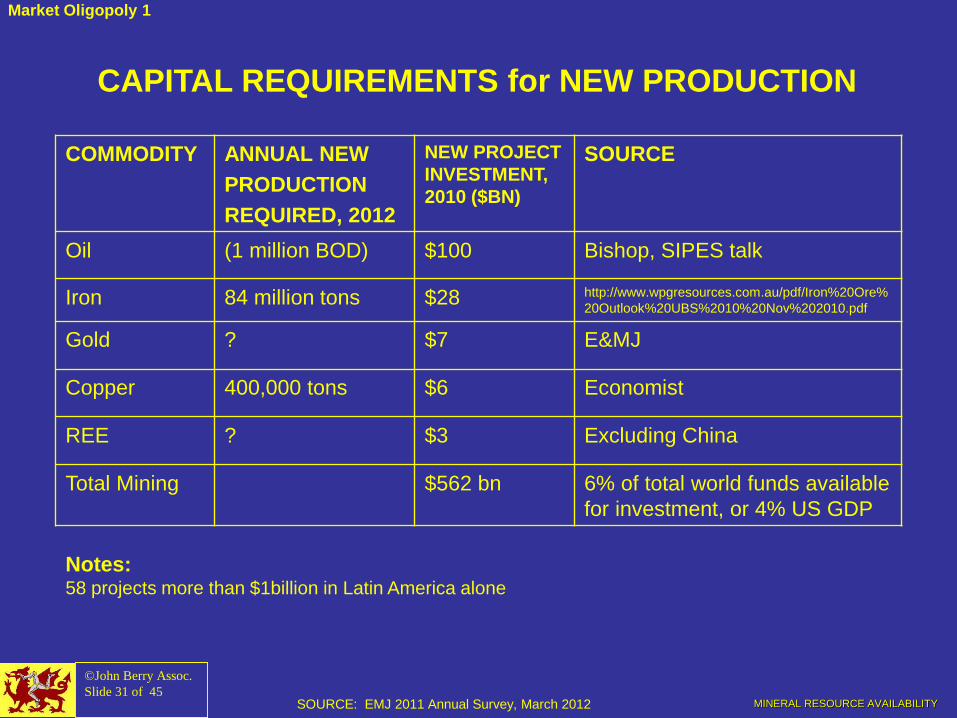
CAPITAL REQUIREMENTS for NEW PRODUCTION
SOURCE: EMJ 2011 Annual Survey, March 2012
COMMODITY ANNUAL NEW
PRODUCTION
REQUIRED, 2012
NEW PROJECT
INVESTMENT,
2010 ($BN)
SOURCE
Oil (1 million BOD) $100 Bishop, SIPES talk
Iron 84 million tons $28 http://www.wpgresources.com.au/pdf/Iron%20Ore%
20Outlook%20UBS%2010%20Nov%202010.pdf
Gold ? $7 E&MJ
Copper 400,000 tons $6 Economist
REE ? $3 Excluding China
Total Mining $562 bn 6% of total world funds available
for investment, or 4% US GDP
Notes: 58 projects more than $1billion in Latin America alone
Market Oligopoly 1
MINERAL RESOURCE AVAILABILITY
©John Berry Assoc.
Slide 32 of 45
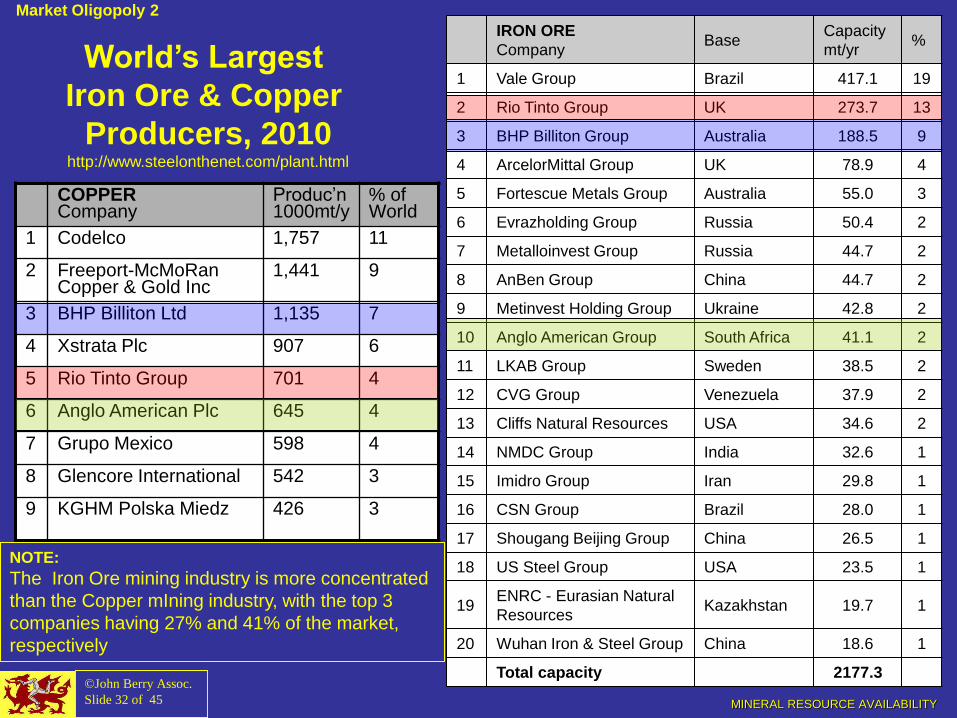
IRON ORE
Company Base
Capacity
mt/yr %
1 Vale Group Brazil 417.1 19
2 Rio Tinto Group UK 273.7 13
3 BHP Billiton Group Australia 188.5 9
4 ArcelorMittal Group UK 78.9 4
5 Fortescue Metals Group Australia 55.0 3
6 Evrazholding Group Russia 50.4 2
7 Metalloinvest Group Russia 44.7 2
8 AnBen Group China 44.7 2
9 Metinvest Holding Group Ukraine 42.8 2
10 Anglo American Group South Africa 41.1 2
11 LKAB Group Sweden 38.5 2
12 CVG Group Venezuela 37.9 2
13 Cliffs Natural Resources USA 34.6 2
14 NMDC Group India 32.6 1
15 Imidro Group Iran 29.8 1
16 CSN Group Brazil 28.0 1
17 Shougang Beijing Group China 26.5 1
18 US Steel Group USA 23.5 1
19 ENRC - Eurasian Natural
Resources Kazakhstan 19.7 1
20 Wuhan Iron & Steel Group China 18.6 1
Total capacity 2177.3
World’s Largest
Iron Ore & Copper
Producers, 2010 http://www.steelonthenet.com/plant.html
COPPER Company
Produc’n 1000mt/y
% of World
1 Codelco 1,757 11
2 Freeport-McMoRan Copper & Gold Inc
1,441 9
3 BHP Billiton Ltd 1,135 7
4 Xstrata Plc 907 6
5 Rio Tinto Group 701 4
6 Anglo American Plc 645 4
7 Grupo Mexico 598 4
8 Glencore International 542 3
9 KGHM Polska Miedz 426
3
NOTE:
The Iron Ore mining industry is more concentrated
than the Copper mIning industry, with the top 3
companies having 27% and 41% of the market,
respectively
Market Oligopoly 2
MINERAL RESOURCE AVAILABILITY ©John Berry Assoc.
Slide 32a of 45
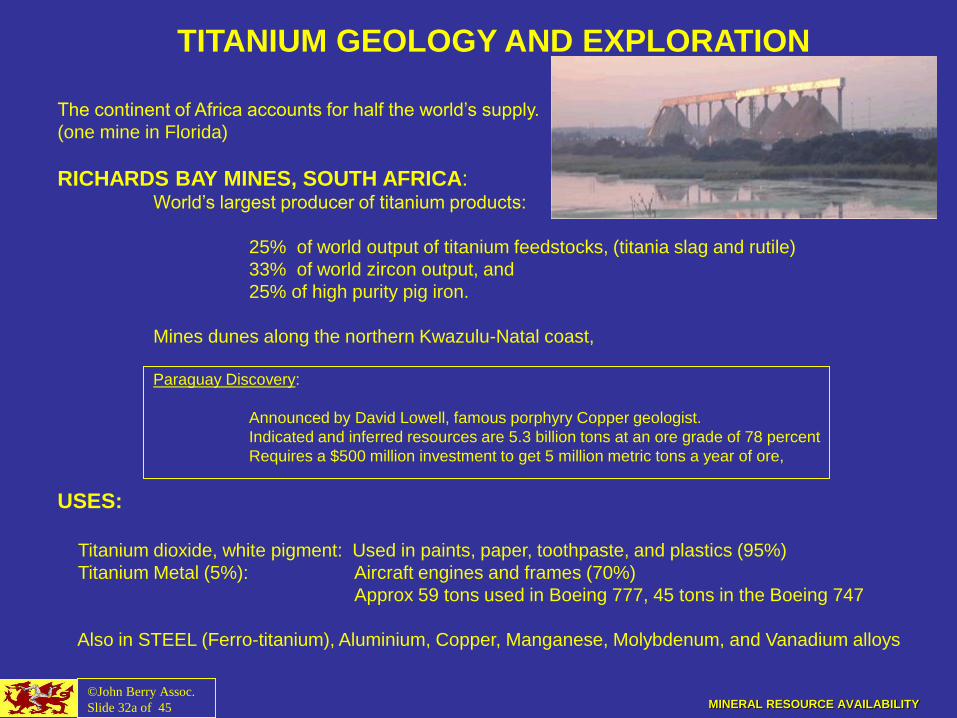
TITANIUM GEOLOGY AND EXPLORATION
The continent of Africa accounts for half the world’s supply.
(one mine in Florida)
RICHARDS BAY MINES, SOUTH AFRICA: World’s largest producer of titanium products:
25% of world output of titanium feedstocks, (titania slag and rutile)
33% of world zircon output, and
25% of high purity pig iron.
Mines dunes along the northern Kwazulu-Natal coast,
Paraguay Discovery:
Announced by David Lowell, famous porphyry Copper geologist.
Indicated and inferred resources are 5.3 billion tons at an ore grade of 78 percent
Requires a $500 million investment to get 5 million metric tons a year of ore,
USES:
Titanium dioxide, white pigment: Used in paints, paper, toothpaste, and plastics (95%)
Titanium Metal (5%): Aircraft engines and frames (70%)
Approx 59 tons used in Boeing 777, 45 tons in the Boeing 747
Also in STEEL (Ferro-titanium), Aluminium, Copper, Manganese, Molybdenum, and Vanadium alloys
MINERAL RESOURCE AVAILABILITY ©John Berry Assoc.
Slide 32b of 45
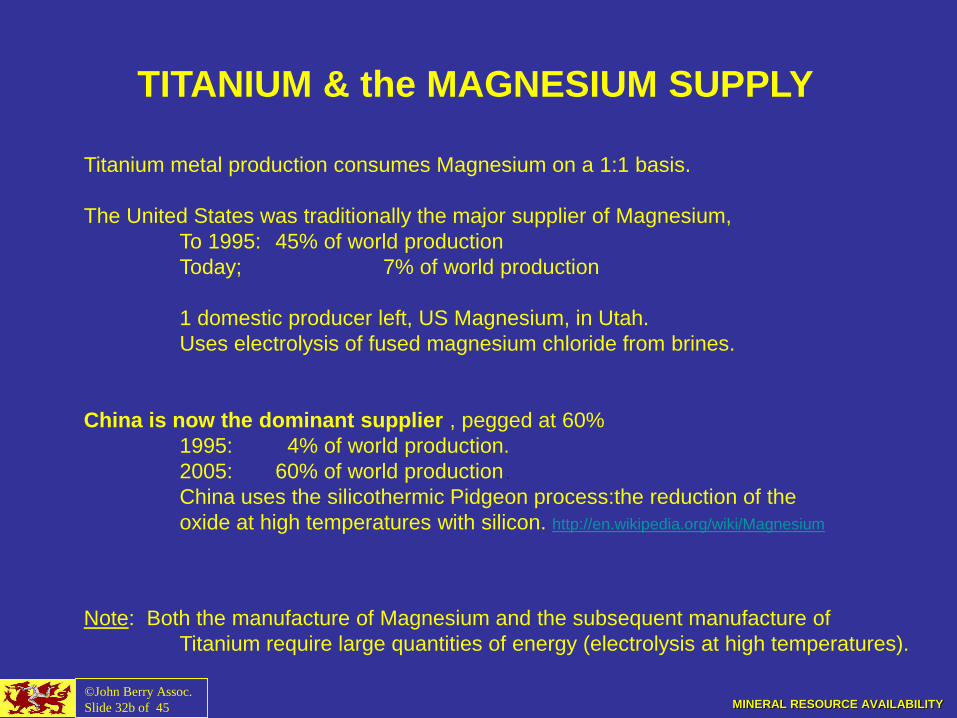
TITANIUM & the MAGNESIUM SUPPLY
Titanium metal production consumes Magnesium on a 1:1 basis.
The United States was traditionally the major supplier of Magnesium,
To 1995: 45% of world production
Today; 7% of world production
1 domestic producer left, US Magnesium, in Utah.
Uses electrolysis of fused magnesium chloride from brines.
China is now the dominant supplier , pegged at 60%
1995: 4% of world production.
2005: 60% of world production .
China uses the silicothermic Pidgeon process:the reduction of the
oxide at high temperatures with silicon. http://en.wikipedia.org/wiki/Magnesium
Note: Both the manufacture of Magnesium and the subsequent manufacture of
Titanium require large quantities of energy (electrolysis at high temperatures).

Mineral
Supply
Curve
D3 Sm
MINERAL RESOURCE AVAILABILITY
SUPPLY INELASTICITY: “BREAKDOWNS” OF THE
STANDARD MODEL OF THE LAW OF SUPPLY AND DEMAND
“If demand increases and supply remains unchanged, then it leads
to higher equilibrium price and quantity, etc.“
• The Price vs Quantity curve for minerals tends to be stepped, or
“lumpy” (my term).
• The volume of mineral supply is price inelastic over the short term
(up to several years) once current production capacity is reached
(blue curve – vertical section):
• it may require a huge investment of time and money (up to
$20billion and 25 years, see sidebar) to bring in a new deposit.
• The reverse is true: if overcapacity develops, production can
not easily be shut-in. Therefore there are long periods (up to
20 years) when mineral prices are unsustainably low (oil from
1986-2002; copper 1975-2004 (PoCu “bubble”, next slide)).
Example, from The Economist, 1/24/2112:
Oyu Tolgoi Cu/Au Mine, Mongolia
Discovery: 2001
Explo Drilling: 2003
Cost to 1st production (2013): $6bn
Expenditure to 2020: $10bn
Full Prod.Rate (2018): 450,000t Cu/yr
(3% of global total)
Mine represents 30% Mongolian GDP
©John Berry Assoc.
Slide 33 of 45
D5 D4

Time
Transition to
Open-Cast Mining
Ore-Grade
$8
5%
4%
3%
1%
2%
0%
0.5%
Ore
-Gra
de
Veins
Skarns
Sedimentary Copper
$3
$4
$5
$6
$7
$0
$1
$2
Pri
ce
in
19
98 $
Lan
d A
rea
Dis
turb
ed
/yr
(km
2)
1000
0
400
800
Production (106tons/yr)
Price (1998$)
Land
Disturbance
(km2/yr
COPPER SUPPLY 1900-2030: PRICES, VOLUMES & LAND DISTURBANCE
INVERSE SUPPLY_DEMAND CURVE
MANY PORPHYRY COPPERS DISCOVERED
MINERAL RESOURCE AVAILABILITY ©John Berry Assoc.
Slide 37 of 45
2050
Massive Sulfides
Porphyries
2000
PRICE SHOCK: SED CU
DEPOSITS IN FULL PRO-
DUCTION, NO NEW
DISCOVERIES FEW NEW PoCu
DISCOVERIES
INCREASING
ENVIRONMENTAL
ISSUES
Supply Inelasticity 5

MINERAL RESOURCE AVAILABILITY
©John Berry Assoc.
Slide 43 of 45
TECHNOLOGY - NEW ORE DEPOSIT TYPES
Iron-Oxide-Copper-Gold (IOCG) Deposits.
Contain Uranium and some REEs. Grades similar to PoCu.
World-class Olympic Dam deposit in S.Australia
Seabed Mn Nodules: Grades similar to Porphyry copper.
Much more inaccessible. Environmentally impermissible?
SOURCES: http://www.technologyreview.com/energy/38458/ http://www.outotec.com/pages/Page.aspx?id=38091&epslanguage=EN
NEW MINING TECHNOLOGY Solvent Extraction/Electrowinning: VERY energy intensive. Very harmful chemicals.
“Virtual Mining”: Machines controlled from surface. Capital intensive
Solution Mining: Groundwater effects hard to control. Can be very
energy intensive.
SUBSTITUTION
Carbon Composites – dependent on petroleum?
Nanotubes - volume production
Organo-Metals
Outukumpu Zinc solvent extraction plant
MINERAL RESOURCE AVAILABILITY ©John Berry Assoc.
Slide 45 of 45
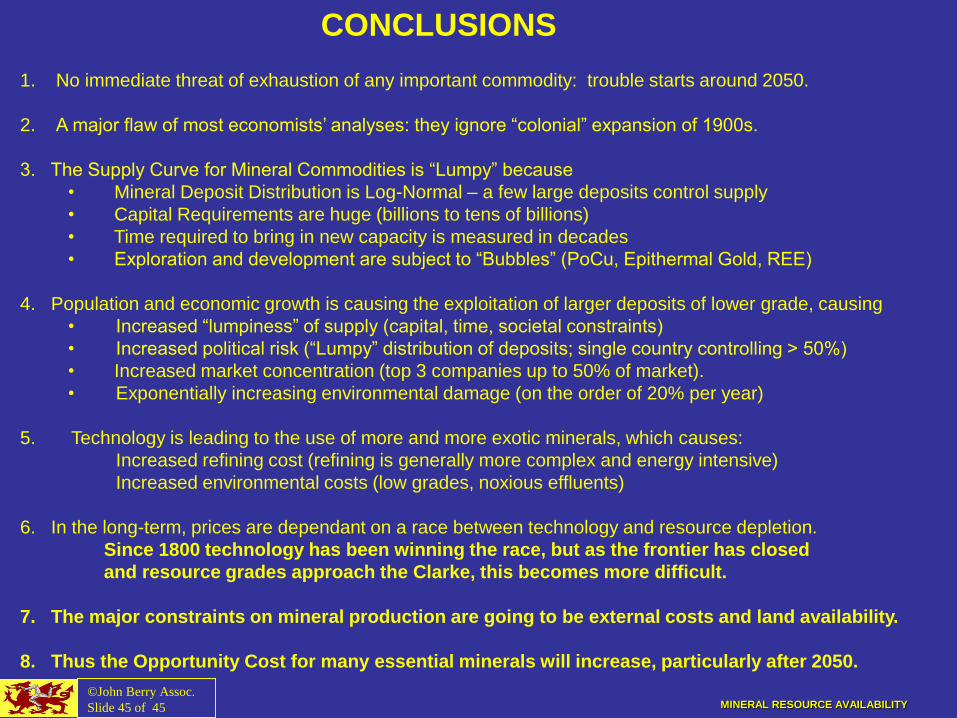
CONCLUSIONS
1. No immediate threat of exhaustion of any important commodity: trouble starts around 2050.
2. A major flaw of most economists’ analyses: they ignore “colonial” expansion of 1900s.
3. The Supply Curve for Mineral Commodities is “Lumpy” because
• Mineral Deposit Distribution is Log-Normal – a few large deposits control supply
• Capital Requirements are huge (billions to tens of billions)
• Time required to bring in new capacity is measured in decades
• Exploration and development are subject to “Bubbles” (PoCu, Epithermal Gold, REE)
4. Population and economic growth is causing the exploitation of larger deposits of lower grade, causing
• Increased “lumpiness” of supply (capital, time, societal constraints)
• Increased political risk (“Lumpy” distribution of deposits; single country controlling > 50%)
• Increased market concentration (top 3 companies up to 50% of market).
• Exponentially increasing environmental damage (on the order of 20% per year)
5. Technology is leading to the use of more and more exotic minerals, which causes:
Increased refining cost (refining is generally more complex and energy intensive)
Increased environmental costs (low grades, noxious effluents)
6. In the long-term, prices are dependant on a race between technology and resource depletion.
Since 1800 technology has been winning the race, but as the frontier has closed
and resource grades approach the Clarke, this becomes more difficult.
7. The major constraints on mineral production are going to be external costs and land availability.
8. Thus the Opportunity Cost for many essential minerals will increase, particularly after 2050.
MINERAL RESOURCE AVAILABILITY ©John Berry Assoc.
Slide 46 of 45
THE END
Thankyou!

MINERAL RESOURCE AVAILABILITY ©John Berry Assoc.
Slide 1 of 54
MINERAL RESOURCE AVAILABILITY
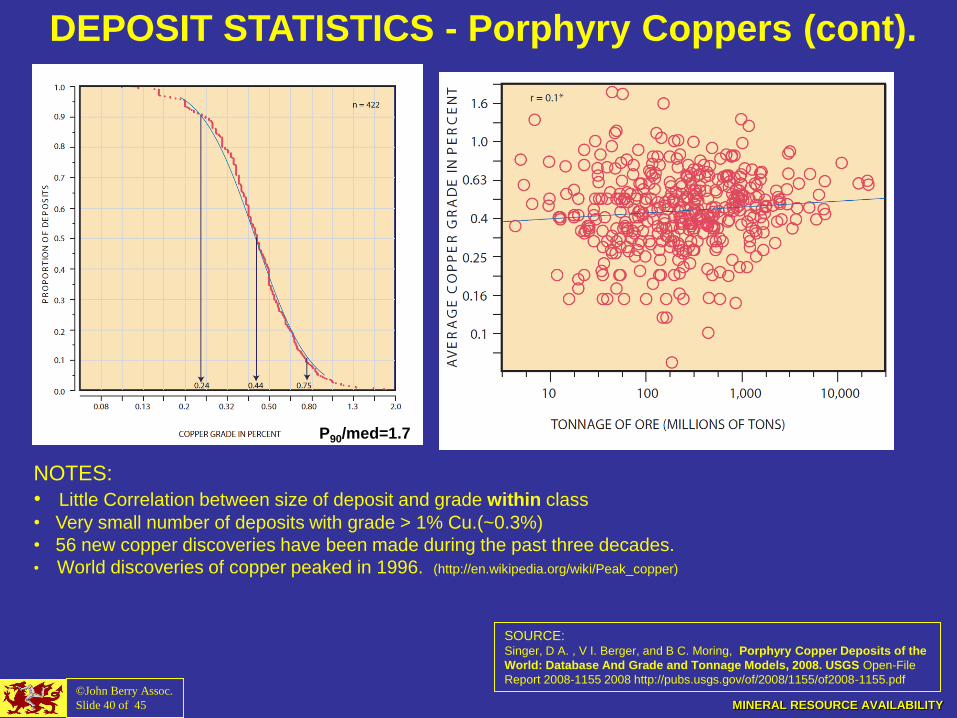
SOURCE: Singer, D A. , V I. Berger, and B C. Moring, Porphyry Copper Deposits of the
World: Database And Grade and Tonnage Models, 2008. USGS Open-File
Report 2008-1155 2008 http://pubs.usgs.gov/of/2008/1155/of2008-1155.pdf
NOTES:
• Little Correlation between size of deposit and grade within class
• Very small number of deposits with grade > 1% Cu.(~0.3%)
• 56 new copper discoveries have been made during the past three decades.
• World discoveries of copper peaked in 1996. (http://en.wikipedia.org/wiki/Peak_copper)
DEPOSIT STATISTICS - Porphyry Coppers (cont).
©John Berry Assoc.
Slide 40 of 45
P90/med=1.7

MINERAL RESOURCE AVAILABILITY
Source: Singer, Donald A, Grade and Tonnage Models for the ANALYSIS OF Nevada’s Mineral Resources. Chapter 11 in ???)
©John Berry Assoc.
Slide 42 of 45
WORLD AND NEVADA GOLD DEPOSIT STATISTICS
Grades: P90/median =2 Tonnage: P90/median = 7
MINERAL RESOURCE AVAILABILITY ©John Berry Assoc.
Slide 15 of 45
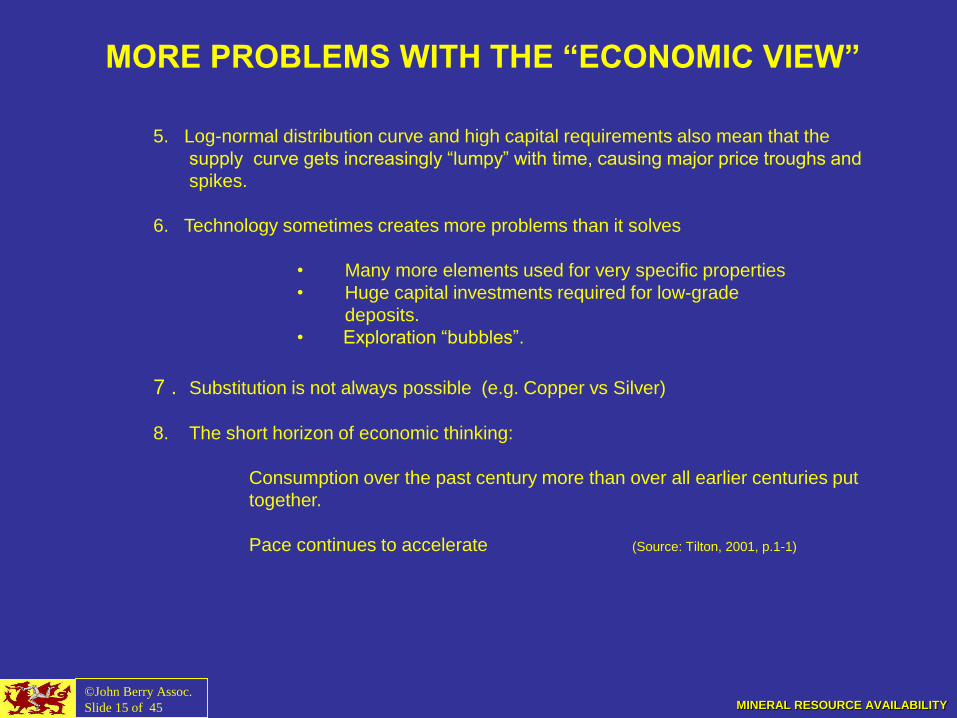
MORE PROBLEMS WITH THE “ECONOMIC VIEW”
5. Log-normal distribution curve and high capital requirements also mean that the
supply curve gets increasingly “lumpy” with time, causing major price troughs and
spikes.
6. Technology sometimes creates more problems than it solves
• Many more elements used for very specific properties
• Huge capital investments required for low-grade
deposits.
• Exploration “bubbles”.
7 . Substitution is not always possible (e.g. Copper vs Silver)
8. The short horizon of economic thinking:
Consumption over the past century more than over all earlier centuries put
together.
Pace continues to accelerate (Source: Tilton, 2001, p.1-1)
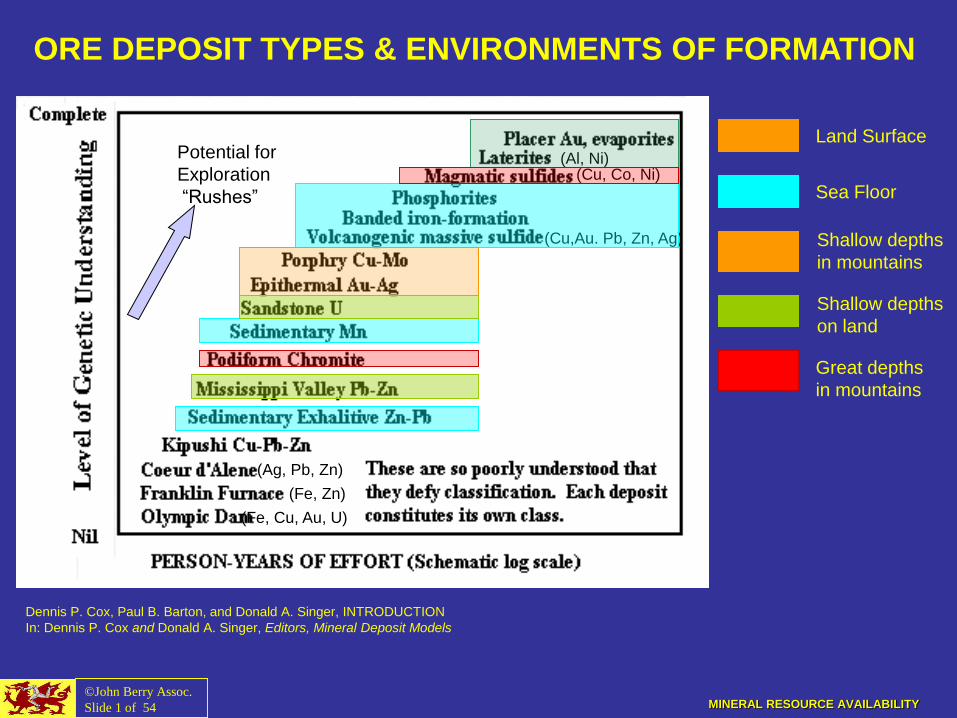
(Fe, Cu, Au, U)
(Ag, Pb, Zn)
(Fe, Zn)
(Al, Ni) (Cu, Co, Ni)
(Cu,Au. Pb, Zn, Ag)
Land Surface
Sea Floor
Shallow depths
in mountains
Shallow depths
on land
Great depths
in mountains
Potential for
Exploration
“Rushes”
MINERAL RESOURCE AVAILABILITY ©John Berry Assoc.
Slide 1 of 54
Dennis P. Cox, Paul B. Barton, and Donald A. Singer, INTRODUCTION
In: Dennis P. Cox and Donald A. Singer, Editors, Mineral Deposit Models
ORE DEPOSIT TYPES & ENVIRONMENTS OF FORMATION
MINERAL RESOURCE AVAILABILITY
©John Berry Assoc.
Slide 1 of 54
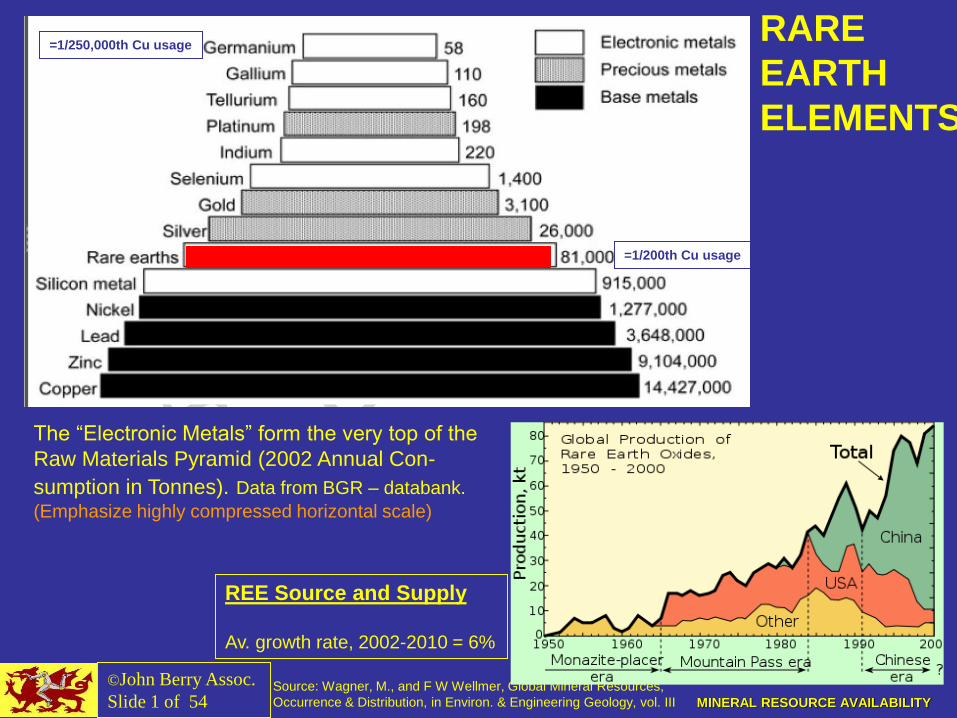
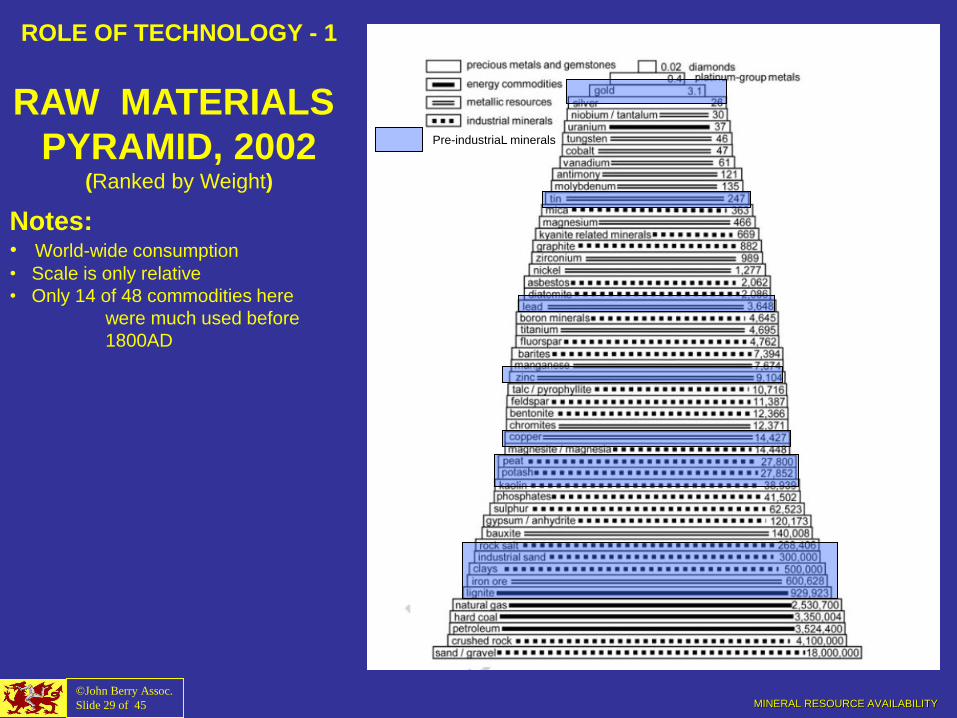
Source: Wagner, M., and F W Wellmer, Global Mineral Resources,
Occurrence & Distribution, in Environ. & Engineering Geology, vol. III
The “Electronic Metals” form the very top of the
Raw Materials Pyramid (2002 Annual Con-
sumption in Tonnes). Data from BGR – databank.
(Emphasize highly compressed horizontal scale)
2010: 130,000t
REE Source and Supply
Av. growth rate, 2002-2010 = 6%
RARE
EARTH
ELEMENTS
=1/250,000th Cu usage
=1/200th Cu usage
MINERAL RESOURCE AVAILABILITY
©John Berry Assoc.
Slide 1 of 54
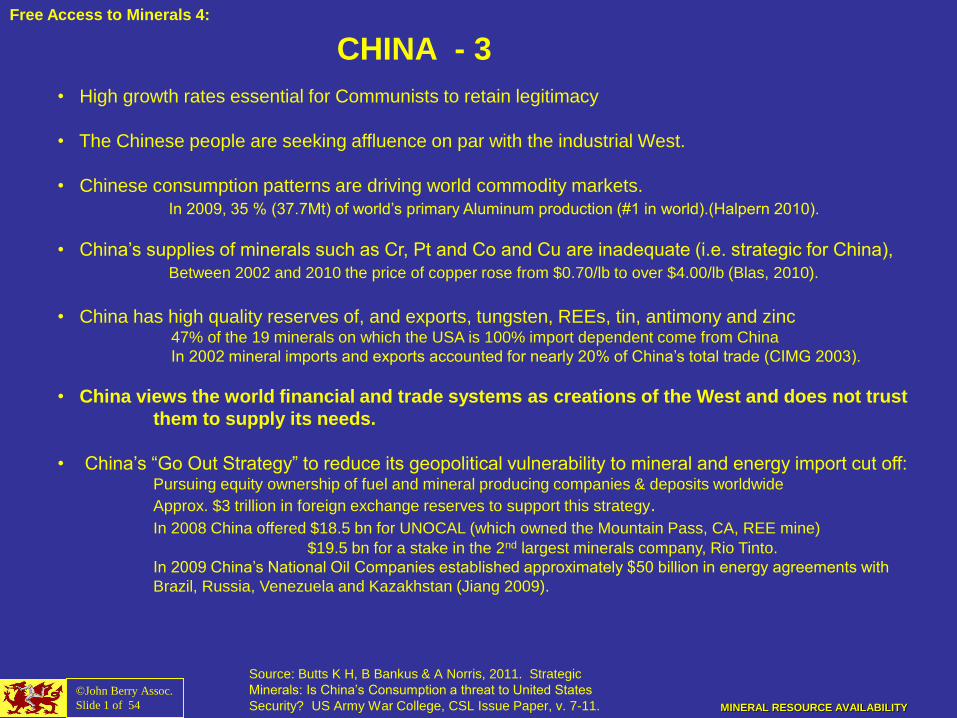
CHINA - 3
• High growth rates essential for Communists to retain legitimacy
• The Chinese people are seeking affluence on par with the industrial West.
• Chinese consumption patterns are driving world commodity markets.
In 2009, 35 % (37.7Mt) of world’s primary Aluminum production (#1 in world).(Halpern 2010).
• China’s supplies of minerals such as Cr, Pt and Co and Cu are inadequate (i.e. strategic for China),
Between 2002 and 2010 the price of copper rose from $0.70/lb to over $4.00/lb (Blas, 2010).
• China has high quality reserves of, and exports, tungsten, REEs, tin, antimony and zinc
47% of the 19 minerals on which the USA is 100% import dependent come from China
In 2002 mineral imports and exports accounted for nearly 20% of China’s total trade (CIMG 2003).
• China views the world financial and trade systems as creations of the West and does not trust
them to supply its needs.
• China’s “Go Out Strategy” to reduce its geopolitical vulnerability to mineral and energy import cut off: Pursuing equity ownership of fuel and mineral producing companies & deposits worldwide
Approx. $3 trillion in foreign exchange reserves to support this strategy.
In 2008 China offered $18.5 bn for UNOCAL (which owned the Mountain Pass, CA, REE mine)
$19.5 bn for a stake in the 2nd largest minerals company, Rio Tinto.
In 2009 China’s National Oil Companies established approximately $50 billion in energy agreements with
Brazil, Russia, Venezuela and Kazakhstan (Jiang 2009).
Free Access to Minerals 4:
Source: Butts K H, B Bankus & A Norris, 2011. Strategic
Minerals: Is China’s Consumption a threat to United States
Security? US Army War College, CSL Issue Paper, v. 7-11.

MINERAL RESOURCE AVAILABILITY
©John Berry Assoc.
Slide 1 of 54
RARE EARTH ELEMENTS
aka “LANTHANIDES”, plus Scandium & Yttrium
GEOLOGY:
REE are found in mineable concentrations mainly in fascinating rocks called Carbonatites. • These are intrusive or, rarely, extrusive igneous rocks consisting of >50 percent carbonate (e.g. calcite)
• Carbonatites usually occur as small plugs within zoned alkalic intrusive complexes, or as breccias.
• They occur in continental rift-related tectonic settings.
• Only one carbonatite volcano is known to have erupted in historical time, Ol Doinyo Lengai volcano in
Tanzania. It erupts with the lowest temperature lava in the world, at 500-600 °C.
• Nb; Nb–rutile and Nb–ilmenite occur in some deposits.
• Monazite (Ce,La,Di)PO4, Bastnaesite (CeF)CO3, and synchysite are the most important source of REE elements.
• Much of China’s production is a by-product of iron mining in Inner Mongolia (The Economist, 9/17/2010)
WHAT THEY ARE:
Elements in Group 3
of the Atomic Table,
in the 7th Period
Lanthanum
Cerium
Prasodymium
Neodymium
Promethium
Samarium
Europium
Gadolinium
Terbium
Dysprosium
Holmium
Erbium
Thulium
Ytterbium
Lutetium
MINERALOGY
Bastnäsite: US, China
Monazite: Rest of world
Phosphorites: Florida
REE can also be found in clays and in placer deposits derived from carbonatites
MINERAL RESOURCE AVAILABILITY ©John Berry Assoc.
Slide 1 of 54
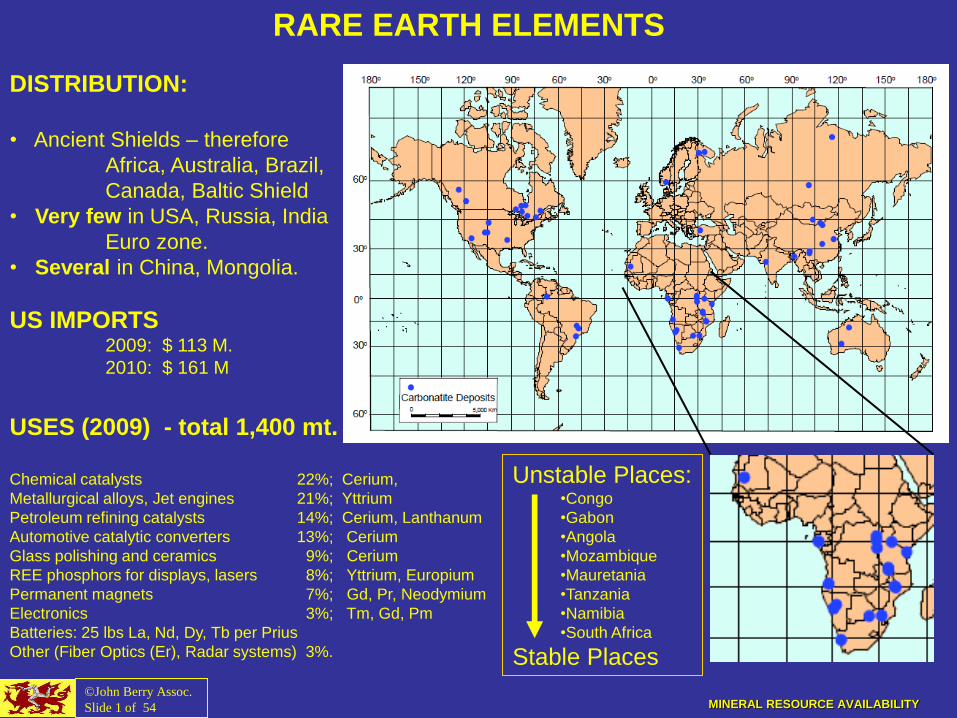
DISTRIBUTION:
• Ancient Shields – therefore
Africa, Australia, Brazil,
Canada, Baltic Shield
• Very few in USA, Russia, India
Euro zone.
• Several in China, Mongolia.
US IMPORTS 2009: $ 113 M.
2010: $ 161 M
RARE EARTH ELEMENTS
Unstable Places: •Congo
•Gabon
•Angola
•Mozambique
•Mauretania
•Tanzania
•Namibia
•South Africa
Stable Places
USES (2009) - total 1,400 mt.
Chemical catalysts 22%; Cerium,
Metallurgical alloys, Jet engines 21%; Yttrium
Petroleum refining catalysts 14%; Cerium, Lanthanum
Automotive catalytic converters 13%; Cerium
Glass polishing and ceramics 9%; Cerium
REE phosphors for displays, lasers 8%; Yttrium, Europium
Permanent magnets 7%; Gd, Pr, Neodymium
Electronics 3%; Tm, Gd, Pm
Batteries: 25 lbs La, Nd, Dy, Tb per Prius
Other (Fiber Optics (Er), Radar systems) 3%.
MINERAL RESOURCE AVAILABILITY ©John Berry Assoc.
Slide 1 of 54
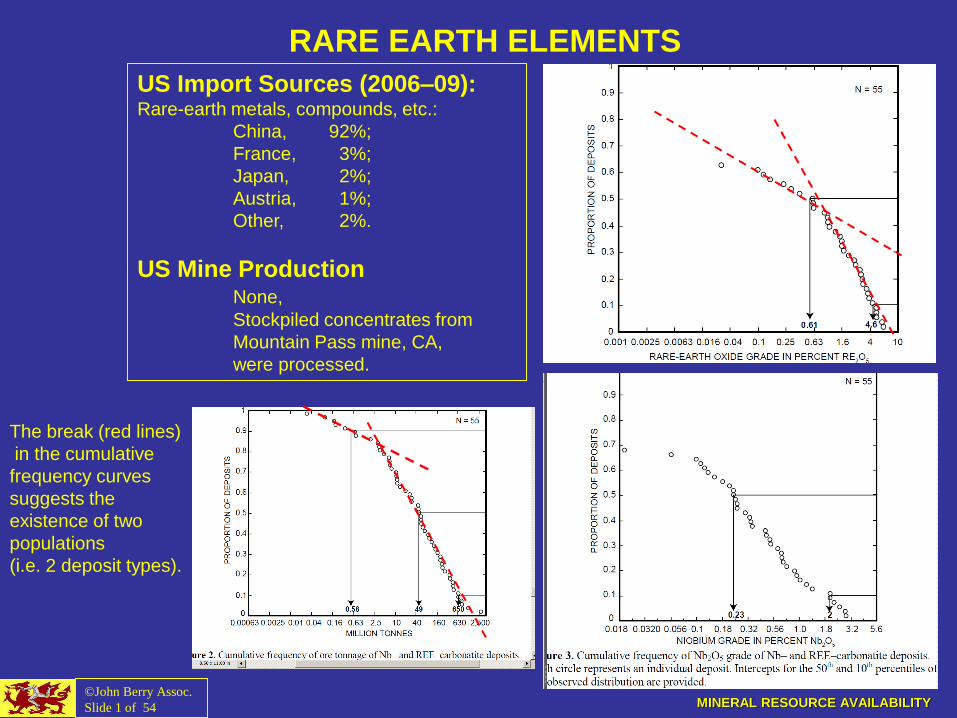
RARE EARTH ELEMENTS
US Import Sources (2006–09): Rare-earth metals, compounds, etc.:
China, 92%;
France, 3%;
Japan, 2%;
Austria, 1%;
Other, 2%.
US Mine Production None,
Stockpiled concentrates from
Mountain Pass mine, CA,
were processed.
The break (red lines)
in the cumulative
frequency curves
suggests the
existence of two
populations
(i.e. 2 deposit types).

MINERAL RESOURCE AVAILABILITY
©John Berry Assoc.
Slide 1 of 54
REE EXPLORATION & DEVELOPMENT “RUSH”
Mining Companies are trying to reopen old mines and develop new supplies:
Hoidas Lake, Canada: could supply about 10% of the $1 billion market for REE in N. America.
Mountain Pass Mine: Molycorp has raised $500 million. Projected to reopen in 2011.
SE Nebraska: Quantum Rare Earth Devel., of Canada, conducting test drilling.
Alaska: Ucore Rare Metals, of Canada, has started drilling for REE.
Kvanefjeld, Greenland: large, recent discovery. Drilling at this site has confirmed significant
quantities of black lujavrite, which contains ~1% rare earth oxides (REO).
Vietnam: agreed in 2010 to supply Japan with rare earths from Lai Châu Province.
Mt. Weld, Australia: Ore to be refined at Kuantan, Malaya. Designed to supply 1/3 of world’s
demand, exclusive of China. $730 million already spent on it. The
Lanthanide concentrate from Mount Weld is “slightly radioactive”: this has
caused permitting and political problems.
(At Bukit Merah in Perak, a rare-earth mine operated by Mitsubishi,
closed in 1992 and left continuing environmental and health concerns).
Estonia (Alum Shale): Tailings from 50 years of uranium, shale and loparite mining at
Sillamäe are now ore, and yield 3000 mt, or 2% of world REE production.
Nuclear reprocessing: Nuclear fission produces a full range of elements. Due to the radioactivity
hazard, it is unlikely that refining can be done safely and economically.
MINERAL RESOURCE AVAILABILITY ©John Berry Assoc.
Slide 34 of 45
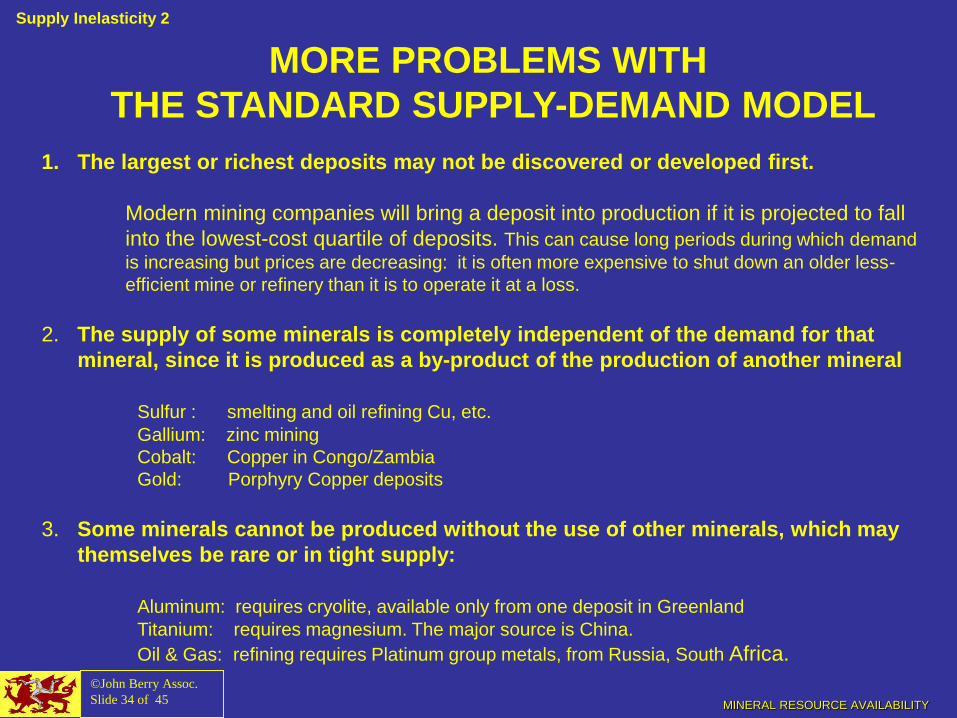
MORE PROBLEMS WITH
THE STANDARD SUPPLY-DEMAND MODEL
1. The largest or richest deposits may not be discovered or developed first.
Modern mining companies will bring a deposit into production if it is projected to fall
into the lowest-cost quartile of deposits. This can cause long periods during which demand
is increasing but prices are decreasing: it is often more expensive to shut down an older less-
efficient mine or refinery than it is to operate it at a loss.
2. The supply of some minerals is completely independent of the demand for that
mineral, since it is produced as a by-product of the production of another mineral
Sulfur : smelting and oil refining Cu, etc.
Gallium: zinc mining
Cobalt: Copper in Congo/Zambia
Gold: Porphyry Copper deposits
3. Some minerals cannot be produced without the use of other minerals, which may
themselves be rare or in tight supply:
Aluminum: requires cryolite, available only from one deposit in Greenland
Titanium: requires magnesium. The major source is China.
Oil & Gas: refining requires Platinum group metals, from Russia, South Africa.
Supply Inelasticity 2

MINERAL RESOURCE AVAILABILITY ©John Berry Assoc.
Slide 1 of 54
TITANIUM
PROCESSING:
The Kroll process used to extract titanium from its various ores is laborious and costly:
it sacrifices another expensive metal, Magnesium.
Chlorine gas is passed over red-hot rutile or ilmenite in the presence of carbon to make Titanium
tetrachloride TiCl4. This is condensed and purified by fractional distillation and then reduced with
800 °C molten magnesium in an argon atmosphere.
USES:
• Titanium dioxide, white pigment used in paints, paper, toothpaste, and plastics (95%)
• Titanium Metal (5%)
Aircraft engines and frames (70%)
The SR-71 “Blackbird”.
Approx 59 tons used in Boeing 777, 45 tons in the Boeing 747
• As a strengthening agent in graphite composite fishing rods and golf clubs and bicycles.
• Also in STEEL (Ferro-titanium), Aluminium, Copper, Manganese, Molybdenum, and Vanadium alloys
• Powdered titanium is used in pyrotechnics as a source of bright-burning particles.

MINERAL RESOURCE AVAILABILITY
The “LUMPY” SUPPLY CURVE
Deposit Types, Prices and Volumes
• Almost all mineral commodities are found in a variety of different types of deposit
• Each type of deposit is characterized by its own average size and grade, etc.
• Large, low grade deposits require lots of capital,
energy, other resources, and land, but
have low labor costs and low cost in $/ton.
• Low grade deposits are much more environmentally
unfriendly than high-grade deposits (amount
of land disturbance, permanence of damage,
damage to waterways, carbon footprint).
©John Berry Assoc.
Slide 35 of 45
Grade
Output
Deposit Size
Energy
Inputs
Cost/Ton
Ore
Gra
de %
Co
st
in D
olla
rs
Supply Inelasticity 3
Nkana Mine, Zambia, 1971
Nchanga Mine, Zambia, 1971
MINERAL RESOURCE AVAILABILITY ©John Berry Assoc.
Slide 1 of 54
CHROMIUM
PRODUCTION, 2000: ~4.4 million mt of chromite ore, converted into
~3.3 million tons of ferro-chrome
MARKET VALUE: $2.5 billion
PRODUCTION BY COUNTRY:
South Africa 44%
India 18%
Kazakhstan 16%
Zimbabwe 5%
Finland 4%
Iran 4%
BrazIl 2%
GEOLOGY: Found in peridotite from the Earth's mantle, and serpentinite,
its metamorphosed equivalent.
It also occurs in layered ultramafic intrusive rocks, of which
the Bushveld Complex in South Africa and the
Great Dyke of Zimbabwe are the largest
The Stillwater igneous complex in Montana also
contains significant chromite.
Chromite layers occur as early precipitates from the molten rock:
The Merensky Reef of the Bushveld Complex is
very thin (<1m) but consists of 90% chromite.
MINERAL RESOURCE AVAILABILITY
©John Berry Assoc.
Slide 1 of 54
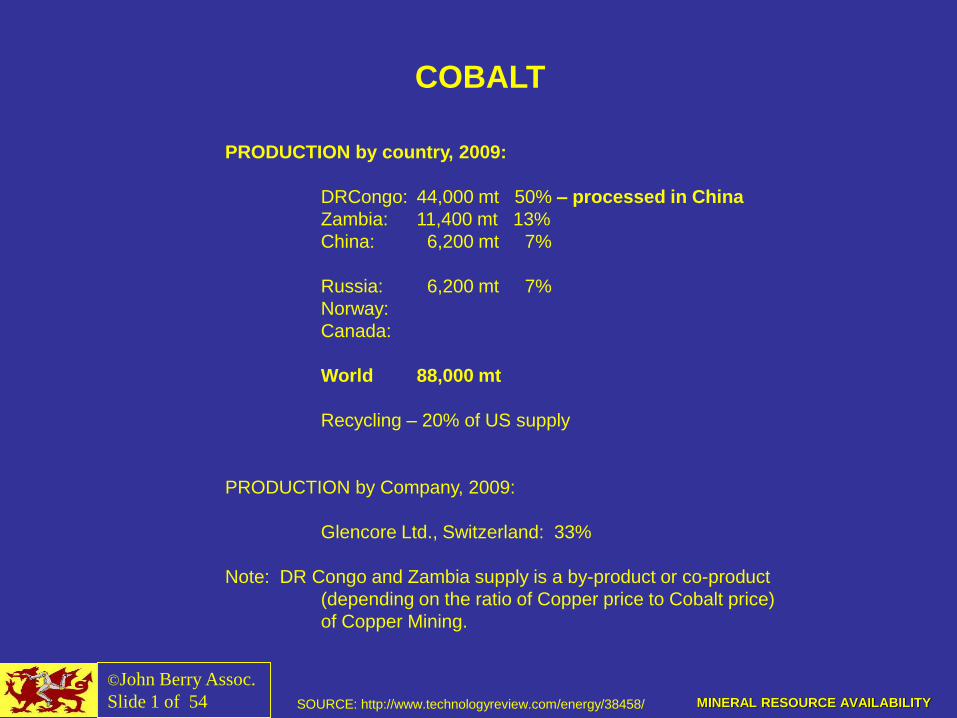
COBALT
SOURCE: http://www.technologyreview.com/energy/38458/
PRODUCTION by country, 2009:
DRCongo: 44,000 mt 50% – processed in China
Zambia: 11,400 mt 13%
China: 6,200 mt 7%
Russia: 6,200 mt 7%
Norway:
Canada:
World 88,000 mt
Recycling – 20% of US supply
PRODUCTION by Company, 2009:
Glencore Ltd., Switzerland: 33%
Note: DR Congo and Zambia supply is a by-product or co-product
(depending on the ratio of Copper price to Cobalt price)
of Copper Mining.
= Standard Model of supply and
demand breaks down temporarily
MINERAL RESOURCE AVAILABILITY
Grade (%, oz/ton, etc.)
Tons o
f O
re
“Clarke”
101
103
102
106
1012
109
10-2 10-3 102 (100%) 10 1 10-1
Native Cu in
Volcanics (1800s)
Veins (to 1920)
Porphyry Coppers
(1960-2100?)
Sedimentary Copper
(1936-1980)
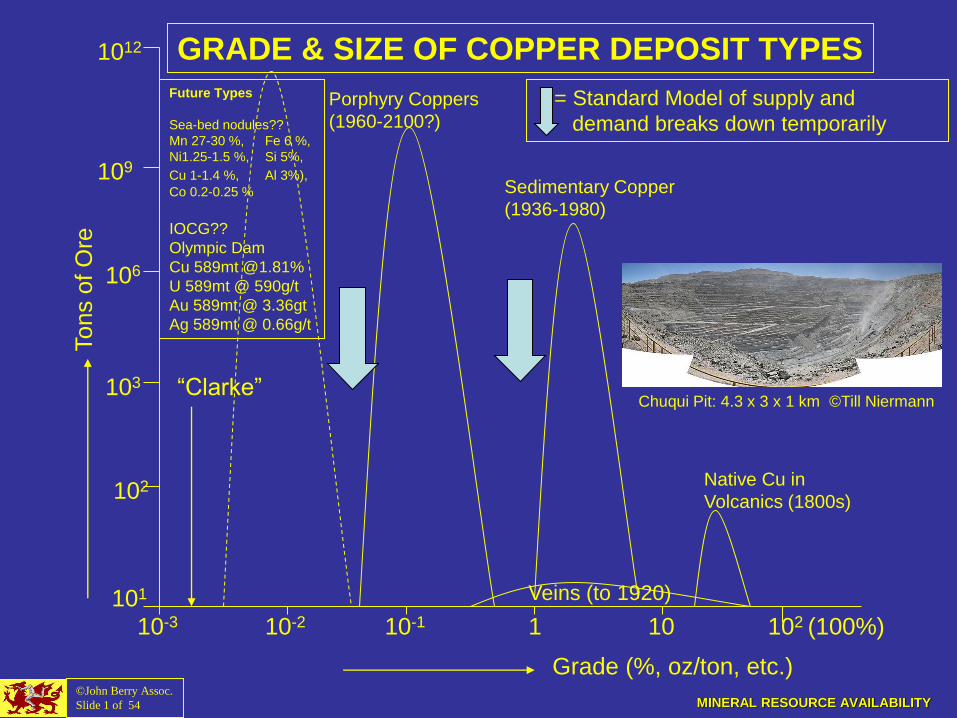
GRADE & SIZE OF COPPER DEPOSIT TYPES
Future Types
Sea-bed nodules??
Mn 27-30 %, Fe 6 %,
Ni1.25-1.5 %, Si 5%,
Cu 1-1.4 %, Al 3%), Co 0.2-0.25 %
IOCG??
Olympic Dam
Cu 589mt @1.81%
U 589mt @ 590g/t
Au 589mt @ 3.36gt
Ag 589mt @ 0.66g/t
©John Berry Assoc.
Slide 1 of 54
Chuqui Pit: 4.3 x 3 x 1 km ©Till Niermann

MINERAL RESOURCE AVAILABILITY
• Deposit type becomes ex-
hausted: HUGE & possibly
PERMANENT JUMP in price
• The price may then decline
slightly over time as more de-
posits of the same type are
found and efficiencies increase.
• “Exploration Rush”: prices may
decline steeply and for a long
time.
• Supply from a few very large deposits: one deposit goes off-line - large but temporary (decade)
jump in price until new supplies are developed.
“LUMPY” SUPPLY CURVE (cont.)
Source: Singer
Metals Economics Group (December 15, 2011) ”Copper will almost certainly go into
surplus for the first time in many years but the lack of significant discoveries and the
challenges faced by today’s developers mean that a brief period (3 yrs) of over-supply
will be followed by another prolonged period of deficit.” ©John Berry Assoc.
Slide 36 of 45
GRADES AND SIZES OF COPPER DEPOSIT TYPES
Supply Inelasticity 4
MINERAL RESOURCE AVAILABILITY ©John Berry Assoc.
Slide 44 of 45
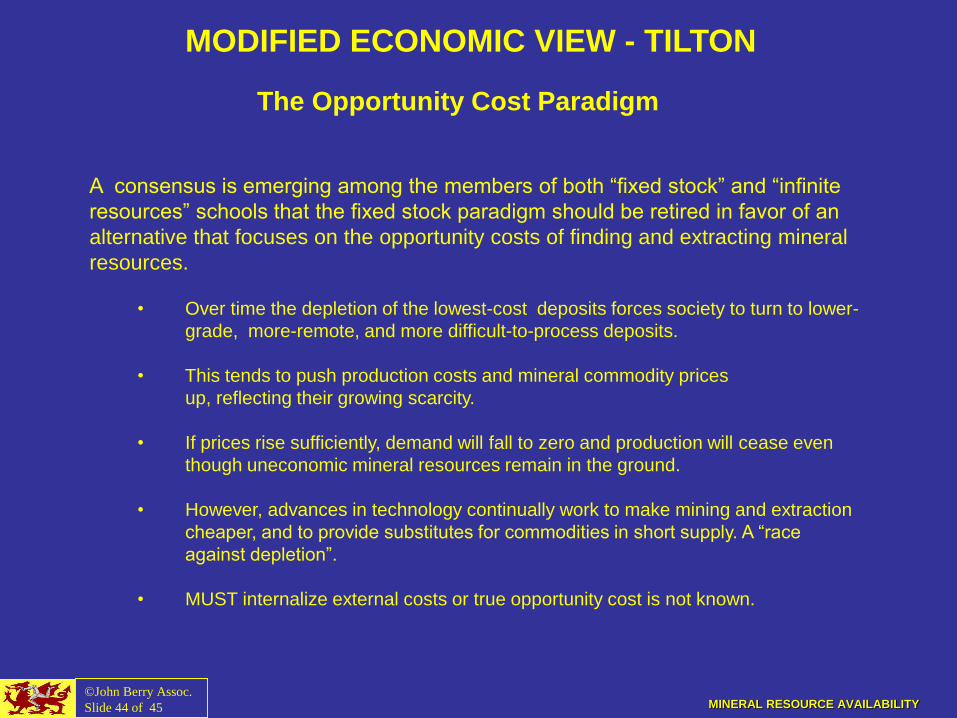
MODIFIED ECONOMIC VIEW - TILTON
The Opportunity Cost Paradigm
A consensus is emerging among the members of both “fixed stock” and “infinite
resources” schools that the fixed stock paradigm should be retired in favor of an
alternative that focuses on the opportunity costs of finding and extracting mineral
resources.
• Over time the depletion of the lowest-cost deposits forces society to turn to lower-
grade, more-remote, and more difficult-to-process deposits.
• This tends to push production costs and mineral commodity prices
up, reflecting their growing scarcity.
• If prices rise sufficiently, demand will fall to zero and production will cease even
though uneconomic mineral resources remain in the ground.
• However, advances in technology continually work to make mining and extraction
cheaper, and to provide substitutes for commodities in short supply. A “race
against depletion”.
• MUST internalize external costs or true opportunity cost is not known.
MINERAL RESOURCE AVAILABILITY
ROLE OF TECHNOLOGY - 1
RAW MATERIALS
PYRAMID, 2002 (Ranked by Weight)
Notes: • World-wide consumption
• Scale is only relative
• Only 14 of 48 commodities here
were much used before
1800AD
©John Berry Assoc.
Slide 29 of 45
Pre-industriaL minerals

MINERAL RESOURCE AVAILABILITY ©John Berry Assoc.
Slide 1 of 54