mineral assemblages and phase equilibria of metabasites
TRANSCRIPT
J Metamorph Geol. 2019;00:1–32. wileyonlinelibrary.com/journal/jmg | 1© 2019 John Wiley & Sons Ltd
Received: 27 June 2019 | Revised: 23 October 2019 | Accepted: 24 October 2019
DOI: 10.1111/jmg.12513
O R I G I N A L A R T I C L E
Mineral assemblages and phase equilibria of metabasites from the prehnite–pumpellyite to amphibolite facies, with the Flin Flon Greenstone Belt (Manitoba) as a type example
Paul G. Starr1 | David R. M. Pattison1 | Doreen E. Ames2
1Department of Geoscience, University of Calgary, Calgary, AB, Canada2Geological Survey of Canada, Ottawa, ON, Canada
CorrespondencePaul G. Starr, Department of Geoscience, University of Calgary, 2500 University Drive NW, Calgary AB T2N 1N4, Canada.Email: [email protected]
Present addressPaul G. Starr, Department of Earth and Environmental Sciences, Boston College, 140 Commonwealth Avenue, Chestnut Hill, MA, USA
Funding informationNatural Sciences and Engineering Research Council of Canada, Grant/Award Number: 037233
Handling Editor: Richard White
AbstractAn exceptionally well-exposed part of the Flin Flon Greenstone Belt (Manitoba/Saskatchewan) is used to characterize the mineral assemblage evolution associated with prehnite–pumpellyite through amphibolite facies metamorphism of basalts. Data from these rocks are combined with a large literature data set to assess the ability of current thermodynamic models to reproduce natural patterns, evaluate the use of metabasic rocks at these grades to estimate pressure–temperature (P–T) condi-tions of metamorphism, and to comment on the metamorphic devolatilization that occurs. At Flin Flon, five major isograds (actinolite-in, prehnite- and pumpellyite-out, hornblende-in, oligoclase-in, and actinolite-out) collectively represent passage from prehnite–pumpellyite to lower amphibolite facies conditions. The evolution in mineral assemblages occurs in two narrow (~1,000 m) zones: the prehnite–pumpel-lyite to greenschist facies (PP-GS) transition and greenschist to amphibolite facies (GS-AM) transition. Across the GS-AM transition, significant increases in the horn-blende and oligoclase proportions occur at the expense of actinolite, albite, chlorite, and titanite, whereas there is little change in the proportions of epidote. The ma-jority of this mineral transformation occurs above the oligoclase-in isograd within the hornblende–actinolite–oligoclase zone. Comparison with thermodynamic mod-elling results suggests data set 5 (DS5) of Holland and Powell (1998, Journal of Metamorphic Geology, 16(3):309–343) and associated activity–composition (a–x) models is generally successful in reproducing natural observations, whereas data set 6 (DS6) (Holland & Powell, 2011, Journal of Metamorphic Geology, 29(3):333–383) and associated a–x models fail to reproduce the observed mineral isograds and compositions. When the data from Flin Flon are combined with data from the litera-ture, two main pressure-sensitive facies series for metabasites are revealed, based on prograde passage below or above a hornblende–albite bathograd at ~3.3 kbar: a low-pressure ‘actinolite–oligoclase type’ facies series, characterized by the appearance of oligoclase before hornblende, and a moderate- to high-pressure ‘hornblende–albite type’ facies series, characterized by the appearance of hornblende before oligoclase. Concerning the PP-GS transition, the mineral assemblage evolution in Flin Flon sug-gests it occurs over a small zone (<1,000 m), in which assemblages containing true transitional assemblages (prehnite and/or pumpellyite coexisting with actinolite) are
2 | STARR eT Al.
1 | INTRODUCTION
Metamorphosed basalts spanning the prehnite–pumpellyite to amphibolite facies represent some of the most abundant metamorphic rocks on the planet, forming a component of most orogenic belts and representing the dominant metamor-phic lithology within Archaean and Proterozoic greenstone belts (e.g. Furnes, Dilek, & De Wit, 2015). Understanding the metamorphic evolution of such rocks is needed to constrain the thermal regime that existed during metamorphism, which in turn provides important insights into the construction of cratonic belts and the geochemical and tectonic evolution of greenstone belts (e.g. Archibald, Bettenay, Binns, Groves, & Gunthorpe, 1978; Furnes et al., 2015). In addition, rocks of this grade within greenstone belts commonly host a variety of ore deposits, including volcanogenic massive sulphide de-posits, and the fluids produced as a result of metamorphic devolatilization across the greenschist–amphibolite facies transition have been linked to the formation of orogenic gold deposits (e.g. Elmer, White, & Powell, 2006; Goldfarb et al., 2005; Goldfarb & Groves, 2015; Powell, Will, & Phillips, 1991; Tomkins, 2010, 2013).
Despite their importance, our knowledge of the evolution of metamorphic mineral assemblages in subgreenschist to lower amphibolite facies metabasaltic rocks, and our ability to thermodynamically model these sequences, is more limited
and less explored than for their metapelitic counterparts. In addition, although metapelitic rocks are useful for estimating pressure and temperature (P–T) conditions in rocks of the am-phibolite facies and higher (e.g. Carmichael, 1978; Pattison, 2001; Spear & Cheney, 1989), they are of more limited use below the lower amphibolite facies because they show few mineralogical changes. The result has been a limited number of meaningful estimates of the P–T conditions for both metapel-itic and metabasic rocks metamorphosed at these grades.
This study aims to improve on our understanding of the metamorphism of basalts from prehnite–pumpellyite to am-phibolite facies through the detailed petrological study com-bined with phase equilibria modelling of a metamorphic sequence within the Flin Flon Greenstone Belt of central Canada (Figure 1). Augmented with observations from a large database of metabasite sequences from the literature, we use the observations from the Flin Flon sequence for a global assessment of the use of metabasic rocks at these grades to estimate P–T conditions and test the ability of ther-modynamic modelling techniques to generate phase equi-libria consistent with the natural observations. In addition, this data set is used to evaluate the amounts and intervals of metamorphic devolatilization occurring across the key facies transitions within these rocks. The Flin Flon sequence is per-haps the best exposed sequence of its kind in the world and is thus an ideal natural laboratory for this purpose.
rare. This contrasts with thermodynamic modelling, using either DS5 or DS6, which predicts a wide PP-GS transition involving the progressive appearance of epidote and actinolite and disappearance of pumpellyite and prehnite. Patterns of mineral assemblages and thermodynamic modelling suggest a useful bathograd (‘CHEPPAQ bathograd’), separating prehnite–pumpellyite-bearing assemblages at low pressures and pumpellyite–actinolite-bearing assemblages at higher pressures, occurs at ~2.3 to 2.6 kbar. Observations from the Flin Flon sequence suggests devolatilization across the GS-AM transition (average: ~1.8 wt% H2O) occurs over a very narrow interval within the actinolite–hornblende–oligoclase zone, associated with the loss of >75% of the total chlorite. By contrast, modelling of the GS-AM transition zone predicts more progressive dehydration of ~2 wt% H2O over a >50°C interval. Observations from the field suggest devolatilization across the PP-GS transition occurs over a very narrow interval given the rarity of transitional assemblages. Modelling suggests fluid release of 1.0–1.4 wt% resulting from prehnite breakdown over a ~10°C interval. This fluid may not be entirely lost from the rock package due to involvement in the hydration of igneous mineralogy across the PP-GS transition as observed in the Flin Flon sequence.
K E Y W O R D S
amphibolite facies, greenschist facies, greenstone belt, metamorphic devolatilization, prehnite–pumpellyite facies

| 3STARR eT Al.
The aims of this study include: (a) detailing the textural, modal, and compositional changes across the prehnite–pum-pellyite—greenschist facies (PP-GS) and greenschist–amphi-bolite facies (GS-AM) transitions in the Flin Flon sequence, in order to constrain the key reactions that take place in these transitions; (b) testing the ability of the latest thermo-dynamic data sets and a–x relations for metabasites (data set 5.5 of Holland & Powell, 1998, and data set 6.2 of Holland & Powell, 2011, with respective a–x models detailed below) to reproduce the mineral assemblages, mineral compositions, and reactions within the Flin Flon sequence and others from the literature; (c) constraining the P–T conditions of key min-eral assemblage changes across the prehnite–pumpellyite to greenschist, and greenschist to amphibolite facies, transitions; (d) identifying pressure-sensitive ‘bathozones’ that separate lower pressure and higher pressure metabasite facies series (mineral assemblage sequences) in metabasites over this range of grade; and (e) characterizing the nature of meta-morphic devolatilization across the prehnite–pumpellyite to greenschist, and greenschist to amphibolite facies, transitions.
2 | GEOLOGICAL BACKGROUND
The Flin Flon–Glennie complex (FFGC) forms an elongate E–W-oriented belt, ~250 km in length, traversed by the Saskatchewan–Manitoba border (Figure 1). The FFGC com-prises a series of accreted tectono-stratigraphic assemblages that were amalgamated during the Palaeoproterozoic in the early stages of the Trans-Hudson Orogen (THO) (Ansdell, 2005; Lucas, Stern, Syme, & Thomas, 1996; Stauffer, 1984). The area around the townsite of Flin Flon, which forms the main area of interest for this study, is host to a number of current or previously producing Cu-Zn VMS mines (e.g. Flin Flon, Callinan and 777 deposits) (Ames, Galley, Kjarsgaard, Tardif, & Taylor, 2016) and as a result, has been the focus of a large number of studies particularly focusing on the structural and tectonic development of the area (e.g. Bailes & Syme, 1989; Gale, Lucas, & Dixon, 1999; Lafrance et al., 2016).
The majority of the field area (~120 km2) is made up of volcanic rocks comprising the Flin Flon arc assemblage, inter-preted to be of island-arc to back-arc affinity (e.g. Syme, Lucas,
F I G U R E 1 (a) Simplified geological map of North America showing the major cratonic and orogenic belts. THO: Trans-Hudson Orogen. Modified after Hoffman (1988) and Lucas et al. (1996). (b) Simplified geology map of the Saskatchewan/Manitoba segment of the Trans-Hudson Orogen. FFB: Flin Flon belt; GD: Glennie Domain; LR-LLB: La Ronge–Lynn Lake Belt; KD: Kisseynew Domain; WD: Wollaston Domain; SPZ: Superior Boundary Zone. Modified after Lucas et al. (1996)
HearneProvince
Athabasca Basin
Phanerozoic Cover
SuperiorProvince
KDGD
FFB
WDLR-LLB
WathamanBatholith
ORSZ
RaeProvince
SBZ
ReindeerZone
Flin Flon Study AreaFlin Flon Study Area
0 100 kmN
Legend
Pikwitonei Granulite Belt
Sask CratonArchean Cratons
Continental Margin DepositsArc Volcanic and Plutonic RocksArc Plutons/Mixed Gneisses
Collisional Arc Plutonic RocksPalaeoproterozoic Sedimentary Rocks
Interarc/Collisional Sedimentary and Plutonic rocks
Palaeo-Proterozoic
Archean
Trans-HudsonOrogen
Phanerozoic Sedimentary CoverPhanerozoic
SuperiorCraton
AtlanticOcean
HearneCraton
RaeCraton
SlaveCraton
WyomingCraton
THO
0 1000 km
Legend<1.8Ga Orogens
Archean CratonsPaleoproterozoic Orogens
N(a)
(b)

4 | STARR eT Al.
Bailes, & Stern, 1999). The Flin Flon arc assemblage may be divided into the Flin Flon, Hidden, and Louis formations, con-sisting predominantly of basaltic and basaltic andesite volcanic flows and intrusives, rhyolite flows and volcaniclastic rocks (DeWolfe, Gibson, & Piercey, 2009). The Flin Flon formation hosts the Flin Flon, 777 and Callinan VMS deposits (Devine et al., 2002). The Hidden and Louis formations form part of the overlying hangingwall sequence to the ore deposits and are in-terpreted to be the product of a composite volcanic system pre-dominantly composed of pillowed aphyric or plagioclase phyric basalt/basaltic andesite and mafic volcaniclastics (DeWolfe et al., 2009). The Hidden and Louis formations are unconform-ably overlain by the fluvial sedimentary Missi group, consisting of deformed conglomerate, sandstone, and siltstone.
3 | METAMORPHIC ISOGRAD MAP
A suite of over 600 thin sections from across the field area was used for this study, complemented by the sample suites used in Digel and Ghent (1994). Figure 2 shows a simplified metamorphic isograd map for the field area. The metamorphic assemblages indicate that the regional metamorphic grade ranges from prehnite–pumpellyite facies in the southeastern portion of the field area to lower amphibolite facies in the northwest where the basaltic sequence is capped by the Missi group sediments. Five regional metamorphic isograds were identified, from south to north: actinolite-in, prehnite- and pumpellyite-out, hornblende-in, oligoclase-in, and actinolite-out. The prehnite-out and pumpellyite-out isograds are coin-cident within the resolution of the sampling (Figures 2 and 3), and are thus treated as a single isograd. The area consists of two intact sequences that are not disrupted by deformation fea-tures, one containing the prehnite–pumpellyite to greenschist transition in the south of the area (Hook Lake Block; Figure 3a) and the other, the greenschist–amphibolite transition in the northern portion of the field area (Flin Flon Block; Figure 3b). These two blocks are separated by post-metamorphic brittle faults such as the Ross Lake and Cliff Lake faults.
The metamorphism in the area post-dates the majority of deformation and foliation development as evidenced by the random orientation of metamorphic minerals in most sam-ples and the lack of deformation of the isograds. The only major post-metamorphic deformation is related to movement along the late NNW-SSE–oriented faults, which affect only a relatively small portion of the field area. These faults in-clude the Ross Lake fault which, as discussed above, results
in the separation of the metamorphic sequence into two intact blocks, and the juxtaposition of prehnite–pumpellyite facies rocks against greenschist facies rocks within the southern portion of the field area (Figure 2).
4 | MINERAL ASSEMBLAGES AND TEXTURES
4.1 | Prehnite–pumpellyite facies
The prehnite–pumpellyite facies is characterized by the di-agnostic assemblage Prh+Pmp+Ab+Chl+Ep+Qtz±Ttn±Cc±Ms±Kfs±Ap (mineral abbreviations after Kretz, 1983). Prehnite and pumpellyite coexist in 75% of samples, with the
F I G U R E 2 Regional metamorphic isograds superimposed on a simplified geology map. Underlying geology based on the maps of Bailes and Syme (1989), Kremer and Simard (2007); and Simard et al. (2010). Sample sites with full mineral assemblage shown by brown dots
HLF
Ross Lake
Schist Lake
Big Island Lake
Sask
atch
ewan M
anitoba
777
North Main
South Main
Act-out
Hbl-in
Act-inAct-in
Hbl-inOlig-in
Prh-outPmp-out
Prh-outPmp-out
Prh-outPmp-out
Olig-in
101˚52’0”W 101˚50’0”W 101˚48’0”W
54˚4
7’0”
N54
˚46’
0”N
54˚4
5’0”
N54
˚44’
0”N
54˚4
3’0”
N54
˚42’
0”N
0 1000 mN
Legend
Prehnite-Pumpellyite (PP) Facies
Transitional GS-Am (Hbl-Act-Olig Zone)Transitional GS-Am (Hbl-Olig Zone)
Transitional GS-Am (Hbl-Act Zone)
Transitional PP - GS Facies Greenschist (GS) Facies
Missi Group Sediments
Unknown Grade
Post Missi Intrusives Pre Missi Intrusives SampleVMS Deposit
F I G U R E 3 (a) Mineral assemblage map for the southern portion of the Hook Lake block, containing the prehnite–pumpellyite facies to greenschist facies transition. (b) Mineral assemblage map for the Flin Flon block, containing the transition zone from greenschist facies to amphibolite facies. Mineral assemblages with a black rim or infill represent those documented using data from EDS and/or WDS analyses. Mineral assemblages indicated with a brown rim or infill are those determined by petrographic microscope only

| 5STARR eT Al.
HookLake
Big IslandLake
SchistLake
Act-inAct-in
Hbl-inOlig-in
Prh-outPmp-out
Prh-outPmp-out
Prh-outPmp-out
0 400 mN
URF
RLF
Hidden Lake
Ross Lake
Louis Lake
PhantomLake
777
North Main
South Main
Olig-in
Act-out
Hbl-in Hbl-in
Olig-in
Ab+ChlAb+Chl+EpPrh+Ab+ChlPmp+Ab+ChlPrh+Pmp+Ab+ChlPrh+Ep+Ab+ChlPmp+Ep+Ab+ChlPrh+Pmp+Ep+Ab+Chl
Black = Probe DeterminedBrown = Microscope Determined
Prh + Pmp Facies
+Ep
+Act
Greenschist Facies
Transitional Prh + Pmp /GS Facies
-Prh -Pmp+Hbl+Olig
-Act-Ep-Chl
TransitionalGS / Amp
Facies
Act+Prh+Ep+Ab+ChlAct+Pmp+Ep+Ab+ChlAct+Prh+Pmp+Ep+Ab+ChlAct+Ab+Ep+ChlHbl+Act+Ab+Ep+ChlHbl+Act+Ab+Olig+Ep+ChlAct+Olig+Ab+Ep+ChlHbl+Act+Plag(?)+Ep+Chl
Hbl+Olig+Ab+Ep+ChlHbl+Olig+Ab+ChlHbl+Olig+Ab+EpHbl+Olig+Ab
AmphiboliteFacies
Prh + Pmp Facies
0 500mN
Metamorphic facies
Transitional GS-Am Facies (Act-Hbl-Olig Zone)Transitional GS-Am Facies (Hbl-Olig Zone)
Transitional GS-Am Facies (Act-Hbl Zone)Greenschist (GS) Facies
FaultThrust FaultFold
AntiformSynformOverturned Synform
Sample VMS Deposit
Missi Group SedimentsPost Missi Intrusives
Prehnite-Pumpellyite (PP) FaciesTransitional PP - GS Facies
Unknown Grade
Metamorphic mineral assemblages
Structural features
(a) (b)

6 | STARR eT Al.
remaining samples containing only prehnite. Prehnite is typi-cally more abundant than pumpellyite, and in several samples pervasively replaces all components of the original basalt (groundmass, amygdules, and plagioclase phenocrysts). Chlorite and epidote are abundant in the majority of samples. The original igneous mineralogy rarely makes up more than 5% of the rock and in some samples prehnite and pumpellyite appear to directly replace the igneous minerals.
Prehnite and pumpellyite are found in several different textures: (a) within amygdules, commonly associated with chlorite (Figure 4c); (b) as replacements of matrix mineral-ogy (Figure 4a,b); and (c) as replacements and pseudomorphs of plagioclase phenocrysts (Figure 4d). Their development is highly irregular with some areas of basaltic matrix dominated by prehnite (Figure 4a) and others by pumpellyite (Figure 4b).
4.2 | Prehnite–pumpellyite—greenschist transition zone
The PP-GS transition is defined as the zone between the first de-velopment, in a prograde sense, of actinolite and last occurrence of prehnite and pumpellyite. The mineral assemblages within this zone are varied and individual samples are commonly domainal or patchy. The different mineral sub-assemblages comprise: (a) Prh+Pmp+Ab+Chl+Ep; (b) Act+Prh+Pmp+Ab+Chl+Ep; (c) Act+Pmp+Ab+Chl+Ep; (d) Act+Ab+Chl+Ep; and (e) Ab+Chl+Ep. The occurrence of actinolite with either or both of prehnite and pumpellyite is uncommon. Most samples con-tain either the diagnostic prehnite–pumpellyite zone assemblage (Prh+Pmp+Ab+Chl+Ep) or a typical greenschist facies assem-blage (Act+Ab+Chl+Ep). Actinolite occurs in the matrix as fine euhedral needles intergrown with either or both of prehnite (Figure 4f) and pumpellyite (Figure 4e). Calcite is common, occurring in the matrix but more commonly as partial pseudo-morphs after plagioclase phenocrysts and within amygdules.
4.3 | Greenschist facies
Rocks of the greenschist facies make up the majority of the field area, north of the prehnite/pumpellyite-out isograd and south of the hornblende-in isograd (Figures 2 and 3). The characteristic mineral assemblage of the greenschist facies is Act+Ab+Ep+Chl+Qtz+Ttn±Bt±Ms±Stp±Ksp±Ap. Clino-pyroxene and plagioclase phenocrysts are pseudomorphed by actinolite and albite, respectively (Figure 5b), whereas amygdules most commonly consist of quartz, epidote, chlo-rite, and calcite. The first development of biotite, marking the biotite-in isograd, occurs in the lower part of the greenschist facies, close to the prehnite/pumpellyite-out isograd, although the fine grained nature of biotite in the lower grade samples makes determining the precise position difficult.
4.4 | Greenschist to amphibolite facies transition
In the field, this transition comprises a 4 km wide region con-taining the hornblende-in, oligoclase-in, and actinolite-out isograds that represent the low-grade margins of the horn-blende–actinolite, hornblende–actinolite–oligoclase, and hornblende–oligoclase zones, respectively (Figures 2 and 3b).
4.4.1 | Hornblende–Actinolite Zone
Hornblende is only a minor component within the lower half of this zone, forming small (<10 μm) blebs developed sporadically within actinolite grains. Hornblende becomes more abundant in this zone in samples north of the Flin Flon townsite, and comprises more than 10% of the total amphi-bole content north of Hidden Lake, within 1 km of the oligo-clase-in isograd.
4.4.2 | Hornblende–Actinolite–Oligoclase zone
This zone is marked by the appearance of oligoclase, and is characterized by the assemblage Hbl+Act+Olig+Ab+Ep+Chl+Qtz+Ilm+Ttn+Bt±Ms±Stp±Ksp±Ap. Rocks in this zone show more evidence of metamorphic recrystallization, with less common preservation of igneous microphenocryst textures in the matrix. Hornblende is identifiable in the field as 2–5 mm-long black needles just north of the oligoclase-in isograd, coars-ening and increasing in abundance with increasing grade.
4.4.3 | Hornblende–Oligoclase Zone
The actinolite-out isograd is located within the northernmost part of the field area (Figures 2 and 3b), above which sam-ples are dominated by hornblende, oligoclase, and epidote, with more minor albite and chlorite. Oligoclase makes up over 60% of the total plagioclase in these samples. Similar to the hornblende–actinolite–oligoclase zone, biotite is the dominant mica with only minor muscovite present. This zone represents the highest grade of metamorphism in the area, as the Hidden Formation basalts are in fault contact with the Missi Group sedimentary sequence.
5 | MINERAL CHEMISTRY AND MODAL PROPORTIONS
Mineral compositions and modal proportions were ob-tained using a JEOL JXA-8200 electron microprobe at the

| 7STARR eT Al.
University of Calgary. Mineral proportions were determined by the following process: (a) back-scattered electron and EDS X-ray element compositional mapping; (b) construction
of composite BSE/X-ray maps by overlaying different com-binations of EDS element distribution maps with BSE im-ages, comprising as much of the thin section as possible
F I G U R E 4 Photomicrographs of samples from the prehnite–pumpellyite facies and PP-GS transition zone. (a) Matrix dominated by light brown prehnite and dark brown epidote with clear quartz and minor green pumpellyite; (b) matrix containing pumpellyite (light green) and prehnite (light brown) with more minor epidote and quartz; (c) cross-polarized light image of prehnite and pumpellyite within amygdules; (d) prehnite and albite replacing plagioclase phenocryst; (e) actinolite intergrown with pumpellyite in prehnite–pumpellyite to greenschist transition zone; (f) small actinolite rhombs growing within prehnite- and epidote-dominated matrix
-
Ep
Pmp
Prh
Pmp
Prh Ab
Ep
Prh
Act
Pmp
Act
Prehnite-dominated matrix Pumpellyite-dominated matrix
Prehnite and pumpellyite filled amygdules Prehnite replacing plagioclase phenocryst
Actinolite intergrown with pumpellyite
(a) (b)
(c) (d)
(e) (f)
BSE - Prh + Act + Ep matrix
Prh

8 | STARR eT Al.
F I G U R E 5 Photomicrographs of samples from the greenschist facies and greenschist–amphibolite transition zone. (a) Epidote and quartz in amygdules; (b) replacement of plagioclase phenocrysts within the greenschist facies—replacement assemblage of albite and epidote; (c) typical lower greenschist facies matrix preserving original igneous textures but with a mineralogy consisting of metamorphic albite, chlorite, epidote, and actinolite; (d) upper greenschist facies matrix with a coarser grained, more recrystallized matrix than that occurring in the lower greenschist facies; (e) transitional greenschist–amphibolite facies mineral assemblage dominated by blue-green hornblende intergrown with actinolite, with plagioclase and epidote in the finer grained interstitial areas between the amphibole grains; (f) amphibolite facies assemblage from the 1920 icelandite unit consisting of hornblende and plagioclase with minor epidote
(a) (b)
(c) (d)
(e) (f)
Amygdules - Greenschist Facies Replaced Plag Phenocrysts - Greenschist Facies
Typical Matrix - Lower Greenschist Facies Typical Matrix - Upper Greenschist Facies
Typical Matrix - Epidote Amphibolite Facies 1920 Unit Icelandites - Amphibolite Facies
Ep
Qtz
Ab
Ep
| 9STARR eT Al.
while avoiding phenocrysts, pseudomorphs, and amygd-ules; and (c) determination of areas comprising different min-eral phases by means of colour intensity threshold templates using the program JMicrovision. Mineral compositions were acquired from ~80 samples, while 50 samples were selected for full modal analysis using the methods described above. Variations in mineral compositional and modal data along a N–S transect through the Flin Flon sequence are shown in Figures 6 and 7. This N–S transect is taken to be a proxy for increasing grade as it occurs at a high angle to the E–W-oriented isograds. The complete modal data set is presented in Table S1, while mineral compositional data for amphibole, plagioclase, epidote, and chlorite are shown in Tables S2–S5, respectively.
5.1 | Amphibole
A detailed treatment of the variation in amphibole composi-tions and textures with grade across the GS-AM transition is described in Starr and Pattison (2019a), so only the main changes are reported in this paper. The amphibole stoichi-ometry, ferric iron content, cations per formula unit (cpfu) values, and site allocations were calculated following the methods of Schumacher (1997). For the classification of the amphiboles, the scheme of Hawthorne et al. (2012) was used.
Within the PP-GS transition, actinolite is present as fine acicular grains, generally only visible using scanning elec-tron microscopy. Within the greenschist facies, actinolite be-comes coarser grained, increases in abundance in the matrix, and is the dominant replacement mineral in pseudomorphs of clinopyroxene phenocrysts. Above the hornblende-in iso-grad, actinolite and hornblende occur together in a number of textural relationships, including separate individual ho-mogeneous grains, patchy intergrowths, more geometrically regular intergrowths, and core-rim microstructures (usually hornblende rimming actinolite) (Starr & Pattison, 2019a).
Amphiboles from the PP-GS transition and greenschist facies show limited compositional variation and the majority of analyses classify as actinolite. Above the hornblende-in isograd, the amphibole compositions form two groups, sep-arated by a distinct compositional gap (Figure 7a). The first group plots mostly as actinolite and is indistinguishable from actinolite that occurs at lower grades within the greenschist facies. The second group is composed predominantly of fer-ro-hornblende and ferro-tschermakite, with minor magne-sio-hornblende, that for the purpose of this discussion will be loosely termed ‘hornblende’. The compositional difference between actinolite and hornblende is defined by higher A-site occupancy, CAl, CTi, CFe3+ and BNa, and lower TSi, Mg2+/Mg2++Fe2+ and BCa, in hornblende. The compositional gap appears to increase with grade, with the hornblende evolving from ferro-hornblende in the hornblende–actinolite–albite
zone to ferro-tschermakite in the hornblende–actinolite– oligoclase zone (Figure 7a).
5.2 | Plagioclase
Albite is generally present in high modal proportions within the prehnite–pumpellyite and greenschist facies and shows a modal decrease across the greenschist–amphibolite transi-tion zone (Figure 6b). Within the hornblende–actinolite–oli-goclase zone, two distinct plagioclase group minerals exist, one classifying as albite, with compositions ranging between An1.1-5.8, and the other as oligoclase, with An contents rang-ing from An17.5-26.0 (Figure 7b). Observations from BSE im-aging show that coexisting albite and oligoclase occur both as separate grains and as finer intergrowths. The compositional transition at grain boundaries between coexisting feldspars appears to always be sharp and grain boundaries are gener-ally more geometrically regular than those between coexist-ing amphiboles.
5.3 | Epidote
Epidote occurs throughout the Flin Flon sequence and shows a complex array of textures and compositions, with most samples containing different varieties of epidote group min-erals with no systematic changes in composition with grade (Figure 7c). The most common texture, revealed by BSE im-aging and observed in all of the metamorphic zones, is a core–rim microstructure comprising a light core surrounded by a darker rim reflecting different Fe contents. The light cores have XFe (=Fe3+/Al+Fe3+) contents of 24%–32%, whereas the darker rims have XFe contents of 17%–24% (Figure 7c).
5.4 | Chlorite
Chlorite persists to the highest grades in the Flin Flon se-quence and is found in nearly all samples. Chlorite shows minor compositional variation in Mg, Fe, Al, and Si, with most chlorite slightly enriched in Fe relative to Mg with an average XMg (=Mg/(Mg+Fe2+) of 0.42 within a range of 0.35–0.50 (Figure 7d). Chlorite compositions do not vary systematically with grade (Figure 7d).
5.5 | Titanite/Ilmenite
Titanite is present in most basaltic samples within the prehnite–pumpellyite, PP-GS transition, and greenschist fa-cies. Above the oligoclase-in isograd, within the GS-AM transition ilmenite is stable and is the main Ti-bearing phase.

10 | STARR eT Al.
F I G U R E 6 Plots of selected mineral modes versus distance north in metres, the latter a proxy for increasing metamorphic grade (see discussion in text), for samples across the greenschist facies and greenschist–amphibolite facies transition zone. The positions of the mineral isograds (hornblende-in, oligoclase-in, and actinolite-out) are shown by the dashed lines and correspond to the isograds shown in Figure 3b
0 20 40 60 80 100 10 20 30 40 50 60 70 10 20 30 40 10 20 30
0 5 10 15 20 25 30 0 1 2 3 4 5 6 7 8 0 1 2 3 4 5 6 0 2 4 6 8 10 12 14 16
0
1,000
2,000
3,000
4,000
5,000
6,000
7,000
8,000
9,000
10,000
Amphibole modal proportions
Total amp mode% Hbl of total amp
Hbl-in
Olig-in
Act-out
Total plag mode% Olig of total plag
Dis
tanc
e N
(Inc
reas
ing
grad
e)
Plagioclase modal proportions Epidote modal proportions Chlorite modal proportions
0
1,000
2,000
3,000
4,000
5,000
6,000
7,000
8,000
9,000
10,000
Dis
tanc
e N
(inc
reas
ing
grad
e)
Hbl-in
Olig-in
Act-out
Quartz modal proportions Mica modal proportions(Muscovite + Biotite)
Titanite/ilmenite modal proportions Carbonate modal proportions
Ilm-in

| 11STARR eT Al.
However, it is commonly rimmed by titanite, which is inter-preted to reflect retrograde growth of titanite at lower grades.
6 | BULK COMPOSITIONAL DATA
Major element bulk compositions were compiled for 129 samples and are listed in Table S6. The data were obtained from several sources: (a) 67 major and trace element bulk compositions from Ames et al. (2016); (b) eight major el-ement XRF analyses, including ferrous iron titration; and (c) calculated bulk compositions from 54 samples, in which the mineral modal proportions were combined with mineral compositions obtained from the electron microprobe.
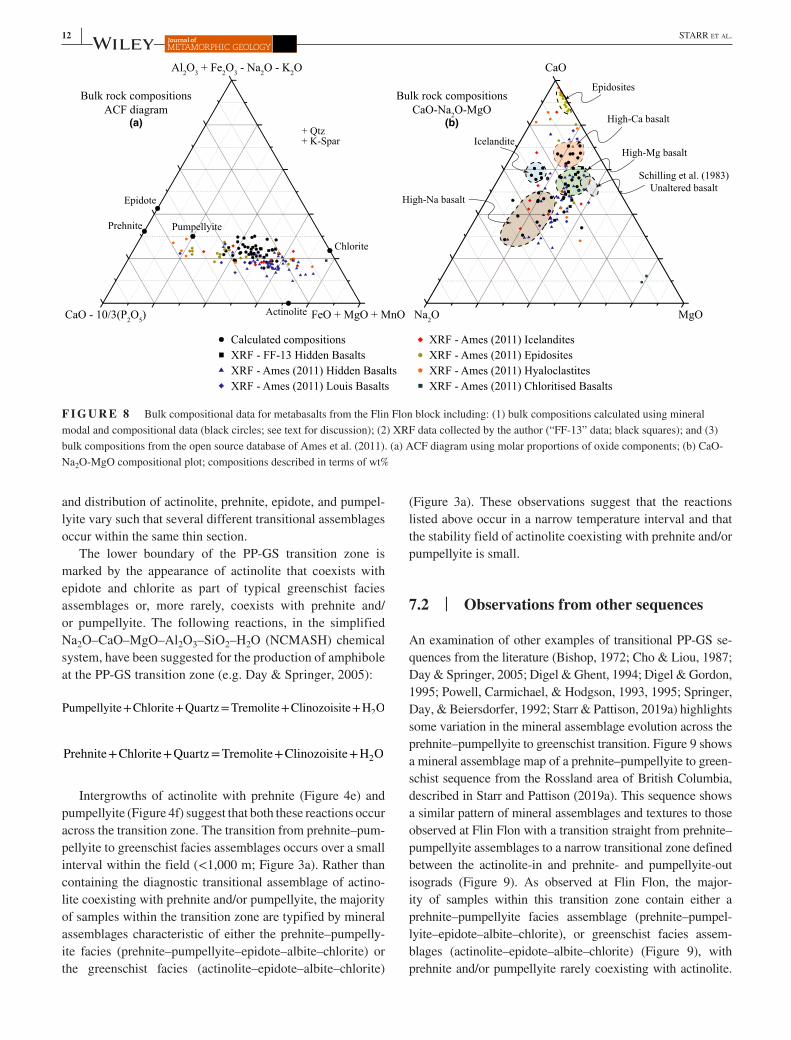
Figure 8 shows the bulk compositional data set plotted on ACF and CaO–Na2O–MgO diagrams. For reference, the data set of Schilling et al. (1983), containing >200 bulk compo-sitions from modern basalts dredged from the ocean floor, is also displayed to show the typical compositions for unaltered mid-ocean ridge basalts. The large amount of compositional variation is attributed predominantly to seafloor hydrothermal alteration processes that occurs prior to metamorphism. The data are divided into a number of groups: high-Mg, high-Ca,
and high-Na compositions (Figure 8b). The high-Mg and high-Ca compositions are typical of the pillow basalts of the Hidden and Louis Formations, with the high-Ca composi-tions representative of pillow cores and the high-Mg com-positions characteristic of pillow rims. The complete bulk compositional database is shown in Table S6, and the average bulk compositions for the main groups (high-Mg, high-Ca, and high-Na) are presented in Table S7.
7 | THE PROGRADE EVOLUTION ACROSS THE PP-GS TRANSITION
7.1 | Observations from Flin Flon
Similar to observations from Digel and Ghent (1994) and Digel and Gordon (1995), the most distinctive feature of prehnite- and pumpellyite-bearing samples is the patchy de-velopment of different assemblages. Prehnite and pumpelly-ite vary from being absent or only a minor component of the rock to being developed pervasively as a replacement of the matrix, phenocryst, and amygdule components of the original basalt. In addition, the relationships between the proportions
F I G U R E 7 Plots of selected mineral compositional parameters versus distance north (m) for samples across the greenschist facies and greenschist–amphibolite facies transition zone. The points represent the average composition for that sample while the lines represent the full range of compositions observed. Compositional fields for amphibole after Leake et al. (1997)
0
1,000
2,000
3,000
4,000
5,000
6,000
7,000
8,000
9,000
10,000D
ista
nce
N (i
ncre
asin
g gr
ade)
Amphibole compositionSi (cpfu)
ActinoliteHornblende
Act Hbl Tsch
Plagioclase compositionAn (Ca)
Ab Olig
AlbiteOligoclase
Epidote compositionXPs
Fe-Poor RimsFe-Rich Cores
Hbl-in
Olig-in
Act-out
EpidoteClinozoisite Mg-ChloriteFe-Chlorite
Chlorite compositionXMg
8.0 7.5 7.0 6.5 6.0 5.5 5 10 15 20 25 30 15 20 25 30 35 0.3 0.4 0.5 0.6 0.7
12 | STARR eT Al.
and distribution of actinolite, prehnite, epidote, and pumpel-lyite vary such that several different transitional assemblages occur within the same thin section.
The lower boundary of the PP-GS transition zone is marked by the appearance of actinolite that coexists with epidote and chlorite as part of typical greenschist facies assemblages or, more rarely, coexists with prehnite and/or pumpellyite. The following reactions, in the simplified Na2O–CaO–MgO–Al2O3–SiO2–H2O (NCMASH) chemical system, have been suggested for the production of amphibole at the PP-GS transition zone (e.g. Day & Springer, 2005):
Intergrowths of actinolite with prehnite (Figure 4e) and pumpellyite (Figure 4f) suggest that both these reactions occur across the transition zone. The transition from prehnite–pum-pellyite to greenschist facies assemblages occurs over a small interval within the field (<1,000 m; Figure 3a). Rather than containing the diagnostic transitional assemblage of actino-lite coexisting with prehnite and/or pumpellyite, the majority of samples within the transition zone are typified by mineral assemblages characteristic of either the prehnite–pumpelly-ite facies (prehnite–pumpellyite–epidote–albite–chlorite) or the greenschist facies (actinolite–epidote–albite–chlorite)
(Figure 3a). These observations suggest that the reactions listed above occur in a narrow temperature interval and that the stability field of actinolite coexisting with prehnite and/or pumpellyite is small.
7.2 | Observations from other sequences
An examination of other examples of transitional PP-GS se-quences from the literature (Bishop, 1972; Cho & Liou, 1987; Day & Springer, 2005; Digel & Ghent, 1994; Digel & Gordon, 1995; Powell, Carmichael, & Hodgson, 1993, 1995; Springer, Day, & Beiersdorfer, 1992; Starr & Pattison, 2019a) highlights some variation in the mineral assemblage evolution across the prehnite–pumpellyite to greenschist transition. Figure 9 shows a mineral assemblage map of a prehnite–pumpellyite to green-schist sequence from the Rossland area of British Columbia, described in Starr and Pattison (2019a). This sequence shows a similar pattern of mineral assemblages and textures to those observed at Flin Flon with a transition straight from prehnite–pumpellyite assemblages to a narrow transitional zone defined between the actinolite-in and prehnite- and pumpellyite-out isograds (Figure 9). As observed at Flin Flon, the major-ity of samples within this transition zone contain either a prehnite–pumpellyite facies assemblage (prehnite–pumpel-lyite–epidote–albite–chlorite), or greenschist facies assem-blages (actinolite–epidote–albite–chlorite) (Figure 9), with prehnite and/or pumpellyite rarely coexisting with actinolite.
Pumpellyite+Chlorite+Quartz=Tremolite+Clinozoisite+H2O
Prehnite+Chlorite+Quartz=Tremolite+Clinozoisite+H2O
F I G U R E 8 Bulk compositional data for metabasalts from the Flin Flon block including: (1) bulk compositions calculated using mineral modal and compositional data (black circles; see text for discussion); (2) XRF data collected by the author (“FF-13” data; black squares); and (3) bulk compositions from the open source database of Ames et al. (2011). (a) ACF diagram using molar proportions of oxide components; (b) CaO-Na2O-MgO compositional plot; compositions described in terms of wt%
Prehnite
Epidote
Pumpellyite
Actinolite
Chlorite
+ Qtz+ K-Spar
CaO - 10/3(P2O5) FeO + MgO + MnO
Al2O3 + Fe2O3 - Na2O - K2O
Calculated compositionsXRF - FF-13 Hidden BasaltsXRF - Ames (2011) Hidden BasaltsXRF - Ames (2011) Louis Basalts
CaO
Na2O MgO
XRF - Ames (2011) IcelanditesXRF - Ames (2011) EpidositesXRF - Ames (2011) HyaloclastitesXRF - Ames (2011) Chloritised Basalts
High-Mg basalt
High-Ca basalt
Epidosites
Icelandite
High-Na basalt
Bulk rock compositionsCaO-Na2O-MgO
(b)
Bulk rock compositionsACF diagram
(a)
Schilling et al. (1983)Unaltered basalt

| 13STARR eT Al.
The detailed study of Cho and Liou (1987) on the Karmutsen metabasites (Vancouver Island) also documented the persis-tence of both coexisting prehnite and pumpellyite through the
PP-GS transition zone up to the base of the greenschist facies, and only one of prehnite or pumpellyite was stable with acti-nolite within a single sample or thin section.
F I G U R E 9 Regional metamorphic isograd map for the Rossland field area, superimposed on a simplified geology map. Mineral assemblages with a black rim or infill represent those documented using data from EDS and/or WDS analyses. Mineral assemblages indicated with a brown rim or infill are those determined by petrographic microscope only
Ymir
Salmo
Nelson
BonningtonPluton
NelsonBatholith
SalmoStock
117˚30’0”W 117˚25’0”W 117˚20’0”W 117˚15’0”W 117˚10’0”W117˚35’0”W49˚25’0”N
49˚20’0”N49˚15’0”N
49˚10’0”N49˚05’0”N
Legend
Prehnite-pumpellyite (PP) facies
Transitional GS-Am (Hbl-Olig/Ca-Plag Zone)
Transitional PP - GS facies Greenschist (GS) facies
Cretaceous-eocene intrusives
Unknown grade
Nelson intrusive suitePre-Nelson intrusives
0 2 km
Cambro-ordivician dediments
NSample
Hbl-in
Hbl-in
Grt-in
Hbl-in
Prh-outPmp-out
Prh-outPmp-out
Act-in
Ab+ChlAb+Chl+EpPrh+Ab+ChlPmp+Ab+ChlPrh+Pmp+Ab+ChlPrh+Ep+Ab+ChlPmp+Ep+Ab+ChlPrh+Pmp+Ep+Ab+Chl
Black = Probe DeterminedBrown = Microscope Determined
Prh + Pmp Facies
+Ep
+Act
Greenschist Facies
Transitional Prh + Pmp /GS Facies
-Prh -Pmp+Hbl+Olig
-Act-Ep-Chl
TransitionalGS / Amp
Facies
Act+Prh+Ep+Ab+ChlAct+Pmp+Ep+Ab+ChlAct+Prh+Pmp+Ep+Ab+ChlAct+Ab+Ep+ChlHbl+Act+Ab+Ep+ChlHbl+Act+Ab+Olig+Ep+ChlAct+Olig+Ab+Ep+ChlHbl+Act+Plag(?)+Ep+Chl
Hbl+Olig+Ab+Ep+ChlHbl+Olig+Ab+ChlHbl+Olig+Ab+EpHbl+Olig+Ab
AmphiboliteFacies
Prh + Pmp Facies
Metamorphic mineral assemblages
14 | STARR eT Al.
By contrast, isograd mapping of other sequences (e.g. Abitibi Greenstone Belt, Quebec; Smartville Complex, California) have recognized a more gradational transition from prehnite–pumpellyite to greenschist facies assemblages and the existence of a number of mineral assemblage subfacies. These studies documented the loss of pumpellyite before prehnite on a mappable scale and identified distinct prehnite–epidote and/or prehnite–actinolite mineral assemblage subzones (Powell, Carmichael, & Hodgson, 1993, 1995; Springer et al., 1992).
8 | THE PROGRADE EVOLUTION ACROSS THE GS-AM TRANSITION
8.1 | Observations from Flin Flon
8.1.1 | Hornblende–Actinolite Zone
The hornblende–actinolite zone is ~3.5 km wide and is char-acterized by hornblende coexisting with actinolite and albite (plus chlorite and epidote). The hornblende-producing re-action may be described by two simplified reactions in the NCFMASH chemical system that involve the breakdown of the typical greenschist facies mineralogy to form hornblende (described in terms of the tschermakite and edenite end-members) (e.g. Cooper, 1972; Graham, 1974):
Where present, hornblende is generally in low modal abun-dance, comprising less than 20% of the total amphibole in the majority of samples (Figure 6a). There is no change in the modal proportions of other important minerals (e.g. epidote and chlorite) within this zone (Figure 6b–h). This suggests that although this zone is important in representing the first appear-ance of hornblende, and thus entry into the lower amphibolite facies, reaction progress is relatively modest and only accounts for a small proportion of the mineralogical transformation from a greenschist facies to amphibolite facies assemblage. The presence of coexisting actinolite and hornblende in this zone is interpreted to reflect stable coexistence across an actinolite–hornblende miscibility gap (e.g. Bégin & Carmichael, 1992; Brady, 1974; Schumacher, 2007; Starr & Pattison, 2019a).
8.1.2 | Hornblende–Actinolite–Oligoclase Zone
In addition to hornblende-producing reactions 1 and 2, further reactions involving the production of oligoclase are required
to explain the mineralogical changes within the hornblende–actinolite–oligoclase zone. The most commonly invoked oligoclase-producing reaction, described in the simplified NCFMASH system (e.g. Cooper, 1972; Graham, 1974), is:
This zone is characterized by a number of modal and com-positional changes relative to the lower grade hornblende–ac-tinolite zone (Figures 6 and 7). There is an average decrease of ~13 modal% in albite abundance accompanied by a smaller decrease in total plagioclase abundance, suggesting that the volume of oligoclase produced by the reactions within this zone is less than the volume of albite consumed. A large in-crease in the average hornblende abundance (+20 modal% average increase) is observed, with a corresponding decrease in the amount of actinolite. The total amphibole modal abun-dance increases (+15 modal% from the lower grade zones), while chlorite decreases by 7–11 modal% across the zone and epidote shows no consistent change in modal proportions. Actinolite is interpreted to be a metastable relict within this zone, based on textural observations such as actinolite cores surrounded by hornblende rims and the compositional evo-lution of both actinolite and hornblende (Starr & Pattison, 2019a).
The marked modal and compositional changes that occur through the hornblende–actinolite–oligoclase zone account for most of the mineralogical transition from greenschist fa-cies to amphibolite facies assemblages. The narrow width of this zone in the field suggests that the main greenschist–am-phibolite transition occurs over a relatively narrow tempera-ture interval.
In addition to the changes noted above, the hornblende–actinolite–oligoclase zone is also characterized by the pro-grade replacement of titanite by ilmenite. The prograde appearance of ilmenite may be explained by the simplified schematic reaction (Liou, Kuniyoshi, & Ito, 1974):
The complete replacement of titanite by ilmenite occurs abruptly across the oligoclase-in isograd, suggesting marked reaction progress and the effective absence of a coexisting ilmenite–titanite field.
8.2 | Observations from other sequences
Previous studies of greenschist–amphibolite facies tran-sition zone sequences have shown that, similar to that documented in Flin Flon, the transition is characterized by the appearance of hornblende and oligoclase, which
(1)Actinolite+Chlorite+Epidote+Quartz=Tschermakite+H2O
(2)Albite+Actinolite=Edenite+Quartz
(3)Chlorite+Epidote+Quartz=Tschermakite+Anorthite+H2O
(4)
Chlorite+Titanite+Quartz+Actinolite
=Aluminous amphibole+ Ilmenite+H2O

| 15STARR eT Al.
commonly coexists with actinolite and albite, and the loss or significant decrease in the amounts of epidote and chlorite. However, comparison of these different studies suggests that the order of isograds, particularly the order of the first appearances of hornblende and oligoclase, var-ies between different sequences. Examples of sequences in which oligoclase develops down-grade of hornblende include Northern Kiso District, Central Japan (Katada, 1965), and Karmutsen, British Columbia (e.g. Kuniyoshi & Liou, 1976; Terabayashi, 1993); whereas, examples of sequences in which hornblende develops down-grade of oligoclase include Haast River, New Zealand (Cooper & Lovering, 1970), SW Scottish Dalradian, Scotland (Graham, 1974), and N Quebec, Canada (Bégin, 1992; Bégin & Carmichael, 1992) and Flin Flon (this study). In other sequences, the incoming of hornblende and oligo-clase has been interpreted as being coincident within the resolution of the sampling, including Yap Islands, west-ern Pacific (Maruyama, Suzuki, & Liou, 1983), Kasuga, Japan (Maruyama et al., 1983), Sulitjelma, Norway (Boyle, 1986), and Rossland, British Columbia (Starr & Pattison, 2019a).
9 | PHASE EQUILIBRIA MODELLING
Phase equilibria modelling of metabasic metamorphic rocks has traditionally proven to be difficult, due to the thermodynamic complexity of the common minerals in these rocks (e.g. amphibole, pyroxene, chlorite, and plagio-clase). However, progress on the thermodynamic character-ization of these minerals (e.g. Dale, Powell, White, Elmer, & Holland, 2005; Diener & Powell, 2012; Diener, Powell, White, & Holland, 2007; Green, Holland, & Powell, 2007) has allowed the modelling of metabasites within geologi-cally realistic systems. In the following modelling and dis-cussion sections, the GS-AM facies samples are discussed first as they are better characterized and are used to estab-lish modelling inputs.
9.1 | Thermodynamic data sets and a–x models
Phase diagrams for different bulk compositions were calcu-lated using the Gibbs free energy minimization modelling software, Theriak-Domino (de Capitani & Brown, 1987; De Capitani & Petrakakis, 2010). In order to fully test the ability of the modelling data sets to reproduce natural ob-servations, two different internally consistent thermody-namic data sets were used: data set 5 (referred to as ‘DS5’) of Holland and Powell (1998; updated to version DS5.5)
and data set 6 (‘DS6’) of Holland and Powell (2011; up-dated to version ds6.2). Each of these data sets were com-bined with compatible a–x models. The a–x models used with DS5 are as follows: clino-amphibole (Diener & Powell, 2012; Diener et al., 2007), clinopyroxene (Diener & Powell, 2012; Green et al., 2007), garnet (White, Powell, & Holland, 2007), chloritoid (White, Powell, Holland, & Worley, 2000), chlorite (Holland, Baker, & Powell, 1998), white mica (Coggon & Holland, 2002), biotite (White et al., 2007), epidote (Holland & Powell, 1998), spinel (White, Powell, & Clarke, 2002), ilmenite–hematite (White, Pomroy, & Powell, 2005; White et al., 2000), and feldspar (Holland & Powell, 2003). With DS6, the following a–x models were used: clino-amphibole (Green et al., 2016), clinopyroxene (Green et al., 2016), garnet (White, Powell, Holland, Johnson, & Green, 2014), chlorite (White et al., 2014), white mica (White et al., 2014), biotite (White et al., 2014), epidote (Holland & Powell, 2011), spinel (White et al., 2002), ilmenite–hematite (White et al., 2005, 2000), and feldspar (Holland & Powell, 2003).
9.2 | Bulk compositions used for thermodynamic modelling
The average high-Mg composition is chosen for the ther-modynamic modelling in the following sections because it is the most common composition sampled from the Hidden and Louis Formations and is most similar to the unaltered basaltic compositions of Schilling et al. (1983). Recent attempts at modelling metabasites at a range of different P–T conditions have highlighted the strong control that ferric iron has on phase relations (e.g. Diener & Powell, 2010, 2012; Rebay, Powell, & Diener, 2010). For model-ling purposes and in the following discussion, the ferric iron is expressed in terms of the wt% oxide ratio (XFe3+
=Fe2O3/Fe2O3+FeO) in order to facilitate comparison with natural data sets, which are most often described in wt% oxides. The FeO and Fe2O3 contents of eight selected sam-ples spanning the greenschist and lower amphibolite facies were determined using chemical titration combined with XRF at ACME labs in Vancouver. The XFe3+ values vary between 20% and 36% with an average of 26.2%. The re-sults derived from titration are interpreted as representing maximum estimates of XFe3+ during metamorphism, due to potential oxidation during weathering, post-metamorphic alteration, and sample preparation (e.g. Diener & Powell, 2010; Lo Pò & Braga, 2014). The average XFe3+, calculated through combining mineral modal data with their stoichio-metric compositions, is 18.9% within a range of 5%–33% (equivalent to ~2 to 17 mol.% Fe2O3/Fe2O3+FeO), al-though the majority of samples (~80%) have values be-tween 10% and 25%. Calculated values of XFe3+ are lower

16 | STARR eT Al.
(−7% average) than those derived from titration, consistent with minor amounts of post-metamorphic oxidation.
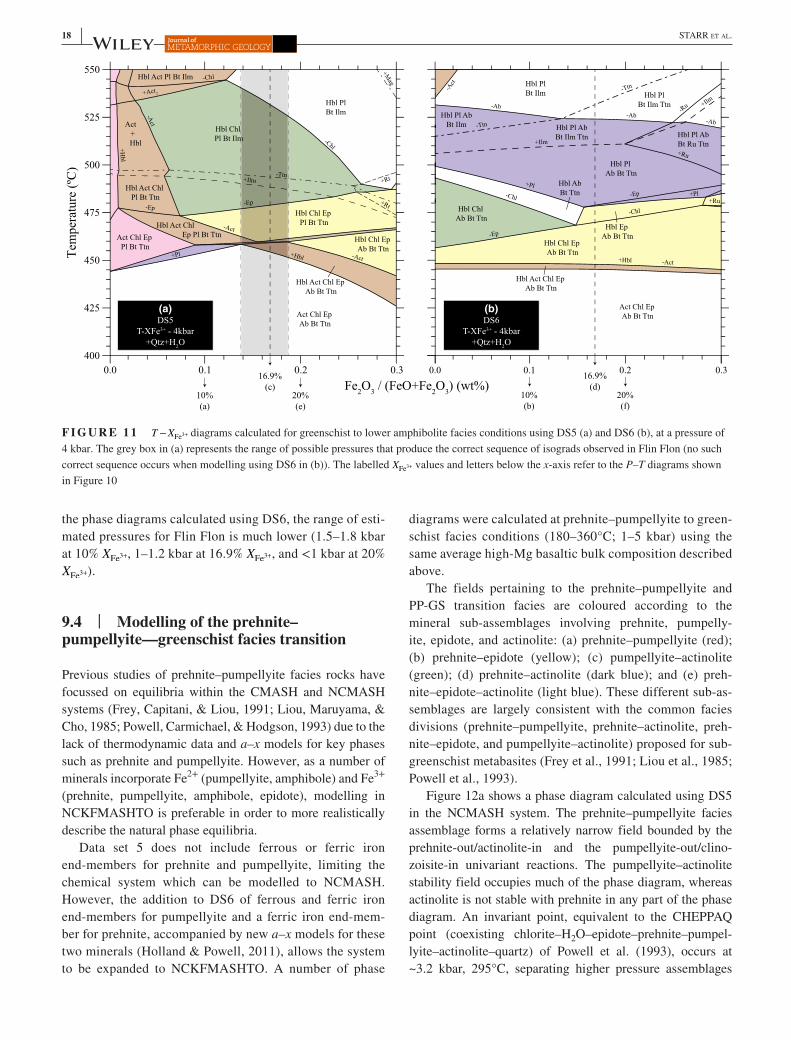
While the approaches for estimating ferric iron contents described above have helped constrain the approximate val-ues of XFe3+ for the Flin Flon sequence, there is a likely a range of different possible ferric iron contents for different bulk compositions. Thus, the approach of Diener and Powell (2010) is taken whereby the effects of ferric iron content on the phase equilibria are investigated through the calcula-tion of sets of P–T diagrams with different XFe3+ (Figures 10 and 12), augmented with T −XFe3+ diagrams (Figure 11). A range of XFe3+ contents of 0%–30%, representing the major-ity of the Flin Flon samples, was chosen for the construction of T −XFe3+ diagrams while XFe3+ values of 10% and 20% as well as the average calculated value, 16.9%, were used for constructing individual P–T diagrams.
9.3 | Modelling of the greenschist–amphibolite facies transition zone
The P–T and T −XFe3+ phase diagrams, calculated for a range of P–T conditions spanning the GS-AM transition zone (400–550°C; 1–8 kbar), are shown in Figures 10 and 11 respectively. A constant pressure of 4 kbar was chosen for the calculation of the T −XFe3+ phase diagrams as it falls within the range of most likely pressures discussed in more detail below. For ease of comparison, the fields are coloured corresponding to important groups of mineral assemblages across the GS-AM transition zone: blue (coexisting albite and oligoclase/andesine); brown (coexisting actinolite and hornblende); yellow (epidote-amphibolite—ep+hbl); green (chlorite-bearing, epidote-absent transitional assemblages—hbl+chl); and pink (coexisting actinolite and oligoclase with no hornblende—act+olig).
The P–T phase diagrams calculated for different values of XFe3+ using DS5 and the corresponding a–x models (Figure 10a,c,e) show a number of similar features. A large field containing the greenschist facies assemblage Act–Chl–Ep–Ab occupies most of the phase diagram below 450°C (ex-cept at low pressures). Two relatively thin fields containing coexisting actinolite and hornblende, and coexisting albite and oligoclase, occur immediately up-grade of the green-schist facies field, which together correspond to the observed changes across the greenschist–amphibolite facies transition
zone. The compositional fields that comprise the epidote–amphibolite facies, defined by the coexistence of epidote and hornblende, narrow in size with decreasing pressure (Figure 10c,e).
The P–T phase diagrams calculated using DS6 (Figure 10b,d,f) show a number of differences compared with those calculated using the DS5 data set including: (a) a displace-ment of the plagioclase-in (andesine) reaction to higher temperatures; (b) a large increase in the size of the coex-isting albite–oligoclase/andesine field (shown in blue); (c) a smaller coexisting actinolite–hornblende field (shown in brown); (d) displacement of the chlorite-out reaction to lower temperatures; and (e) a displacement of the ilmenite-in and titanite-out reactions to higher temperature. The result is a considerably different predicted sequence of mineral appear-ances and disappearances, with oligoclase appearing only at higher grades after the disappearance of one or both of chlorite and epidote at moderate pressures. In addition, the intersection of the hornblende-in and oligoclase/andesine-in lines occurs at very low pressures (~1 kbar) resulting in the absence, or much reduced size, of a field in which oligoclase/andesine coexists with actinolite rather than hornblende.
A number of consistent changes are observed with in-creasing XFe3+ for phase diagrams calculated using either DS5 or DS6 (Figures 10 and 11): (a) the Act+Hbl field is dis-placed to lower temperatures; (b) the coexisting Ab+Pl field moves to slightly higher temperatures; and (c) there is an in-crease in the size of the epidote-amphibolite facies. These effects cause the intersection of the hornblende-in and oli-goclase/andesine-in reactions to be displaced from ~4.7 kbar at 10% XFe3+ (Figure 10a) to ~2.4 kbar at 20% XFe3+ (Figure 10e) for the phase diagrams calculated using DS5, and from ~1.5 kbar at 10% XFe3+ (Figure 10b) to <1 kbar at 20% XFe3+ (Figure 10f) for the DS6 phase diagrams.
To provide an indication as to the metamorphic pres-sures during greenschist–amphibolite metamorphism at Flin Flon, the grey band on each phase diagram provides the closest match to the observed sequence of isograds: (a) the hornblende-in isograd appearing down-grade of the oligoclase-in isograd; and (b) actinolite-out up-grade of oligoclase-in. The estimated pressure varies considerably based on the ferric iron content for the DS5 phase diagrams (Figure 10a,c,e) but is restricted to the range of 3.3–4.3 kbar for the phase diagram calculated using the preferred aver-age estimate for the ferric iron content (Figure 10c). For
F I G U R E 1 0 P–T pseudosections calculated using DS5 (left) and DS6 (right) for different XFe
3+ contents: 10% (a, b), 16.9% (c, d), and 20% (e, f). All diagrams were calculated using the average high-Mg basaltic bulk composition. The thermodynamic data and a–x models used to calculate the diagrams are discussed in the text. The fields are coloured according to important mineral associations (discussed in the text): blue = coexisting albite and oligoclase; brown = coexisting actinolite and hornblende; yellow = epidote-amphibolite facies (coexisting epidote and hornblende); green = chlorite-bearing transitional assemblages (coexisting chlorite and hornblende); and pink = actinolite–oligoclase fields. The grey-coloured bands indicate the estimated pressure range for the Flin Flon sequence based on the observed sequence of isograds (see text for discussion)

| 17STARR eT Al.
1
2
3
4
5
6
7
8
1
2
3
4
5
6
7
8
1
2
3
4
5
6
7
8
1
2
3
4
5
6
7
8
1
2
3
4
5
6
7
8
Hbl PlBt Ilm
-Ep
-Chl
Act Chl Ep Ab Bt Ttn
Hbl Chl Ep Ab Bt Ttn
Ab+
Pl
Hbl Chl Ep Pl
Bt Ttn
Hbl PlBt Ttn Ilm
Hbl Chl PlBt Ilm
Hbl Act PlBt Ilm
-Chl
-Ttn
-Ttn
+Mag
-Act
+Hbl
+Pl
-Ab
Hbl Ep PlBt Rt Ttn
+Rt
+Ilm
+Ilm
-Ep
Hbl Act ChlPl Bt Ilm
Hbl Act Chl Pl
Bt Ttn
Hbl Act Chl EpPl Bt Ttn
Act Chl Ep Pl Bt Ttn
Hbl Act Chl Ep Ab Bt Ttn
+Hbl
-Act
(a)DS5
10% Fe3+
+Qtz+H2O
Flin Flon(4.7–5.4 Kbar)
Pres
sure
(kba
r)
1
2
3
4
5
6
7
8
400 450 500 550 400 450 500 550
400 450 500 550
400 450 500 550
Hbl Act Chl Ep Ab Bt Ttn
Act Chl Ep Ab Bt Ttn
Hbl Chl Ep Ab Bt Ttn
Hbl Ep PlBt Rt
Hbl Chl PlBt Ilm
Hbl ActPl Bt Ilm
Hbl Act PlBt Ilm Mag
-Chl
-Chl
+Mag-Act
Hbl Chl Pl Bt
Ttn
Hbl Chl Ep Pl
Bt Ttn
Hbl PlBt Ilm
-Ttn
-Ep
-Ep
-Ttn
+Ilm
-Chl
-Ab
+Rt
+Ilm
-Ttn
Act +Hbl
(e)DS5
20% Fe3+
+Qtz+H2O
-Act
+Hbl
Flin Flon(2.4–3.7 Kbar)
400 450 500 550
400 450 500 550
Hbl PlBt Ilm
Temperature (ºC)
(c)DS5
Calc - 16.9% Fe3+
+Qtz+H2O
-Ep
-Ep
-Chl
Act + Hbl
Act Chl Ep Ab Bt Ttn
Act +
Hbl
Hbl Chl Ep Ab Bt Ttn
Ab+
Pl
Bt Chl Hbl Plag
Ttn
Hbl Chl Ep PlBt Ttn
Hbl Pl Bt Ttn
Ilm
Hbl Chl PlBt Ilm Hbl Act Pl
Bt Ilm
Hbl Act PlBt Mag Ilm
-Chl
Flin Flon(3.3–4.4 Kbar)
+Ilm
-Ttn
-Ttn
+Mag
-Act
+Hbl
Hbl Ep Pl Bt
Ttn Rt
+Pl
-Ab
Hbl Ep Pl Bt
Rt
+Rt+Ilm-Ttn
(b)DS6
10% Fe3+
+Qtz+H2O
(f)DS6
20% Fe3+
+Qtz+H2O
(d)DS6
Calc - 16.9% Fe3+
+Qtz+H2O
-Act
+Hbl
-Act
+Hbl
Act Chl Ep Ab Bt Ttn
Hbl Act Chl Ep Ab Bt Ttn
-Chl
HblEp AbBt Ttn
+Pl
-Ep
+Pl
-Ep
-Chl+Ilm
-Ttn
Hbl ChlEp AbBt Ttn
-Ab
Hbl Pl Bt Ilm
-Ab
Hbl Chl Pl Ab Bt Ttn
Hbl Chl Pl Ab Bt Ilm
-Act
Hbl Act Pl Bt Ilm
Hbl PlAb Bt Ttn
Hbl Pl Ab Bt Ilm
-Act
+HblAct Chl Ep
Ab Bt Ttn
Hbl Act Chl Ep Ab Bt Ttn
Hbl ChlEp AbBt Ttn
-Chl
HblEp AbBt Ttn
+Pl
-Ep
Hbl PlAb Bt Ttn
+Ilm
-Ttn
-Ab
Hbl Pl Bt Ilm
-Ab
-Act
Hbl Act Pl Bt Ilm
-Chl
-Chl
-Chl
-Ab
-Act
+Pl
-Ep
Hbl Chl Pl Ab Bt Ttn
Hbl AbBt Ttn
Hbl Chl AbBt Ttn
Hbl Chl Pl Ab
Bt Ilm
-Act
+Hbl
Hbl Pl Ab Bt IlmAct Hbl Chl
Ep Pl AbBt Ttn
-Act
+Hbl
-Ep
+Pl
-Act
-Chl
+Pl
-Ep
+Ilm
-Ttn
-Ttn
-Act
-Chl
-Ab
-Ab
-Chl
-Ab
-Act
Act Chl Ep Ab Bt Ttn
Hbl Act Chl Ep Ab Bt Ttn
Hbl ChlEp AbBt Ttn
HblEp AbBt Ttn
Hbl Chl Pl Ab Bt Ttn
+Pl
-Ep
Hbl PlAb Bt Ttn
Hbl AbBt Ttn
Act Chl Ep Pl AbBt Ttn
Act Hbl ChlEp Pl Ab
Bt Ttn
Hbl Chl AbBt Ttn
Hbl Chl Pl Ab
Bt IlmHbl Act Pl
Bt Ilm
Hbl Pl Bt Ilm
Hbl Pl Ab Bt Ilm
18 | STARR eT Al.
the phase diagrams calculated using DS6, the range of esti-mated pressures for Flin Flon is much lower (1.5–1.8 kbar at 10% XFe3+, 1–1.2 kbar at 16.9% XFe3+, and <1 kbar at 20% XFe3+).
9.4 | Modelling of the prehnite–pumpellyite—greenschist facies transition
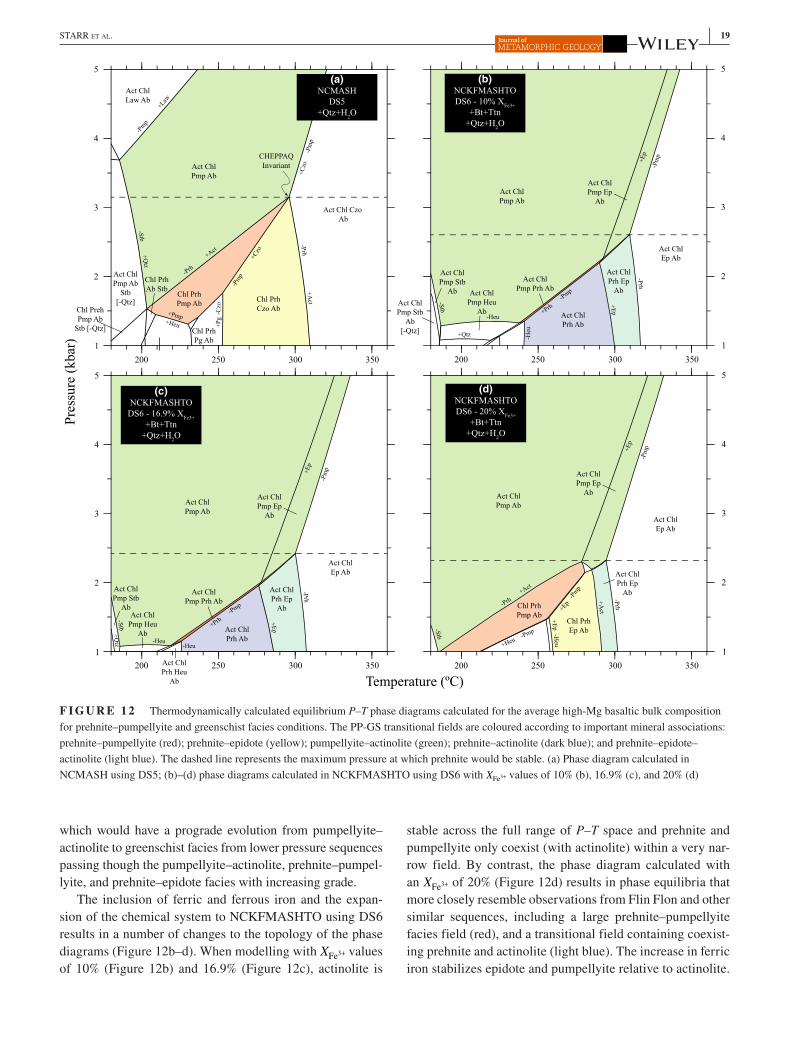
Previous studies of prehnite–pumpellyite facies rocks have focussed on equilibria within the CMASH and NCMASH systems (Frey, Capitani, & Liou, 1991; Liou, Maruyama, & Cho, 1985; Powell, Carmichael, & Hodgson, 1993) due to the lack of thermodynamic data and a–x models for key phases such as prehnite and pumpellyite. However, as a number of minerals incorporate Fe2+ (pumpellyite, amphibole) and Fe3+ (prehnite, pumpellyite, amphibole, epidote), modelling in NCKFMASHTO is preferable in order to more realistically describe the natural phase equilibria.
Data set 5 does not include ferrous or ferric iron end-members for prehnite and pumpellyite, limiting the chemical system which can be modelled to NCMASH. However, the addition to DS6 of ferrous and ferric iron end-members for pumpellyite and a ferric iron end-mem-ber for prehnite, accompanied by new a–x models for these two minerals (Holland & Powell, 2011), allows the system to be expanded to NCKFMASHTO. A number of phase
diagrams were calculated at prehnite–pumpellyite to green-schist facies conditions (180–360°C; 1–5 kbar) using the same average high-Mg basaltic bulk composition described above.
The fields pertaining to the prehnite–pumpellyite and PP-GS transition facies are coloured according to the mineral sub-assemblages involving prehnite, pumpelly-ite, epidote, and actinolite: (a) prehnite–pumpellyite (red); (b) prehnite–epidote (yellow); (c) pumpellyite–actinolite (green); (d) prehnite–actinolite (dark blue); and (e) preh-nite–epidote–actinolite (light blue). These different sub-as-semblages are largely consistent with the common facies divisions (prehnite–pumpellyite, prehnite–actinolite, preh-nite–epidote, and pumpellyite–actinolite) proposed for sub-greenschist metabasites (Frey et al., 1991; Liou et al., 1985; Powell et al., 1993).
Figure 12a shows a phase diagram calculated using DS5 in the NCMASH system. The prehnite–pumpellyite facies assemblage forms a relatively narrow field bounded by the prehnite-out/actinolite-in and the pumpellyite-out/clino-zoisite-in univariant reactions. The pumpellyite–actinolite stability field occupies much of the phase diagram, whereas actinolite is not stable with prehnite in any part of the phase diagram. An invariant point, equivalent to the CHEPPAQ point (coexisting chlorite–H2O–epidote–prehnite–pumpel-lyite–actinolite–quartz) of Powell et al. (1993), occurs at ~3.2 kbar, 295°C, separating higher pressure assemblages
F I G U R E 1 1 T −XFe
3+ diagrams calculated for greenschist to lower amphibolite facies conditions using DS5 (a) and DS6 (b), at a pressure of 4 kbar. The grey box in (a) represents the range of possible pressures that produce the correct sequence of isograds observed in Flin Flon (no such correct sequence occurs when modelling using DS6 in (b)). The labelled X
Fe3+ values and letters below the x-axis refer to the P–T diagrams shown
in Figure 10
0.0 0.1 0.2 0.3Fe2O3 / (FeO+Fe2O3) (wt%)
400
425
450
475
500
525
550
(a)DS5
T-XFe3+ - 4kbar+Qtz+H2O
Hbl PlBt Ilm
-Ep
Act Chl Ep Ab Bt Ttn
+Ilm-Ttn
-Act+Hbl+Pl
-Ep
Act +
Hbl+Hbl
-Act
Hbl Chl Ep Ab Bt Ttn
Hbl Chl Ep Pl Bt Ttn
Hbl Chl Pl Bt Ilm
Hbl Act Chl Pl Bt Ttn
Act Chl Ep Pl Bt Ttn
Hbl Act Chl Ep Pl Bt Ttn
Hbl Act Pl Bt Ilm
-Chl
-Chl
+Mag
+Act2
-Act
+Rt
+Rt
Tem
pera
ture
(ºC
)
10%(a)
16.9%(c)
20%(e)
Hbl Act Chl Ep Ab Bt Ttn
10%(b)
16.9%(d)
20%(f)
(b)DS6
T-XFe3+ - 4kbar+Qtz+H2O
0.0 0.1 0.2 0.3
-Act+Hbl
-Ep
-Chl
-Chl
-Ep+Pl
+Pl+Ru
Act Chl Ep Ab Bt Ttn
Hbl Chl Ep Ab Bt Ttn
Hbl Chl Ab Bt Ttn
Hbl Pl Ab Bt Ttn
Hbl AbBt Ttn
Hbl Ep Ab Bt Ttn
+Ilm
+Ilm
-Ttn
-Ttn
-Ab-Ab
-Ab
-Act
+Ru
-Ru
Hbl Pl AbBt Ilm Ttn
Hbl Pl AbBt Ilm
Hbl PlBt Ilm Hbl Pl
Bt Ilm Ttn
Hbl Pl AbBt Ru Ttn
Hbl Act Chl Ep Ab Bt Ttn
| 19STARR eT Al.
which would have a prograde evolution from pumpellyite–actinolite to greenschist facies from lower pressure sequences passing though the pumpellyite–actinolite, prehnite–pumpel-lyite, and prehnite–epidote facies with increasing grade.
The inclusion of ferric and ferrous iron and the expan-sion of the chemical system to NCKFMASHTO using DS6 results in a number of changes to the topology of the phase diagrams (Figure 12b–d). When modelling with XFe3+ values of 10% (Figure 12b) and 16.9% (Figure 12c), actinolite is
stable across the full range of P–T space and prehnite and pumpellyite only coexist (with actinolite) within a very nar-row field. By contrast, the phase diagram calculated with an XFe3+ of 20% (Figure 12d) results in phase equilibria that more closely resemble observations from Flin Flon and other similar sequences, including a large prehnite–pumpellyite facies field (red), and a transitional field containing coexist-ing prehnite and actinolite (light blue). The increase in ferric iron stabilizes epidote and pumpellyite relative to actinolite.
F I G U R E 1 2 Thermodynamically calculated equilibrium P–T phase diagrams calculated for the average high-Mg basaltic bulk composition for prehnite–pumpellyite and greenschist facies conditions. The PP-GS transitional fields are coloured according to important mineral associations: prehnite–pumpellyite (red); prehnite–epidote (yellow); pumpellyite–actinolite (green); prehnite–actinolite (dark blue); and prehnite–epidote–actinolite (light blue). The dashed line represents the maximum pressure at which prehnite would be stable. (a) Phase diagram calculated in NCMASH using DS5; (b)–(d) phase diagrams calculated in NCKFMASHTO using DS6 with X
Fe3+ values of 10% (b), 16.9% (c), and 20% (d)
(d)NCKFMASHTODS6 - 20% XFe3+
+Bt+Ttn+Qtz+H2O
-Prh
+Ep
-Stb
-Pm
p
+Act
-Prh
-Heu
Act ChlEp Ab
Act ChlPmp Ep
AbAct ChlPmp Ab
+Ep
+Act
+Heu
+Ep
-Pmp
-Pmp
Chl PrhPmp Ab
Chl PrhEp Ab
Act ChlPrh Ep
Ab
200 250 300 350
-Prh
+Ep
-Stb
-Pm
p
+Ep
-Pmp
+Prh
+Qtz -Heu
-Heu
Act ChlPmp Prh Ab
Act ChlPmp Ab
Act ChlPrh Ab
Act ChlPrh Ep
Ab
Act ChlEp Ab
Act ChlPmp Ep
Ab
Act ChlPrh Heu
Ab
Act ChlPmp Heu
Ab
Act ChlPmp Stb
Ab
(c)NCKFMASHTODS6 - 16.9% XFe3+
+Bt+Ttn+Qtz+H2O
1
2
3
4
5
200 250 300 350
200 250 300 350
(b)NCKFMASHTODS6 - 10% XFe3+
+Bt+Ttn+Qtz+H2O
-Prh
+Ep
-Stb
-Pm
p
+Ep
-Pmp
+Prh
+Qtz
-Heu
-Heu
Act ChlPmp Prh Ab
Act ChlPrh Ep
Ab
Act ChlEp Ab
Act ChlPmp Ep
Ab
Act ChlPmp Heu
Ab
Act ChlPmp Stb
Ab
Act ChlPmp Ab
Act ChlPmp Stb
Ab[-Qtz]
Act ChlPrh Ab
200 250 300 3501
2
3
4
5
1
2
3
4
5
1
2
3
4
5
-Stb
-Pmp-Prh
Act Chl Czo Ab
Chl PrhCzo Ab
Act ChlPmp Ab
Chl PrhPmp Ab
Act ChlLaw Ab
-Prh
+Law
-Pmp
-Pm
p
+Act
+Act+C
zo
-Czo
+Pg
Chl PrhPg Ab
Act ChlPmp Ab
Stb[-Qtz]
+Pmp+Heu
+Qtz
Chl PrehPmp Ab
Stb [-Qtz]
Chl PrhAb Stb
(a)NCMASH
DS5+Qtz+H2O
CHEPPAQInvariant
Pres
sure
(kba
r)
+Czo
Temperature (ºC)

20 | STARR eT Al.
10 | COMPARISON BETWEEN MODELLING RESULTS AND OBSERVATIONS
10.1 | Greenschist to amphibolite facies transition
The detailed documentation of mineral assemblages, modal proportions, and compositions from Flin Flon, combined with a database of observations from other sequences, allows for the evaluation of modelling results generated using both DS5 and DS6. The modelling using DS5 is able to broadly reproduce the main observations from Flin Flon and other se-quences. This includes reproducing the sequence of isograds from the Flin Flon sequence and the presence of different mineral assemblage sequences at different pressures, and is therefore useful for examining P–T conditions and petroge-netic processes in these rocks. However, a number of differ-ences exist between the model results produced using DS5 and the natural observations: (a) differences in the compo-sitions of key minerals such as amphibole and chlorite; (b) sensitivity to XFe3+ content, which is not supported by natu-ral observations; and (c) differences between the observed stability of ilmenite, which first appears coincident with the oligoclase-in isograd, and the predicted stability field, which occurs considerably up-grade of the hornblende-in and oligo-clase-in reactions.
By contrast, the modelling results using DS6 show a num-ber of important differences from those using DS5, a number of which are incompatible with observations from Flin Flon and other sequences. Perhaps the most important difference concerns the relative stability and compositions of amphibole and plagioclase group minerals. The appearance of oligo-clase/andesine and the disappearance of albite are predicted to occur at much higher temperatures than the hornblende-in reaction at moderate pressures, and the field of coexisting albite and oligoclase/andesine occupies a much larger area of P–T space. A comparison of the changing modal abun-dances with increasing temperature (at 4 kbar) calculated using DS5 versus DS6 is shown in Figure 13g,h. This shows that for the DS5 modelling, the appearance of oligoclase and hornblende occurs concurrently with the breakdown of ac-tinolite, epidote, albite, and chlorite over a narrow range of
temperature (Figure 13g). By contrast, modelling using DS6 predicts the formation of more calcic plagioclase (initially andesine; Figure 13e) at higher temperatures, after the major hornblende-forming reaction and dehydration interval, in-volving the breakdown of albite and a small amount of horn-blende. Based on the observed modal abundance changes in Flin Flon, the DS5 modelling does a more realistic job of reproducing the observed patterns of mineral isograds and reactions in Flin Flon and other sequences from the literature.
In addition, the predicted compositions of important min-erals, particularly hornblende, generated using DS6 are differ-ent than those observed at Flin Flon and predicted using DS5. Figure 13a–f show a comparison between measured and cal-culated compositions of amphibole, chlorite, plagioclase, and epidote using data sets 5 and 6, calculated along an isobaric P–T path from 400 to 550°C at 4 kbar (compositions cal-culated every 5°C). The predicted amphibole compositions generated using DS5 are closer to those observed in the Flin Flon sequence, with the amphibole compositions for the DS6 modelling containing too little Si (and hence high TAl) by ~0.2–0.9 cpfu (Figure 13a). The predicted A-site occupancies are higher than those observed at Flin Flon, for both the DS5 and DS6 modelling by ~0.05–0.25 cpfu (Figure 13b). These differences are similar to those documented by Forshaw, Waters, Pattison, Palin, and Gopon (2019), who compared observed and thermodynamically predicted compositions of amphibole in mafic granulites using DS6.
The discrepancies between the modelling results produced using DS5 and DS6 are likely a function of changes to both the plagioclase and amphibole a–x models. Modifications to the plagioclase a–x models for DS6 appear to result in the stability fields for the more calcic plagioclase phase being shifted to higher temperatures and an increase in the anorthite content of the plagioclase such that the stable plagioclase co-existing initially with albite is andesine (e.g. An36; Figure 13e) rather than oligoclase. The amphibole a–x models likely also play a role in controlling the relative stability fields of am-phibole and plagioclase, with the unusually high predicted Al contents (Figure 13a) and higher modal proportions (Figure 13h) of the hornblende potentially suppressing the appear-ance of more calcic plagioclase (andesine) such that it only appears at higher temperatures. Based on this analysis of the DS6 modelling, it is suggested that some modifications to the
F I G U R E 1 3 Comparison of analysed mineral compositions from the Flin Flon sequence with predicted compositions using DS5 and DS6 for amphibole (a, b), chlorite (c, d), plagioclase (e) and epidote (f) and a comparison of the predicted modal abundances for DS5 (g) and DS6 (h). Mineral compositions were calculated along an isobaric P–T path from 400 to 550°C at 4 kbar (compositions calculated every 5°C). (a, b) Predicted versus analysed amphibole compositions. The shaded areas show the amphibole compositions from the greenschist facies (lightest shade), hornblende–actinolite zone (medium shade), and the hornblende–actinolite–oligoclase zone (darkest shade). The symbols represent compositions calculated at different temperatures (see key). (c) Si versus Fe/(Fe+Mg) ratio plot for chlorite (plot and fields after Hey, 1954). (d) Octahedral cation plot for chlorite (plots and fields after Zane and Weiss, 1998). (e) Comparison of plagioclase compositions (XCa—anorthite content) versus temperature for DS5 and DS6. (f) Comparison of epidote composition (X
Fe3+ (M3)) versus temperature for DS5 and DS6. (g, h) Predicted modal
abundances with increasing temperature for DS5 (g) and DS6 (h)

| 21STARR eT Al.
5.56.06.57.07.58.00.0
0.2
0.4
0.6
0.8
1.0
Ferro-Actinolite
DS5 - 500-550˚CDS5 - 450-500˚CDS5 - 400-450˚C
DS6 - 500-550˚CDS6 - 450-500˚CDS6 - 400-450˚C
DS5 - 500-550˚CDS5 - 450-500˚CDS5 - 400-450˚C
DS6 - 500-550˚CDS6 - 450-500˚CDS6 - 400-450˚C
Tschermakite
Ferro-Tschermakite
Ferro-Hornblende
Magnesio-HornblendeActinolite
Tremolite
DS5 - 500-550˚CDS5 - 450-500˚CDS5 - 400-450˚C
DS6 - 450-500˚CDS6 - 400-450˚C
Hbl-Act-Olig ZoneHbl-Act ZoneGreenschist Facies
0.2 0.3 0.4 0.5 0.6 0.7 0.8 0.9 1.00.0
0.1
0.2
0.3
0.4
0.5
0.6
0.7
0.8
0.9
0.1
2.0 2.5 3.0 3.5 4.00.0
0.2
0.4
0.6
0.8
1.0
Mg2+
/(Mg2+
+Fe2+
)
Mg2+/(Mg2++Fe2+)
A S
ite o
ccup
ancy
(cpf
u)
Si(cpfu)
Type II
Type I
ChamositeClinochlore
Si
Fe/(F
e+M
g+M
g)
DS5 - 500-550˚CDS5 - 450-500˚CDS5 - 400-450˚C
DS6 - 450-500˚CDS6 - 400-450˚C
Hbl-Act-Olig ZoneHbl-Act ZoneGreenschist Facies
Corundo-philite
Sheridanite Clino-chlore
Pennine Talc-Chlorite
Pseudothuringite
Daphnite
Bruns-vigite
Ripidolite Pycno-chlorite
Diabantite
Al(VI) +
Mg Fe
450 475 500 525 5500
0.1
0.2
0.3
0.4
DS5DS6 DS5
DS6
Plagioclasecompositions
Epidotecompositions
Temperature
X(C
a)
Temperature
XFe
3+(M
3)
Temperature (P = 4 Kbar)
Mod
al p
ropo
riton
s
Mod
al p
ropo
riton
s
Temperature (P = 4 Kbar)
400 420 440 460 4800.2
0.3
0.4
0.5
450 475 500 525 550400 4250
60
20
80
40
100
Actinolite
Epidote
BiotiteChlorite
Titanite Quartz
Albite Oligoclase
Ilmenite
Hornblende
DS5 Modelling
450 475 500 525 550400 4250
60
20
80
40
100
Actinolite
Epidote
BiotiteChlorite
Titanite
Quartz
Albite OligoclaseIlmenite
Hornblende
DS6 Modelling
Flin FlonActinolite
Flin FlonHornblende
Ab-only
Flin FlonHornblende
Ab+Olig
(b)(a)
(c) (d)
(e) (f)
(g) (h)
22 | STARR eT Al.
plagioclase and amphibole a–x models, the latter of which was calibrated using higher grade metabasic granulites, are likely required in order to accurately model mafic rocks at greenschist and amphibolite facies conditions.
In this study, exploratory modelling was conducted to test whether the new addition of Ti and K to the DS6 amphibole models has a significant effect on the phase diagram topol-ogy, calculating phase diagrams, and mineral compositions for an average high-Mg basaltic bulk composition, with Ti and/or K excluded from the amphibole models of Green et al. (2016) (Figure S1). The phase diagrams and predicted mineral compositions are very similar regardless of the pres-ence or absence of Ti and/or K, suggesting that the source of the discrepancies lies elsewhere (Figure S1). It may be that changes to the thermodynamic end-member data or mixing properties that influence the degree of tschermakite substitu-tion are the main cause of the discrepancies.
One of the noteworthy features of the thermodynamic mod-elling of this study is the large effect that ferric iron content has on the stability of amphibole and epidote minerals, and thus on the relative positioning of the hornblende-in and oligoclase-in reactions. Even small changes in the ferric iron contents, such as by varying XFe3+ between 10% and 20%, affects the predicted order of reactions as well as the pressure of the hornblende–oli-goclase intersection (Figures 10 and 11). Given the regularity in mineral assemblage sequences in Flin Flon, where samples dis-play a range of ferric iron contents (XFe3+ = 5%–33%), and other similar sequences described in the literature, the thermodynam-ically predicted sensitivity of the phase equilibria to small vari-ations in whole-rock ferric iron content seems inconsistent with the repeatable natural observations and likely reflects some oversensitivity of the a–x models to the XFe3+ content for key phases such as amphibole and epidote.
10.2 | Prehnite–pumpellyite to greenschist facies transition
Previous attempts have been made in constructing the phase relations in the prehnite–pumpellyite facies and across the PP-GS transition, including experimental studies (Liou, Kim, & Maruyama, 1983) and theoretical petrogenetic grids (e.g. Frey et al., 1991; Liou et al., 1985; Powell et al., 1993). These studies have resulted in the recognition of a number of subfa-cies including the prehnite–pumpellyite, pumpellyite–actino-lite, prehnite–epidote, and prehnite–actinolite facies.
The NCMASH phase diagram calculated using DS5 (Figure 12a) broadly reproduces these mineral sub-as-semblages including the pumpellyite–actinolite (green), prehnite–pumpellyite (red), and prehnite–epidote (yellow) sub-assemblages, and is similar to the petrogenetic grids of Powell et al. (1993) and Liou et al. (1985). The expansion of the chemical system to NCKFMASHTO using the DS6
thermodynamic data set and a–x models, which allows for the incorporation of Fe2+ and Fe3+, potentially permits more realistic modelling of the prehnite–pumpellyite to greenschist transition. The phase diagram calculated using DS6 with an XFe3+ value of 20% (Figure 12d) best replicates the natural sequence of mineral assemblages observed at Flin Flon and within other sequences from the literature, and a simplified summary version of the phase diagram with labelled sub-facies fields is presented in Figure 14b. This modelling pro-duces distinct transitional fields including a lower pressure, higher temperature prehnite–epidote field, and a transitional prehnite–actinolite field immediately down-grade of the greenschist facies at low pressure (below ~2.3 kbar; Figure 14b).
However, several inconsistencies become apparent when comparing the modelling predictions with observations from Flin Flon and other natural sequences. The first relates to the predicted size of the coexisting prehnite and pumpellyite field (shown in red), which occupies a relatively narrow field in P–T space when modelling with either DS5 (Figure 12a) or DS6 (Figures 12d and 14b). At Flin Flon, the assemblage prehnite–pumpellyite–epidote is widespread and is found considerably down-grade of the PP-GS transition zone, sug-gesting that it is stable over a range of P–T conditions. There is no evidence for the existence of actinolite or loss of prehnite at very low grades, as predicted by all of the phase diagrams in Figure 12, in Flin Flon or in any other sequence described in the literature. In addition, the following prograde sequence of metamorphic mineral sub-assemblages—prehnite–pum-pellyite to pumpellyite–actinolite to greenschist facies as-semblages—has been documented in the Otago Schist, New Zealand (Bishop, 1972), which cannot be accommodated in the phase diagrams in Figure 12. This suggests that, in re-ality, the reaction separating the prehnite–pumpellyite (red) and pumpellyite–actinolite (green) fields has a flatter slope than shown in the phase diagrams in Figure 12, resulting in a larger prehnite–pumpellyite facies field and a more restricted actinolite–pumpellyite field at low pressures.
Perhaps the most important difference is the nature of the PP-GS transition zone. The thermodynamic modelling pre-dicts a PP-GS transition extending across a wide P–T interval characterized by a number of mineral sub-assemblages. The loss of pumpellyite occurs at the lowest grades, resulting in transitional prehnite–epidote and prehnite–actinolite transi-tional zones and the predicted series of isograds shown in Figure 14b. However, in Flin Flon, the prehnite–pumpelly-ite zone passes up-grade into a very narrow zone in which actinolite is stable with both prehnite and pumpellyite, and the prehnite-out and pumpellyite-out isograds are coincident within the resolution of the mapping. There is no evidence for the loss of pumpellyite before prehnite and hence there is no evidence for passage through either the predicted prehnite–epidote or prehnite–actinolite subfacies.

| 23STARR eT Al.
F I G U R E 1 4 Simplified equilibrium P–T phase diagrams demonstrating the main pressure-related metamorphic facies series at greenschist to lower amphibolite facies conditions (a) and prehnite–pumpellyite to greenschist facies conditions (b). (a) Simplified equilibrium P–T phase diagram (NCKFMASHTO) for an average high-Mg basalt with an average calculated Fe3+ content (16.9 wt%) at greenschist to lower amphibolite facies conditions calculated using DS5. Three different pressure-related metamorphic series are shown (‘actinolite–oligoclase’ type; ‘hornblende–albite’ type; and high-P type), along with the predicted order of isograds and examples from the literature. (b) Simplified equilibrium P–T phase diagram (NCKFMASHTO) for an average high-Mg basalt at prehnite–pumpellyite to lower greenschist facies conditions using DS6 (X
Fe3+ = 20%).
Two different pressure-related metamorphic series (prehnite–pumpellyite type and pumpellyite–actinolite type) are plotted, alongside the predicted order of isograds and literature examples
1
2
3
4
5
6
7
8Pr
essu
re (k
bar)
400 450 500 550Temperature (ºC)
DS516.9% XFe3++Qtz+H2O
NCKFMASHTOSimplified
-Ep
-Ep
-Chl
-Chl
-Act
+Hbl
+Pl
-Ab
Hbl-in Ep-outChl-out
(1)Pl-in(2)Act-out(3)Ab-out
Pl-in Ep-out Chl-out
(1)Hbl-in(2)Ab-out Act-out
Chlorite-BearingAmphibolites
EpidoteAmphibolite
Facies
Greenschist FaciesAct Chl Ep Ab Bt Ttn
Amphibolite FaciesHbl PlBt Ilm
Hbl-in Act-out Ep-out Chl-out
Low-P Sequence‘Actinolite-oligoclase’ type
Pl-in; Hbl-in; Ab-out; Act-out; Ep-out; Chl-out(e.g. Karmutsen Volcanics, British Columbia)
Moderate-P Sequence‘Hornblende-albite’ type
Hbl-in; Pl-in; Act-out; Ab-out; Ep-out; Chl-out(e.g. Flin Flon, Manitoba; Scottish Dalradian, Scotland; Cape Smith Belt, Quebec (South))
High-P SequenceHbl-in; Act-out; Pl-in; Ab-out; Ep-out; Chl-out
(e.g. Cape Smith Belth, Quebec (North))
Pl-inAb-out
Type of SequenceOrder of Isograds
Examples in the Literature
+Pl
-Ab
+Hbl
~3.3Kbar
~4.4 Kbar
Low to Moderate P Sequence‘Prehnite-Pumpellyite’ type
Zeolite-out; Prh-in and Act-out; Pmp-out and Ep-in; Act-in; Prh-out(e.g. Flin Flon, Manitoba; Karmutsen Volcanics, BC, Smartville Complex, California)
High P Sequence‘Pumpellyite-actinolite’ type
(e.g. Northern Pelopennesus, Greece; Madre de Dios Metamorphic Complex, Chile)
(a)
(b)
Hbl-Ab Bathograd
Act-Hbl Bathograd
CHEPPAQ Bathograd
Pres
sure
(kba
r)
1
2
3
4
5
DS620% XFe3+
NCKFMASHTO+Bt+Ttn
+Qtz+H2OSimplified
-Prh
+Ep
-Stb
-Pm
p
+Act
-Prh
-Heu
Act ChlPmp Ep
Ab
+Ep
+Act +Ep
-Pmp
200 250 300 350
Temperature (ºC)
Prehnite-EpidoteFacies
Chl PrhCzo Ab
Pumpellyite-Actinolite
FaciesAct ChlPmp Ab
Prehnite-Pumpellyite
FaciesChl PrhPmp Ab
Greenschist FaciesAct Chl Czo
Ab
(1)Prh-in(2)Act-out
(1)Pmp-out(2)Ep-in Act-in
Prehnite-Actinolite
FaciesAct ChlPrh Ep
Ab
Prh-out
~2.3–3.2 Kbar
ZeoliteFacies
Act ChlPmp Ab
Zeo

24 | STARR eT Al.
As discussed previously, similar observations were docu-mented in the Rossland Volcanic sequence (British Columbia, Canada) showing the lack of transitional sub-assemblages (e.g. prehnite–epidote; prehnite–actinolite subfacies) and the rarity of coexisting prehnite or pumpellyite with actinolite (Figure 9). Such observations suggest that, at least in some cases, the nature of the PP-GS transition zone may be quite different from that predicted by the thermodynamic model-ling and experimental work (Frey et al., 1991; Liou et al., 1983; Liou et al., 1985; Powell et al., 1993; this study).
Factors that may account for the discrepancies between the above modelling and the natural record include fluid compo-sitional heterogeneity (in particular XCO2) (Digel & Ghent, 1994), and sensitivity of the mineral assemblages to domainal bulk-rock compositions involving variation in parameters such as the Mg/(Mg+Fe) and Fe3+/Fe2+ ratios (Day & Springer, 2005; Liou et al., 1985; Springer et al., 1992). The phase equilibria modelling of Digel and Ghent (1994) suggested that prehnite and pumpellyite are only stable in equilibrium with H2O-rich fluids with XCO2 values of <0.002. However, in this study, calcite commonly coexists with both prehnite and pumpellyite, including within the same amygdule or phe-nocryst pseudomorph, suggesting that the prehnite- and pum-pellyite-bearing mineral assemblages are not as sensitive to XCO2 fluid content as suggested by Digel and Ghent (1994). Further work is necessary to better characterize the role of fluid composition in controlling mineral assemblages at this grade. The large variation in mineral assemblages and modes within a single thin section supports the idea that small-scale variations in bulk composition, most likely representing in-herited igneous or hydrothermal alteration features, results in separate, non-communicating, equilibrium volumes. This may account for different domains dominated by prehnite, pumpellyite or actinolite or all three together. Such compo-sitional heterogeneity cannot be portrayed in phase diagrams calculated for a single bulk composition.
11 | PRESSURE-SENSITIVE FACIES SERIES IN METABASITES
The use of pressure-sensitive metamorphic facies series has been widely recognized as providing useful insights into the tectonic and geodynamic conditions existing during meta-morphism (e.g. Carmichael, 1978; Pattison & Tracy, 1991; Pattison & Vogl, 2005; Powell, Carmichael, & Hodgson, 1995). The classic study of Carmichael (1978) demonstrated the existence of a number of pressure-sensitive metamorphic mineral assemblage sequences (bathozones) within metape-lite sequences separated by purely pressure-controlled iso-grads (bathograds) allowing for determination of varying pressure conditions over a wide range of P–T conditions. The analysis of such pressure-sensitive sequences has been
applied to tackle a number of tectonic problems including tracing variable burial depths in orogenic belts (e.g. Bégin, 1992; Powell et al., 1993), determining metamorphic field gradients (e.g. Powell et al., 1995; Todd & Engi, 1997), trac-ing variable erosion and uplift of metamorphic rocks (e.g. Carmichael, 1978) and testing for post-metamorphic tilting of metamorphic sequences (e.g. Pattison & Vogl, 2005). In this section, we aim to use the detailed examination of the Flin Flon suite and other metabasaltic sequences documented within the literature, combined with the most recent thermo-dynamic analysis, to provide useful and updated constraints on the P–T conditions of common pressure-sensitive meta-morphic facies series in prehnite–pumpellyite to lower am-phibolite facies rocks.
11.1 | Greenschist to amphibolite facies transition
The relative order of development of amphibole (actinolite, hornblende) and plagioclase (albite, oligoclase) group miner-als in prograde metamorphic sequences has been recognized as a useful indicator of metamorphic pressures within meta-basaltic rocks (e.g. Liou et al., 1974; Maruyama et al., 1983; Miyashiro, 1961). Previous studies (e.g. Bégin, 1992; Liou et al., 1974) have shown that the hornblende-in reaction has a steeper slope in P–T space than the oligoclase-producing reaction, resulting in an intersection (‘bathograd’ in the sense of Bégin, 1992) below which oligoclase develops at lower grade than hornblende, and above which hornblende devel-ops at lower grade than oligoclase (Figure 14a). As described previously, this difference has been observed in prograde me-tabasic sequences from the literature with examples of both hornblende appearing before oligoclase (‘hornblende–albite’ facies series) and oligoclase before hornblende (‘actinolite–oligoclase’ type). Despite the recognition of these patterns, the location in P–T space of the intersection between the hornblende-in and oligoclase-in reactions, termed here the hornblende–albite (Hbl-Ab) bathograd, and its sensitivity to bulk compositional variation, is poorly known. Bégin (1992) estimated the position of an invariant point corresponding to the Hbl-Ab bathograd, at 4.8–6 kbar, 460–490°C, using mixed-volatile equilibria calculations.
Figure 14a shows a simplified version of the P–T diagram from Figure 10c, calculated in NCKFMASHTO using DS5, on which are plotted schematic prograde P–T paths (meta-morphic field gradients) at different pressures. The lowest pressure metamorphic field gradient (‘actinolite–oligoclase type’ facies series) is characterized by the appearance of oligoclase before hornblende and predicts the following se-quence of reactions (manifested as isograds within the field): Pl-in, Hbl-out, Act-out, Ep-out, Chl-out. Based on Figure 14a, this low pressure, ‘actinolite–oligoclase type’ facies series

| 25STARR eT Al.
is constrained to pressures below the Hbl-Ab bathograd at less than ~3.3 kbar. The moderate pressure P–T path (‘horn-blende-albite type’ facies series) sequence is characterized by the appearance of hornblende before oligoclase and predicts the following sequence of reactions: Hbl-in, Pl-in, Act-out, Ab-out, Ep-out, Chl-out. This ‘actinolite–oligoclase’ type se-quence is constrained to be above the Hbl-Ab bathograd at greater than ~3.3 kbar. A possible higher pressure P–T path (‘actinolite–hornblende type’ facies series) is also character-ized by the appearance of hornblende before oligoclase, but in contrast to the moderate pressure sequence, actinolite is predicted to be consumed before oligoclase develops. These higher pressure sequences are constrained to be above a sec-ond bathograd termed the ‘actinolite–hornblende’ (Act-Hbl) bathograd at ~4.4 kbar, which occurs at the intersection of the actinolite-out and oligoclase-in reaction lines (Figure 14a). It is important to note that the degree to which actinolite per-sists above the incoming of hornblende is likely dependent on the kinetically controlled metastable persistence of actinolite going up-grade, as documented in Starr and Pattison (2019a). As a result, the use of this higher pressure facies series and Act-Hbl bathograd as a useful indicator of pressure requires careful analysis of textures.
11.2 | The prehnite–pumpellyite to greenschist facies transition
A potential bathograd separating lower pressure prehnite+chlorite-bearing assemblages and higher pressure pumpellyite+actinolite-bearing assemblages has been sug-gested based on the interpretation of NCMASH petrogenetic grids (Carmichael, 1991; Powell et al., 1993). This batho-grad corresponds to the position of the CHEPPAQ invariant point in NCMASH (Figure 12a), below which samples are predicted to pass through the prehnite–pumpellyite facies and other transitional prehnite-bearing sub-facies, whereas sam-ples at pressures higher than the bathograd pass through the pumpellyite–actinolite facies. There have been a number of estimates for the upper pressure limit of prehnite–pumpellyite facies assemblages, corresponding to this bathograd, based on modelling in NCMASH: ~4 kbar and 320°C (Powell et al., 1993); ~2.7 kbar and 320°C (Liou et al., 1985), and ~2 to 4 kbar and 250–300°C, depending upon the choice of a–x model for prehnite and pumpellyite (‘average model’ results: 3.2 kbar and 270°C; Frey et al., 1991).
When modelling in NCMASH, using DS5, the CHEPPAQ invariant is constrained to be ~3.2 kbar and 300°C. For a rock undergoing metamorphism at pressures below the ‘CHEPPAQ bathograd’, the expected mineral assemblage evolves progressively with increasing temperature through the pumpellyite–actinolite, prehnite–pumpellyite, prehnite–epidote, and greenschist facies. The prehnite–pumpellyite
stability field forms a relatively small, thin field that is re-stricted to ~200 to 280°C and 1.4–3.2 kbar.
If the chemical system is expanded to NCKFMASHTO, the CHEPPAQ invariant point becomes a series of invari-ant points involving the intersections of reactions involving prehnite, pumpellyite, epidote, and actinolite. In this case, the positioning of the ‘CHEPPAQ bathograd’ is based on the intersection of the prehnite-out and pumpellyite-out uni-variant lines, which represents the upper pressure limit for prehnite-bearing assemblages (Figure 14b). The sequence of predicted mineral assemblages is similar to that for modelling in NCMASH, with the addition of a prehnite–actinolite sub-facies (blue field; Figure 14b). The pressure estimate for the ‘CHEPPAQ bathograd’ varies depending upon the choice of ferric iron content between 2.3 and 2.6 kbar (Figure 12b–d), with increased ferric iron resulting in a lower pressure limit. When modelling with an XFe3+ value of 20% (Figures 12d, 14b), prehnite–pumpellyite facies assemblages are predicted to be stable over a P–T range of ~185–280°C and 1–2.3 kbar, with the transition to greenschist facies conditions at slightly higher temperatures, beginning with the appearance of actin-olite at ~290°C and capped by the disappearance of prehnite at ~300°C. As discussed above, rocks of this grade com-monly demonstrate local variations in mineral assemblages that likely reflect small equilibration volumes (smaller than a thin section) (see Section 11) and thus care must be taken when correlating the natural observation to phase diagrams representing single bulk compositions.
12 | METAMORPHIC DEVOLATILIZATION WITHIN METABASITES
Metabasites represent the most abundant metamorphic rocks within greenstone belts and thus represent a significant source of metamorphic fluids that may influence geochemi-cal cycling and the formation of ore deposits in these belts. The fluids released during low- to moderate-grade metamor-phism of basalts within greenstone belts, particularly across the greenschist–amphibolite facies transition zone, have been proposed as the potential fluid source for orogenic gold depo-sition (e.g. Elmer et al., 2006; Goldfarb et al., 2005; Goldfarb & Groves, 2015; Powell et al., 1991; Tomkins, 2010, 2013).
The isograd mapping and textural, modal, and compo-sitional data from the Flin Flon sequence suggest that the transition from prehnite–pumpellyite facies to amphibo-lite facies is characterized by wide zones over which there is little change in the mineral assemblage, mineral modal proportions, or compositions with increasing grade, indicat-ing the absence of progress of continuous reactions within the major facies. Instead, most or all of the change in these metabasites occurs in narrow (~1,000 m), discrete zones of

26 | STARR eT Al.
reaction representing the major facies boundaries, similar to observations from metapelites documented in Pattison, de Capitani, and Gaidies (2011). Correspondingly, it is in these intervals (the prehnite–pumpellyite to greenschist facies and greenschist to amphibolite facies transition zones) where the majority of fluid release occurs.
12.1 | Devolatilization across the greenschist to amphibolite facies transition
The dehydration (i.e. loss of H2O fluid) and devolatilization (i.e. loss of mixed-volatile fluids) across the greenschist to amphibolite facies transition zone is discussed in detail in a companion paper (Starr & Pattison, 2019b). Thus, only an overview is discussed here, with a focus on the comparison between modelling predictions and observations that relate to metamorphic devolatilization. The modal proportions in rocks of the greenschist and lower amphibolite facies allow for the estimation of mineral-bound water contents at dif-ferent grades, which can be used in concert with the ther-modynamic modelling to assess the amount and intervals of dehydration across the transition.
Figure 15 shows pseudosections calculated using DS5 (Figure 15a) and DS6 (Figure 15b), for the average high-Mg basaltic bulk composition, overlain with contours of the calculated bulk-rock mineral-bound H2O content. An aver-age of 3.1 wt% H2O, estimated through combining mineral modes and compositions, for high-Mg basalts within the greenschist facies at Flin Flon and 1.3 wt% H2O for high-Mg basalts within the lower amphibolite facies (hornblende–oli-goclase zone) (Starr & Pattison, 2019b), are similar to the water contents predicted by modelling using the DS5 models (3–3.2 wt% at greenschist facies; 1–1.2 wt% at amphibolite facies), suggesting that the modelling is broadly successful at reproducing the natural observations. A more detailed comparison of the fluid release across the transition zone, however, reveals some differences between the natural ob-servations and the model predictions. The modelling predicts progressive dehydration over a ~50°C interval at moderate pressures beginning with the first appearance of hornblende and continuing until the final breakdown of chlorite (Figures 15a and 13g). By contrast, observations from the Flin Flon sequence suggest that the majority of mineralogical change and dehydration begins only after the first appearance of oli-goclase, and occurs over a very narrow interval within the actinolite–hornblende–oligoclase zone, associated with the loss of >75% of the total chlorite content (Figure 6d). The result would have been a large pulse of fluid release over a small spatial and P–T window. A detailed assessment of the carbonate and sulphide mineralogy in the Flin Flon sequence, and comparison with the results of T–XCO2 modelling, sug-gests that the fluids generated across the GS-AM transition at
Flin Flon were unlikely to have suitable compositions to be a source fluid for orogenic gold deposit formation (Starr & Pattison, 2019b).
The mineral-bound water contents for greenschist and amphibolite facies rocks and the total amount of dehydration predicted using the DS6 models (Figure 15b) are immate-rially different from those produced using DS5. However, using DS6, the fluid release happens over a narrower interval of P–T space (Figures 15b, 13h) as a result of a displacement of the chlorite-out line to lower temperatures. In addition, the albite to oligoclase transition plays no role in the dehy-dration reaction as a result of the displacement of the oligo-clase-in reaction to higher temperatures, which is in contrast to natural observations.
12.2 | Devolatilization across the prehnite–pumpellyite to greenschist facies transition
Metamorphic devolatilization across the prehnite–pumpelly-ite to greenschist facies transition has generally received little attention, in part because of the difficulty in mapping such sequences due to mineral assemblage heterogeneity both at the thin section and outcrop scale. In addition, the limita-tions in thermodynamic modelling discussed previously have also restricted the capability to model such devolatilization. However, given the potential for minerals such as pumpel-lyite and prehnite to contain significant amounts of mineral-bound water, dehydration across the transition is likely to be significant.
In contrast to rocks of the greenschist and amphibolite fa-cies, it was not possible to accurately estimate the changes in mineral modal proportions across the PP-GS facies transition in Flin Flon. Mineral modal proportions are highly variable in the natural rocks, implying local bulk compositional do-mains considerably smaller than the size of a thin section. Thus, establishing parts of the rock or thin section that repre-sented an equilibrium assemblage for a typical bulk composi-tion proved to be impossible.
Despite this, the mapping and petrographic observations, combined with modelling predictions, can still be used to put some bounds on the degree of dehydration across this tran-sition. Figure 15c,d show two phase diagrams, calculated in NCMASH using DS5 (Figure 15c) and in NCKFMASHTO using DS6 (Figure 15d), for the high-Mg basaltic bulk com-position. The two phase diagrams are overlain with predicted mineral-bound H2O contents (in wt% H2O). In the case of the NCMASH phase diagram calculated using DS5 (Figure 15c), reaction progress and dehydration are predicted to occur at univariant lines, with the majority of dehydration occurring on the actinolite-in line that represents entry into the green-schist facies (1.6–2.0 wt% total H2O release). However, comparison with the mineral modes and calculated H2O

| 27STARR eT Al.
contents of samples within the greenschist facies from Flin Flon suggests that the modelling in NCMASH significantly underpredicts the amount of chlorite and thus the amounts of mineral-bound H2O at this grade.
Figure 15d shows the estimated fluid loss across the PP-GS transition, modelled in NCKFMASHTO, using DS6. Going from prehnite–pumpellyite facies (4.2–4.4 wt% min-eral-bound H2O) to greenschist facies (3.0–3.2 wt% min-eral-bound H2O), the estimated fluid loss is ~1.0–1.4 wt%. The majority of this fluid loss is associated with the break-down of prehnite and appearance of actinolite in the preh-nite–actinolite subfacies (Figure 15d). At higher pressures
(above the ‘CHEPPAQ bathograd’), dehydration across the pumpellyite–actinolite to greenschist facies transi-tion occurs after the appearance of epidote and breakdown of pumpellyite within a field containing the assemblage Act–Chl–Pmp–Ep–Ab–Bt–Ttn–Qtz–H2O.
The observations from Flin Flon, combined with model-ling insights, suggest that the dehydration across the PP-GS transition occurs over a very narrow P–T window, resulting from the appearance of actinolite and the breakdown of preh-nite and pumpellyite. While the modelling predicts dehydra-tion occurring over a ~10°C interval, observations from the field suggest the interval may be even smaller given the rarity
F I G U R E 1 5 (a, b) Pseudosections calculated at GS-AM transition zone conditions using DS5 in NCKFMASHTO (a), and using DS6 in NCKFMASHTO (b). (c, d) Pseudosections calculated for PP–GS transition zone conditions using DS5 in NCMASH (c) and using DS6 in NCKFMASHTO (d). These diagrams are overlain with contours of the calculated bulk-rock mineral-bound H2O content (wt% H2O)
Act Chl EpAb Bt Ttn3–3.2%
H2O
Hbl Act Chl EpAb Bt Ttn
Hbl ChlEp AbBt Ttn
+Hbl
-Act
-Ep
+Pl
-Chl
-Ep+Pl
HblEp AbBt Ttn
Hbl PlAb Bt Ttn
Hbl Chl PlAb Bt Ttn
Hbl Act PlBt Ilm
+Ilm
-Ab
-Ab
-Act
-Act
-Chl
-Ab
-Chl
-Ttn
-Chl
Hbl PlBt Ilm1–1.2%
H2OHbl Pl Ab
Bt Ilm
3%
3%
2.8%
2.6%
2.4%
2.4%
2.2% 1.4%
1.4%
1.6%
1.8%
2.4%
2.0%
1.6%1.8%
1.2%1.2%
1.4%
1.6%
1.6%
1.8%2.0%
(a)NCKFMASHTO
DS5 - 16.9% XFe3++Qtz+H2O
(b)NCKFMASHTODS6 - 16.9% Fe3+
+Qtz+H2O
Hbl Chl Ep Ab Bt Ttn
Act+
Hbl
Hbl ChlEp PlBt Ttn
Hbl Chl EpBt Ilm
+Ilm
Hbl PlBt Ilm1–1.2%
H2O
Hbl Act PlBt IlmHbl Chl
PlBt Ttn
-Ttn
-Ep
-Ab
+Hbl
-Act
-Ttn
-Ep
-Ilm+Rt
-Chl
-Chl
+Mag+Pl+H
bl
-Act
Act Chl Ep Ab Bt Ttn
3–3.2% H2O
-Ttn
3%2.8%
2.6%
2.4%
2.2%
1.4%
2%
1.8%
1.4%
1.2%
1.2%
1.0%0.8%
3%
2.8%1.8%
1.6%
1.4%
2%2.2%2.4%2.6%
1.6%
1.2%
1.4%
1.8%
1.6%
(d)NCKFMASHTODS6 - 20% XFe3+
+Bt+Ttn+Qtz+H2O
+Act
-Prh
-Stb -Pmp
+Heu
-Pmp
+Ep
-Heu
-Pm
p
-Prh
3.2%
3.4%
3.6%
4.4%
4.2%
4%3.8%
Act ChlPmp Ab
4.4–4.6%H2O Act Chl
Ep Ab3.0–3.2%
H2O
4.4%
4.4%
4.2%3.2%3.4%
4.0%
3.6%
3.8%
Chl PrhEp Ab
4.2–4.4%H2O
Chl PrhPmp Ab
4.2–4.4%H2O
+Ep
+Act
Act ChlCzo Ab
1.6–1.8%H2O
Act ChlPrh Ep
Ab
Act ChlPmp Ep
Ab
200 250 300 3501
2
3
4
5(c)
NCMASHDS5
+Qtz+H2O
CHEPPAQInvariant
Pres
sure
(kba
r)
200 250 300 350
-Prh+A
ct
+Czo
-Pm
p
Chl PrhCzo Ab3–3.2%
H2O
Chl PrhPmp Ab
3.4–3.6%H2O
Act ChlPmp Ab
3.4–3.6%H2O
Act ChlPmp Ab
Stb[-Qtz]
Act ChlPmp Ab
-Pmp
+Czo
-Prh+Act
-Stb+Q
tz+Pmp
+Heu
-Czo
+Pg
-Pmp
+Law
1.8–3%
3.2–3.4
1.8–3.4%
3.4–4.6%3.4–4.6%
3.2%
Pres
sure
(kba
r)
1
2
3
4
5
6
7
8
1
2
3
4
5
1
2
3
4
5
6
7
8
400 450 500 550400 450 500 550

28 | STARR eT Al.
of transitional assemblages. In contrast to modelling results, observations from Flin Flon suggest that dehydration occurs as a result of the breakdown of both prehnite and pumpelly-ite, rather than just prehnite.
Several other observations from the Flin Flon sequence are significant for interpreting the devolatilization across this interval. The first is that, while hard to quantify, there appears to be an apparent decrease in the carbonate modes between the prehnite–pumpellyite facies, where carbonate minerals are common, to the greenschist facies where they are noticeably less abundant. The large number of samples examined suggests that this observation reflects an actual decrease in the proportions of carbonate during the evo-lution across the PP-GS transition, rather than an artefact of heterogeneous seafloor carbonation. Such a breakdown of carbonate, if indeed coincident with the H2O release, may result in the production of relatively carbonated fluids. Such fluids may be significant, as the source fluids for oro-genic gold formation are generally interpreted to have ele-vated XCO2 compositions based on fluid inclusion data and the common appearance of carbonates within gold-host-ing vein systems (e.g. Groves, Goldfarb, Gebre-Mariam, Hagemann, & Robert, 1998; Kerrich & Fyfe, 1981). In ad-dition, the loss of carbonate at these grades may restrict the potential for the release of more carbonated fluids at higher grades (Starr & Pattison, 2019b).
A second important observation is the decrease in the remnant igneous mineralogy across the PP-GS transition zone. As this igneous mineralogy (mostly clinopyroxene and plagioclase) is predominantly anhydrous, this conver-sion to metamorphic mineralogy (e.g. amphibole, epidote, chlorite) requires hydration. This suggests that at least some of the fluid release across this transition zone is consumed in the replacement and hydration of this igneous mineral-ogy. This fluid is likely important in creating the transition from commonly mixed igneous-metamorphic assemblages in small-scale domainal equilibrium at prehnite–pumpel-lyite facies to predominantly equilibrated metamorphic assemblages within the lower greenschist facies. As a re-sult, it is unclear what proportion of the fluid released from devolatilization reactions across this transition is lost from the rock package.
13 | CONCLUSIONS
1. The metamorphic grade in the Flin Flon area (Manitoba/Saskatchewan, Canada) ranges from prehnite–pumpellyite to lower amphibolite facies and comprises five regional metamorphic isograds: actinolite-in, prehnite- and pumpel-lyite-out, hornblende-in, oligoclase-in, and actinolite-out.
2. Across the greenschist–amphibolite facies transition, there are significant increases in the modal amounts of
hornblende and oligoclase coincident with decreases in the modal amounts of actinolite, albite, chlorite, and ti-tanite, but little change in the modal amount of epidote. The transition is characterized first by the appearance of hornblende within the hornblende–actinolite zone, and then by the appearance of oligoclase within the hornblende–actinolite–oligoclase zone, with the major-ity of reaction progress (marked increase in hornblende and oligoclase, and decrease in chlorite) occurring only after the appearance of oligoclase. Thermodynamic modelling using data set 5 (DS5) of Holland and Powell (1998) and associated a–x models is broadly successful in reproducing the sequence of isograds observed over the greenschist–amphibolite facies transition zone at Flin Flon. By contrast, modelling using the data set 6 (DS6) of Holland and Powell (2011) with appropriate a–x models predicts mineral assemblages and mineral compositions that are inconsistent with the natural pat-terns observed at Flin Flon and other similar sequences. This comparison with the natural data set suggests that some modifications to the DS6 plagioclase and amphi-bole a-x models are likely required in order to more accurately model mafic rocks at greenschist and amphi-bolite facies conditions.
3. Modelling of the prehnite–pumpellyite to greenschist fa-cies transition zone, using either data set 5 (DS5) or data set 6 (DS6), with the appropriate a–x models, predicts the existence of a number of mineral subfacies associ-ated with this transition including prehnite–pumpellyite, pumpellyite–actinolite, prehnite–epidote, and prehnite–actinolite subfacies. By contrast, observations from Flin Flon and a similar sequence in Rossland, British Columbia, suggest no evidence for passage through either a prehnite–epidote or prehnite–actinolite subfa-cies. Rather, the PP-GS transition occurs over a narrow (<1,000 m) transition zone with the majority of sam-ples typified by mineral assemblages characteristic of either the prehnite–pumpellyite facies or the greenschist facies.
4. In agreement with previous studies, two main pressure-sensitive facies series across the greenschist–amphibo-lite facies transition zone are predicted on the basis of natural isograd patterns and thermodynamic modelling, with a third pressure series theoretically predicted based on modelling results. The lowest pressure metamorphic facies series (‘actinolite–oligoclase type’) is character-ized by the appearance of oligoclase before hornblende and is constrained to pressures below a Hbl-Ab batho-grad at ~3.3 kbar (exact pressure dependent upon the ferric iron content). A moderate pressure facies series (‘hornblende–albite type’) is characterized by the ap-pearance of hornblende before oligoclase and occurs above the Hbl-Ab bathograd at ~3.3 kbar. A possible

| 29STARR eT Al.
higher pressure facies series (‘actinolite–hornblende type’) is also characterized by the appearance of oligo-clase before hornblende, but actinolite is predicted to be consumed before oligoclase develops. These higher pressure sequences are predicted to occur above an ‘ac-tinolite–hornblende’ (Act-Hbl) bathograd at ~4.4 kbar, but may be rare in nature because of the metastable per-sistence of actinolite to higher grades.
5. Within the PP-GS facies transition, a bathograd (‘CHEPPAQ bathograd’) separating prehnite–pumpel-lyite-bearing assemblages at low pressures from pumpellyite–actinolite-bearing assemblages at higher pressures is implied by the natural observations and pre-dicted from modelling. When modelling in NCMASH, using DS5, the CHEPPAQ bathograd is constrained to be ~3.2 kbar and 300°C. When the chemical system is expanded to NCKFMASHTO, using DS6, the pressure estimate for the CHEPPAQ bathograd varies between 2.3 and 2.6 kbar, depending upon the choice of ferric iron.
6. Natural observations from Flin Flon and predictions from thermodynamic modelling suggest that the GS-AM transition zone is the site of significant metamorphic de-volatilization. Observations from Flin Flon suggest de-volatilization (average loss of ~1.8 wt% mineral-bound H2O from the whole-rock composition) occurs over a very narrow interval within the actinolite–hornblende–oligoclase zone, associated with the loss of >75% of the total chlorite content. This is in contrast to the predictions from thermodynamic modelling, which suggest progres-sive dehydration of ~2wt% H2O over a >50°C interval at moderate pressures, beginning with the first appearance of hornblende and continuing until the final breakdown of chlorite.
7. The PP-GS transition is also associated with fluid release from the breakdown of the hydrous minerals, prehnite and pumpellyite. The rarity of transitional assemblages at Flin Flon suggests that the devolatilization interval is very narrow and occurs as a result of the breakdown of both prehnite and pumpellyite. The modelling predicts fluid loss of ~1.0–1.4 wt% H2O over a ~10°C interval, associ-ated with the breakdown of prehnite and appearance of ac-tinolite in the prehnite–actinolite subfacies. Observations from Flin Flon suggest the fluid released may not be entirely lost from the rock package as there is extensive replacement and hydration of igneous mineralogy coinci-dent with the transition to greenschist facies assemblages.
ACKNOWLEDGEMENTSWe acknowledge R. Marr for assistance with using the elec-tron microprobe and C. Debuhr for support with the scanning electron microscope. We thank E.D. Ghent for helpful dis-cussion and S.G. Digel and E.D. Ghent for allowing us access
to their samples from Flin Flon. We also thank Johann Diener and an anonymous reviewer for their detailed and insightful reviews and Richard White for handling the manuscript. This research was supported by NSERC Discovery Grant 037233 to Pattison.
ORCIDPaul G. Starr https://orcid.org/0000-0003-1710-6429 David R. M. Pattison https://orcid.org/0000-0001-5817-6373
REFERENCESAmes, D. E., Galley, A. G., Kjarsgaard, I. M., Tardif, N., & Taylor,
B. T. (2016). Hanging-wall vectoring for buried volcanogenic mas-sive sulfide deposits, Paleoproterozoic Flin Flon Mining Camp, Manitoba, Canada. Economic Geology, 111(4), 963–1000. https ://doi.org/10.2113/econg eo.111.4.963
Ansdell, K. M. (2005). Tectonic evolution of the Manitoba-Saskatchewan segment of the Paleoproterozoic Trans-Hudson Orogen, Canada. Canadian Journal of Earth Sciences, 42(4), 741–759. https ://doi.org/10.1139/e05-035
Archibald, N. J., Bettenay, L. F., Binns, R. A., Groves, D. I., & Gunthorpe, R. J. (1978). The evolution of Archaean greenstone terrains, Eastern Goldfields Province, Western Australia. Precambrian Research, 6(2), 103–131. https ://doi.org/10.1016/0301-9268(78)90008-6
Bailes, A. H., & Syme, E. C. (1989). Geology of the Flin Flon-White Lake area. Manitoba Energy and Mines Geological Services, Geological Report, 87(1), 313.
Bégin, N. J. (1992). Contrasting mineral isograd sequences in metaba-sites of the Cape Smith Belt, northern Québec, Canada: Three new bathograds for mafic rocks. Journal of Metamorphic Geology, 10(5), 685–704. https ://doi.org/10.1111/j.1525-1314.1992.tb001 15.x
Bégin, N. J., & Carmichael, D. M. (1992). Textural and compositional relationships of ca-amphiboles in metabasites of the cape smith belt, Northern Québec: Implications for a miscibility gap at medium pressure. Journal of Petrology, 33(6), 1317–1343.
Bishop, D. G. (1972). Progressive metamorphism from prehnite-pum-pellyite to greenschist facies in the dansey pass area, Otago, New zealand. Bulletin of the Geological Society of America, 83(11), 3177–3198. https ://doi.org/10.1130/0016-7606(1972)83[3177:PM-FPT G]2.0.CO;2
Boyle, A. P. (1986). Metamorphism of basic and pelitic rocks at Sulitjelma, Norway. Lithos, 19(2), 113–128. https ://doi.org/10.1016/0024-4937(86)90003-4
Brady, J. B. (1974). Coexisting actinolite and hornblende from west-cen-tral New Hampshire. American Mineralogist, 59, 529–535.
Carmichael, D. M. (1978). Metamorphic bathozones and bathograds: A measure of the depth of post-metamorphic uplift and erosion on the regional scale. American Journal of Science, 278, 769–797. https ://doi.org/10.2475/ajs.278.6.769
Carmichael, D. M. (1991). Univariant mixed-volatile reactions: Pressure-temperature phase diagrams and reaction isograds. Canadian Mineralogist, 29, 741–754.
Cho, M., & Liou, J. G. (1987). Prehnite-pumpellyite to greenschist facies transition in the Karmutsen metabasites, Vancouver Island, B.C. Journal of Petrology, 28(3), 417–443.
Coggon, R., & Holland, T. J. B. (2002). Mixing properties of phen-gitic micas and revised garnet-phengite thermobarometers.

30 | STARR eT Al.
Journal of Metamorphic Geology, 20(7), 683–696. https ://doi.org/10.1046/j.1525-1314.2002.00395.x
Cooper, A. F. (1972). Progressive metamorphism of metabasic rocks from the Haast Schist Group of Southern New Zealand. Journal of Petrology, 13(3), 457–492. https ://doi.org/10.1093/petro logy/13.3.457
Cooper, A. F., & Lovering, J. F. (1970). Greenschist amphiboles from Haast river, New Zealand. Contributions to Mineralogy and Petrology, 27(1), 11–24. https ://doi.org/10.1007/BF005 39538
Dale, J., Powell, R., White, R. W., Elmer, F. L., & Holland, T. J. B. (2005). A thermodynamic model for Ca–Na clinoamphiboles in Na O-CaO–FeO–MgO–Al O–SiO–H O–O for petrological calcula-tions. Journal of Metamorphic Geology, 23(8), 771–791.
Day, H. W., & Springer, R. K. (2005). The first appearance of actin-olite in the prehnite-pumpellyite facies, Sierra Nevada, California. Canadian Mineralogist, 43(1), 89–104. https ://doi.org/10.2113/gscan min.43.1.89
de Capitani, C., & Brown, T. H. (1987). The computation of chemi-cal equilibrium in complex systems containing non-ideal solutions. Geochimica et Cosmochimica Acta, 51(10), 2639–2652. https ://doi.org/10.1016/0016-7037(87)90145-1
de Capitani, C., & Petrakakis, K. (2010). The computation of equi-librium assemblage diagrams with Theriak/Domino software. American Mineralogist, 95(7), 1006–1016. https ://doi.org/10.2138/am.2010.3354
Devine, C. A., Gibson, H. L., Bailes, A. H., Maclachlan, K., Gilmore, K., & Galley, A. G. (2002). Stratigraphy of volcanogenic mas-sive sulphide-hosting volcanic and volcaniclastic rocks of the Flin Flon Formation, Flin Flon (NTS 63K12 and 13), Manitoba and Saskatchewan. Manitoba Geological Society, GS-1, 9–19.
DeWolfe, Y. M., Gibson, H. L., & Piercey, S. J. (2009). Petrogenesis of the 1.9 Ga mafic hanging wall sequence to the Flin Flon, Callinan, and Triple 7 massive sulphide deposits, Flin Flon, Manitoba, Canada. Canadian Journal of Earth Sciences, 46(7), 509–527.
Diener, J. F. A., & Powell, R. (2010). Influence of ferric iron on the stability of mineral assemblages. Journal of Metamorphic Geology, 28(6), 599–613. https ://doi.org/10.1111/j.1525-1314.2010.00880.x
Diener, J. F. A., & Powell, R. (2012). Revised activity-composition models for clinopyroxene and amphibole. Journal of Metamorphic Geology, 30(2), 131–142. https ://doi.org/10.1111/j.1525-1314.2011.00959.x
Diener, J. F. A., Powell, R., White, R. W., & Holland, T. J. B. (2007). A new thermodynamic model for clino- and orthoamphiboles in the system Na2O-CaO-FeO-MgO-Al2O3-SiO2-H2O-O. Journal of Metamorphic Geology, 25(6), 631–656.
Digel, S., & Ghent, E. D. (1994). Fluid-mineral equilibria in preh-nite-pumpellyite to greenschist facies metabasites near Flin Flon, Manitoba, Canada: Implications for petrogenetic grids. Journal of Metamorphic Geology, 12(4), 467–477. https ://doi.org/10.1111/j.1525-1314.1994.tb000 36.x
Digel, S. G., & Gordon, T. M. (1995). Phase relations in metabasites and pressure-temperature conditions at the prehnite-pumpellyite to greenschist facies transition, Flin Flon, Manitoba Canada. In P. Schiffman& H. W. Day (Eds.), Low-grade metamorphism of mafic rocks (Vol: 296, pp. 67–80).Boulder, CO: Geological Society of America.
Elmer, F. L., White, R. W., & Powell, R. (2006). Devolatilization of metabasic rocks during greenschist-amphibolite facies metamor-phism. Journal of Metamorphic Geology, 24(6), 497–513. https ://doi.org/10.1111/j.1525-1314.2006.00650.x
Forshaw, J. B., Waters, D. J., Pattison, D. R. M., Palin, R. M., & Gopon, P. (2019). A comparison of observed and thermodynamically pre-dicted phase equilibria and mineral compositions in mafic granu-lites. Journal of Metamorphic Geology, 37, 153–179. https ://doi.org/10.1111/jmg.12454
Frey, M., DE Capitani, C., & Liou, J. G. (1991). A new petrogenetic grid for low-grade metabasites. Journal of Metamorphic Geology, 9(4), 497–509. https ://doi.org/10.1111/j.1525-1314.1991.tb005 42.x
Furnes, H., Dilek, Y., & De Wit, M. (2015). Precambrian greenstone sequences represent different ophiolite types. Gondwana Research, 27, 649–685. https ://doi.org/10.1016/j.gr.2013.06.004
Gale, D., Lucas, S., & Dixon, J. (1999). Structural relations between the polydeformed Flin Flon arc assemblage and Missi Group sedimen-tary rocks, Flin Flon area, Manitoba and Saskatchewan. Canadian Journal of Earth Sciences, 36, 1901–1915. https ://doi.org/10.1139/e99-099
Goldfarb, R. J., Baker, T., Dube, B., Groves, D. I., Hart, J. R., & Gosselin, P. (2005). Distribution, character, and genesis of gold deposits in metamorphic terranes. Economic Geology 100th Anniversary Volume, 407–450.
Goldfarb, R. J., & Groves, D. I. (2015). Orogenic gold: Common or evolving fluid and metal sources through time. Lithos, 233, 2–26. https ://doi.org/10.1016/j.lithos.2015.07.011
Graham, C. M. (1974). Metabasite amphiboles of the Scottish Dalradian. Contributions to Mineralogy and Petrology, 47(3), 165–185. https ://doi.org/10.1007/BF003 71537
Green, E., Holland, T., & Powell, R. (2007). An order-disorder model for omphacitic pyroxenes in the system jadeite-diopside-hedenbergite-ac-mite, with applications to eclogitic rocks. American Mineralogist, 92(7), 1181–1189. https ://doi.org/10.2138/am.2007.2401
Green, E. C. R., White, R. W., Diener, J. F. A., Powell, R., Holland, T. J. B., & Palin, R. M. (2016). Activity–composition relations for the calculation of partial melting equilibria in metabasic rocks. Journal of Metamorphic Geology, 34(9), 845–869. https ://doi.org/10.1111/jmg.12211
Groves, D. I., Goldfarb, R. J., Gebre-Mariam, M., Hagemann, S. G., & Robert, F. (1998). Orogenic gold deposits: A proposed classification in the context of their crustal distribution and relationship to other gold deposit types. Ore Geology Reviews, 13(1–5), 7–27. https ://doi.org/10.1016/S0169-1368(97)00012-7
Hawthorne, F. C., Oberti, R., Harlow, G. E., Maresch, W. V., Martin, R. F., Schumacher, J. C., & Welch, M. D. (2012). IMA report: Nomenclature of the amphibole supergroup. American Mineralogist, 97(11–12), 2031–2048. https ://doi.org/10.2138/am.2012.4276
Hoffman, P. F. (1988). United plates of America, the Birth of a Craton: Early proterozoic assembly of Laurentia. Annual Review of Earth and Planetary Sciences, 16, 543–603.
Holland, T. J. B., Baker, J. M., & Powell, R. (1998). Mixing proper-ties and activity-composition relationships of chlorites in the system MgO-FeO-Al2O3-SiO2-H2O. European Journal of Mineralogy, 10, 395–406. https ://doi.org/10.1127/ejm/10/3/0395
Holland, T. J. B., & Powell, R. (1998). An internally consistent thermodynamic data set for phases of petrological interest. Journal of Metamorphic Geology, 16(3), 309–343. https ://doi.org/10.1111/j.1525-1314.1998.00140.x
Holland, T. J. B., & Powell, R. (2003). Activity-composition relations for phases in petrological calculations: An asymetric multicom-ponent formulation. Contributions to Mineralogy and Petrology, 145(4), 492–501.

| 31STARR eT Al.
Holland, T. J. B., & Powell, R. (2011). An improved and extended internally consistent thermodynamic dataset for phases of pe-trological interest, involving a new equation of state for solids. Journal of Metamorphic Geology, 29(3), 333–383. https ://doi.org/10.1111/j.1525-1314.2010.00923.x
Katada, M. (1965). Petrography of Ryoke Metamorphic Rocks in Northern Kiso District, Central Japan. Journal of the Japanese Association of Mineralogists, Petrologists and Economic Geologists, 53(5), 187–204.
Kerrich, R., & Fyfe, W. S. (1981). The gold-carbonate associa-tion: Source of CO2, and CO2 fixation reactions in Archaean lode deposits. Chemical Geology, 33, 265–294. https ://doi.org/10.1016/0009-2541(81)90104-2
Kremer, P. D., & Simard, R. L. (2007). Geology of the hook lake block, Flin Flon area, Manitoba (part of NTS 63 K/12). Report of Activities 2007, Manitoba Science, Technology, Energy and Mines, Manitoba Geological Survey. pp. 21–32.
Kretz, R. (1983). Symbols for rock-forming minerals. American Mineralogist, 68, 277–279.
Kuniyoshi, S., & Liou, J. (1976). Contact metamorphism of the Karmutsen Volcanics, Vancouver Island, British Columbia. Journal of Petrology, 17, 73–99. https ://doi.org/10.1093/petro logy/17.1.73
Lafrance, B., Gibson, H. L., Pehrsson, S., Schetselaar, E., DeWolfe, Y. M., & Lewis, D. (2016). Structural reconstruction of the Flin Flon volcanogenic massive sulfide mining district, Saskatchewan and Manitoba, Canada. Economic Geology, 111(4), 849–875. https ://doi.org/10.2113/econg eo.111.4.849
Leake, B. E., Woolley, A. R., Arps, C. E. S., Birch, W. D., Gilbert, M. C., Grice, J. D., … Youzhi, G. (1997). Nomenclature of amphiboles; Report of the subcommittee on amphiboles of the international min-eralogical association commission on new minerals and mineral names. European Journal of Mineralogy, 9(3), 623–651.
Liou, J. G., Kim, H. S., & Maruyama, S. (1983). Prehnite-epidote equi-libria and their petrologic applications. Journal of Petrology, 24(4), 321–342. https ://doi.org/10.1093/petro logy/24.4.321
Liou, J. G., Kuniyoshi, S., & Ito, K. (1974). Experimental studies of the phase relations between greenschist and amphibolite in a basal-tic system. American Journal of Science, 274, 613–632. https ://doi.org/10.2475/ajs.274.6.613
Liou, J. G., Maruyama, S., & Cho, M. (1985). Phase equilibria and mineral parageneses of metabasites in low-grade metamorphism. Mineralogical Magazine, 49(352), 321–333.
Lo Pò, D., & Braga, R. (2014). Influence of ferric iron on phase equilib-ria in greenschist facies assemblages: The hematite-rich metasedi-mentary rocks from the Monti Pisani (Northern Apennines). Journal of Metamorphic Geology, 32(4), 371–387. https ://doi.org/10.1111/jmg.12076
Lucas, S. B., Stern, R. A., Syme, E. C., Reilly, B. A., & Thomas, D. J. (1996). Intraoceanic tectonics and the development of continen-tal crust: 1.92-1.84 Ga evolution of the Flin Flon Belt, Canada. Geological Society of America Bulletin, 108(5), 602–629. https ://doi.org/10.1130/0016-7606(1996)108<0602:ITATD O>2.3.CO;2
Maruyama, S., Suzuki, K., & Liou, J. G. (1983). Greenschist-amphibolite transition equilibria at low pressures. Journal of Petrology, 24(4), 583–604. https ://doi.org/10.1093/petro logy/24.4.583
Miyashiro, A. (1961). Evolution of metamorphic belts. Journal of Petrology, 2(3), 277–311. https ://doi.org/10.1093/petro logy/2.3.277
Pattison, D. R. M. (2001). Instability of Al2SiO5 “triple-point” assem-blages in muscovite+biotite+quartz-bearing metapelites, with im-plications. American Mineralogist, 86, 1414–1422.
Pattison, D. R. M., de Capitani, C., & Gaidies, F. (2011). Petrological consequences of variations in metamorphic reaction affinity. Journal of Metamorphic Geology, 29(9), 953–977. https ://doi.org/10.1111/j.1525-1314.2011.00950.x
Pattison, D. R. M., & Tracy, R. J. (1991). Phase equilibria and thermoba-rometry of metapelites. Reviews in Mineralogy and Geochemistry, 26(1), 105–206.
Pattison, D. R. M., & Vogl, J. J. (2005). Contrasting sequences of metapelitic mineral-assemblages in the aureole of the tilted Nelson Batholith, British Columbia: Implications for phase equilibria and pressure determination in andalusite-sillimanite-type settings. The Canadian Mineralogist, 43, 51–88. https ://doi.org/10.2113/gscan min.43.1.51
Powell, R., Will, T. M., & Phillips, G. N. (1991). Metamorphism in Archaean greenstone belts: Calculated fluid compositions and im-plications for gold mineralization. Journal of Metamorphic Geology, 9(2), 141–150. https ://doi.org/10.1111/j.1525-1314.1991.tb005 10.x
Powell, W. G., Carmichael, D. M., & Hodgson, C. J. (1993). Thermobarometry in a subgreenschist to greenschist transition in metabasites of the Abitibi greenstone belt, Superior Province, Canada. Journal of Metamorphic Geology, 11(1), 165–178. https ://doi.org/10.1111/j.1525-1314.1993.tb001 38.x
Powell, W. G., Carmichael, D. M., & Hodgson, C. J. (1995). Conditions and timing of metamorphism in the southern Abitibi greenstone belt, Quebec. Canadian Journal of Earth Sciences, 32, 787–805. https ://doi.org/10.1139/e95-067
Rebay, G., Powell, R., & Diener, J. F. A. (2010). Calculated phase equilibria for a MORB composition in a P-T range, 450–650°C and 18–28 kbar: The stability of eclogite. Journal of Metamorphic Geology, 28(6), 635–645.
Schilling, J. G., Zajac, M., Evans, R., Johnston, T., White, W., Devine, J. D., & Kingsley, R. (1983). Petrologic and geochemical variations along the Mid-Atlantic Ridge from 29°N to 73°N. American Journal of Science, 283, 510–586.
Schumacher, J. C. (1997). Appendix 2: The estimation of ferric iron in electron microprobe analysis of amphiboles. Mineralogical Magazine, 61(405), 312–321.
Schumacher, J. C. (2007). Metamorphic amphiboles: Composition and coexistence. Reviews in Mineralogy and Geochemistry, 67(1), 359–416. https ://doi.org/10.2138/rmg.2007.67.10
Simard, R. L., MacLachlan, K., Gibson, H. L., DeWolfe, Y. M., Devine, C., Kremer, P. D., … Galley, A. G. (2010). Geology of the Flin Flon area, Manitoba and Saskatchewan (part of NTS 63K12, 13). Manitoba Innovation, Energy and Mines, Manitoba Geological Survey, Geoscientific Map MAP 2010–1.
Spear, F. S., & Cheney, J. T. (1989). A petrogenetic grid for pelitic schists in the system SiO2-Al2O3-FeO-MgO-K2O–H2O. Contributions to Mineralogy & Petrology, 101, 149–164. https ://doi.org/10.1007/BF003 75302
Springer, R. K., Day, H. W., & Beiersdorfer, R. E. (1992). Prehnite–pumpellyite to greenschist facies transition, Smartville Complex, near Auburn, California. Journal of Metamorphic Geology, 10(2), 147–170. https ://doi.org/10.1111/j.1525-1314.1992.tb000 76.x
Starr, P. G., & Pattison, D. R. M. (2019a). Equilibrium and disequilib-rium processes across the greenschist – Amphibolite transition zone in metabasites. Contributions to Mineralogy and Petrology, 174(2), 1–18. https ://doi.org/10.1007/s00410-019-1553-y
Starr, P. G., & Pattison, D. R. M. (2019b). Metamorphic devolatilization of basalts across the greenschist-amphibolite facies transition zone: Insights from isograd mapping, petrography and thermodynamic
32 | STARR eT Al.
modelling. Lithos, 342–343, 295–314. https ://doi.org/10.1016/j.lithos.2019.05.020
Stauffer, M. R. (1984). Manikewan: An early proterozoic ocean in cen-tral Canada, its igneous history and orogenic closure. Precambrian Research, 25(1–3), 257–281. https ://doi.org/10.1016/0301-9268(84) 90036-6
Syme, E. C., Lucas, S. B., Bailes, A. H., & Stern, R. A. (1999). Contrasting arc and MORB-like assemblages in the Paleoproterozoic Flin Flon Belt, Manitoba, and the role of intra-arc extension in localizing vol-canic-hosted massive sulphide deposits. Canadian Journal of Earth Sciences, 36(11), 1767–1788. https ://doi.org/10.1139/e98-084
Terabayashi, M. (1993). Compositional evolution in Ca-amphibole in the Karmutsen metabasites, Vancouver Island, British Columbia, Canada. Journal of Metamorphic Geology, 11(5), 677–690. https ://doi.org/10.1111/j.1525-1314.1993.tb001 80.x
Todd, C. S., & Engi, M. (1997). Metamorphic field gradients in the Central Alps. Journal of Metamorphic Geology, 15, 513–530. https ://doi.org/10.1111/j.1525-1314.1997.00038.x
Tomkins, A. G. (2010). Windows of metamorphic sulfur liberation in the crust : Implications for gold deposit genesis. Geochimica et Cosmochimica Acta, 74(11), 3246–3259.
Tomkins, A. G. (2013). On the source of orogenic gold. Geology, 41(12), 1255–1256. https ://doi.org/10.1130/focus 122013.1
White, R. W., Pomroy, N. E., & Powell, R. (2005). An in situ meta-texite-diatexite transition in upper amphibolite facies rocks from Broken Hill, Australia. Journal of Metamorphic Geology, 23(7), 579–602. https ://doi.org/10.1111/j.1525-1314.2005.00597.x
White, R. W., Powell, R., & Clarke, G. L. (2002). The interpretation of reaction textures in Fe-rich metapelitic granulites of the Musgrave Block, Central Australia: Constraints from mineral equilibria calcu-lations in the system. Journal of Metamorphic Geology, 20(1), 41–55.
White, R. W., Powell, R., & Holland, T. J. B. (2007). Progress relat-ing to calculation of partial melting equilibria for metapelites. Journal of Metamorphic Geology, 25(5), 511–527. https ://doi.org/10.1111/j.1525-1314.2007.00711.x
White, R. W., Powell, R., Holland, T. J. B., Johnson, T. E., & Green, E. C. R. (2014). New mineral activity-composition relations for thermody-namic calculations in metapelitic systems. Journal of Metamorphic Geology, 32, 261–286. https ://doi.org/10.1111/jmg.12071
White, R. W., Powell, R., Holland, T. J. B., & Worley, B. (2000). The effect of TiO2 and Fe2O3 on metapelitic assemblages at green-schist and amphibolite facies conditions: Mineral equilibria
calculations in the system K2O-FeO-MgO-Al2O3-SiO2-H2O-TiO2-Fe2O3. Journal of Metamorphic Geology, 18, 497–511. https ://doi.org/10.1046/j.1525-1314.2000.00269.x
Zane, A., & Weiss, Z. (1998). A procedure for classifying rock-forming chlorites based on microprobe data. Rendiconti Lincei, 9, 51–56.
SUPPORTING INFORMATIONAdditional supporting information may be found online in the Supporting Information section.Figure S1. Thermodynamically calculated equilibrium P–T phase diagrams (NCKFMASHTO) calculated for the average high-Mg basalt bulk composition, using data set 6 (DS6) of Holland and Powell (2011), with different modifications of the Green et al., (2016) amphibole model.
Table S1. Modal data for the Flin Flon volcanics.Table S2. Selected amphibole data for the Flin Flon
volcanics.Table S3. Selection of plagioclase data for the Flin Flon
suite.Table S4. Epidote compositional data for the Flin Flon
suite.Table S5. Selection of chlorite data from the Flin Flon
suites.Table S6. Complete list of bulk compositions (calculated
from compositions and modes; XRF).Table S7. Average bulk compositions (mol%) of the main
compositions groups (high-Mg, high-Ca and high-Na ba-salts) used for modelling.
How to cite this article: Starr PG, Pattison DRM, Ames DE. Mineral assemblages and phase equilibria of metabasites from the prehnite–pumpellyite to amphibolite facies, with the Flin Flon Greenstone Belt (Manitoba) as a type example. J Metamorph Geol. 2019;00:1–32. https ://doi.org/10.1111/jmg.12513