mine fire detector - health and safety · pdf fileprepared by the health and safety laboratory...
TRANSCRIPT

Prepared by the Health and Safety Laboratoryfor the Health and Safety Executive 2012
Health and Safety Executive
Mine fire detectorCombined smoke and NOx/CO sensors
RR918Research Report

Dr M A Hemingway & Dr P T WalshHealth and Safety LaboratoryHarpur HillBuxtonDerbyshireSK17 9JN
This report describes laboratory and field tests performed on four fire detectors in mine roadways both above and below ground. All four were commercial detectors that were not designed for use in coal mines. The research was jointly sponsored by HSE and UK Coal. The latter providing sites and appropriate instrumentation for the detectors that were supplied by their manufactures.
The objectives of the research were two fold:
1 To explore the latest technological developments in fire detectors to improve the management of detecting fires at the earliest opportunity.
2 To evaluate the use of detectors underground based on commercial high-sensitivity smoke and gas sensors having the potential for improved performance over currently used fire detectors.
The four detectors used in the research were an optical High Sensitive Smoke Detector (HSSD), two dual wavelength blue/infrared optical HSSD provided by different manufacturers, and an Electronic Nose detector.
The Electronic Nose detector was found to be the most responsive to fire tests performed in a surface underground gallery. The underground tests indicated it also had a large response to the presence from diesel exhaust and hydrogen emissions from battery charging.
This report and the work it describes were funded by the Health and Safety Executive (HSE). Its contents, including any opinions and/or conclusions expressed, are those of the authors alone and do not necessarily reflect HSE policy.
Mine fire detectorCombined smoke and NOx/CO sensors
HSE Books
Health and Safety Executive

© Crown copyright 2012
First published 2012
You may reuse this information (not including logos) free of charge in any format or medium, under the terms of the Open Government Licence. To view the licence visit www.nationalarchives.gov.uk/doc/open-government-licence/, write to the Information Policy Team, The National Archives, Kew, London TW9 4DU, or email [email protected].
Some images and illustrations may not be owned by the Crown so cannot be reproduced without permission of the copyright owner. Enquiries should be sent to [email protected].
ACKNOWLEDGEMENTS
We wish to acknowledge Stuart Hunneyball (TES Bretby) for his contribution to all aspects of the project; Stewart Jobling (UK Coal HQ) for coordinating UK Coal’s contribution; the staff of UK Coal Welbeck Colliery, in particular Dave Vernon and Shay Tierney, for support and assistance with the field trials; and the fire detector manufactures for the loan of their instruments.
ii

FOREWORD This project was commissioned by HSE/HID with the cooperation of UK Coal. It was managed through the Mine Fire Detection Working Group comprising: Mansel Williams (Chair, HID), Peter Goodier, (HID), Neville Williams (Secretary, HID), Stuart Jobling (UK Coal) and Stuart Hunneyball (TES Bretby). David Brenkley (Mines Rescue Service), Mike Bedford (Mines Rescue Service) and Paul Wilson (Maltby Mine) were invited guests.
iii

iv
CONTENTS
1 INTRODUCTION......................................................................................... 1 1.1 Background ............................................................................................. 1
2 DETECTORS USED IN THE TRIALS......................................................... 3 2.1 Optical Smoke Sensors ........................................................................... 3 2.2 Electronic Nose (sensor array) ................................................................ 3
3 HIGH SENSITIVE SMOKE DETECTOR 1 TRIALS.................................... 5 3.1 Introduction.............................................................................................. 5 3.2 Laboratory Trial ....................................................................................... 5 3.3 Underground Trials .................................................................................. 7
4 LABORATORY TRIALS (3 DETECTORS)................................................. 9 4.1 Introduction.............................................................................................. 9 4.2 Results..................................................................................................... 9
5 TRAINING GALLERY TRIALS................................................................. 15 5.1 Introduction............................................................................................ 15 5.2 Results................................................................................................... 17
6 UNDERGROUND TRIALS........................................................................ 23 6.1 Introduction............................................................................................ 23 6.2 Results................................................................................................... 24
7 CONCLUSIONS........................................................................................ 32
8 RECOMMENDATIONS............................................................................. 34
9 REFERENCES.......................................................................................... 35
v

vi
EXECUTIVE SUMMARY In the UK, automatic fire detectors detect fewer underground fires than mine personnel, particularly during the early stages of smouldering and smoke emission. However, as collieries become more automated, there are fewer personnel to detect fires. Current fire detectors in use in UK coal mines, based on semiconductor sensors, which detect gaseous products of combustion, are obsolete. Moreover, they are not user-friendly, have performance limitations due to interferences, and are therefore under-utilised. A joint HSE/UK Coal research project was therefore instigated to find a replacement that was also an improvement on the present fire detectors. This report describes laboratory and field tests performed on four fire detectors in mine roadways both above ground and underground. These commercial detectors were not designed for use in coal mines, therefore their performance in these tests should not be taken to be indicative of their performance in their intended environment.
Objectives
1. To ensure risks from underground fires are properly managed by using the latest technological developments, and, in particular, to explore detection technologies which might reduce this risk.
2. To evaluate fire detectors for use in underground mines based on commercial high-sensitivity smoke sensors and gas sensors having the potential for improved performance over the currently used fire detectors, with respect to sensitivity to fire and cross-sensitivity to common interferents.
Main Findings
An optical High Sensitive Smoke Detector (HSSD) responded rapidly to all fires. The use of a particle size selector, a cyclone, having a cut-off (d50) below 0.5 µm reduces the interference from coal but this required a powerful pump to maintain the airflow through the detector, which complicates its use in the mine environment and hinders commercialization of the system. For this reason no further tests were carried out upon this HSSD.
A dual wavelength (Blue/IR) optical HSSD was found to respond well to all fires except for the smouldering diesel/oil fire, which only produced a small response, and the smouldering Phenolic foam that produced no smoke and therefore gave no response. It cannot distinguish smoke from diesel fume and so would have to be used with a nitrogen monoxide (NO) detector to perform this task. It was too sensitive to the high levels of coal dust underground, which means that it would not be able to distinguish smoke from coal dust resulting in many false alarms.
An alternative optical HSSD was found to be less responsive to both fires and to coal dust than the Blue/IR. It responded to all fires except for the smouldering diesel/oil fire and the smouldering Phenolic foam and it failed to alarm to 68% of the test fires. It could not distinguish smoke from diesel fume and so would also have to be used with an NO detector. However, its response to fires compared to its response to coal dust was slightly better than the Blue/IR’s and its internal filter, used to discriminate smoke from coal dust, did not clog.
An Electronic Nose was found to be very responsive to test fires but also it had a large response and frequently alarmed whilst underground. However, these alarm responses were associated with a regular step change most noticeable in the response from its hydrogen sensor. This is likely to be due to emissions from battery charging but its regular shape suggests that its neural network can easily be trained to ignore it. Similarly, the Electronic Nose alarmed to diesel exhaust but again the good response by its sensors to this suggests that the neural net can be
vii

trained to ignore diesel exhaust. This is an advantage over the other detectors because an additional NO detector would not be required to distinguish diesel exhaust fume.
Recommendations
Based upon these conclusions the most promising type of detector for a potential advanced mine fire detection system is the Electronic Nose. However, this depends upon its neural network being successfully trained to ignore diesel exhaust fume and the regular step events in its response whilst underground. Once retrained the neural network would need to be re-tested against the test fires and at other coal mines and areas near equipment other than battery charging stations. Further work is therefore required to transfer knowledge in the following areas in order to facilitate the adoption of advanced fire detection technology in UK underground coal mines: 1) Discussions with the manufacturer and representatives of the mining industry on:
a) reduction of false alarms due to possible battery charging or other underground activities;
b) reduction of false alarms due to diesel exhaust; c) ATEX certification.
2) Experimental work (laboratory and field) to provide application specific knowledge for the adaptation of the detector for mines use, incorporating modifications from (1) above, ie: a) Further fire tests (eg conveyor belt and coal) and diesel exhaust tests to improve the
neural network classification; b) exploration of methods to test the detector underground by simulating fire while in the
presence of background coal dust; c) underground tests in various collieries to test general application of the method.
viii
1
1 INTRODUCTION
1.1 BACKGROUND Over the past 10 years or so, an average of 12 underground fires per year (mostly at coal mines) have been reported to HSE. The average has not fallen even though the number of mines has reduced in this period. Approximately 80% of the fires were detected and extinguished at an early stage by employees before the mine monitoring systems detected the fires. With a declining workforce and the use of long drivages increasing the time for evacuation, it is necessary to assess the practicability of advanced engineered solutions for early fire detection. Such research has been undertaken in various joint projects between HSE, HSL, UK Coal and TES Bretby on the development of an advanced automatic fire detector (alarm) for underground coal mines (Walsh & Hunneyball, 2002; Hemingway & Walsh, 2005; Hemingway et al, 2007). For fire alarms to be effective they should be able to detect fires during the early combustion stages ie smouldering. Two types of detector are used in UK coal mines:
• Semiconductor gas sensor (FIDESCO) for products of combustion, based on semiconductor and CO electrochemical sensors, termed the FIDESCO - Fire Detection Sensor & CO.
• Carbon monoxide sensors, based on an electrochemical sensor. FIDESCOs have high sensitivity to fires but are susceptible to false alarms and instrumental drift due to water vapour and other common interferents (Hambleton et al., 1997). They are not user-friendly and they are now obsolete with spares unavailable. A survey by UK Coal showed that FIDESCO fire detectors are significantly under-utilised for these reasons (UK Coal, 2002). Carbon monoxide sensors, however, are better for detecting spontaneous combustion and more developed fires. They are typically used in mines throughout the world as general-purpose fire detectors. However, they are not particularly sensitive to smouldering fires and are insensitive to smouldering conveyor belt fires (Hambleton et al. 1997). The inadequacy of current fire detection systems can be illustrated by the withdrawal of men from Kellingley Colliery where monitors did not detect a significant conveyor failure, which produced large amounts of smoke (Royals, 2001). The fire detectors at Kellingley were all based on carbon monoxide sensors; FIDESCO was not in use. A review of early warning fire detection techniques for use in underground mines outlined the types of sensor and tests that could be carried out (Walsh and Hunneyball, 2002). It built on previous work carried out by HSL and work undertaken elsewhere on this topic, particularly that in the United States by NIOSH/PRL (Edwards et al, 2000; Edwards et al., 2002; Litton, 2002). The review recommended a range of sensors to be considered for testing with the criteria that they should have at least the sensitivity of the existing system FIDESCO but not susceptible to typical interferents, eg diesel exhaust, methane, humidity, coal dust. This was then narrowed down to the following to be included in the tests as practicable potential mine fire sensors and existing fire sensors to be used as benchmarks:
• Semiconductor sensor: TGS 711 POC (as used in the FIDESCO instrument). • Potential alternative POC semiconductor sensors to TGS 711. • Ionisation smoke sensor: domestic, Trolex mine fire detector (obsolete). • Electrochemical carbon monoxide, nitric oxide, nitrogen dioxide sensors. • Optical smoke sensors: domestic, dual wavelength Blue/Infrared, aspirated High
Sensitive Smoke Detectors.

2
• Thermal imaging camera. • Video Smoke Detection.
The sensors were tested both above ground and underground at Welbeck Colliery, and in the laboratory. This was achieved with assistance from instrument companies. The potential was identified of the combination of an optical High-Sensitivity Smoke Detector (HSSD) and a nitric oxide or nitrogen dioxide gas sensor (nitric oxide, NO, and nitrogen dioxide, NO2, are collectively known as NOx). The NOx electrochemical sensors allowed fire to be distinguished from diesel exhaust emissions. The latter stages of the previous work focused on evaluating the potential of an optical HSSD fitted with a cyclone particle size selector to prevent the larger coal dust from reaching the sensor while the smaller smoke particles passed through. This latter work is reported below. An improved type of HSSD is based on the differential response of a dual wavelength blue/infrared (IR) sensor. A low sensitivity model was previously tested and, while it showed selectivity towards smoke but not coal dust, it was not sensitive enough for mine fires. However, the manufacturer was developing a much more sensitive blue/IR smoke detector, which was going to be loaned to us for testing. Unfortunately, they put its commercial production on indefinite hold. An alternative method of differentiating smoke particles from ‘nuisance’ particulate matter employs the combination of an ionisation detector and a light scattering photometer to distinguish smoke particles from interferents such as diesel exhaust and coal dust (Litton, 2002). However, the use of a radioactive source raises safety issues that were deemed unacceptable, therefore this technique was not pursued further. After some searching, alternative HSSDs were found that could be tested. One was a Blue/IR HSSD and the other was another single wavelength HSSD. The Blue/IR has the added advantage that it does not require a pump as it is designed for use in ducts. The new HSSD separates smoke particles from coal dust using a particulate filter that only requires a small pump and the detector’s sensitivity is automatically matched to the background conditions it is exposed to. A third detector was also selected for testing, an Electronic Nose. This uses six semiconductor sensors to produce a signal pattern that can be characterised as a fire event using neural network pattern recognition techniques. The use of sensor arrays based on semiconductors for mine fire detection has also been investigated by NIOSH/PRL; see, for example, later work described by Franks et al (2008). None of the detectors selected were originally intended for operation in coal mines. We therefore investigated the emerging solutions for rapid, automatic detection of mine fires:
1. Blue/IR HSSD. 2. Single wavelength HSSD. 3. Electronic Nose.
The first two options would need to be used in combination with a NOx detector to distinguish diesel exhaust from smoke. Each detector was to be characterized in terms of its sensitivity to test fires, cross-sensitivity to interferents and its pit-worthiness.
3
2 DETECTORS USED IN THE TRIALS
2.1 OPTICAL SMOKE SENSORS Currently there are no smoke detectors used in UK coal mines based on the optical (photometric) principle. Standard optical smoke detectors that are designed for use in domestic or commercial environments have a sensitivity of about 5 %.m-1 obscuration. The technique detects smoke particles by light scattering while high sensitive smoke detectors use laser-based particle counting that have a sensitivity of about 0.005 %.m-1 obscuration. Optical sensors were kindly loaned by their respective manufactures. These sensors were not designed for use in mines therefore their performance in these tests would not be indicative of their performance in their design environment. Three types were used for the tests:
• Optical High Sensitive Smoke Dectector (HSSD1) - an aspirated, single wavelength smoke detector for commercial applications with a sensitivity range of 0.005 %.m-1 to 1 %.m-1 obscuration. Air is sampled through a network of pipes with a number of sample orifices. The optical system is designed to respond to particles smaller than 10 μm but as coal dust particles can be smaller than this, the detector was fitted with a cyclone particle size selector and powerful pump to prevent the larger sized coal dust particles from reaching the sensor. This detector was tested in previous work but is reported here for completeness.
• Alternative optical High Sensitive Smoke Dectector (HSSD2) – an aspirated, single wavelength smoke detector for commercial applications responding to smoke at concentrations of less than 0.0015%.m-1 obcuration. It is similar to the HSSD1 except it uses a particulate filter to remove dust which means the system should not have a significant response to coal dust. Only a small fraction of the sampled air is passed through the filter before smoke detection, so it requires a much smaller pump than the HSSD1 fitted with a cyclone. It is claimed that the filter has a lifetime of up to three years in normal working environments. Part of its testing will be to determine an estimate for its likely lifetime in the dustier conditions in coal mines. The detector automatically adjusts its own sensitivity to match the background level of dust or fume so that it can be more sensitive in clean environments but produce fewer false alarms in dirty environments.
• Blue/IR Dual wavelength optical high sensitivity smoke detector – a non-aspirated, dual wavelength smoke detector for commercial applications with a sensitivity range of 0.003 %.m-1 to 15 %.m-1 obscuration. Smaller smoke particles produce a bigger response to the shorter wavelength of blue light, while larger dust particles, such as coal dust, produce a bigger response to the longer wavelength of the infrared light. Therefore, the ratio of the response to blue light and infrared light should be large in the presence of smoke and small in the presence of coal dust. The dual wavelength optical detector (or blue/IR detector) therefore has the potential to distinguish between smoke particles and coal dust in a coal mine. This model has a small plastic sampling probe that can be inserted into air ducts so that a pump is not required to transport the sample to the sensing zone. It also has a grit filter that needs changing every ten years in normal conditions.
2.2 ELECTRONIC NOSE (SENSOR ARRAY)
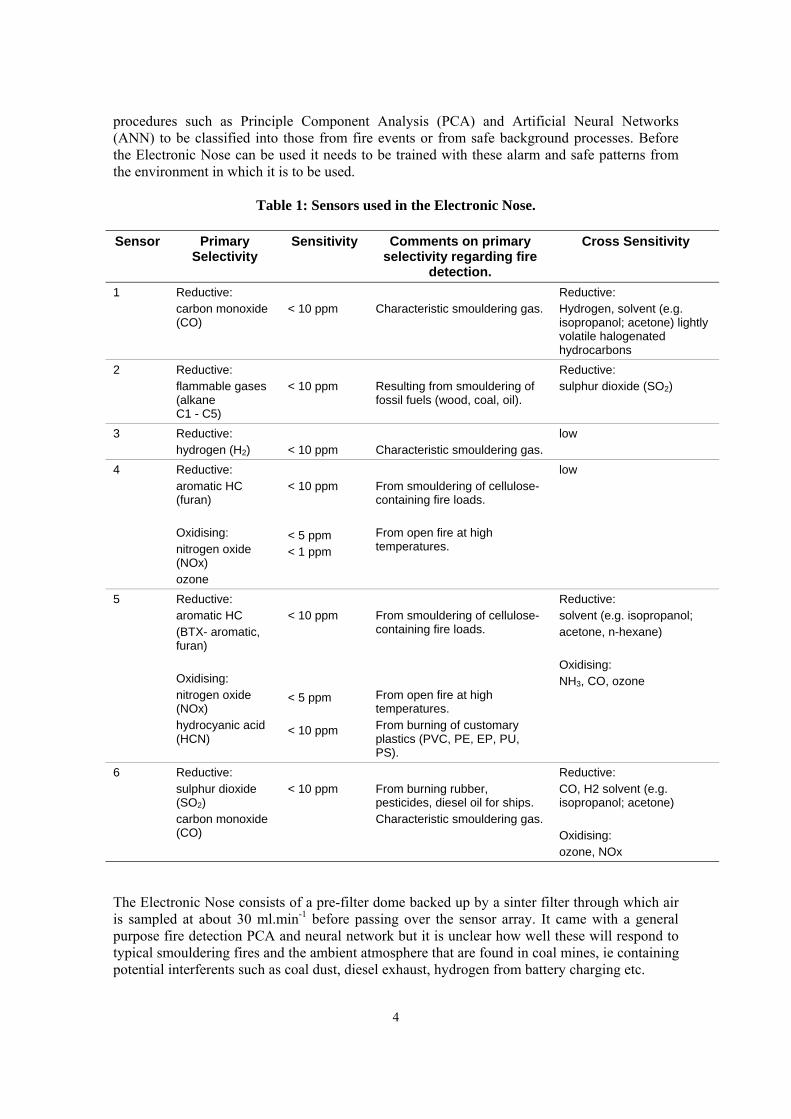
The Electronic Nose tested here consists of an array of six metal oxide semiconductor (MOS) gas sensors together with sensors for temperature and humidity (see Table 1). Each sensor reacts differently when exposed to a gas producing a complex pattern that will be different for different gases and different mixtures of gases. The patterns are analysed by pattern recognition
4
procedures such as Principle Component Analysis (PCA) and Artificial Neural Networks (ANN) to be classified into those from fire events or from safe background processes. Before the Electronic Nose can be used it needs to be trained with these alarm and safe patterns from the environment in which it is to be used.
Table 1: Sensors used in the Electronic Nose.
Sensor Primary
Selectivity Sensitivity Comments on primary
selectivity regarding fire detection.
Cross Sensitivity
1 Reductive: carbon monoxide (CO)
< 10 ppm
Characteristic smouldering gas.
Reductive: Hydrogen, solvent (e.g. isopropanol; acetone) lightly volatile halogenated hydrocarbons
2 Reductive: flammable gases (alkane C1 - C5)
< 10 ppm
Resulting from smouldering of fossil fuels (wood, coal, oil).
Reductive: sulphur dioxide (SO2)
3 Reductive: hydrogen (H2)
< 10 ppm
Characteristic smouldering gas.
low
4 Reductive: aromatic HC (furan) Oxidising: nitrogen oxide (NOx) ozone
< 10 ppm < 5 ppm < 1 ppm
From smouldering of cellulose-containing fire loads. From open fire at high temperatures.
low
5 Reductive: aromatic HC (BTX- aromatic, furan) Oxidising: nitrogen oxide (NOx) hydrocyanic acid (HCN)
< 10 ppm < 5 ppm < 10 ppm
From smouldering of cellulose-containing fire loads. From open fire at high temperatures. From burning of customary plastics (PVC, PE, EP, PU, PS).
Reductive: solvent (e.g. isopropanol; acetone, n-hexane) Oxidising: NH3, CO, ozone
6 Reductive: sulphur dioxide (SO2) carbon monoxide (CO)
< 10 ppm
From burning rubber, pesticides, diesel oil for ships. Characteristic smouldering gas.
Reductive: CO, H2 solvent (e.g. isopropanol; acetone) Oxidising: ozone, NOx
The Electronic Nose consists of a pre-filter dome backed up by a sinter filter through which air is sampled at about 30 ml.min-1 before passing over the sensor array. It came with a general purpose fire detection PCA and neural network but it is unclear how well these will respond to typical smouldering fires and the ambient atmosphere that are found in coal mines, ie containing potential interferents such as coal dust, diesel exhaust, hydrogen from battery charging etc.
5
3 HIGH SENSITIVE SMOKE DETECTOR 1 TRIALS
3.1 INTRODUCTION
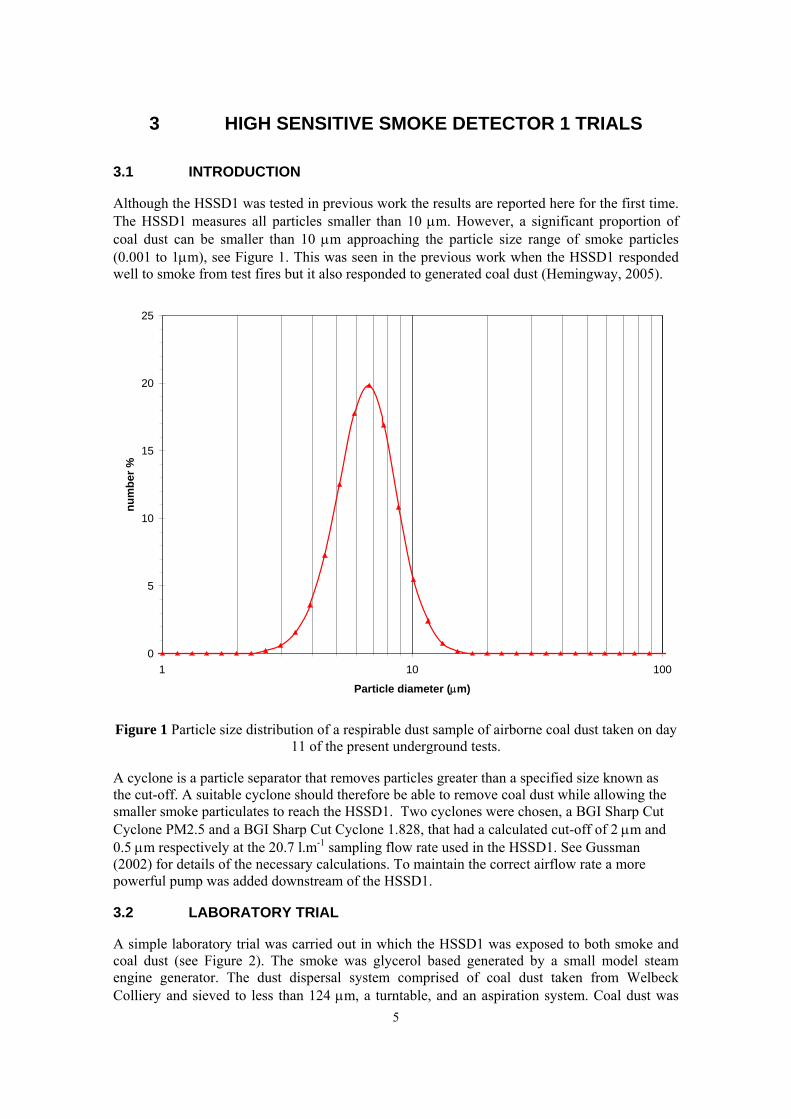
Although the HSSD1 was tested in previous work the results are reported here for the first time. The HSSD1 measures all particles smaller than 10 μm. However, a significant proportion of coal dust can be smaller than 10 μm approaching the particle size range of smoke particles (0.001 to 1μm), see Figure 1. This was seen in the previous work when the HSSD1 responded well to smoke from test fires but it also responded to generated coal dust (Hemingway, 2005).
Figure 1 Particle size distribution of a respirable dust sample of airborne coal dust taken on day 11 of the present underground tests.
A cyclone is a particle separator that removes particles greater than a specified size known as the cut-off. A suitable cyclone should therefore be able to remove coal dust while allowing the smaller smoke particulates to reach the HSSD1. Two cyclones were chosen, a BGI Sharp Cut Cyclone PM2.5 and a BGI Sharp Cut Cyclone 1.828, that had a calculated cut-off of 2 μm and 0.5 μm respectively at the 20.7 l.m-1 sampling flow rate used in the HSSD1. See Gussman (2002) for details of the necessary calculations. To maintain the correct airflow rate a more powerful pump was added downstream of the HSSD1.
3.2 LABORATORY TRIAL
A simple laboratory trial was carried out in which the HSSD1 was exposed to both smoke and coal dust (see Figure 2). The smoke was glycerol based generated by a small model steam engine generator. The dust dispersal system comprised of coal dust taken from Welbeck Colliery and sieved to less than 124 μm, a turntable, and an aspiration system. Coal dust was
0
5
10
15
20
25
1 10 100
Particle diameter (μm)
num
ber %

6
spread evenly across the turntable and passed beneath a collection nozzle. The dust was entrained into an airflow and directed out of the exit nozzle towards the cyclone. The system was not calibrated.
Figure 2 Coal dust and smoke generators and the 0.5 μm cyclone connected to the HSSD1 inside a stainless steel box.
Figure 3 Response of the HSSD1 to laboratory generated smoke and coal dust. 100% response corresponds to approximately 1 %.m-1 obscuration.
Time
Res
pons
e

7
Results are shown in Figure 3. Coal dust was generated during the entire test and overloaded the detector until the 0.5 μm cyclone was added, after which the HSSD1’s response began to fall. When smoke was generated the response increased again until the generator was switched off. This shows that the HSSD1, when fitted with a 0.5 μm cut-off cyclone can distinguish smoke in a background of coal dust.
3.3 UNDERGROUND TRIALS
Before the underground trials could commence the HSSD1, cyclone and pump were encased inside stainless steel boxes to conform with safety regulations and protect them from the mine environment. The trials were carried out at an out-bye conveyor drive roadway below ground at Welbeck Colliery. The detector was situated next to a conveyor carrying coal out of the mine. This site was chosen because instruments did not need to be intrinsically safe here under Manager’s Rules, but it was particularly dusty which closely matched conditions close to the coalface.
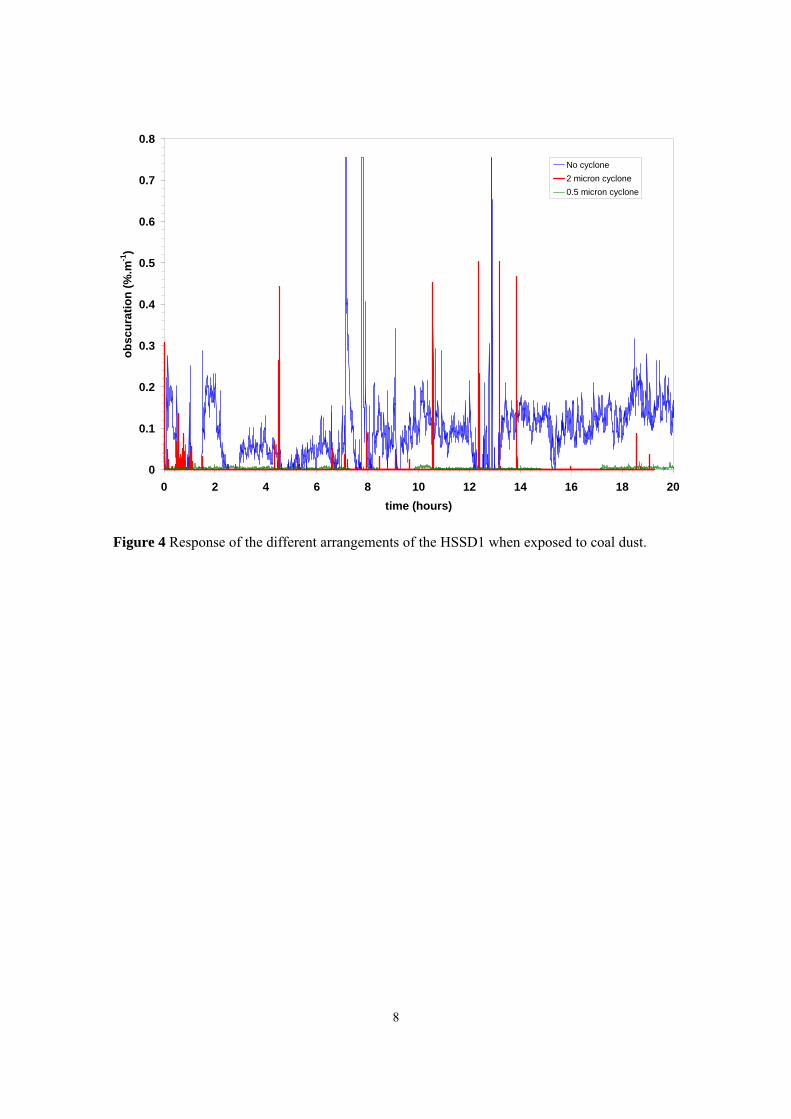
Selected results are shown in Figure 4. The profiles from the the three experiments: no cyclone, 2 μm and 0.5 μm cyclones were obtained at different times, although within weeks of each other, and therefore at different dust concentrations; they are are superimposed for convenience. The addition of the 2 μm cyclone reduces the response but there are still significant peaks. The 0.5 μm cyclone reduces the response from less than 0.2 %.m-1 obscuration to less than 0.02 %.m-1 obscuration. However, the smaller cyclone required a significantly larger and more powerful pump to maintain the airflow through the HSSD1, which complicates its use in the mine environment and hinders commercialization of the system.
Measurements of airborne dust were made and the results are shown in Table 2.
Table 2: Detector sampling conditions.
Sample 1 2 3 Total dust conc. 60.1 mg.m-3 58.3 mg.m-3 47.4 mg.m-3 Respirable dust conc. 1.6 mg.m-3 2.3 mg.m-3 6.9 mg.m-3
Mean particle size 27μm 16 μm 139 μm Mode particle size 13 μm (shoulder at 39
μm) 12 μm 143 μm (small shoulder at 12 μm)
8
Figure 4 Response of the different arrangements of the HSSD1 when exposed to coal dust.
0
0.1
0.2
0.3
0.4
0.5
0.6
0.7
0.8
0 2 4 6 8 10 12 14 16 18 20time (hours)
obsc
urat
ion
(%.m
-1)
No cyclone2 micron cyclone0.5 micron cyclone

9
4 LABORATORY TRIALS (3 DETECTORS)
4.1 INTRODUCTION The aim of this first part of the work was to gain experience of the three detectors and to determine if they could distinguish a smoke source in a dusty environment. The detectors were exposed to A2 Fine Arizona road dust (essentially silica) and small, un-calibrated, smouldering card fires in a small dust exposure tunnel (Dowker and Fall, 2005). Airflow was about 0.27 m.s-1 and steady-state dust concentrations were 6 - 7 mg.m-3. Dust levels were measured with cyclone respirable dust samplers. For the purposes of these tests a small fan was required to keep the air flowing through the Monitair sampling nozzle. Results of the most significant tests are shown below.
4.2 RESULTS
4.2.1 Blue/IR HSSD Figure 5 shows the results of a simple test to determine the effects of airflow upon the Blue/IR’s response to dust inside the dust tunnel. It can be seen that there was no effect upon the response to dust even when the airflow in the tunnel and through the Blue/IR was outside the recommended range. However, results not shown here appear to indicate that at flow rates well below the minimum recommended airflow the optics inside the Blue/IR may have a dust deposit build up on them that causes the Blue/IR to indicate higher dust concentrations than expected. The deposit was blown away when the airflow was increased to normal levels.
0
500
1000
1500
2000
2500
0 2 4 6 8 10 12 14 16 18 20time (m)
Airf
low
(mV)
.
0
50
100
150
200
250
300
350
400
450
Dus
t Lev
el (m
V)
AirflowSmoke Level
minumum airflow
maximum airflow
Figure 5 Effect of airflow through the Blue/IR on its response to airborne dust.
10
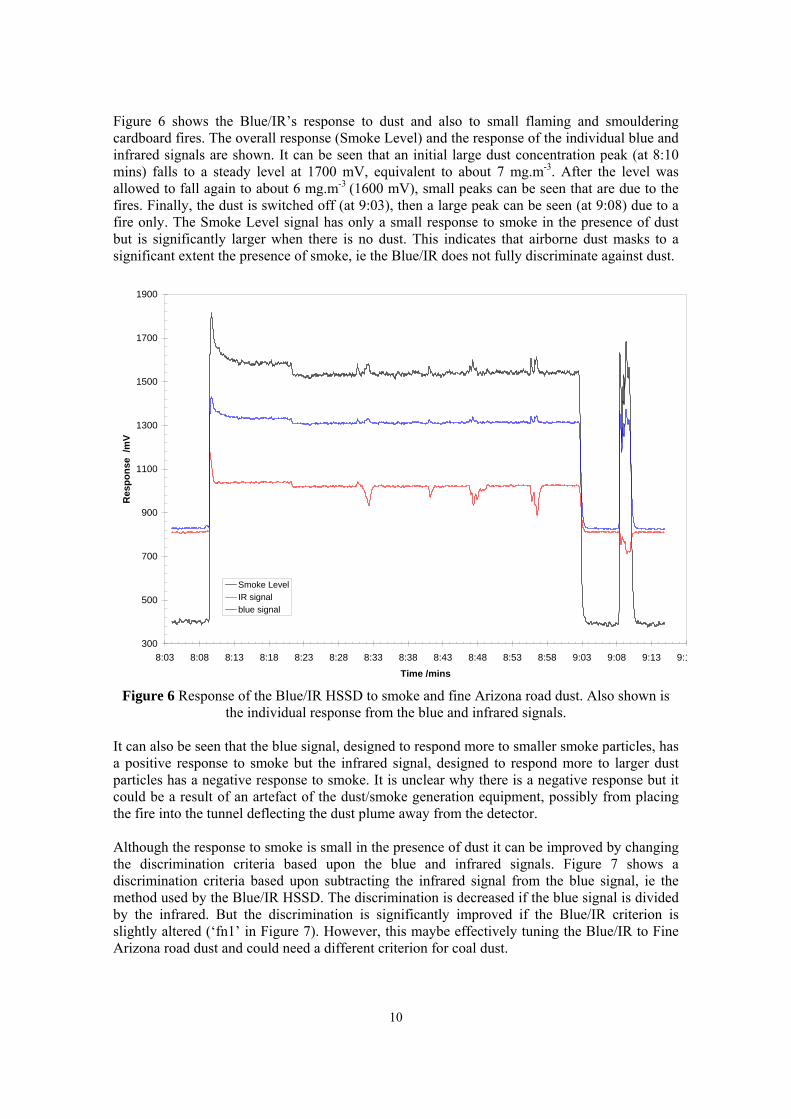
Figure 6 shows the Blue/IR’s response to dust and also to small flaming and smouldering cardboard fires. The overall response (Smoke Level) and the response of the individual blue and infrared signals are shown. It can be seen that an initial large dust concentration peak (at 8:10 mins) falls to a steady level at 1700 mV, equivalent to about 7 mg.m-3. After the level was allowed to fall again to about 6 mg.m-3 (1600 mV), small peaks can be seen that are due to the fires. Finally, the dust is switched off (at 9:03), then a large peak can be seen (at 9:08) due to a fire only. The Smoke Level signal has only a small response to smoke in the presence of dust but is significantly larger when there is no dust. This indicates that airborne dust masks to a significant extent the presence of smoke, ie the Blue/IR does not fully discriminate against dust.
Figure 6 Response of the Blue/IR HSSD to smoke and fine Arizona road dust. Also shown is the individual response from the blue and infrared signals.
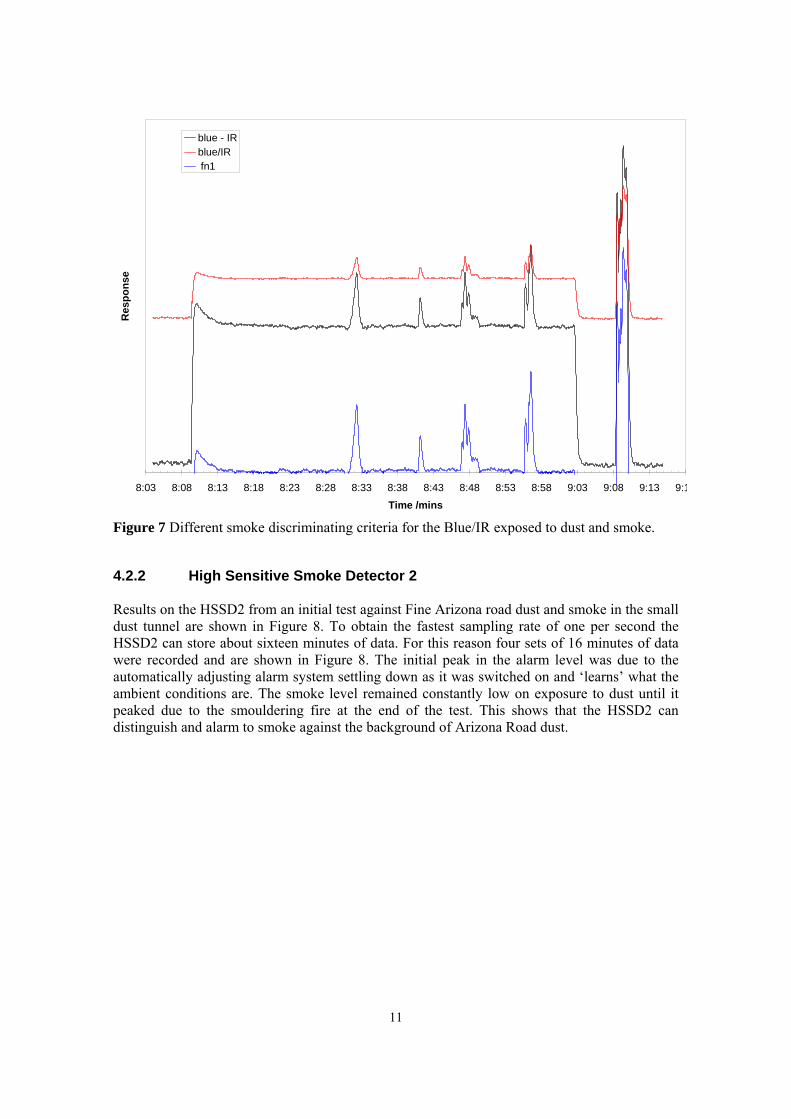
It can also be seen that the blue signal, designed to respond more to smaller smoke particles, has a positive response to smoke but the infrared signal, designed to respond more to larger dust particles has a negative response to smoke. It is unclear why there is a negative response but it could be a result of an artefact of the dust/smoke generation equipment, possibly from placing the fire into the tunnel deflecting the dust plume away from the detector. Although the response to smoke is small in the presence of dust it can be improved by changing the discrimination criteria based upon the blue and infrared signals. Figure 7 shows a discrimination criteria based upon subtracting the infrared signal from the blue signal, ie the method used by the Blue/IR HSSD. The discrimination is decreased if the blue signal is divided by the infrared. But the discrimination is significantly improved if the Blue/IR criterion is slightly altered (‘fn1’ in Figure 7). However, this maybe effectively tuning the Blue/IR to Fine Arizona road dust and could need a different criterion for coal dust.
300
500
700
900
1100
1300
1500
1700
1900
8:03 8:08 8:13 8:18 8:23 8:28 8:33 8:38 8:43 8:48 8:53 8:58 9:03 9:08 9:13 9:1
Time /mins
Res
pons
e /m
V
Smoke LevelIR signalblue signal
11
Figure 7 Different smoke discriminating criteria for the Blue/IR exposed to dust and smoke.
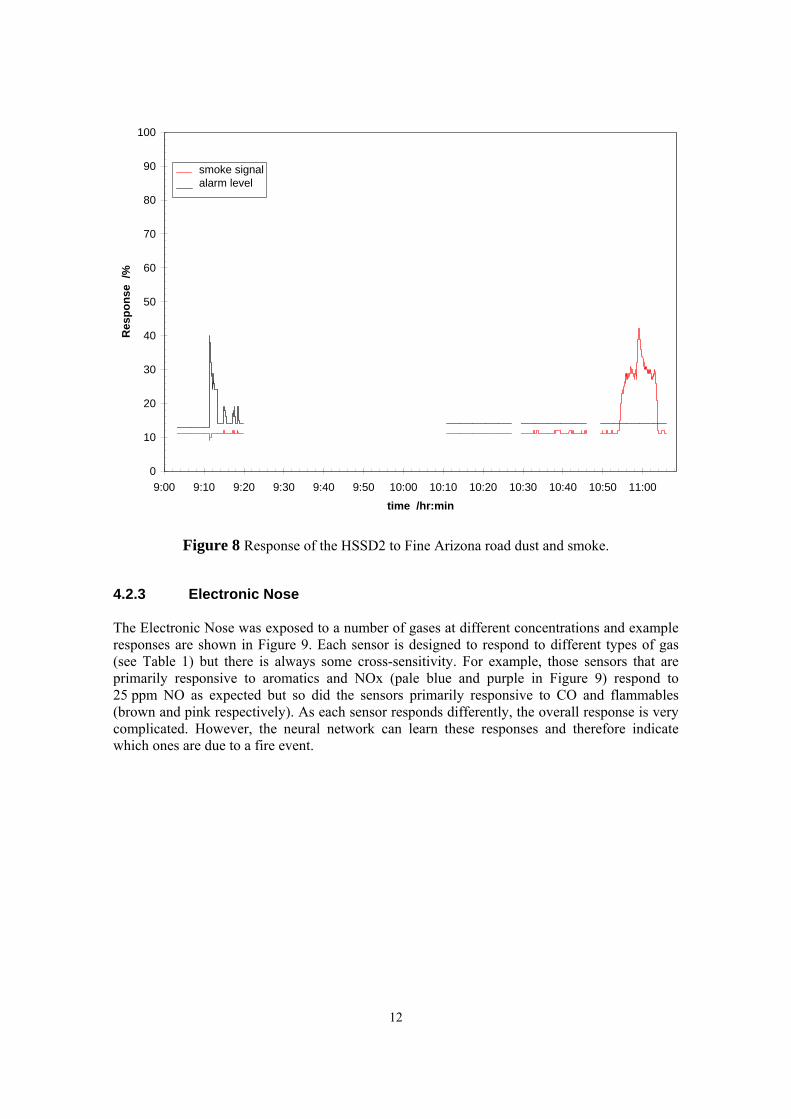
4.2.2 High Sensitive Smoke Detector 2 Results on the HSSD2 from an initial test against Fine Arizona road dust and smoke in the small dust tunnel are shown in Figure 8. To obtain the fastest sampling rate of one per second the HSSD2 can store about sixteen minutes of data. For this reason four sets of 16 minutes of data were recorded and are shown in Figure 8. The initial peak in the alarm level was due to the automatically adjusting alarm system settling down as it was switched on and ‘learns’ what the ambient conditions are. The smoke level remained constantly low on exposure to dust until it peaked due to the smouldering fire at the end of the test. This shows that the HSSD2 can distinguish and alarm to smoke against the background of Arizona Road dust.
8:03 8:08 8:13 8:18 8:23 8:28 8:33 8:38 8:43 8:48 8:53 8:58 9:03 9:08 9:13 9:1
Time /mins
Res
pons
eblue - IRblue/IR fn1
12
Figure 8 Response of the HSSD2 to Fine Arizona road dust and smoke.
4.2.3 Electronic Nose The Electronic Nose was exposed to a number of gases at different concentrations and example responses are shown in Figure 9. Each sensor is designed to respond to different types of gas (see Table 1) but there is always some cross-sensitivity. For example, those sensors that are primarily responsive to aromatics and NOx (pale blue and purple in Figure 9) respond to 25 ppm NO as expected but so did the sensors primarily responsive to CO and flammables (brown and pink respectively). As each sensor responds differently, the overall response is very complicated. However, the neural network can learn these responses and therefore indicate which ones are due to a fire event.
0
10
20
30
40
50
60
70
80
90
100
9:00 9:10 9:20 9:30 9:40 9:50 10:00 10:10 10:20 10:30 10:40 10:50 11:00
time /hr:min
Res
pons
e /%
smoke signal alarm level

13
Figure 9 Response of the Electronic Nose’s sensors to nitrogen monoxide, methane and medical air (pure air).
The Electronic Nose was shown to respond to CO, CO2, Cl2, toluene, NO, NO2, H2 and compressed air. Its responses to smoke and dust were measured in the combined tests below.
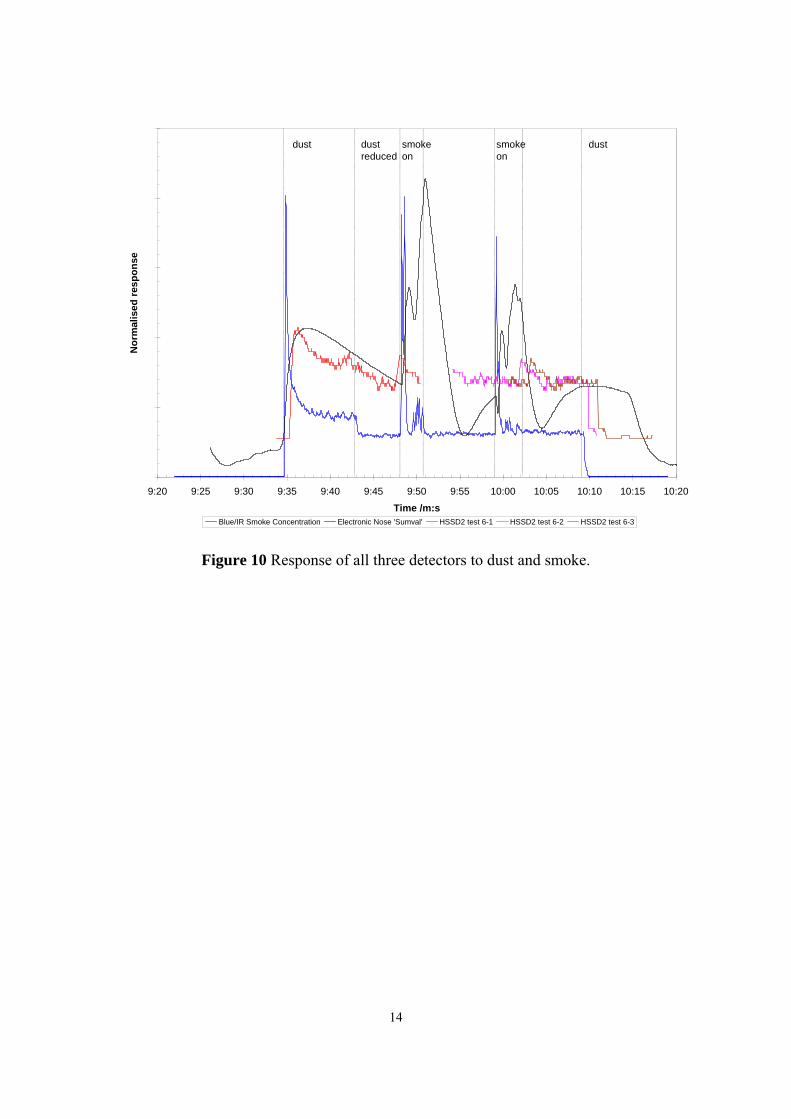
4.2.4 Combined Tests The final tests involved all three detectors in the dust tunnel at the same time and their normalised response is shown in Figure 10. The results from the Blue/IR show the approximate concentration in terms of %obscuration per meter using a calibration function supplied by its manufacturer. The Blue/IR responded as before, clearly showing peaks due to smoke events at times of 9:48 and 10:00. Only the ‘SumVal’ of the Electronic Nose is shown in order to derive a comparison with the other detectors. This is a simple summary function, which has little discrimination value but does show there is a response to the smouldering fire and Arizona Road dust. The response to dust is probably due to some contaminant (eg volatile organic compound) in the compressed air used to supply the dust generators because a similar response (not shown here) occurred when the SamDetect was exposed to solely compressed air. The response from the HSSD2 is also shown but as three separate plots. This was because the data was saved at three different times during the test but when plotted on the same chart it can be seen that they do not syncronise. The first data set, Test 6-1, matches data from the Blue/IR and the Electronic Nose and clearly shows a small peak due to smoke above the background level of dust at about 9:48. The two following data sets, Test 6-2 and Test 6-3, do not coincide with the other two detectors or themselves. The reason for this is unclear.
-2
-1.5
-1
-0.5
0
0.5
1
1.5
2
2.5
3
06:00 07:00 08:00 09:00 10:00 11:00 12:00 13:00 14:00Time /h:m
Diff
eren
tial R
espo
nse
CO (smouldering) flammables (alkanes C1-C5) (sm fossil fuel)H2 (smouldering) aromatics HC (sm cellulose), NOx, ozone (high temp fire)Aromatics (sm cellulose), NOx HCN (high temp fire or plastics) SO2 (burning rubber diesel), CO (sm.)
medical air 25ppm NO in N2
1% CH4 in med air medical air in lab
14
Figure 10 Response of all three detectors to dust and smoke.
0
0.5
1
1.5
2
2.5
9:20 9:25 9:30 9:35 9:40 9:45 9:50 9:55 10:00 10:05 10:10 10:15 10:20
Time /m:s
Nor
mal
ised
resp
onse
0
10
20
30
40
50
60
70
80
90
100
Blue/IR Smoke Concentration Electronic Nose 'Sumval' HSSD2 test 6-1 HSSD2 test 6-2 HSSD2 test 6-3
dust dust reduced
smoke on
dust smoke on

15
5 TRAINING GALLERY TRIALS
5.1 INTRODUCTION Tests were performed in the surface training gallery at UK Coal's Welbeck Colliery. The gallery is equivalent to a standard UK coalmine gallery with the exception that equipment used in it need not be intrinsically safe and there is no airborne coal dust. The detectors were connected to a laptop computer for datalogging. Each detector and the laptop were encased in stainless steel box to protect them from the mine environment. For the Training Gallery tests they were placed as close as possible to each other in an array across the centre of the gallery at just below roof height at a distance of 20 m from the fire site (see Figure 11). Two MultiRae portable gas monitors (Rae Systems) fitted with electrochemical sensors to measure NO, NO2 and CO were placed next to the detectors. These have the potential to discriminate diesel exhaust from smoke when used in combination with the HSSDs.
Figure 11 Detectors in the training gallery. The laptop is on the left, the Blue/IR in its stainless steel box is above and to the right of it, the HSSD2 is in the large stainless steel box with the red sampling pipes and the Electronic Nose is on the right. The MultiRaes are between the Blue/IR
and the HSSD2. Fire detectors were exposed to a series of test fires and diesel exhaust fumes initiated in the training gallery in a ventilated air stream moving at 1.0 to 2.0 m.s-1
provided by an auxiliary fan in sucking mode.

16
The test fires were:
• Smouldering conveyor belt. • Smouldering grease and oil. • Smouldering coal fire simulating spontaneous combustion. • Smouldering wood. • Smouldering phenolic foam (an instant foaming two component compound used to fill
cavities and stabilise debris). Additionally, they were also exposed to the output from a Colt4 glycerol based smoke generator, a potassium chlorate/lactose smoke bomb and the exhaust from a diesel Free Steered Vehicle (FSV). The test fires were relatively small scale and were set approximately 20 m from the detectors. The coal test fires comprised of approximately 14 kg of coal sized up to 60 mm, placed in a 0.6 m square and 0.1 m deep container around a 2.4 kW electrical strip heater, see Figure 12. The conveyor belt test fires comprised of an approximately 0.45 m square sample of belt clamped on top of the electrical strip heater. Wood test fires comprised of scrap wood such as roof support timber and plywood broken into approximately 0.3 m strips placed onto the electric strip heater. Grease and oil fires comprised of a patch of oil and grease about 0.3 m in diameter in a metal tray that was placed on top of the electric strip heater. Phenolic foam test fires comprised of pieces of foam sized upto about 60 mm. For some fires the pieces of foam was mixed with coal and for one test a single large block of foam with sides of approximately 0.6 m was heated.
Figure 12 Preparation of the coal test fire. The laptop next to the detectors can just be seen
(blue object) 20m in the background.
17
For the diesel fume tests the FSV was driven from approximately 70 m from the detectors to 20 m away and back again while some of the test fires were smouldering. In one case the FSV was driven up to 7 m from the detectors. After each fire or exhaust exposure, the tunnel was purged with clean air to reduce the sensor levels near to their zero level. Repeats of fire and diesel exhaust experiments were carried out.
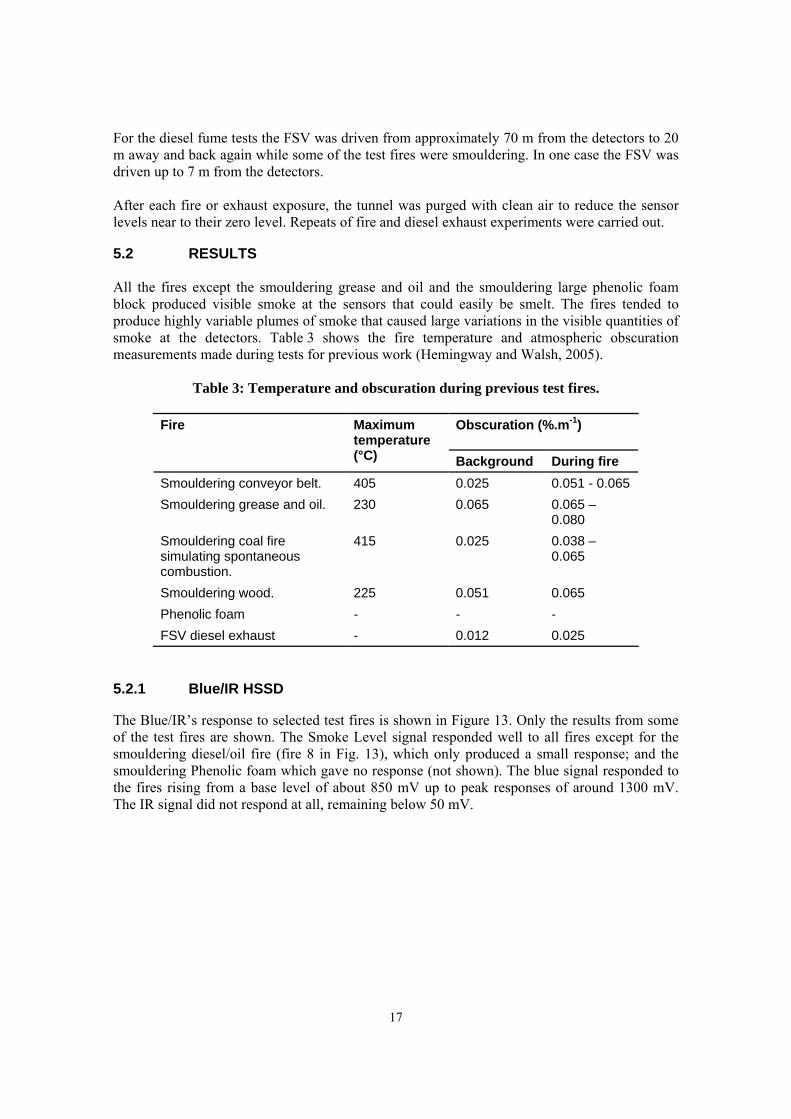
5.2 RESULTS All the fires except the smouldering grease and oil and the smouldering large phenolic foam block produced visible smoke at the sensors that could easily be smelt. The fires tended to produce highly variable plumes of smoke that caused large variations in the visible quantities of smoke at the detectors. Table 3 shows the fire temperature and atmospheric obscuration measurements made during tests for previous work (Hemingway and Walsh, 2005).
Table 3: Temperature and obscuration during previous test fires.
Obscuration (%.m-1) Fire Maximum temperature (°C) Background During fire
Smouldering conveyor belt. 405 0.025 0.051 - 0.065 Smouldering grease and oil. 230 0.065 0.065 –
0.080 Smouldering coal fire simulating spontaneous combustion.
415 0.025 0.038 – 0.065
Smouldering wood. 225 0.051 0.065 Phenolic foam - - - FSV diesel exhaust - 0.012 0.025
5.2.1 Blue/IR HSSD
The Blue/IR’s response to selected test fires is shown in Figure 13. Only the results from some of the test fires are shown. The Smoke Level signal responded well to all fires except for the smouldering diesel/oil fire (fire 8 in Fig. 13), which only produced a small response; and the smouldering Phenolic foam which gave no response (not shown). The blue signal responded to the fires rising from a base level of about 850 mV up to peak responses of around 1300 mV. The IR signal did not respond at all, remaining below 50 mV.

18
0
500
1000
1500
2000
2500
08:00:00 08:30:00 09:00:00 09:30:00 10:00:00 10:30:00 11:00:00 11:30:00 12:00:00 12:30:00 13:00:00Time
Blue
/IR R
espo
nse
/m
V
0.001
0.01
0.1
1
10
App
roxi
mat
e Sm
oke
Con
cent
ratio
n /
%ob
s.m
-1
IR SignalBlue SignalSmoke Level
6. Diesel pool fire
7. Diesel fume (FSV)
8. Oil & grease fire
9. Belt & FSV
10. Lactose smoke
11. W ood & FSV
12. FSV at 7m
13. FSV & coal
Figure 13 Blue/IR response to test fires.
5.2.2 High Sensitive Smoke Detector 2
0
10
20
30
40
50
60
70
80
90
100
8:00:00 8:30:00 9:00:00 9:30:00 10:00:00 10:30:00 11:00:00 11:30:00 12:00:00 12:30:00 13:00:00
Approximate Time
Res
pons
e /
%
6. Diesel pool fire
7. Diesel fume (FSV)
8. Oil & grease fire
9. Belt & FSV
10. Lactose smoke
11. Wood & FSV
12. FSV at 7m
13. FSV & coal
Alarm level
Figure 14 HSSD2 response to test fires.
The HSSD2’s response to selected test fires is shown in Figure 14. It responded to all fires except for the smouldering grease/oil fire (fire 8 in Fig. 14) and the smouldering Phenolic foam (not shown). However, it failed to alarm (indicated by the smoke level increasing above the alarm level) to 13 out of the 19 test fires (i.e. 68% of test fires). However, it may be possible to adjust the alarm level to be more sensitive to these fires.

19
5.2.3 Electronic Nose
The Electronic Nose’s individual sensor responses to selected test fires are shown in Figures 15 and 16. They responded to all the test fires and to diesel fume. Figure 15 shows the exceptionally large response of the Aromatics, smouldering cellulose (red) sensor to diesel exhaust from the FSV.
0
20
40
60
80
100
120
140
160
180
200
8:00 8:30 9:00 9:30 10:00 10:30 11:00 11:30 12:00 12:30 13:00Time /h:m
Sens
or R
espo
nse
0
10000
20000
30000
40000
50000
60000
70000
80000
90000
arom
atic
s (s
m c
ellu
lose
) res
pons
e
CO (smouldering) flammables (alkanes C1-C5) (sm fossil fuel)H2 (smouldering) aromatics HC (sm cellulose), NOx, ozone (high temp fire)SO2 (burning rubber diesel), CO (sm.) aromatics (sm cellulose), NOx HCN (high temp fire or plastics)
6. Diesel pool fire
7. Diesel fume (FSV)
8. Oil & grease fire
9. Belt & FSV
10. Lactose smoke
11. Wood & FSV
12. FSV at 7m
13. FSV & coal
fire start
pour diesel
Figure 15 Response of the Electronic Nose to selected test fires and diesel exhaust from an FSV.
This sensor is also responsive to NOx which is the likely course of its response to diesel exhaust. However, the sensor had a smaller response to diesel exhaust on its own (fire 7 in Fig. 15) that became larger in the presence of smoke: for example, the diesel peak superimposed upon the belt fire peak (fire 9).

20
Figure 16 Response of the Electronic Nose to selected test fires (note the change of scale for the response to Aromatics, smouldering cellulose sensor between this figure and Figure 15).
5.2.4 Electrochemical NOx and CO sensors
Figure 17 Response of the MultiRae NOx and CO sensors to diesel fume.
0
20
40
60
80
100
120
140
160
180
200
9:00 9:30 10:00 10:30 11:00 11:30 12:00 12:30 13:00 13:30Time /h:m
Sens
or re
spon
se
0
200
400
600
800
1000
1200
1400
1600
arom
atic
s (s
m c
ellu
lose
) res
pons
e
CO (smouldering) flammables (alkanes C1-C5) (sm fossil fuel)H2 (smouldering) aromatics HC (sm cellulose), NOx, ozone (high temp fire)SO2 (burning rubber, diesel), CO (sm.) aromatics (sm cellulose), NOx HCN (high temp fire or plastics)
Colt4 smoke
Coal & phenolic foam
Foam
Coal & foam Foam
Foam block
fan off
fan on
tip out & quench
tip out & quench
tip out & quench
tip out & quench
21
The MultiRae’s electrochemical sensors’ response to diesel fume is shown in Figure 17. NO showed some response, although the levels are less than 2 ppm which is approaching the limit of detection for this type of sensor. CO gave a lesser response (less than approximately 1 ppm), close to the limit of detection; and NO2 a very small response (< 0.4 ppm), again close to the limit of detection. Neither of the NOx sensors responded to the test fires although the CO did respond well to smouldering Phenolic foam (result not shown).
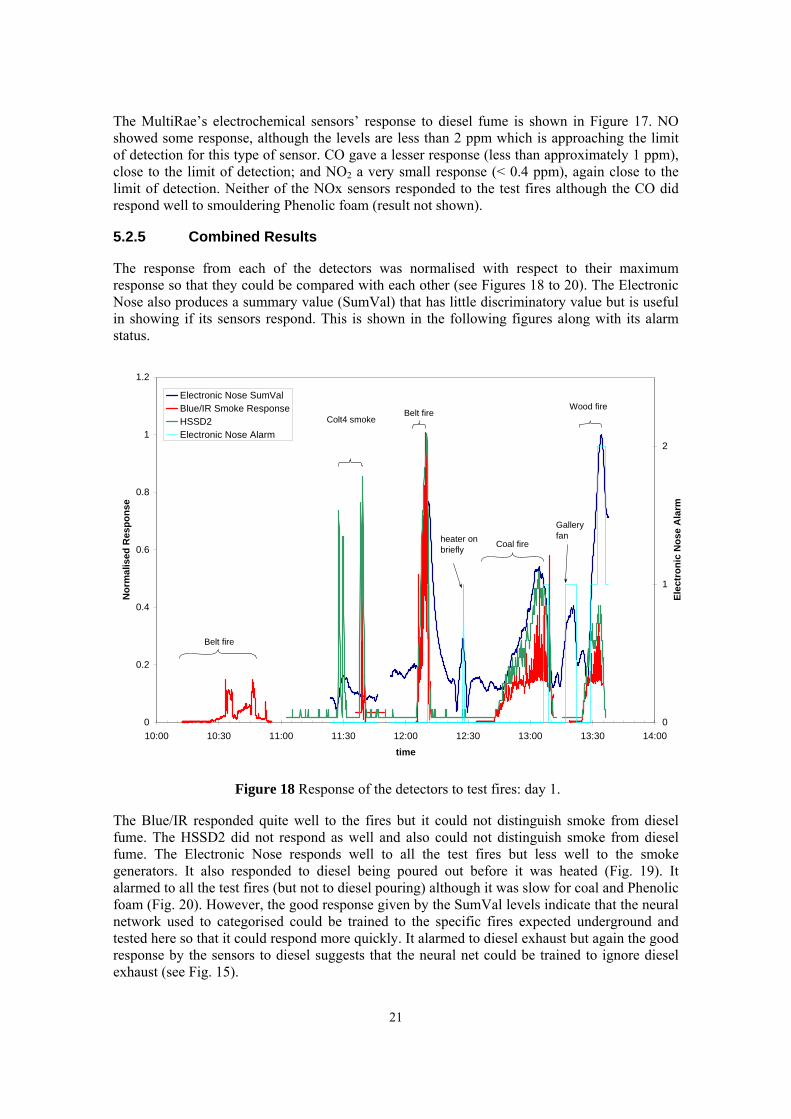
5.2.5 Combined Results
The response from each of the detectors was normalised with respect to their maximum response so that they could be compared with each other (see Figures 18 to 20). The Electronic Nose also produces a summary value (SumVal) that has little discriminatory value but is useful in showing if its sensors respond. This is shown in the following figures along with its alarm status.
Figure 18 Response of the detectors to test fires: day 1.
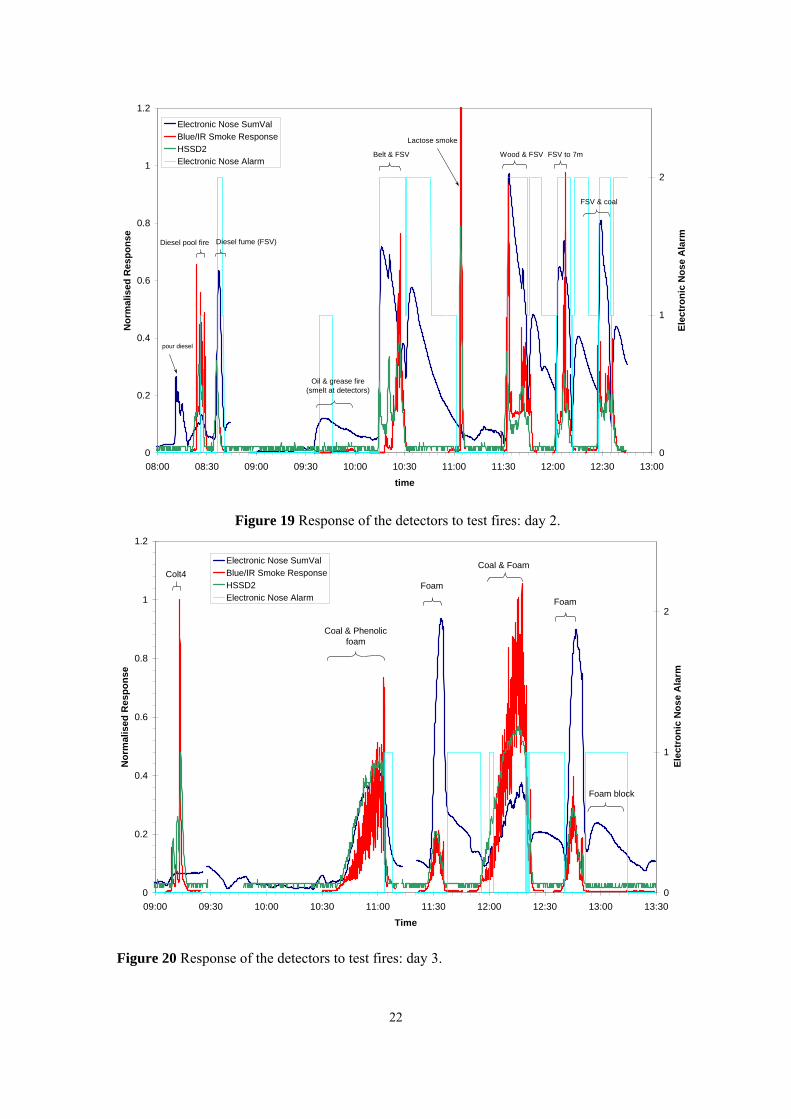
The Blue/IR responded quite well to the fires but it could not distinguish smoke from diesel fume. The HSSD2 did not respond as well and also could not distinguish smoke from diesel fume. The Electronic Nose responds well to all the test fires but less well to the smoke generators. It also responded to diesel being poured out before it was heated (Fig. 19). It alarmed to all the test fires (but not to diesel pouring) although it was slow for coal and Phenolic foam (Fig. 20). However, the good response given by the SumVal levels indicate that the neural network used to categorised could be trained to the specific fires expected underground and tested here so that it could respond more quickly. It alarmed to diesel exhaust but again the good response by the sensors to diesel suggests that the neural net could be trained to ignore diesel exhaust (see Fig. 15).
0
0.2
0.4
0.6
0.8
1
1.2
10:00 10:30 11:00 11:30 12:00 12:30 13:00 13:30 14:00
time
Nor
mal
ised
Res
pons
e
0
1
2
Elec
tron
ic N
ose
Ala
rm
Electronic Nose SumValBlue/IR Smoke ResponseHSSD2Electronic Nose Alarm
Belt fire
Colt4 smokeBelt fire
Coal fire
Wood fire
heater on briefly
Gallery fan
?
22
Figure 19 Response of the detectors to test fires: day 2.
Figure 20 Response of the detectors to test fires: day 3.
0
0.2
0.4
0.6
0.8
1
1.2
08:00 08:30 09:00 09:30 10:00 10:30 11:00 11:30 12:00 12:30 13:00
time
Nor
mal
ised
Res
pons
e
0
1
2
Elec
tron
ic N
ose
Ala
rm
Electronic Nose SumValBlue/IR Smoke ResponseHSSD2Electronic Nose Alarm
Diesel pool fire Diesel fume (FSV)
Oil & grease fire (smelt at detectors)
Belt & FSV
Lactose smoke
Wood & FSV FSV to 7m
FSV & coal
pour diesel
0
0.2
0.4
0.6
0.8
1
1.2
09:00 09:30 10:00 10:30 11:00 11:30 12:00 12:30 13:00 13:30
Time
Nor
mal
ised
Res
pons
e
0
1
2
Elec
tron
ic N
ose
Ala
rm
Electronic Nose SumValBlue/IR Smoke ResponseHSSD2Electronic Nose Alarm
Colt4
Coal & Phenolic foam
Foam
Coal & Foam
Foam
Foam block

23
6 UNDERGROUND TRIALS
6.1 INTRODUCTION
The underground trials were again carried out at the out-bye conveyor drive roadway below ground at Welbeck Colliery. The detectors were situated opposite a conveyor carrying coal out of the mine. This site was chosen because instruments did not need to be intrinsically safe here but its dust levels matched conditions close to the coalface. The encased detectors and laptop were placed next to each other at the side of the roadway at height of about 1.5 m (see Figure 21). The laptop was also placed inside a clear plastic bag (Fisherbrand hazardous waste bag, autoclavable up to 145°C) to keep out dust but allow access to the keyboard, as it was to be used at frequent intervals.
Figure 21 Detectors in the underground roadway towards the end of the underground trials. The laptop in its bag and opened case is on the left, followed by the Blue/IR, the Electronic Nose
and the HSSD2 in their sealed cases. Airflow was from the left.
The detectors were used for a total of 29 days but results were downloaded on days 1, 2, 8, 15 and 29 which allowed the sampling interval for the detectors to be altered as shown in Table 4.
Unfortunately proper smoke tests using a Colt4 smoke generator could not be carried out underground for safety reasons but small-scale smoke tests were attempted using MSA smoke tubes. These produced small enough quantities of smoke not to cause alarm downstream of the test site.
Additionally, respirable dust samples were taken and analysed to obtain a particle size profile.

24
Table 4: Detector sampling intervals. Visit 1 2 3 4 5
Day 1 1 - 2 2 - 8 8 - 15 15 - 29 Date (Jan-Feb 2009)
13th 13th – 14th 14th – 19th 19th – 27th 27th – 10th
SamDetect 1s 1 s 30 s 30 s 30 s Monitair 1 s 1 s 10 s 10 s 30 s Stratos 5 s 2 m 10 m 10 m 20 m Respirable Dust Sample
n/a n/a n/a 367 m (on day 14)
n/a
6.2 RESULTS
6.2.1 Respirable Dust Sample
Two dust samples were taken but only one was during the period of the test. The respirable dust concentrations were 2.2 mg.m-3, on day 14, and 1.2 mg.m-3 after the test. Part of the first dust sample was dispersed in distilled water and NP40 wetting agent; a sample of the dispersion was examined under an optical microscope to determine an approximate size and distribution. The particles were then examined for particle size distribution using the Horiba LA950 laser diffraction instrument (fraction cell). Results are shown in Figure 1 and compare well with those found on previous tests.
6.2.2 Blue/IR HSSD
The response of the Blue/IR to coal dust over days 8 to 15 of the test is shown in Figure 22. Both the blue and IR signals appeared to oscillate between two levels of 800 and 1200 mV. This suggests two different dustiness conditions possibly associated with the nearby belt either carrying coal or being empty. These levels remained constant over the 29 days of the test suggesting that the Blue/IR’s optics were not damaged or coated by the airborne coal dust underground.
The measured smoke level had a base level of about 300 mV but there were frequent peaks rising to around 1500 mV and three peaks nearly reaching 2000 mV on January 22nd and 23rd indicating a particularly dusty episode. Apart from these three peaks the results from the rest of the test are the same.
25
0
500
1000
1500
2000
2500
19-Jan 20-Jan 21-Jan 22-Jan 23-Jan 24-Jan 25-Jan 26-Jan 27-Jan 28-JanDate
Blu
e/IR
Res
pons
e /
mV
IR SignalBlue SignalSmoke level
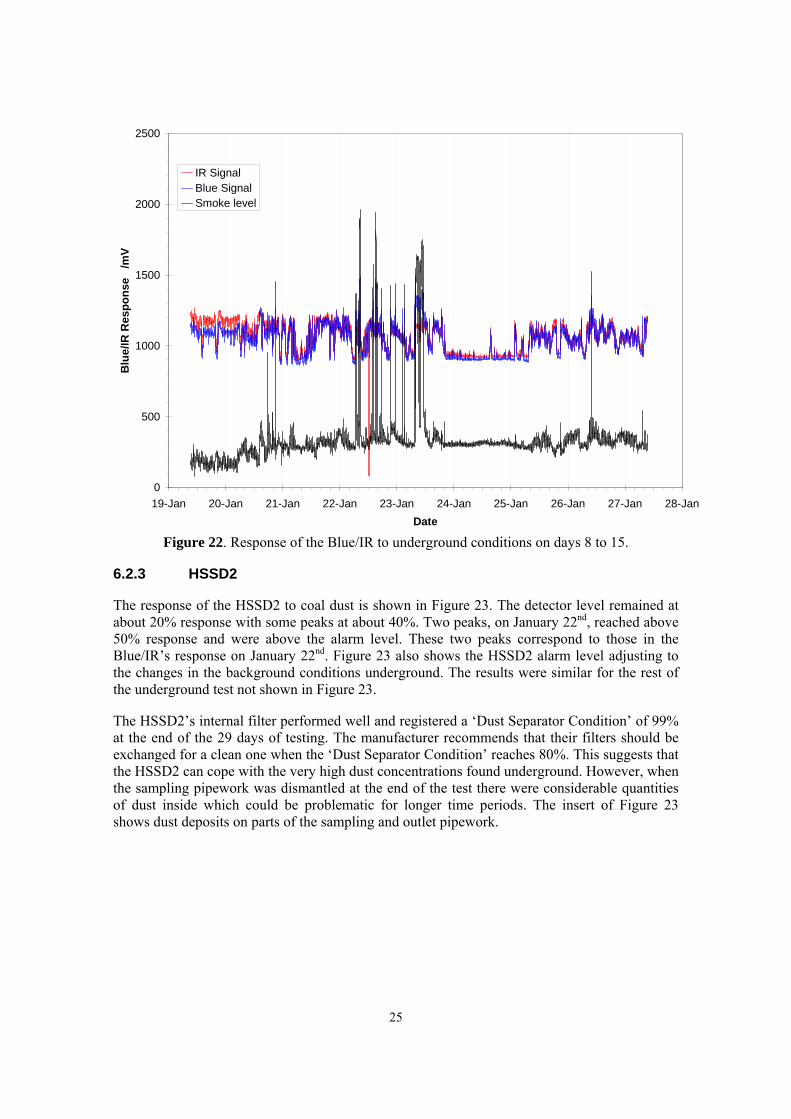
Figure 22. Response of the Blue/IR to underground conditions on days 8 to 15.
6.2.3 HSSD2
The response of the HSSD2 to coal dust is shown in Figure 23. The detector level remained at about 20% response with some peaks at about 40%. Two peaks, on January 22nd, reached above 50% response and were above the alarm level. These two peaks correspond to those in the Blue/IR’s response on January 22nd. Figure 23 also shows the HSSD2 alarm level adjusting to the changes in the background conditions underground. The results were similar for the rest of the underground test not shown in Figure 23.
The HSSD2’s internal filter performed well and registered a ‘Dust Separator Condition’ of 99% at the end of the 29 days of testing. The manufacturer recommends that their filters should be exchanged for a clean one when the ‘Dust Separator Condition’ reaches 80%. This suggests that the HSSD2 can cope with the very high dust concentrations found underground. However, when the sampling pipework was dismantled at the end of the test there were considerable quantities of dust inside which could be problematic for longer time periods. The insert of Figure 23 shows dust deposits on parts of the sampling and outlet pipework.

26
0
10
20
30
40
50
60
70
80
90
100
20-Jan 21-Jan 22-Jan 23-Jan 24-Jan 25-Jan 26-Jan 27-Jan 28-JanDate
Res
pons
e %
Detector levelAlarm level
Figure 23. Response of the HSSD2 to underground conditions on days 8 to 15.
6.2.4 Electronic Nose
0
20
40
60
80
100
120
140
160
180
200
19-Jan 20-Jan 21-Jan 22-Jan 23-Jan 24-Jan 25-Jan 26-Jan 27-Jan 28-JanTime
Res
pons
e
0
100
200
300
400
500
600
700
Aro
mat
ics
resp
onse
.
CO (smouldering) flammables (alkanes C1-C5) (sm fossil fuel)
H2 (smouldering) aromatics HC (sm cellulose), NOx, ozone (high temp fire)
SO2 (burning rubber diesel), CO (sm.) Aromatics (sm cellulose), NOx HCN (high temp fire or plastics)
Figure 24. Response of the Electronic Nose to underground conditions on days 8 to 15.

27
The response of the individual sensors in the Electronic Nose to coal dust is shown in Figure 24. The sensors responsive primarily to CO, H2, SO2 and flammables remain below 20 mV, the aromatics HC sensor between 60 and 120 mV and the aromatics NOx sensor between 300 and 600 mV. This last sensor produces levels considerably higher than those measured above ground (Figs 16 and 17). The most interesting feature is the step change, most noticeably in the H2 (green) sensor response. This occurred throughout the test usually once or twice a day. The regular shape and size of this disturbance suggests that it is due to emissions from some equipment upstream of the detectors. The most likely possibility is due to a battery charging station where the batteries that power the electric FSV are charged. The results from the rest of the underground test are the same.
6.2.5 Smoke Tests
Smoke testing was carried out using small MSA smoke tubes to check that the detectors can still respond to smoke against the background of dust underground (see insert Fig. 25). Unfortunately the high ventilation air speeds carried away the small smoke plumes from these tubes, missing the detectors unless they were held at the detectors’ inlets. For example none of the detectors responded to smoke at a distance of 200 mm. The responses are shown in Figures 25 to 27.
Figure 25. Response of the HSSD2 to smoke from an MSA smoke tube (see insert) injected into the sampling pipe.
0
10
20
30
40
50
60
70
80
90
100
9:24 9:27 9:30 9:33 9:36 9:38 9:41 9:44
Time
Res
pons
e %
Smoke levelAlarm level
Smoke tube
28
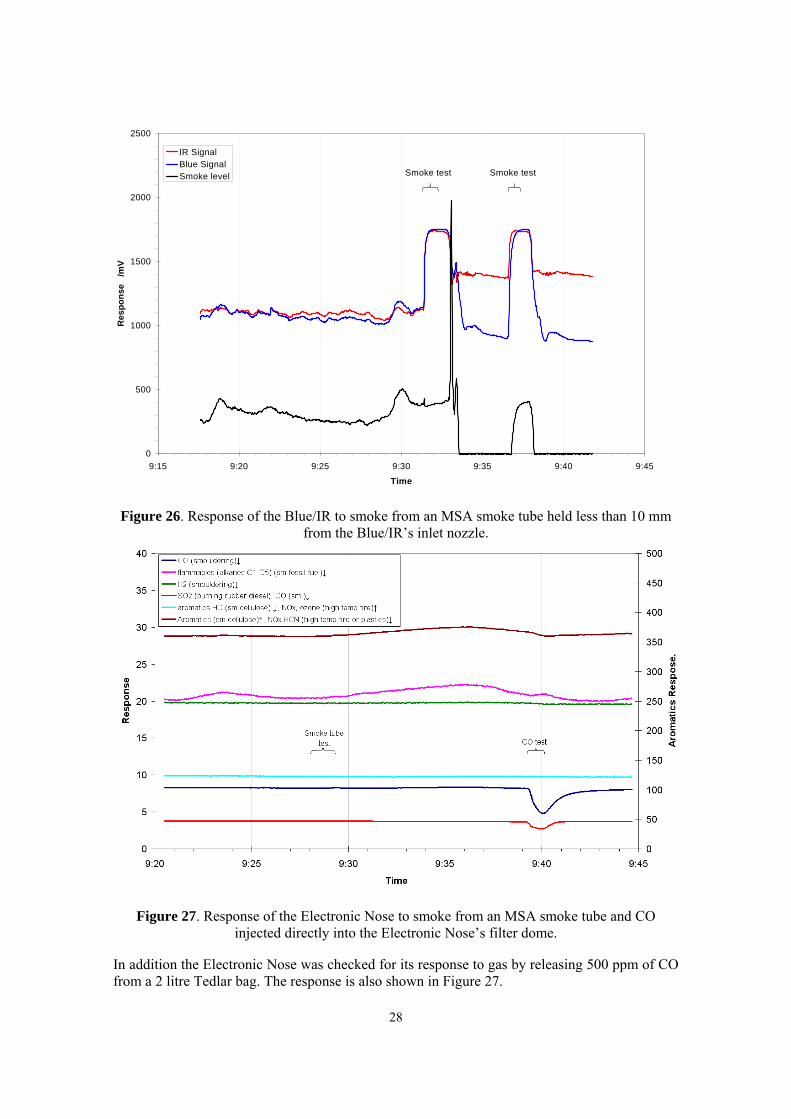
Figure 26. Response of the Blue/IR to smoke from an MSA smoke tube held less than 10 mm from the Blue/IR’s inlet nozzle.
Figure 27. Response of the Electronic Nose to smoke from an MSA smoke tube and CO injected directly into the Electronic Nose’s filter dome.
In addition the Electronic Nose was checked for its response to gas by releasing 500 ppm of CO from a 2 litre Tedlar bag. The response is also shown in Figure 27.
0
500
1000
1500
2000
2500
9:15 9:20 9:25 9:30 9:35 9:40 9:45
Time
Res
pons
e /
mV
IR SignalBlue SignalSmoke level Smoke test Smoke test

29
Both the Blue/IR and the HSSD2 responded to smoke but the Electronic Nose did not. The HSSD2 smoke level exceeded the alarm level. The blue and, unexpectedly, the IR signal responded to the smoke in such a way that the smoke level did not respond over the normal background level until the smoke was removed. After this the IR signal remained high suggesting that the optics had become coated. Once the detectors were removed from the mine and cleaned, the signals returned to their normal levels.
The Electronic Nose did not respond to the smoke tubes although it had previously done so for a simple laboratory test. It did respond to CO, with the biggest response from those sensors associated with CO (dark blue and red in Fig. 27).
6.2.6 False Alarms
A major problem with the present fire detector used underground, the Fidesco, is that it tends to produce many false alarms. A replacement fire detector needs to perform better than this.
The Blue/IR logged many large peaks in its smoke level (see Fig. 22). The smoke level recorded on 22nd January is plotted with some examples of the response to test fires in Fig. 28. The timescales have been altered so that the data can be plotted onto the same graph. The underground response has two large peaks that exceed the level of response to test fires and many smaller peaks that are of comparable response. This means that the Blue/IR would not be able to distinguish fires from normal conditions in a coal mine.
Figure 28. Response of the Blue/IR’s smoke signal to underground conditions and two test fires.
Similarly, the HSSD2’s response to test fires is compared to its response underground in Fig. 29. Most of the test fires produce a bigger response than that from underground conditions but they are still of comparable size. This means that the HSSD again would have difficulty
0
500
1000
1500
2000
0:00 2:00 4:00 6:00 8:00 10:00 12:00 14:00 16:00 18:00 20:00 22:00 0:00Time
Smok
e R
espo
nse
/m
V
Underground ResponseTest Fires Response
Belt fire Coal & phenolic foam fire

30
distinguishing fires from normal conditions in a coal mine until those fires are very well established.
Figure 29. Response of the HSSD to underground conditions and test fires.
The responses of the sensors in the Electronic Nose to conditions underground are shown in Figure 24. The alarm response of the neural network for the same period is shown in Fig. 31. The neural network categorised many pre-alarms (level 1) and two alarms (level 2) from the response of the sensors. The only alarms activated were those associated with the step change most noticeable from the response of the hydrogen sensor. This is likely to be due to emissions from some equipment, most likely hydrogen emission from battery charging that is carried out underground at Welbeck. Its regular shape suggests, however, that the neural network can be trained to ignore it. Once trained, the Electronic Nose should, hopefully, no longer generate these false alarms.
10
20
30
40
50
60
70
Time
Res
pons
e
Test Fire ResponseUnderground Response

31
Figure 30. Response of the Electronic Nose alarm level and H2 sensor to underground conditions.
0
0.5
1
1.5
2
19-Jan-09 20-Jan-09 21-Jan-09 22-Jan-09 23-Jan-09 24-Jan-09 25-Jan-09 26-Jan-09 27-Jan-09 28-Jan-09Date
Sam
dete
ct a
larm
leve
l
0
10
20
30
40
50
60
70
H2 (
smou
lder
ing)
leve
l
Samdetect AlarmH2 (smouldering)

32
7 CONCLUSIONS
The commercial detectors were not designed for use in coal mines, therefore their performance in these tests should not be taken to be indicative of their performance in their intended environment.
The HSSD1 responded rapidly to all fires. However, it could not distinguish smoke from coal dust and diesel fume. The use of a particle size selector, a cyclone, having a cut-off (d50) below 0.5 µm reduces the interference from coal dust. A simple laboratory test showed that the cyclone successfully distinguished coal dust from smoke but this was not tested against the standard fires in the Training Gallery at Welbeck. However, the small cyclone required a large, powerful pump to maintain the airflow through the HSSD1, which complicates its use in the mine environment and hinders commercialization of the system. For this reason no further tests were carried out upon the HSSD1.
The Blue/IR HSSD was found to respond well to all fires except for the smouldering diesel/oil fire, which only produced a small response, and the smouldering Phenolic foam that produced no smoke and therefore gave no response. It could not distinguish smoke from diesel fume. However, it was found to be too sensitive to the high levels of coal dust underground and so would not be able to distinguish smoke from coal dust (Fig. 28). Additionally, there is not yet an intrinsically safe version of the Blue/IR in production, which would make its conversion to a pit-worthy model difficult.
The HSSD2 was found to be less responsive to both fires and to coal dust than the Blue/IR. It responded to all fires except for the smouldering diesel/oil fire and the smouldering Phenolic foam but it failed to alarm to 68% of the test fires although it maybe possible to adjust its sensitivity. It could not distinguish smoke from diesel fume. However, its response to fires compared to its response to coal dust was slightly better than the Blue/IR’s (compare Fig. 29 to Fig. 30). Its internal filter, used to discriminate smoke from coal dust, did not clog even after 29 days underground, although there was evidence of coal dust build-up within the sampling pipe work that could potentially cause problems with longer exposure underground. Additionally, there is already an ATEX instrument based on the HSSD2, certified for use in hazardous areas Zones 1 and 2 that should help conversion to a pit-worthy model.
The Electronic Nose was found to be very responsive to test fires but less responsive to the smoke generators. This is because it measures gaseous products of combustion rather than particulate matter. It had a large response and frequently alarmed while underground. However, these alarm responses are associated with the step change most noticeable with the response from the hydrogen sensor. This is likely to be due to emissions from some equipment but its regular shape suggests that the neural network can be trained to ignore it. Similarly, the Electronic Nose alarmed to diesel exhaust but again the response of its sensor to diesel emissions suggests that the neural net can be trained to ignore this. This is an advantage over the other detectors because an additional NO detector would not be required to distinguish diesel exhaust fume. Finally, there are versions of the Electronic Nose that have been designed to operate in hazardous areas with ATEX certification that should help conversion to a pit-worthy model.
Based upon these conclusions, the most promising detector for a potential advanced mine fire detection system is the Electronic Nose. However, this depends upon the neural network being successfully trained to ignore diesel exhaust fume and the regular step events noticed in its response underground. Once retrained the Electronic Nose would need to be re-tested against

33
the test fires, underground in other coal-mines and in areas near equipment other than battery charging stations.
The work described in this report was presented at the international fire detection conference AUBE ‘09 in September 2009 (Hemingway et al, 2009).

34
8 RECOMMENDATIONS
Further work is required to transfer knowledge in the following areas in order to facilitate the adoption of Electronic Nose technology in UK underground coal mines: 1) Discussions with the manufacturer and representatives of the mining industry on:
a) reduction of false alarms due to possible battery charging or other underground activities;
b) reduction of false alarms due to diesel exhaust; c) ATEX certification.
2) Experimental work (laboratory and field) to provide application specific knowledge for the adaptation of the detector for mines use, incorporating modifications from (1) above, ie: a) Further fire tests (eg conveyor belt and coal) and diesel exhaust tests to improve the
neural network classification; b) exploration of methods to test the detector underground by simulating fire while in the
presence of background coal dust; c) underground tests in various collieries to test general application of the method.

35
9 REFERENCES
Dowker K P and Fall M (2005) Development of a procedure for cleaning and calibrationg real time photometric aerosol monitors. HSL Report FMS/04/10 Edwards J C, Franks R A, Friel G F, Lazzara C P, Opferman J J (2000). Mine fire detection in the presence of diesel emissions J. Mine Ventilation Soc. of South Africa. April/June 2000, 66-71 Edwards J C, Franks R A, Friel G F, Lazzara C P, Opferman J J (2002). In mine evaluation of discriminating mine fire sensors. Proc. North American/9
th US Mine Ventilation Symp.,
Kingston, Ontario. June 2002. ed. De Souza E. A A Balkema Publishers., Lisse. Pp 527-532. Franks RA; Friel GF; Edwards JC; Smith AC In-mine evaluation of smart mine fire sensor 2008 SME Annual Meeting and Exhibit, February 24-27, Salt Lake City, Utah, USA. Preprint 08-053 Gussman R A, Kenny L C, Labickas M and Norton P (2002). Design, calibration and field test of a cyclone for PM1 ambient air sampling. Aerosol Sci. & Tech. 36: 361–365. Hambleton R T, Clark R D R, Plant I J, Walsh P T and Scott P B (1997). Placement and performance of fire detection equipment in underground mines. Proc. of 27th Int. Conf. of Safety in Mines Research Institutes, New Delhi, India, 1997. Hemingway M A and Walsh P T (2005) Development of an advanced fire detector for underground coal mines – Final Report. HSL Report FMS/05/03 Hemingway M, Walsh P, Williams M, Hunneyball S, Jobling S (2007) Fire detection in underground coal mines Proceedings of Interflam 2007, 1665-1667. Hemingway M, Walsh P, Williams M, Hunneyball S, Jobling S (2009) An improved fire detector for use in underground coal mines Proceedings of AUBE’09 14th International Conference on Automatic Fire Detection, 2 (2009), 237-244. Litton C D (2002) The use of light scattering and ion chamber responses for the detection of fires in diesel contaminated atmospheres. Fire Safety Journal. 37, 409-425. Royals B (2001). Investigation of fumes produced by a heated conveyor belt. Report carried out for UK Coal Mining Ltd., Kellingley Colliery. TES Bretby Report No TES/01/384. TES Bretby. mine fire detector final report -V4.doc 29.

UK Coal (2002). Products of Combustion Questionnaire. Attachment No 4 to Minutes of 2nd Meeting of HSE/HID Mine Fire Detection Working Group. 5 Feb. 2002. Walsh P T and Hunneyball S R (2002) A review of early warning fire detection techniques for use in underground mines. HSL Report FMS/02/09.
Published by the Health and Safety Executive 03/12

Mine fire detectorCombined smoke and NOx/CO sensors
Health and Safety Executive
RR918
www.hse.gov.uk
This report describes laboratory and field tests performed on four fire detectors in mine roadways both above and below ground. All four were commercial detectors that were not designed for use in coal mines. The research was jointly sponsored by HSE and UK Coal. The latter providing sites and appropriate instrumentation for the detectors that were supplied by their manufactures.
The objectives of the research were two fold:
1 To explore the latest technological developments in fire detectors to improve the management of detecting fires at the earliest opportunity.
2 To evaluate the use of detectors underground based on commercial high-sensitivity smoke and gas sensors having the potential for improved performance over currently used fire detectors.
The four detectors used in the research were an optical High Sensitive Smoke Detector (HSSD), two dual wavelength blue/infrared optical HSSD provided by different manufacturers, and an Electronic Nose detector.
The Electronic Nose detector was found to be the most responsive to fire tests performed in a surface underground gallery. The underground tests indicated it also had a large response to the presence from diesel exhaust and hydrogen emissions from battery charging.
This report and the work it describes were funded by the Health and Safety Executive (HSE). Its contents, including any opinions and/or conclusions expressed, are those of the authors alone and do not necessarily reflect HSE policy.