mind the gap_explaining the variation between and within schools in norrköping
TRANSCRIPT

1
Mind the gap: explaining the variation between and
within schools in Norrköping
Kenisha S. Russell Jonsson
PhD. Candidate in Sociological Research
Department of Sociology
Essex University
https://sites.google.com/site/russelljonsson/
Tel: +46760648592 email:[email protected]

2
Contents Huvudsakliga fynd ................................................................................................................... 3
Key findings .............................................................................................................................. 4
Study limitations and suggestions for future analysis ........................................................... 5
1 Introduction ............................................................................................................................. 8
1.2 The case of Norrköping .................................................................................................... 10
1.3 Data .................................................................................................................................... 12
1.4 Dependent Variables ........................................................................................................ 13
1.5 Analytical strategy .............................................................................................................. 16
1.6 The advantages of using a multilevel model. ........................................................... 17
1.7 Model description: Overview of models on school and class performance ................ 18
2 Performance in Mathematics ................................................................................................. 20
2.1 Results for students taking Swedish............................................................................ 20
2.2 Results for students taking Swedish as a Second Language .................................... 25
3 Performance in English ......................................................................................................... 28
3.1 Results for students taking Swedish............................................................................ 28
3.2 Results for students taking Swedish as a second language ....................................... 32
4. Performance in Swedish as a native language ..................................................................... 35
5. Additional models ................................................................................................................ 39
6. Overall achievement ............................................................................................................. 40
7. Conclusion ............................................................................................................................ 52
8. Future analyses ..................................................................................................................... 53
9. References ............................................................................................................................ 54
10. Appendix ............................................................................................................................ 56

3
Huvudsakliga fynd
De genomförda analyserna indikerar att det i stort fanns små, ej signifikanta,
skillnader i studieprestationer mellan kommunala skolor i kärnämnena (matematik,
engelska och svenska) eller vad gäller genomsnittliga meritvärden.
Det var större, i högre utsträckning signifikanta, skillnader mellan klasser i
kärnämnena och genomsnittligt meritvärde. När det gäller individnivån, stod denna för den största variationen mellan elever i
studieprestationer i såväl kärnämnena som i genomsnittligt meritvärde.
Skillnader i prestation förklaras till stor del av:
Variabler på individnivå
- Kön, där pojkar presterar signifikant sämre än flickor i samtliga ämnen samt i
genomsnittligt meritvärde
- Elever med utländsk bakgrund som läser svenska som andraspråk presterar signifikant
sämre än elever med svensk bakgrund liksom de med utländsk bakgrund som läser
svenska som modersmål. Det är dock ingen skillnad i prestation mellan de med
europeiskt respektive icke-europeiskt ursprung som läser svenska som andraspråk.
Variabler på klassnivå
- Elevens ekonomiska situation, där elever vars familjer erhållit försörjningsstöd
åtminstone en gång under året före det som analyserats, har sämre betyg
- Elever med utländsk bakgrund som läser svenska som modersmål presterar signifikant
bättre än elever med svensk bakgrund i kärnämnena engelska, svenska och matematik.
Motsvarande skillnader återfinns dock inte när det gäller genomsnittliga meritvärden
mellan grupperna.
- Klassrummets sociala sammansättning – resultaten indikerar att både de med utländsk
och de med svensk bakgrund presterar sämre ju högre andel med utländsk bakgrund i
en klass. Även i klasser med hög andel social utsatthet presterar dock elever med
utländsk bakgrund bättre än elever med svensk bakgrund.
Variabler på skolnivå
- En stor andel elever med lågutbildade föräldrar och en hög andel elever med utländsk
bakgrund har bidragit till lägre prestation. Dessa variabler tycks dock förstärka
varandra.
Det tycks vara så att när väl elever placeras i svenska som andraspråk så fastnar de i denna
undervisningsform. Trots de negativa effekterna på prestation i andra ämnen går de inte vidare
till att läsa svenska som modersmål.
Ett viktigt resultat av analyserna är att det blir tydligt att elever inte presterar signifikant sämre
på grund av någon enskild faktor. Det är snarare en kombination av faktorer på individuell,
skol- och klassnivå som avgör en elevs resultat. Ett exempel på det är att elever med utländsk
bakgrund, som läser svenska som andraspråk presterar signifikant sämre jämfört med de som
läser svenska som modersmål. Skolor med hög andel elever som läser svenska som andraspråk
har också en totalt sett högre andel elever med utländsk bakgrund i klasserna. Detta verkar i sin
tur predicera sämre resultat hos såväl elever som läser svenska som andraspråk som de som
läser svenska som modersmål.

4
Key findings
Considering school variation, there are small, non-significant differences across the
core subjects (mathematics, English and Swedish) and grade point average
(meritvärde).
Considering class variation, there are larger more significant differences in the
achievement of students across the core subjects and grade point average.
Regarding the individual, this accounted for the largest variation in the achievement
of students across the core subjects and grade point average.
Differences in achievement has largely been explained by:
Variables at individual level
- Gender, whereby boys perform significantly worse than girls in all core subjects and in
overall student performance
- Students taking Swedish as a second language, whereby students with a foreign
background studying Swedish as a second language performed significantly worse
when compared to students taking Swedish as a native language. However, among
students taking Swedish as a second language, there is no difference in achievement
among European and Non-European students with a foreign background (i.e. the share
of Swedish born with foreign parents and the share of foreign born with foreign parents)
Variables at class level
- The student’s economic situation, whereby students whose families received social
benefits (försörjningsstöd) at least once in the year prior to the analysis had lower grades
- Foreign background, whereby students with a foreign background studying Swedish as
a native language outperformed native Swedish students across the core subjects, but
there is no significant difference in grade point average between the groups.
- Classroom social composition, whereby both non-native and native Swedish speakers
perform worse as the share of foreign students in a class increases. Non-native speakers
tend to perform better than native speakers in low socio-economic environments.
Variables at School level
- A high share of students with parents having low/no education and a high share of
students with a foreign background contributed to lower achievement. Although, it must
be said that these variables appear to inflate each other.
It seems that once students are placed in Swedish as a second language, despite the detrimental
relationship between this and their performance in other subjects, they do not progress to
Swedish as a native language.
Students do not perform significantly worse by virtue of any single factor. Instead, it seems to
be the interaction between individual, school and class level factors which determines a student
outcome. For e.g. students with a foreign background who take Swedish as a second Language
have significantly lower grades in comparison to Students with a foreign background who take
Swedish as a native Language. Moreover, schools that offered Swedish as a second language
had a higher proportion of foreigners per class and based on the results this leads to lower
performance among both native and non-native Swedish speakers.

5
Study limitations and suggestions for future analysis
The type, quality and quantity of data also needs to be reconsidered for any future analysis.
In this section both the limitations and some suggestions for future analysis is made.
Cross-sectional data
One of the main drawbacks of this analysis was the cross-sectional nature of the data. As
such the analysis was based on a single ‘cohort’ of students. The fact that they started their
education several years prior to the analysis means that the usefulness for predicting the
outcome of future students is somewhat diminished (Goldstein, 1997). Future studies would
therefore benefit from longitudinal data, whereby school performance may be judged over time.
An additional drawback related to the cross-sectional nature of the data, is the difficulty in
determining the direction of causality. For example, among students who have not fulfilled the
requirement to move on to high school, the question which remains is, whether this is due to
the fact that they have a high proportion of absences? Or is it that students who realize they
have not fulfilled the requirements to move on to high school, lost motivation and therefore
decided not to attend classes and as a consequence have a greater proportion of absences? With
the current data, it was not possible to determine causality. It would be easier to provide the
right type of assistance for students and provide practical courses of action for schools, parents
and policy makers alike if we had longitudinal data, and was able to determine causality and
pinpoint changes in student behaviour and performance.
Aggregated data
With regards to both the quality and the quantity of the data, a disadvantage of the current
analyses is the fact that the majority of the data was aggregated. Data at the individual level for
students and parents is required to improve the models. The current study had five individual
level explanatory variables: gender; an indicator for student’s mother-tongue; student’s year 6
result from the national exam in year 6; indicator for if student’s attended the same pre-school
and primary school and the proportion of absences. Therefore, the current analyses were largely
based on data aggregated at the school and class level. Although, there are still some missing
variables (for e.g. the quality of the teaching, teacher experience and qualification) which may
provide us with some insight into the achievement variation between and within schools. If the
aim is to focus on factors within the school system that can be changed from a policy
perspective, then this study has fulfilled that criterion to some extent. However, there are a

6
wide range of individual level factors that may have a significant impact on student performance
for which we have not accounted. For example, if students have family problems, which could
explain the high proportion of absences, which in turn could explain their performance1.
Individual data is therefore required to improve future studies.
Bigger data sets
Models may be improved by a bigger data set with more observations at the individual, class
and school levels. This could be achieved by using several cohort of students from the same
school, for example the results of year 9 students for the last 5 years. An advantage of this
method is that we would be able to examine changes in results over time. The optimal size of
the number of upper level entities (in this case, schools), is still in question given that there is
currently no consensus on the number of entities required for best model fit. The suggestion in
the literature is between 20 and 30 upper level entities is required to have enough variation.
(Kreft, Kreft, & de Leeuw, 1998).
Independent schools
The current analyses detailed the variation in student’s achievements only for municipal
controlled schools. Given that there are several privately run schools (friskolor) in Norrköping,
it would benefit society to also undertake analyses of the student performances within these
schools, as there are still many unanswered questions. Do communal schools perform better or
worse than independent schools? Whether they perform better or worse, the question that then
arises is, how can we account for the differences? The suggestion therefore for future analyses
is that we undertake a comparative analysis of the student achievement for communal versus
privately run independent schools.
Test-Retest
According to Goldstein, the only way one can really assert that school has had an impact
on learning is by examining the intake results and then assess how much school has contributed
to later achievements (Goldstein, 1997). Thus a suggestion for the improvement for future
studies could be the addition of background variables of students at intake or at an earlier point
in their studies. In that way one could explore the factors which may have affected their
1 This statement is to some extent a simplification. To say anything definitive about the chain of events described
here, both individual and longitudinal data is also required.

7
performance at that particular time point and this may assist in explaining what individual
factors may have contributed to better or worse performance throughout the period of schooling.
Other relevant variables
Based on discussions and a review of the data received for this analysis, it was unclear if
financial resources invested in schools produce improvements in student achievement.
Consequently there are two important variables that are missing from these analysis, the first is
the overall spending of the schools and secondly any additional subsidies received. Thus a
suggestion for future analysis is a clear accounting of how funds related within the school is
allocated.
Moreover, to have a more significant impact and in order for us to gain a more
comprehensive understanding of the factors affecting student performance, a wider more
relevant set of explanatory variables is required. Information which includes health assessments
of students, information on students family background, teacher education and experience,
school and class room evaluations, school spending etcetera.
8
1 Introduction
There is a general and widespread agreement that schools have an influence on student
achievement. Despite this, there is much debate on the specific factors within schools which
have an impact on student achievement, and of the factors identified the extent of their impact
(Rumberger & Palardy, 2004). It is this particular debate which has sparked the start of school
effectiveness research. School effectiveness research has been defined as a “… line of research
that investigates the performance differences between and within schools, as well as the
malleable factors that enhance school performance (usually using student achievement scores
to measure the latter)”(Visscher & Witziers, 2005).
The starting point of this research dates back to the publication of the ”Equality of
Educational opportunity” by James S Coleman et al. (1966). The report simply referred to as
the Coleman Report”, was commissioned by the United States Department of Health,
Education, and Welfare in response to provisions of the Civil Rights Act of 1964. The goal was
to assess the availability of equal educational opportunities for children of different race, color,
religion, and national origin. In this well-publicized and debated report, they concluded that the
socio-economic background of students had a more significant impact on achievement relative
to the impact of the schools which they attend. The publication of this report, which marked the
start of both a substantive and methodological debate and research in school effectiveness has
led to an extensive literature which has sought to identify and explain the main characteristics
of an effective school. These studies which has both an academic and policy focus has yet to
reach consensus. For instance, in a more recent study, Coleman has argued that the social
composition of the student body is more highly related to achievement, independent of the
student’s own social background, than is any [single] school factor” (James Samuel Coleman,
1990, p. 119). One might argue that the overarching goal of these studies is to find the right
combination of factors which will contribute to a more ‘equitable’ school system, with similar
achievement levels for all students. This is however not a simple task, given the aforementioned
disagreement for the heterogeneity between and within schools.
Thus far, the between school heterogeneity has been shown to be related to a wide range of
factors, some of these are based on:
(1) Individual characteristics (motivation; gender; students personal ability; relationship
with parents, family situation mental health and general wellbeing);
(2) School (class room size; school and classroom composition; teacher experience and
educational background; internal and external source of funding; opportunity for extra
educational support; geographic location; type of school; decision-making; homework);

9
(3) Family characteristics (educational background; family income; family size; order of
birth in the family, immigrant status; length of residence);
The list of factors which may impact a student achievement is lengthy (for a more extensive
list of individual, school and classroom factors which may impact student achievement (See for
e.g. Bosker & Scheerens, 1994; Rumberger & Palardy, 2004). Moreover, these factors
sometimes interact, whereby the combination of two or more characteristics may vary across
individuals. Moreover, the same combination may have different impact on different students
because of inherent individual qualities.
It is this inconsistency in the findings and the varying explanations which has been offered
that has contributed to the ongoing debate on how to improve achievement levels in schools
and have also spurred the development of school effectiveness research in Sweden.
In the Swedish context, this line of research has gained national attention for two reasons.
The first, is that Sweden has lost its international place as having one of the best school systems
in the world (measured by PISA, TMSS etc). Secondly, school which has long been viewed as
“the great equalizer”, that is, a place which in spite of gender, socioeconomic background,
ethnicity, home conditions and/or any of these combinations should provide a similar, if not the
same opportunities for all students. Yet, the variation in achievement between and across
schools points to a decline in equity (Böhlmark & Holmlund, 2012; J.-E. Gustafsson & Yang-
Hansen, 2009; J. Gustafsson & Yang Hansen, 2009; von Greiff, 2009). This is despite, the
many school reforms that have been undertaken to correct this by policy maker and through the
work of the Swedish National Agency for Education (Skolverket), which has sought to promote
equity in education. They have characterized an equitable school system as one in which
(Böhlmark & Holmlund, 2012; von Greiff, 2009) [Own translation]:
(1) The variation in results between students is small.
(2) The results between schools is small.
(3) The importance of a student’s socioeconomic background for their school results is
small.
(4) The importance of a student’s immigration background for school results is small.
(5) School segregation with regards to socio-economic and immigration background is
small.
(6) The importance of the individual student results with regards to the socio-economic
composition of the school and with regards to the immigrant composition at the school
is small.

10
The results from various reports has however indicated a wide variation in student
achievement within and between schools across Sweden, and has offered a wide range of factors
to explain these differences. von Greiff (2009) points to the decentralization of the school
system, with the shift from central government control to a system where the municipalities and
school leadership decides on the day-to-day running of the school, as an explanation for the
heterogeneity in achievement. Asserting further that after the 1991 municipal reforms resource
distribution to schools have lost priority when compared to other concerns, and this has
contributed to the quality of education (von Greiff, 2009). The view that the reform of the school
system which took place during the 1990s has had an impact on student achievement is shared
by many ((Björklund, Edin, Freriksson, & Krueger, 2004; Böhlmark & Holmlund, 2012; Östh,
Andersson, & Malmberg, 2013). The effect has however been interpreted in different ways.
Böhlmark and colleague, for example, argues that it is the interaction between family
characteristics, school reforms and wider societal changes that has led to the variation in
achievement among students (Böhlmark & Holmlund, 2012). On the other hand, for Östh et al.
(2013), school reform is a distal factor which provided students with school choice which in
turn seems to have contributed to segregation of student by ethnicity and socioeconomic status
and as a consequence to the increase in the between school variation in achievement.
With no consensus on the reason for the differences in achievement studies have argued for
the importance of smaller class size (Fredriksson, Oosterbeek, & Öckert, 2012); the subjectivity
of grade setting (Lindahl, 2007; Sandqvist, 2007); discrimination- with studies arguing that girls
and non-natives are given more generous grades ((Hinnerich, Höglin, & Johannesson, 2011;
Lindahl, 2007); family’s support and engagement with their children studies (Erikson, 2008;
Högdin, 2006), the effect of absences, the well-being and motivation of students; the role of the
school rector (Böhlmark, Grönqvist, & Vlachos, 2012); teachers experience and qualification
(Andersson, 2007; Jönsson & Rubinstein Reich, 2004) among many other factors.
1.2 The case of Norrköping
Norrköping is one of the 290 municipalities in Sweden that face the challenge of providing
students with equal educational opportunities. According to a national comparison of school
achievement and resource indicators across all the municipalities for the year 2013/2014 (SKL
2015), the municipality of Norrköping ranks 208 when both municipal and privately run schools
are considered. When only municipal schools are considered, the municipality ranks 237. In
2007/2008, an inspection by Swedish National Agency for Education concluded that the share

11
of students in primary schools who have passed all the courses necessary to attend high school
varies considerably between the schools2 in the municipality. This issue has not been resolved
and overall achievement among students in Norrköping has declined. The result from figure 1
below demonstrates the variation in achievement among school in the municipality.
The figure presents the grade point average for the spring term (2010-2014) across the 11
municipal schools. Overall, grade point average fluctuated across the schools during the period
in question. Between 2010 and 2014, there is a 1% decrease when the changes across all schools
are considered. There were 6 schools which had small increases ranging from 1-13%. Råssla
and Hultdal, had the highest percentage increase at 13% and 10% respectively. In contrast,
Borgsmo and Söderport had the largest percentage decline at 10% and 15% respectively. During
the four year period, the difference in grade point average between the school with the worst
performance and the best performance has also increased. In 2010, the difference in
performance was 12%, by 2014 this had doubled to 24%.
Figure 1. Grade point average (2010-2014) among Norrköping municipal controlled primary schools
2 Own translation. http://www.skolverket.se/om-skolverket/press/pressmeddelanden/2008/norrkoping-behover-
vidta-atgarder-for-att-forbattra-skolornas-resultat-1.79395
0
50
100
150
200
250
Grade point average (2010-2014)
2010 2011 2012 2013 2014

12
A recent study providing an in-depth qualitative analysis of the school results in
Norrköping (Andersson, 2015), has identified and described several groups, which are at risk
for long-term unemployment, psychological ill-health and later life difficulties, arising from
low educational achievements. The results from that study, has further underscored the
importance of gaining a thorough understanding of the determinants of school achievements.
This is the means through which school achievements may be improved and the necessary
changes undertaken to the current school system so as to provide ‘equitable’ outcomes for all
students, despite gender, socio-economic background, immigration history, geography or other
factors. Building on earlier qualitative studies in the municipality which has identified several
explanatory factors related to student performance, the aim of this study is to:
(1) Assess how much the factors identified have contributed to the variation in the results
between communal schools in the municipality
(2) Assess how much the factors identified have contributed to the variation in the results within
communal schools in the municipality
1.3 Data
The data for this analysis was taken from several sources. From the municipal database
(hypernet) anonymized individual level demographic and school achievement data, of all 9
grade students who were registered in one of the 11 municipal primary schools in the autumn
of 2014. To this data, school level information which was taken from The Swedish National
Agency for Education (Skolverket) was also added. Moreover, aggregated information at the
school and class level about the parents (parents’ educational level, an indicator for immigrant
status and the length of time they have resided in Sweden and their economic situation i.e.
whether or not they are in receipt of any social benefits, their employment status) was also
added by the National Statistics Office (SCB). After initial data preparation, the final sample
was 960 students, within 38 classes across 11 schools. Of these, 781 students took Swedish as
a native language, while 179 took Swedish as a Swedish second language. A more fine grained
breakdown of the various languages spoken by the students may be found in the appendix (Table
A11). The average grade 9 had approximately 87 students. The school with the smallest grade
9 had 46 students, while the largest had 151. The number of classes per school ranged from 2
to 6, with an average class size of approximately 26 students. The smallest class had 15 students
(Navesstadskolan), while the largest class had 40 students (Borgsmoskolan). Of the 11 schools
in the data only 8 had classes with students taking Swedish as a second language. The 3 schools

13
in which there were no students taking Swedish as a second language were Råsslaskolan,
Vikbolandsskolan and Mosstorpskolan.
1.4 Dependent Variables
The dependent variable used here is students’ achievement in several core subjects
(Mathematics, English, Swedish and Swedish as a second language) and grade point average,
as measured during the autumn semester (2014) for students in year 9. It should be noted that
these are not the students’ final grades. For the core subjects, students are scored on a scale
ranging from 0 to 203 for all outcomes. Meanwhile the grade point average 4 ranges from 0-
320. The scores have been treated as a continuous variable in the multilevel models with higher
scores indicating a higher knowledge and an overall better result. Table 1 below, provides a
description of the variables included in this analysis. The variables that have been included in
this analysis have largely been based on data availability, the finding from the earlier mentioned
qualitative study by Andersson (2015) and the general literature which has examined various
aspects of school effectiveness.
3 In the new grading system this is equivalent to a grade of F to A. With F indicating that a student has failed the course. 4 The grade point average may be calculated by summing the 16 best grades for each student. According to the new system these are: A=20, B=17.5, C=15, D=12, 5 E=10 and F= 0. The grades according to the old grading system is MVG=20, VG=15 and G=10.

14
Table 1. Variable Description
Variable Variable Description
Outcome Measures
Grade point average(meritvärde) The grade point average for primary schools (grundskolans eller specialskolans) is created by summing the
students 16 best final grades. The grade according to the old grading system is MVG=20, VG=15 and G=10.
The grade point average may be calculated according to the new by summing the value of each given grade:
A=20, B=17, 5, C=15, D=12,5 E=10 and F= 0.( For more information see www.skolverket.se)
Mathematics Course grade as at Autumn 2014. They have been designated as A=20, B=17, 5, C=15, D=12, 5 E=10 and F= 0
according to the new school laws (www.skolverket.se). In all models they are entered as a continuous measure.
English Course grade as at Autumn 2014. They have been designated as A=20, B=17, 5, C=15, D=12, 5 E=10 and F= 0
according to the new school laws (www.skolverket.se). In all models they are entered as a continuous measure.
Swedish Course grade as at Autumn 2014. They have been designated as A=20, B=17, 5, C=15, D=12, 5 E=10 and F= 0
according to the new school laws (www.skolverket.se). In all models they are entered as a continuous measure.
Individual level
Boy Dichotomous variable coded 0=girl and 1=boy.
Non-native speaker Dichotomous variable 0=Native Swedish speaker, 1=non-native Swedish speaker. This is created from
information based on each student’s mother-tongue. In some analyses this category has been further divided to
indicate whether this is European or non-Europeans (see Appendix Table A11).
Absences This is a measure of the proportion of absences by individual level students. The variable has been coded as less
than 5% (ref.), 5-10%,10-20%,20-50%, 50% and more (Non-linear effect).
Year 6 school
Results from National Exams
Indicator for the school students attended in Year 6.
Indicator for the students results in national exams (Math, English and Swedish) taken in Year 6
Class level
Low/unknown parental education Combined share of parents with an unknown education level and the share of parents a primary education level
within a class (linear effect),
Share of foreign language speakers Indication of the share of non-native speakers in a class. This is a non-linear variable coded as 0/.425=1
.426/.60=2 .601/max=3.
Share foreign background This indicator is created by combining the share of Swedish born with foreign born parents and the share of
foreign born with foreign parents.

15
Human development Index(hdilg)
The Human Development Index (HDI) is a summary measure of average achievement in key dimensions of
human development: a long and healthy life, being knowledgeable and have a decent standard of living. The
HDI is the geometric mean of normalized indices for each of the three dimensions.
http://hdr.undp.org/en/content/human-development-index-hdi
Share of students with 2 parents having job
Social Benefits
Indication of the share of students in a class with both parents working.
Indication of the share of students with families that has received social benefits at least once in the year prior to
the analysis (linear effect).
School level
Low/unknown parental education Combined share of parents with an unknown education level and the share of parents a primary education level
within a school (linear effect).
Share of students with two parents from abroad Share of Swedish born students' with foreign born parents and foreign born students with foreign parents within
a school (linear effect).
Table 2. : List of school codes used in analysis
Borgsmoskolan = 1 Mosstorpskolan=7
Djäkneparksskolan=2 Navesstadskolan=8
Ektorpsskolan=3 Råsslaskolan= 9
Enebyskolan=4 Söderporten 4-9=10
Hagaskolan=5 Vikbolandsskolan=11
Hultdalsskolan=6

16
1.5 Analytical strategy
Analysis for this report was undertaken through multilevel modeling. This is a statistical
method which allow for the examination of the contextual (school characteristic) and individual
contributions (students’ characteristics) ton student achievement simultaneously. By taking into
account the multilevel structure of the data, it is possible to reduce both conceptual5 and
statistical issues. If the contextual level of the data is ignored, i.e. the effect of the school
environment on student’s achievements, we will be excluding the effect of school on learning.
Thus, by aggregating the data to focus on the contextual analysis and ignoring the individual
level, this could potentially lead us to draw the wrong conclusions e.g. the ecological fallacy.
On the other hand, if the focus of the analysis is based only on the individual student
characteristics, the analysis would also be flawed. By ignoring the contextual level, and
conducting the analysis only at the individual level, this could lead to an underestimation of the
standard errors and result in invalid statistical tests. Thus, one can say that a multilevel model
has two parts. These may be described as the fixed part of the model which specifies the overall
mean relationship between the response and the predictor variables; that is, the relationship that
applies in the average school. The second part of the model, is the random part of the model,
this specifies how the school and school specific relationships differ from this overall mean
relationship. Below is a diagram6 of the proposed model (students within classes within
schools). We can formalize the model as follows:
Yijk=β0 + vk + ujk+eijk
Vk ~ N(0,σ2v)
ujk ~ N(0,σ2u)
eijk ~ N(0,σ2e)
Where Yijk is the observed grades for student i from the autumn term 2014 in class j in
school k, β0 is the mean response across all schools, vk is the effect of school k, ujk is the
effect of class j within school k, and eijk is the residual error term. The random effects and
5 Within a multilevel framework, where children are nested in schools, the argument is simply that the residual
variance is partitioned into a between-school component (the variance of the school-level residuals) and a
within-school component (the variance of the child-level residuals). The school residuals, often called ‘school
effects’, represent unobserved school characteristics that affect child outcomes. It is these unobserved variables
which lead to correlation between outcomes for children from the same school.
http://www.bristol.ac.uk/cmm/learning/multilevel-models/what-why.html 6 http://www.bristol.ac.uk/cmm/learning/multilevel-models/data-structures.html

17
residual errors are assumed independent of one another and normally distributed with
zero means and constant variances.
Figure 2. Classification of students within classes within schools
1.6 The advantages of using a multilevel model.
There are several advantages in using a multilevel model for analysing student achievement
within schools (Aitkin & Longford, 1986; Bosker & Scheerens, 1994; Goldstein, 1997;
Goldstein et al., 1993; Sandoval-Hernandez, 2008). A few of these are listed below:
(1) Correct inferences: Traditional multiple regression techniques treat the units of analysis as
independent observations. One consequence of failing to recognise hierarchical structure of the
data is that the standard errors of regression coefficients will be underestimated, leading to an
overstatement of statistical significance. The standard errors for the coefficients of higher-level
predictor variables will be the most affected by ignoring grouping.
(2) Substantive interest in group effects: In many situations a key research question concerns
the extent of grouping in individual outcomes, and the identification of ‘outlying’ groups. In
evaluations of school performance, for example, interest centers on obtaining ‘value-added’
school effects on pupil attainment. Such effects correspond to school-level residuals in a
multilevel model which adjusts for prior attainment.
(3) Estimating group effects simultaneously with the effects of group-level predictors: An
alternative way to allow for group effects is to include dummy variables for groups in a
traditional (ordinary least squares) regression model. Such a model is called an analysis of
variance or fixed effects model. In many cases there will be predictors defined at the group

18
level, for example, type of school (independent vs. communal schools). In a fixed effects model,
the effects of group-level predictors are confounded with the effects of the group dummies, that
is, it is not possible to separate out effects due to observed and unobserved group characteristics.
In a multilevel (random effects) model, the effects of both types of variable can be estimated.
1.7 Model description: Overview of models on school and class performance
The results of the analyses have been divided into four main sections, with each section
describing the results as it pertains to each of the core subjects (Mathematics, English, and
Swedish) and the grade point average in the 11 communal run schools. The results are
organized as follows:
The first section presents the predicted results for students in each of the core subjects. These
results are presented for students who study Swedish and those studying Swedish as a second
language. Within this section of the report, there are five models for each of the core subjects,
with the models being assessed in stepwise procedure. Model 1, is a null model (that is, a model
without explanatory variables) and this is presented graphically. From this model, one is able
to assess the mean performance of each school and class without consideration for any
individual, school or class level variables. This is followed by model 2, individual level
characteristics (gender and non-native speaker) are tested. In Model 3, school level
characteristics (the share of parents with low/unknown education7 and the share of students
with a foreign background) are added to the model. In the fourth model class indicators are
added (the share of parents with low/unknown education8 and the share of students with a
foreign background, share of foreign language speakers). In the fifth and final models, the
results from students who completed national exams in Swedish, English and mathematics in
year 6 was examined as a predictor of year 9 performance.
The national exams in Swedish, English and Mathematics has several individually graded
sections (delprov), this led to some difficulty in creating a variable that works well in a model.
A difficulty or disadvantage in creating and using a variable from the various sections of the
exams is the fact that the results were coded as ‘did not participate’, ‘did not pass’ and ‘pass’9.
One could use this variable as is, i.e. as a categorical variable, or create a dichotomous variable
7 It was not possible to include the share of parents with unknown educational background and those with the share of low education in the same model, one is dropped from the analysis due to collinearity, therefore a variable is made where both measures are combined 8 It was not possible to include the share of parents with unknown educational background and those with the share of low education are in the same model one is dropped from the analysis due to collinearity. 9 For the English Language exam, for the listening, verbal, reading and understanding portion of the exam results was coded as points.

19
to look at the performance of year 9 students’ who had passed/not passed the national exams in
year 6. When the variable was categorized and the results of students for the various sections
of the exam was included in the model, it was not possible to run some of the models. The main
reason for this, is that there is collinearity between the variables. In addition, where the models
did work and it was possible to test some models, the results of these models were inconsistent,
making it difficult to interpret.
To resolve both of the above issues factor analysis was used to create a useable variable.
Factor analysis may be defined as a data reduction method which allows one to: (1)
define/create a small(er) set of variables from a larger set of variables; (2) create indexes which
measure similar things conceptually. Using factor analysis the results of students from the
various sections of the exam (delprov) has been grouped.
In the models where student’s grade point average was used as the outcome variable,
multilevel analyses included some variables that were not included in the earlier models but
have been discussed in the literature as explanatory variables, which have an impact on the
performance of students were tested further and/or similar variable used to check if the
relationship holds. For example, in the earlier models children were assessed simply by whether
they were native or non-native Swedish speakers. In these models, a more fine-grained
assessment on the impact of language was carried out through a comparison of student
performance among students with a European versus non-European background. Additional
model also examine the percentage of absences (frånvaro), the employment situation of parents,
competence for moving to higher education (behörighet), the effect on student achievement
when students remained in the same primary school as the preschool they attended and among
migrants we assess impact of coming from a poor country (Human development index). These
are important additions to the earlier models given that students with an immigrant background,
especially those studying Swedish as a second language; students that have a high proportion
of absences and those who have not fulfilled the requirements to move on to higher education
has been identified as being at risk for long term-unemployment, and internal and external
psychological problems (Andersson, 2015)
One issue that is worth noting among several of the models is the missing value, where the
level of school and class variation should be provided. The problems with estimating the
between school and between class variation after taking into account, the individual, school
and class level explanatory variables, could be interpreted as indication that most of the
performance differences have been explained by the variables in the model. This is doubtful

20
given the wide range of factors proposed to have an impact on student achievement. On the
other hand, the lack of variation between school and class could simply be an indication that
there is not enough schools in the analysis to fully assess the variation (Kreft et al., 1998).
2 Performance in Mathematics
2.1 Results for students taking Swedish
Figure 3a and 3b below, presents the result of a model which examines the variation between
school and classes without any explanatory variables for student achievement in mathematics
among students taking Swedish as a native language. In figure 3a are shown approximate 95%
confidence intervals for estimate of the intercept residual, that is the school 'effect' estimated at
the mean math score for each of the 11 municipal schools in the data. The result clearly
demonstrate that there is a slight variation in math achievement among schools. Figure 3b, on
the other hand, presents the approximate 95% confidence intervals for the mean math score for
each class within a school. These results depict larger more significant differences between
classes with schools. For example, when math achievement for all the schools are compared,
school 7 (Mosstorp) is among the schools with less than average math performance. Yet, if we
look specifically at the performance of classes, a class from Mosstorp is the middle of the
ranking table, while at the same time two of the classes from Mosstorp are at the lower end of
the performance ranking.
7 8 9 5 110
6 2 4 113
-1-.
50
.51
Sch
oo
l re
sid
ua
l
0 5 10
School rank
sub/slb (mean) reff1
Math scores - schools

21
Figure 3a. Predicted math scores by schools.
Figure 3b. Predicted math scores by classes within schools.
In table 3 below, the predicted math scores are shown for students in the year 9 students at the
student, class and school level. In the first model (model 1) only individual level characteristics
are estimated. The results of the model, indicates marginally worse math performance for boys
and marginally better performance for foreign language speakers.
Similarly, in model 2, although the results are non-significant there seems to be an indication
that boys are driving the low scores in math. On the other hand, there is some indication that
students with a foreign background taking Swedish as a native language achieve better results
in math when compared to native Swedish students.
When class level variables are considered, the results indicate that the share of students with
a foreign background is driving the lower math scores. In classes where there is a high share of
foreign language students in a class (non-linear effect), students perform significantly worse.
The non-linear effect suggest that there may be a threshold at which the proportion of students
with a foreign background does not matter. In models not shown, when there was a more even
division of the proportion of students with foreign background the results were insignificant.
In models where the effect of having received social benefits are considered the results are
somewhat inconsistent. In comparison to the reference group, in classes with students where
between 10 and 20% of the household has received social benefits at least once in the year prior
to the analysis, students have a lower predicted math score. However, in classes where 20-30
8 5 78 2 9 5 7 3 1 9
2 8 1 610 3 2 410 6 7 3 4 511 2 6 2 5 4 211
8 33
-4-2
02
4
Cla
ss r
esid
ua
l
0 10 20 30 40
Class rank
cub/clb (mean) reff2
Math scores - classes

22
% of the students are from households with social benefits, the results are positive. There is
again a negative effect of being in classes with students from social benefit receiving
households, when more than 30% of the students are from these types of households10.
Table 3. Students' achievement in maths at the school, class and student levels among students
taking Swedish as a native language.
Model 1 Model 2 Model 3 Model 4
Student level
boy -.72(.32) -.73(.37) -.60(.37) -.17 (.32)
non-native speakers .30(.45) .33(.47) .52(.52) .42(.52)
Year 6 Math NP
del A/del B 3.28***(.45)
del C/del D .76(.49)
School level
low/unknwown parental education -.42(.24) -.18(.26) -.18(.26)
share of foreign background .15(.09) .12(.10) .00(.10)
Class level
share of low/unknown parental education -.02(.05) -.03(.04)
share of foreign language speakers
0/.425 (ref.)
.426/.60 -2.15(.84)* -2.45(.79)*
.601/max -3.77(1.12)*** -4.23(1.05)***
share from social benefit receiving households
0/10 (ref.)
10.1/20 -1.26(.63)* -.92(.58)*
20.1/30 .04(.95) .53(.92)
30.1/max -1.77(.84) -.78(1.05)
intercept 11.35(.36)*** 11.36(.34)*** 12.79(.53)*** 12.56(.53)***
Random
school variance .11(.41) - .44(.40)
class variance 1.21(.69) 1.10(.57) -
between-class language variance - -
student variance 24.71(1.31) 24.72(1.31) 16.91(1.99)
Notes: Standard error in brackets; * p<0.05, ** p<0.01, *** p<0.001. Students are scored on a scale ranging from 0
to 20, in the new grading system this is equivalent to a grade of F to A, with F indicating that a student has failed the
course.
10 It is unlikely that these unstable results are due to the number of classes in each group, the categories were
divided so that 16, 8, 6 and 8 classes were in each respective group.

23
In the fourth model, alongside the variables discussed earlier, year 6 achievement in the
national exams is included as a predictor of math performance in year 9. As discussed above,
the national exam in math was divided into several parts, therefore to include the results in the
models factor analysis was used to derive a factor for each student which was then entered in
the model. The results of the factor analysis indicated that a two factor model is the best fit for
the data11.
The first factor (which includes section C and D of the national exams) ranges from -3.40 to
0.35. Factor one, may be described as the scores related to the written part of the exam.
Meanwhile, factor two, is related to the verbal and mental arithmetic (section A and B of the
national exams) respectively. Factor two has scores ranging from -3.60 to 0.25. Higher scores
indicate that students have taken and passed all parts of the exam, while lower scores indicated
that students did not complete the exam and or failed all parts of the exam12. This simply means
that a positive regression outcome in the analysis indicates that students with higher factor
scores are expected to have higher predicted math scores in year 9.Therefore, a negative
regression outcome is related to lower expected predicted math scores in year 9.
Overall, the indicator for students who successfully completed the national exams in math
in year 6, indicated that students perform better in year 9. Though the completion of verbal and
mental arithmetic indicates that students perform better in year 9, the results are non-significant.
The results indicated however, that successfully completing the written part of the exam, is
related to significantly better grades. It is also interesting to see that the share of foreigners in a
class had a higher significantly negative relationship with math achievement when student
results from year 6 is included in the model.
Given the above result, an attempt was made to gain a better understanding of classroom
composition on student performance. As such an interaction between the language spoken by
the students (i.e. among native and non-native Swedish speakers) and the share of foreign
language speakers in a class was tested in an additional model. The effect of this interaction is
highly significant at p>0.001, with results indicating that non-native speakers have a higher
performance in math compared to native Swedish speakers. The results further indicate that
11 Section C/Section D is the written part of the exam where students are required to explicitly demonstrate how
they arrived at their solution. Section A/Section B is the verbal and mental arithmetic sections of the exam. 12 8 students did not participate in the national exams in math while 479 passed all four sections of the exam and
21 students failed all four section of the exam

24
both non-native and native Swedish speakers perform marginally worse as the share of foreign
students in a class increases13.
Figure 4. Class composition- interaction between the share of foreign language speakers in a class, non-native
Swedish speakers and native speakers
The effect of classroom social composition was further examined through an interaction
between native Swedish speakers, non-native Swedish Speakers and the share of students in a
class whose families were in receipt of social benefits. The results indicate that non-native
speaker’s perform better than native Swedish speakers in low socio-economic environments.
This effect is statistically significant.
13 Share of foreign language speakers , number of classes in each category <42%=20, 42-60% =10, >60%=8
510
15
Pre
dic
ted
ma
th s
co
re
< 42% 42-60% > 60%Share of foreign language speakers
Native Swedish speaker Non-native speaker
Math scores

25
Figure 5. Class composition- Interaction between the share of students from social benefit receiving households,
non-native Swedish speakers and native speakers
.
2.2 Results for students taking Swedish as a Second Language
With models similar to those described above, school and class level variation in math scores
was assessed across the 8 municipal schools with students taking Swedish as a second language.
In figure 6a are shown approximate 95% confidence intervals for estimate of the intercept
residual, that is the school 'effect' estimated at the mean math score for each of the 8 municipal
schools with classes in Swedish as a second language. In comparison to students taking native
Swedish language courses there is more variation in results at the school level when the results
are compared for students who are taking Swedish as a second language (compare figure 3a
above with figure 6a below).
Figure 6b, on the other hand, presents the approximate 95% confidence intervals for the
mean math score for each class within a school. Math results at the class level are far more
heterogeneous among students taking Swedish as a second language when compared to students
taking Swedish as a native language. In fact, the class level variation among students taking
Swedish as a second language is more than twice that of students Swedish as a native language.
810
12
14
Pre
dic
ted
ma
th s
co
re
<9.9% 10-20% 20-30% >30%% families receiving social benefits
Native Swedish speaker Non-native speaker
Math scores

26
Figure 6a. Predicted math scores by schools.
Figure 6b. Predicted math scores by classes within schools.
Let us now turn our attention to the models in Table 4 (below) for students taking Swedish
as a second language. These models are comparable to those presented above for students taking
Swedish as a native language with the exception that there is no indicator the difference in
performance among native and non-native speakers. It is of course fair to assume that all the
5 1 4 8 6 10 2 3
-4.0
0e-0
8-2.0
0e-0
8
0
2.0
0e-0
84.0
0e-0
8
School r
esid
ual
0 2 4 6 8
School rank
sub/slb (mean) reff1
Math scores - schools
1
5 2 2 58 8 4 3
2 8 10 10 6 3 48 2 3 3 10
1 83
2 2
-4-2
02
4
Cla
ss r
esid
ual
0 5 10 15 20 25
Class rank
cub/clb (mean) reff2
Math scores - classes

27
students taking Swedish as a second language are non-native speakers. Therefore, in the first
model we control only for the effect of gender. The results indicate that boys with a foreign
background have lower predicted math scores when compared to girls with a foreign
background. This finding is of course similar to the models tested for students taking Swedish
as a native language, where we saw that boys had a lower predicted math achievement.
In model 2, controls were added for school characteristics (low/unknown parental
education and the share of students with a foreign background), the results clearly indicate that
schools with a high proportion of students with parents with low/unknown education has lower
predicted scores in math. On the other hand, the effect of the share of foreign students in the
class predicts low but positive effects on math performance.
Table 4. Students' achievement in maths at the school, class and student levels for students
taking Swedish as a second language.
Model 1 Model 2 Model 3 Model 4
Student level
boy -.19(.90) -.15(.90) -.30(.90) .04 (.99)
Year 6 Math NP 2.40***(.59)
School level
low/unknwown parental education -.44(.37) -.12(.39) .54(.50)
share of foreign background .16(.14) .12(.13) -.13(.16)
Class level
share of low/unknown parental education -.02(.42) -.00(.09)
share of foreign language speakers
0/.425 (ref.)
.426/.60 -2.60(1.67) -1.91(2.40)
.601/max -3.15(2.09) -2.68(2.68)
share from social benefit receiving households
0/10 (ref.)
10.1/20 -1.60(2.44) 1.69(3.78)
20.1/30 -1.21(2.36) 6.56(3.73)
30.1/max -3.24(2.49) 1.94(4.59)
intercept 8.44(.74)*** 8.41(.69)*** 12.52(2.45)*** 7.64(3.9)*
Random
school variance - - - -
class variance - - - -
between-class language
variance
- - -
student variance 33.86(3.89) 34.43(4.11) 33.94(3.95) 23.06(3.18)
Notes: Standard error in brackets; * p<0.05, ** p<0.01, *** p<0.001. Students are scored on a scale
ranging from 0 to 20, in the new grading system this is equivalent to a grade of F to A, with F indicating
that a student has failed the course.
28
The results of model 3 shows the effect of class characteristics on student outcomes and
this is tested with the inclusion of the share of low/unknown education of students’ parents,
the share of foreign language speakers in a class and the share of students from social benefit
receiving households. All three variables have a negative effect on math scores.
In model 4 the results of the national exams in mathematics taken in year 6 are added as an
additional predictor to the models. The factor scores ranged from -3.07 to 0.74. Higher scores
indicate that students have taken and passed all parts of the exam, while lower scores indicated
that students did not complete the exam14. This simply means that a positive regression outcome
in the analysis indicates that students with higher factor scores are expected to have higher
predicted math scores in year 9.Therefore a negative regression outcome is related to lower
expected predicted math scores in year 9. With the inclusion of the results from the national
exams in year 6, the strength of the effect of several variables became weaker (gender, share of
parents with low/unknown education and share of students from social benefit receiving
households) but the sign did not change. Among the students that had completed the math exam
in year 6, they were predicted to perform significantly better in math in year 9.
3 Performance in English
3.1 Results for students taking Swedish
Figure 7a and 7b below, presents the results of a model which examines the variation
between school and classes without any explanatory variables for student achievement in
English among students taking Swedish as a native language. In figure 7a are shown
approximate 95% confidence intervals for estimates of the intercept residual, that is the school
'effect' estimated at the mean English score for each of the 11 municipal schools. The results
clearly indicate that there is no variation in English language achievement at the school level.
Figure 7b, on the other hand, presents the approximate 95% confidence intervals for the mean
English score for each class within a school. This shows larger more significant differences
between classes with schools. For example, when English achievement for all the schools are
compared, school 1 (Borgsmo) has performed the worst in English. Yet, if we look specifically
at the performance of classes, a class from Borgsmo is at the lower end of the ranking, while at
the same time one of the classes from Borgsmo is at the higher end of the performance ranking.
14 Among the students taking Swedish as a second language 105 students took the exam, but of these only 42
students completed and passed all sections of the exam. It is also clear from the descriptive statistics that 8 student
failed all four section of the exam. Meanwhile 74 students had no information with regards to the exam, it is clear
that they did not sit the national exams in mathematics in year 6. In addition, there were 4 student who were
registered but did not sit the exam.

29
Figure 7a. Predicted English scores by schools.
Figure 7b. Predicted English scores by classes within schools.
In table 5 below, the predicted English language scores are shown for year 9 students at the
student, class and school level. In model 1, only individual level characteristics explanatory
1 7 10 3 9 6 8 11 2 4 5
-.0
00
02
-.0
00
01
0
.00
00
1.0
00
02
Sch
oo
l re
sid
ua
l
0 5 10
School rank
sub/slb (mean) reff1
English scores - schools
7
1
2 310810 6 3 8 9 1 3 8 6 2 5 2 8 511 4 9 7 3 7 4 3 2 411 6 2
2
58
5
-4-2
02
4
Cla
ss r
esid
ual
0 10 20 30 40
Class rank
cub/clb (mean) reff2
English scores - classes

30
variables are included in the model. The results of indicate that boys perform significantly
worse than girls, while non-native speakers perform significantly better as compared to native
Swedish students. Even with the addition of school level explanatory (model 2) factors the
effect for non-native speakers and boys remain. The results indicate that the share of students
with a foreign background predict marginally better scores in English.
Table 5. Students' achievement in english at the school, class and student levels for students
taking Swedish.
Model 1 Model 2 Model 3 Model 4
Student level
boy -1.01(.38)** -1.05(.38)** -.92(.37)* -.88 (.27)
non-native speakers 1.19(.46)* 1.19(.54)* 1.39(.47)** .60(.36)
Year 6 English NP
del A/ C 1.48(.17)***
del B1/del B2 3.44(.16)***
School level
low/unknwown parental education -.37(.26) .11(.29) -.44(.34)
share of foreign background .10 (.10) -.02(.11) -.16(.13)
Class level
share of low/unknown parental education -.02(.05) -.11(.03)
share of foreign language speakers
0/.425 (ref.)
.426/.60 -.75(.89) -.91(.68)*
.601/max -2.73(1.24)* -2.65(.95)**
share from social benefit receiving households
0/10 (ref.)
10.1/20 -.19(.75) 1.12(.50)*
20.1/30 1.88(.99) 3.22(.81)***
30.1/max .40(1.09) 3.24(.94)***
intercept 13.03(.37)*** 13.04(.36)*** 13.18(.58)*** 12.46(.52)***
Random
school variance - - -.34(.45) -
class variance 1.69(.75) 1.46(1.56) .24 (.42) -
between-class language variance - - -
student variance 25.21(1.43) 25.11 (1.71) 24.93(1.32)*** - Notes: Standard error in brackets; * p<0.05, ** p<0.01, *** p<0.001. Students are scored on a scale ranging
from 0 to 20, in the new grading system this is equivalent to a grade of F to A, with F indicating that the
student has failed the course.
On the other hand, a high share of students with parents that have low/unknown educational
background predicts marginally lower English language performance as compared to students
with parents that have higher levels of education.

31
In model 3, controls are added for class composition, share of low/unknown education
students in class, share of foreign language speakers in class. A high share of foreign language
speakers in a class had a strong negative effect on English scores. Surprisingly, the share of
students from social benefit receiving households in a class predicts higher achievement among
students.
In the fourth model, alongside the variables discussed earlier, year 6 achievement in the
national exams is included as a predictor of English performance in year 9. Similar to Math, the
English national exams is made up of several sections. Consequently, factor analysis was used
to reduce the number of variables. The results from this indicated that two continuous factors
were created, and these were added to the model in an attempt to explain how much prior
performance explains later achievements.
The first factor (which includes section B1 and B2 of the national exams) ranges from -2.70
to 1.48. Factor one, may be described as the scores related to the reading/listening and
understanding sections of the exam. Meanwhile, factor two, is related to the verbal and written
sections (section A and c) of the exam respectively. The factor scores ranged from -4.37 to .97.
For both factors, higher scores indicate that students have taken and passed all parts of the exam,
while lower scores indicated that students did not complete the exam and or failed all parts of
the exam. This simply means that a positive regression outcome in the analysis indicates that
students with higher factor scores are expected to have higher predicted English language scores
in year 9. Therefore, a negative regression outcome is related to lower expected predicted
English scores in year 9.
The inclusion of year 6 achievement in the model indicated that students who successfully
completed English in year 6 is predicted to perform significantly better in grade 9, with higher
average grades in English. Completing the verbal and listening sections of the exam is predicted
to have a particularly strong impact on later achievements.
With the inclusion of year 6 English scores in the model, the share of foreign language
speakers at the class level is shown to have a strong negative non-linear effect on English scores.
One explanation for weak performance in English among students with a foreign background
is that students may choose to communicate in their mother-tongue. Appendix Table A13,
indicates that many of the students with foreign backgrounds are from Arabic speaking
countries. A high proportion in one environment would contribute to this. The estimates from
the model also indicated that higher shares of students from social benefit receiving households

32
in a class predicts better results in English. This result is somewhat counterintuitive and I really
have no explanation for this finding.
3.2 Results for students taking Swedish as a second language
Figure 8a and 8b, presents the result of a model which examines the variation between school
and classes without any explanatory variables for student achievement in English language for
each of the 8 municipal schools with classes in Swedish as a second language. In figure 8a are
shown approximate 95% confidence intervals for the estimate of the intercept residual, that is
the school 'effect' estimated at the mean English score. Figure 8b, on the other hand, presents
the approximate 95% confidence intervals for the mean English score for each class within a
school.
In comparison to students taking native Swedish language courses there is far greater
variation in results at the school level when the results are compared to students who are taking
Swedish as a second language (compare figure 7a above with figure 8a below). Similarly,
English results at the class level are far more heterogeneous among students taking Swedish as
a second language when compared to students taking Swedish as a native language. In fact, the
class level variation among students taking Swedish as a second language is more than twice
that of students taking Swedish as a native language.
Figure 8a. Predicted English scores by schools.
8
1
5
6 34
10 2
-4-2
02
4
School re
sid
ual
0 2 4 6 8
School rank
sub/slb (mean) reff1
English scores - schools

33
Figure 8b. Predicted English scores by classes within schools.
The results of models 1-4, for students taking Swedish as a second language (table 6, below) is
similar to that of students taking Swedish as a native language. At the individual level boys are
predicted to perform worse than girls. While at the school and class level a high share of
students with parents that have low/unknown education and a high share of foreign language
speakers predict lower scores. Across all models the effect of high share of students with a
foreign background and a high share of students from social benefit receiving households in a
school is positively associated with student outcomes. These relationships however seem to be
a spurious relationship and may be due to collinearity. To test these effects further more
individual level variables are needed.
In model 4, the results of the national exams in English language taken in year 6 is added as
an additional predictor to the model. The results from the factor analyses indicated that two
factors was the most appropriate fit for the data. The factor scores for the speaking, reading and
written part of the exam ranged from -2.25 to 1.16 while the listening section of the exam had
factor scores ranging from -1.77 to 1.86. As with the earlier models discussed, higher factor
scores indicate that students have taken and passed all parts of the exam, while lower scores
indicated that students did not complete the exam. This simply means that a positive regression
outcome in the analysis indicates that students with higher factor scores are expected to have
8
1 25 2 8 3 3
103 8 4 6 5 1 4 8
3 2 3 10 2 10 8 2 2
-6-4
-20
24
Cla
ss r
esid
ua
l
0 5 10 15 20 25
Class rank
cub/clb (mean) reff2
English scores - classes

34
higher predicted English scores in year 9.Therefore a negative regression outcome is related to
lower expected predicted English scores in year 9.
The inclusion of these factors indicated that students who successfully completed English in
year 6 is predicted to perform significantly better in grade 9, with higher average grades in
English.
Table 6. Students' achievement in English at the school, class and student levels for
students taking Swedish as a second language.
Model 1 Model 2 Model 3 Model 4
Student level
boy -1.14(.93) -1.00(.93)** -1.40(.91) -1.03 (.91)
Year 6 English NP
del A/B1 & C 3.80(.5)***
del B2 2.54(.58)***
School level
low/unknwown parental education -1.3(.46)** -1.04(.40)** -1.34(.45)**
share of foreign background .49 (.13)** .44(.14)*** .49(.15)***
Class level
share of low/unknown parental education -.03(.04) .10(.08)
share of foreign language speakers
0/.425 (ref.)
.426/.60 -2.91(1.70) -2.77(2.21)
.601/max -4.79(2.11)* -3.37(2.46)
share from social benefit receiving households
0/10 (ref.)
10.1/20 .26(2.46) 2.79(3.53)
20.1/30 -.36(2.38) 3.36(3.53)
30.1/max 2.21(2.51) 4.77(4.37)
intercept 7.93(1.06)*** 8.09(.80)*** 9.38(2.47)*** 6.88(3.68)
Random
school variance 3.33(3.62) - - -
class variance - 3.41(2.53) - -
between-class language variance - -
student variance 35.17(4.00) 35.07 (4.91) - 19.7 (2.67) Notes: Standard error in brackets; * p<0.05, ** p<0.01, *** p<0.001. Students are scored on a scale
ranging from 0 to 20, in the new grading system this is equivalent to a grade of F to A, with F indicating
that the student has failed the course.

35
4. Performance in Swedish as a native language
Figure 9a and 9b below, presents the results of a model which examines the variation between
school and classes without any explanatory variables for student achievement in Swedish as a
native language. In figure 9a, are shown approximate 95% confidence intervals for the estimate
of the intercept residual, that is the school 'effect' estimated at the mean Swedish score. These
results clearly demonstrates that there is no variation in Swedish achievement among schools.
Figure 9b, on the other hand, presents the approximate 95% confidence intervals for the mean
English score for each class within a school. This figure indicates that there are some small but
significant differences in performance between classes with schools.
Figure 9a. Predicted Swedish scores by schools.
1 10 9 4 6 3 5 2 11 7 8
-2.0
0e
-08
-1.0
0e
-08
0
1.0
0e
-08
2.0
0e
-08
Sch
oo
l re
sid
ua
l
0 5 10
School rank
sub/slb (mean) reff1
Swedish scores - schools

36
Figure 9b. Predicted Swedish scores by classes within schools.
Table 7 below, presents the result for the predicted achievement in Swedish. The results
from these models indicate that boys have lower grades in Swedish than girls and that students
with a foreign background taking Swedish as a native language get better grades when
compared to native Swedish students. These results hold for all models.
In model 2, where controls are added for school characteristics, the effect of language
increases marginally, with estimates indicating that non-native Swedish speakers perform better
in Swedish when compared to native speakers. Share of students from lower/unknown
education backgrounds predicts negative Swedish performance but schools with higher share
of students with a foreign background have a higher performance.
When both school and class characteristics are added to the model (model 3), the difference
in performance in Swedish among students with a foreign background and native Swedish
speakers becomes even larger. Non-native Swedish speakers get better grade in Swedish. The
results indicate, however, that in classes with a higher share of foreign speakers the performance
of students become worse. It seems that there may be some high performing non-native
speakers in predominantly native speaking classes that are driving the effect but then there are
also native speakers in non-native classes performing badly. To examine this further, an
11 4 5 3 2 5 910 3 6 8 3 610 8 2 911 7 4 7 4 2 8 2 2 2 3 5
611 5 73
8
-4-2
02
4
Cla
ss r
esid
ual
0 10 20 30 40
Class rank
cub/clb (mean) reff2
Swedish scores - classes

37
interaction model between the share of foreign language speakers in a class, non-native Swedish
speakers and native speakers was tested.
.
Figure 10. Class composition- interaction between the share of foreign language speakers in a class, non-native
Swedish speakers and native speakers
The estimates (figure 10) indicate that as the share of foreign language speakers in a class
increases, performance in Swedish decline. It is interesting to note that non-native speakers
score higher in Swedish when compared to native Swedish speakers. The reason for this may
be that non-native speakers are more motivated to learn the language, to show for example
employers and to be accepted in higher education courses. It is however a given that native
Swedes “know the language”.
Although the Swedish national exam had several individually graded sections only one factor
was created ranging from -5.20 to .38. Higher scores indicated that students have taken and
passed all parts of the exam, while lower scores indicated that students did not complete the
exam15. This simply means that a positive regression outcome in the analysis indicates that
students with higher factor scores are expected to have higher predicted Swedish scores in year
9.Therefore a negative regression outcome is related to lower expected predicted Swedish
scores in year 9.
15 7 students did not participate in the national exams in Swedish in year 6 while 515 passed all four sections of
the exam.

38
Table 7. Students' achievement in Swedish at the school, class and student levels.
Model 1 Model 2 Model 3 Model 4
Student level
Boy -2.70(.31)*** -2.72(.31)*** -2.61(.30)*** -2.09(.30)***
Non-native speakers .79(.38)* .94(.40)* 1.11(.39)** .83(.39)*
Year 6 Swedish NP 1.76(.17)***
School level
low/unknwown parental education -.18 (.21) .05(.21) .05(.19)**
share of foreign background .04(.08) .01(.08) -.16 (.07)*
Class level
share of low/unknown parental education -.03(.04) -.01(.04)
share of foreign language speakers
0/.425 (ref.)
.426/.60 -1.08 (.77) -1.57 (.69)*
.601/max -2.30(1.00)* -3.31(.89)***
share of students from social benefit receiving households
0/10 (ref.)
10.1/20 -.62(.61) -.16(.53)
20.1/30 .33(.88) 1.00(.79)
30.1/max -.92(.95) -.40(.88)
intercept 13.62(.29)*** 13.47(.30)*** 14.30(.66)*** 14.09(.45)***
Random
school variance - - - -
class variance - .42(.36) .33 (.33) .11 (.21)
between-class language variance - - - -
student variance 16.90 16.87(.90) 16.83 (1.63) 14.31 (.81)
Notes: Standard error in brackets; * p<0.05, ** p<0.01, *** p<0.001. Students are scored on a
scale ranging from 0 to 20, in the new grading system this is equivalent to a grade of F to A, with
F indicating that the student has failed the course.
The results from the regression analyses demonstrates that controlling for student
performance in Swedish in year 6 national exams, marginally reduces the effect of gender and
non-native speakers. The estimates indicate that when controls for prior achievement is
included in the model, the share of students from lower/unknown education backgrounds at the
school level, predicts negative Swedish performance. On the other hand, the effect of having a
higher share of students with a foreign background at the school level indicates a lower
performance.

39
5. Additional models
Some additional models were explored to examine the effect of absences, the length of time
students with a foreign background has been living in Sweden, and predicted estimates for the
performance of students with foreign background, comparing student with European and non-
European backgrounds.
When math (table A1 & table A2) is examined as the outcome with only individual level
predictors, there are a few results that should be noted. The first is that, student with a foreign
background who study Swedish as a second language perform significantly worse than native
Swedish students (model 1). When this result is compared with model 2, one sees that it is non-
native, non-Europeans who take Swedish as a second language performance that is driving these
results. When absences and competence to move on to high school is considered, the effect of
gender disappears, while the effect of absences decreases. In table 4, when class and school
level predictors are entered in the model, the gender, non-native students taking Swedish as a
second language, were predicted to have low math scores. The percent of foreign language
speakers in a class seemed to have an effect on math outcomes but this disappeared when the
economic conditions of the family is added to the model.
In general when English language (table A3 & A4) is considered as the outcome, the results
are similar to that of previous models with respect to the effect of gender and non-native
students taking Swedish as a second language. However, the effect of absences had a far weaker
effect than expected, especially in models where competence to move on to high school is
considered. When class and school predictors are entered in the model there is a strong negative
effect in classes where the share of foreign speakers in a class is high. Where economy is
considered, there is a marginally positive effect on student performance when the share of both
parents working is high.
In table A5 and A6, the performance of student taking Swedish as a native language is
considered. It is very interesting to see that the performance of non-native students and non-
native non-Europeans is significantly better than native Swedish speaking students. One
explanation for this is that non-natives require good grades to show employers their competence
in the language, while for native Swedish students it is a “given” that they are able to speak the
language.
Where the results of students taking Swedish as a second language (table A7 & A8) is
considered, there is no significant difference in the performance of students who have a
European versus those with a non-European background. The results were also strongly tied to
student absences and the proportion of students in a class who spoke a foreign language. The

40
share of students with 2 parents from abroad seemed to have a significant positive effect on
grades. This result may however be due to the fact that all the students taking that course has a
foreign background, and that is the effect we are actually seeing.
As in earlier analysis, in all models and across all outcomes tested, there is a greater variation
in results among class than between schools. This may be the true picture of things but some
might argue that there are two few schools in the analysis to truly determine if class has a bigger
effect than schools.
6. Overall achievement
In this section of the analyses the effect of schooling on grade point average is examined.
The grade point average for primary schools is created by summing the student’s 16 best final
grades giving maximum score of 320 points16. The grade according to the old grading system
is MVG=20, VG=15 and G=10. The grade point average may be calculated according to the
new system by summing the value of each given grade: A=20, B=17, 5, C=15, D=12, 5 E=10
and F= 0. As with the core subjects, when grade point average is examined the results of model
1 (table A9) indicated that boys performed significantly worse than girls. The results of this
model also indicated that non-native students studying Swedish had a significantly higher
predicted grade point average when compared to native Swedish students’. On the other hand,
non-native students studying Swedish as a second language were predicted to have lower scores
as compared to students with a foreign background and native Swedes taking Swedish as a
native language.
In model 2, we investigated further the impact of having a foreign background on student
achievements through an examination of the effects of schooling among students originating
from another European country in comparison to students with a foreign background originating
from a Non-European country. Interestingly the results, demonstrate that European or non-
European language background does not have a significant impact on student outcomes. This
is demonstrated by the marginal differences in predicted outcomes between the two groups.
These result retained their significance even after an addition control was included in the next
model (model 3, table A9) to test the effect of the number of years that the students had moved
to Sweden.
16 There are a few students who take more than 16 courses which gives them a grade point average over this
amount.
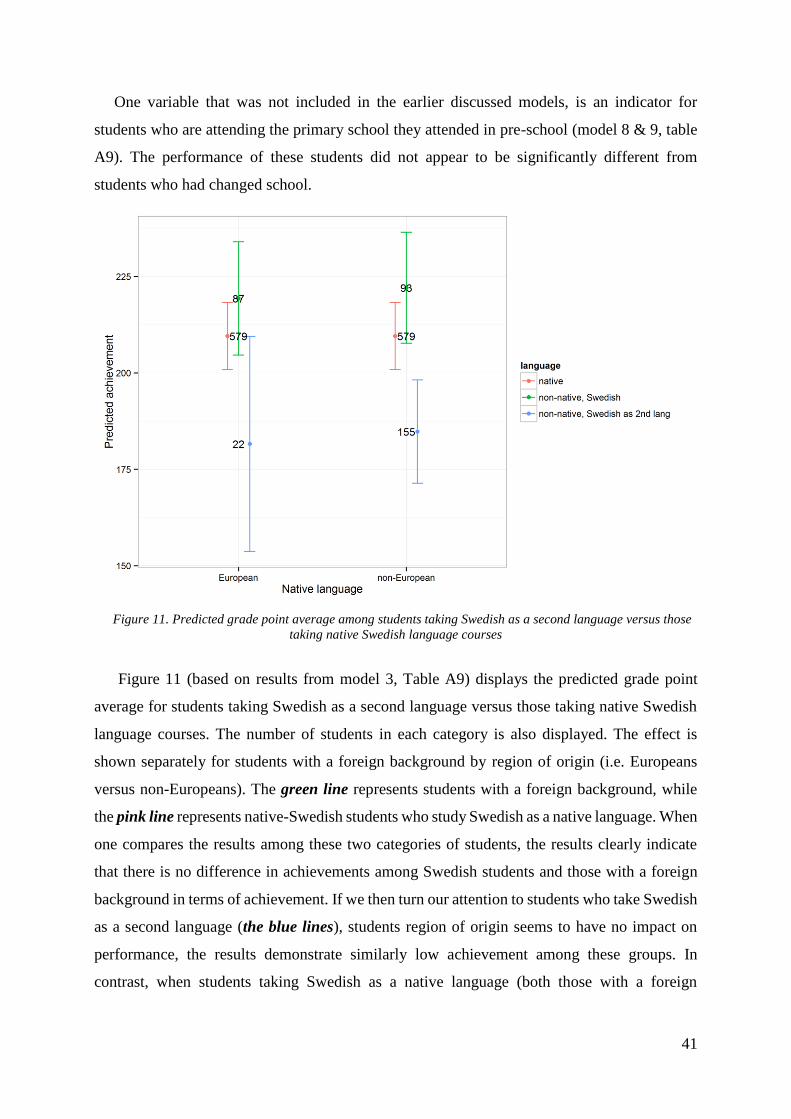
41
One variable that was not included in the earlier discussed models, is an indicator for
students who are attending the primary school they attended in pre-school (model 8 & 9, table
A9). The performance of these students did not appear to be significantly different from
students who had changed school.
Figure 11. Predicted grade point average among students taking Swedish as a second language versus those
taking native Swedish language courses
Figure 11 (based on results from model 3, Table A9) displays the predicted grade point
average for students taking Swedish as a second language versus those taking native Swedish
language courses. The number of students in each category is also displayed. The effect is
shown separately for students with a foreign background by region of origin (i.e. Europeans
versus non-Europeans). The green line represents students with a foreign background, while
the pink line represents native-Swedish students who study Swedish as a native language. When
one compares the results among these two categories of students, the results clearly indicate
that there is no difference in achievements among Swedish students and those with a foreign
background in terms of achievement. If we then turn our attention to students who take Swedish
as a second language (the blue lines), students region of origin seems to have no impact on
performance, the results demonstrate similarly low achievement among these groups. In
contrast, when students taking Swedish as a native language (both those with a foreign

42
background and native Swedish students) is compared with students taking Swedish as a second
language we see that students taking Swedish as a second language and are of non-European
origin have significantly lower grade point average. As previously stated, students with
European origins also have similarly low grades, this is however not significant due to the small
number of students in this category.
Given the seemingly detrimental association between Swedish as a second language and
student achievement, it seems that very few students’ progress to Swedish as a native language.
In figure 12 and figure 13, we see the proportion of students taking Swedish as a second
language after having moved to Sweden in the last 4 years and 6 years respectively17.
Figure 12. Proportion of students taking Swedish as a second language after having moved to Sweden in the last
4 years
17 The numbers on the graph represents the school and class identifiers, this information is not necessary for
interpretation of the figures
The intercept presented in the figures may be defined as the
mean grade point average for native Swedish girls with less
than 5% absences.

43
The figures show that there is a high proportion of students taking Swedish as a second language
although they have been residing in Sweden for an extended period of time. Evidence of this is
depicted in the shift in the school positions between year 4 and year 6. From the figures we note
also that approximately 75% of students in Söderport (coded 102 and 101) taking Swedish as a
second language has been residing in Sweden for between 4 and 6 years. If there is progression
in language learning, it is hard to understand how these students could still be taking Swedish
as a second language.
Figure 13. Proportion of students taking Swedish as a second language after having moved to Sweden in the last
6 years
One of the most striking individual level predictors is the proportion of recorded absences.
As the proportion of absences increase the models predict significant declines in grade point
average. The results from two separate models which includes the effects of absences are
shown in figure 14 and figure 15 below. In both figures statistically non-significant effects are
faded.
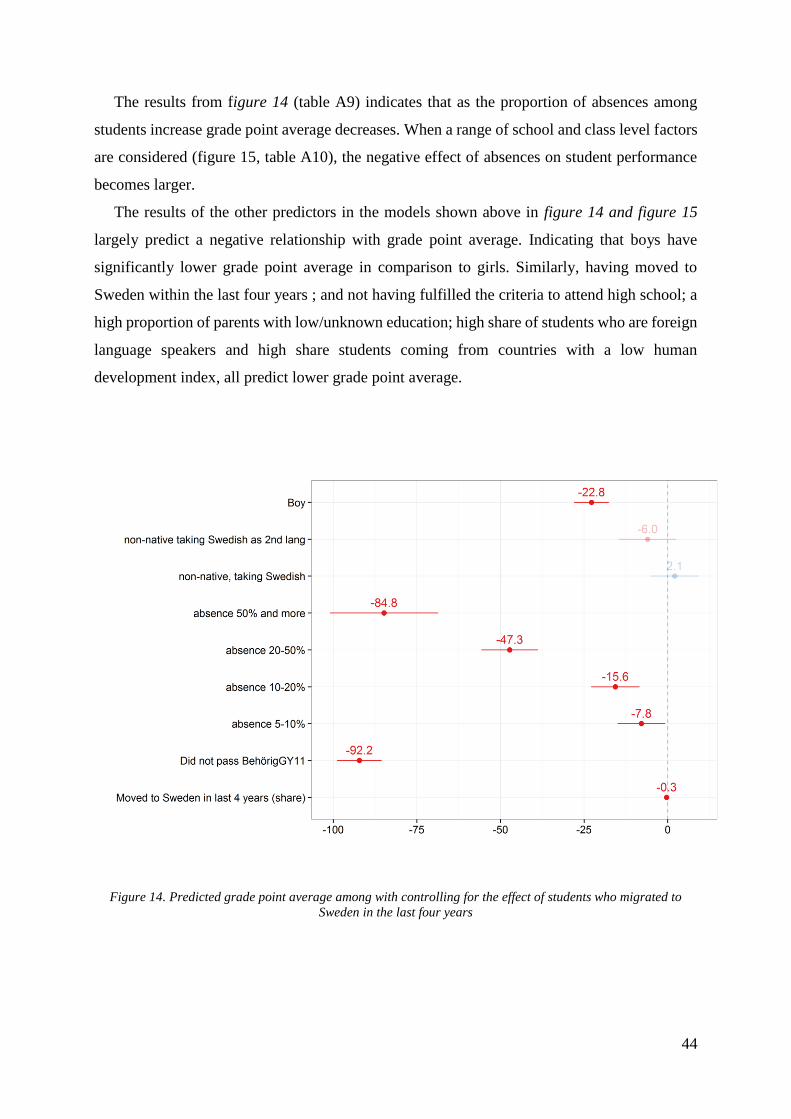
44
The results from figure 14 (table A9) indicates that as the proportion of absences among
students increase grade point average decreases. When a range of school and class level factors
are considered (figure 15, table A10), the negative effect of absences on student performance
becomes larger.
The results of the other predictors in the models shown above in figure 14 and figure 15
largely predict a negative relationship with grade point average. Indicating that boys have
significantly lower grade point average in comparison to girls. Similarly, having moved to
Sweden within the last four years ; and not having fulfilled the criteria to attend high school; a
high proportion of parents with low/unknown education; high share of students who are foreign
language speakers and high share students coming from countries with a low human
development index, all predict lower grade point average.
Figure 14. Predicted grade point average among with controlling for the effect of students who migrated to
Sweden in the last four years

45
Figure 15. Predicted grade point average among with controlling for a wide range of school and class level
effects
Below several of the variables that seem to have the strongest impact on the models are
explored further. Figure 16 and figure 17 (table A10), provides a graphical representation of
the predicted grade point average for the share of foreign language speakers in a class. The
results indicate that a high share of foreign language speakers is associated with lower
performance among students. Both Söderport and Navestad has classes with a high proportion
of students that are foreign language speakers, there is however a significant difference in
performance in these classes, with the students in Navestad performing significantly worse.
More than any other school in the data, Söderport has several classes where more than 75% of
the students are foreign language speakers. The students’ in these classes have achievement
levels similar to that of many schools with lower proportions of foreign speakers. This is an
indication of two things. The first is that having an immigrant background does not necessarily
mean that students will have lower achievements. Secondly, it seems that despite the students
background the school has been able to produce students with reasonable achievements and as
such maybe other schools should examine their approach and try to replicate the aspects which
seem to be working.

46
Figure 16. Predicted grade point average for the share of foreign language speakers by class
On closer examination of figure 17, which shows the predicted grade point average for the
share of foreign language speakers in a class by school there are several noteworthy things.
There is generally more variation between classes in schools where there are classes with a high
proportion of foreigners in a class. In Hagaskolan for example, there are four classes. The two
with a low share of foreigners had very similar grade point average, approximately 260.
However, there was more variation between the classes with a higher proportion of foreigners
and they had significantly lower grade point averages (approximately 225). It is also interesting
to see that Råsslaskolan has no classes with students with a foreign background, while Hultdal
and Mosstorp have very low proportion of students with a foreign background. Within these
schools there is little or no variation in grade point average between the classes and students
generally have a grade point average of approximately 250 points. What these results suggest
is that a more even distribution of students with foreign background within classes and across
schools may reduce the variation between classes, which in turn may reduce the individual level
achievement gaps.
47
These results are also seem to explain the findings in the descriptive statistics. The overview
of the grade point average from 2010-2014, indicates a large gap between the lowest and highest
performing schools. What we can see from these models is that schools and classes with a high
proportion of students with a foreign background account for the lower achievements.
Figure 17. Predicted grade point average for the share of foreign language speakers by class by school
In the next set of figures (figure 18 and figure 19, below) we examine the relationship between
achievement and the share of students coming from poor countries (defined as countries
identified having a low human development index). The results indicate simply that a higher
share of students in a class from poor countries predict lower achievement. This is clearly
exemplified in figure 19, which shows the predicted grade point average for the share of
students from poor countries by class and school.

48
Figure 18. Predicted grade point average for the share of foreign language speakers by class

49
Figure 19. Predicted grade point average for the share of students from poor countries by class and school
Figure 20 and figure 21 below depicts the relationship between achievement and the share
of students with two parents employed. The results from figure 20 indicate that grade point
achievement is higher among students with both parents in employment. The graph further
visualizes the variation in performance among classes within schools, and similar to the earlier
figures discussed, a class in Navestad stands out. There is one with where there are no students
with both parents employed. Figure 20, allows for a closer examination of these differences at
the class level. One can see that Borgsmo and Navestad has both the lowest level of
achievements among students and the lowest share of students with both parents in
employment. On the other hand, Hagaskolan and Djäknepark have the highest achievements
and the highest proportion of parents in employment. These results confirm and strengthen the
earlier findings indicating the importance of the economic situation of the family, and points to
the importance of family background for school achievement. This is of course plausible
because parents that have a better economic situation is able to supplement their children’s
50
education through human and social capital. For example, the purchase of study help and
tutorial, to provide extra support to their children if it is required.
Figure 20. Predicted grade point average for the share of students with two parents that are employed by school

51
Figure 21. Predicted grade point average for the share of students with two parents that are employed by class
and school
Figure 16, 18 and 20, tells an interesting story. In figure 20, in the far left hand side we see that
majority of students with a low grade point average are also in classes where there is a low
proportion of students with two parents in employment. The results from figure 18, seems to
explain that children with a low share of two working parents have a foreign background (high
share of foreign language speakers in a class) and that they are from Low HDI countries (figure
16). The school with the most students from low HDI countries, has lowest share of students
with two employed parents and have a highest proportion of foreign language students,
Navestadskolan. As discussed previously the students with these characteristics have
significantly lower achievement levels when compared to other students, it is therefore not
surprising that Navestad is one of the lowest performing school among the municipal schools
in Norrköping. Further background characteristics of the students in this school, as it relates to
this analysis, may be found in table A12.

52
7. Conclusion
This report had two overarching aims. These were to assess the between and within school
variation in achievement among communal run primary schools in the municipality of
Norrköping. Based on the analysis the findings indicate that among schools, there are small,
non-significant differences in achievement across the core subjects and grade point average. On
the other hand, when class variation is considered there are larger more significant differences
in the achievement of students across the core subjects and grade point average. Beyond this,
individual level differences was the largest explanatory determinant of student outcomes.
However, due to data limitations, it was not possible to thoroughly assess the effect of these
factors.
At the individual level, gender had one of the strongest relationships with achievement,
whereby boys perform significantly worse than girls in all core subjects and in overall student
performance. In addition, there was significantly lower achievement among students with a
foreign background studying Swedish as a second language when compared to students taking
Swedish as a native language. However, among students taking Swedish as a second language,
there is no difference in achievement among European and Non-European students with a
foreign background.
Differences in achievement at the classroom level has been explained by the student’s
economic situation, whereby students whose families received social benefits at least once in
the year prior to the analysis and/or they are from households where both parents were not in
employment, had lower grades. There were also significant differences in student achievement
among students with a foreign background studying Swedish as a native language and native
Swedish students. Students with a foreign background studying Swedish as a native language
outperformed native Swedish students across the core subjects, but there is no significant
difference in grade point average between the groups. Classroom social composition, seemed
to play an integral role in the achievement of students. The results indicated that both non-native
and native Swedish speakers perform worse as the share of foreign students in a class increases.
Nevertheless, non-native Swedish speakers tend to perform better than native Swedish speakers
in low socio-economic environments.
School level variation has been explained by, a high share of students with parents having
low/no education and a high share of students with a foreign background. These factors have
contributed to lower achievement among students. Although, it must be said that these variables
appear to inflate each other.

53
Overall, it seems that once students are placed in Swedish as a second language, despite the
detrimental association with their performance in other subjects, they do not seem to progress
to Swedish as a native language.
In conclusion, it is important to note that students do not perform significantly worse by
virtue of any single factor. Instead, it seems to be the interaction between individual, school and
class level factors which determines a student outcome. For e.g. students with a foreign
background who take Swedish as a second Language have significantly lower grades in
comparison to students with a foreign background who take Swedish as a native Language.
Moreover, schools that offered Swedish as a second language had a higher proportion of
foreigners per class and based on the results this leads to lower performance among both native
and non-native Swedish speaker.
8. Future analyses
Although the results of this study has provided some insights into the differences in school
achievements and has provided starting point for making improvements, many unanswered
questions still remain that would add significantly to our knowledge. For instance, would
students with the same individual level characteristics have the same level of achievement in
different schools? We do know that classes with high share of students with a foreign
background have lower achievements. Is it only non-native speakers that drive the average
grades down? How much of this poor performance can be attributed to native Swedish students?
Among native Swedish students with low performance, how much of that could be attributed
to economic factors? Does recently arriving immigrants adapt to the schooling environment at
a faster rate and begin to perform better in classes with higher proportions of native-Swedish
students? Is the level of achievement among newly arriving immigrants’ worse in less deprived
environment? What is, if any, the time of adaptation for newly arriving immigrants? How does
it relate to economic factors? How does it differ if students are placed in Swedish as a native
language instead of Swedish as a second language? How does the performance of students in
communal schools differ from students in independent schools? What accounts for these
differences?
It was not possible to answer the above questions due to the type, quality and quantity of
data. This limitation was largely due to the fact that the data was cross-sectional and aggregated.
This has meant that it was not possible to investigate changes over time or to make any
conclusions with regards to causality. In addition, the aggregated nature of the data has meant

54
that there were few individual level variables, which is necessary to investigate the majority of
the questions mentioned here. This has also contributed to what can be seen as a missing
variable problem, whereby many of the explanatory variables identified in the literature were
not included in the current analyses. With longitudinal and individual level data, it would be
possible to answer many of the current unanswered questions and thereby allow for the correct
policy changes to reduce the gap in student achievement.
9. References
Aitkin, M., & Longford, N. (1986). Statistical modelling issues in school effectiveness studies.
Journal of the Royal Statistical Society. Series A (General), 1-43.
Andersson, C. (2007). Lärartäthet, lärarkvalitet och arbetsmarknaden för lärare: Institutet för
arbetsmarknadspolitisk utvärdering (IFAU).
Andersson, J.(2015). Alla barn genom skolan. Norrköping Kommun.
Björklund, A., Edin, P.-A., Freriksson, P., & Krueger, A. B. (2004). Education, equality and
efficiency: An analysis of Swedish school reforms during the 1990s. IFAU report, 1,
72.
Bosker, R. J., & Scheerens, J. (1994). Alternative models of school effectiveness put to the test.
International Journal of Educational Research, 21(2), 159-180.
Böhlmark, A., Grönqvist, E., & Vlachos, J. (2012). Rektors betydelse för skola, elever och
lärare. Stockholm: IFAU Rapport, 15.
Böhlmark, A., & Holmlund, H. (2012). Lika möjligheter. Familjebakgrund och
skolprestationer 1988–2010, 40.
Coleman, J. S. (1990). Equality and achievement in education: Westview press.
Coleman, J. S., Campbell, E. Q., Hobson, C. J., McPartland, J., Mood, A. M., Weinfeld, F. D.,
& York, R. (1966). Equality of educational opportunity. Washington, dc, 1066-5684.
Erikson, L. (2008). Föräldrar och skola–olika innebörder. Ur Vi lämnar till skolan det käraste
vi har… Om samarbete med föräldrar–en relation som utmanar. Myndigheten för
skolutveckling.
Finnman, J, Andersson,B, Bjelvenius, H, Båvner, B, Fridell, M, Melchert,R & Mohammad,
J. (2015). Öppna jämförelser. Grundskola 2015: Tema systematiskt kvalitetsarbete
med skl:s analyshandbok. SKL Rapport. http://webbutik.skl.se/sv/artiklar/oppna-
jamforelser-grundskola-2015.html
Fredriksson, P., Oosterbeek, H., & Öckert, B. (2012). Långsiktiga effekter av mindre klasser:
IFAU Rapport.
Goldstein, H. (1997). Methods in School Effectiveness Research∗. School effectiveness and
school improvement, 8(4), 369-395.
Goldstein, H., Rasbash, J., Yang, M., Woodhouse, G., Pan, H., Nuttall, D., & Thomas, S.
(1993). A multilevel analysis of school examination results [1]. Oxford review of
education, 19(4), 425-433.
Gustafsson, J.-E., & Yang-Hansen, K. (2009). Resultatförändringar i svensk grundskola. Vad
påverkar resultaten i svensk grundskola, 40-82.
Gustafsson, J., & Yang Hansen, K. (2009). Vad påverkar resultaten i svensk grundskola?
Kunskapsöversikt om betydelsen av olika faktorer: Skolverket Stockholm.
Hinnerich, B. T., Höglin, E., & Johannesson, M. (2011). Are boys discriminated in Swedish
high schools? Economics of Education Review, 30(4), 682-690.

55
Högdin, S. (2006). Hemmets resurser. Om ungdomars upplevelse av föräldrars stöd och
engagemang i deras skolgång. Pedagogisk forskning i Sverige, 11(1), 1-19.
Jönsson, A., & Rubinstein Reich, L. (2004). Invandrade akademiker som lärare i den svenska
skolan,(Rapport 2004: 18). Uppsala: Institutet för arbetsmarknadspolitisk utvärdering.
Kreft, I. G., Kreft, I., & de Leeuw, J. (1998). Introducing multilevel modeling: Sage.
Lindahl, E. (2007). Comparing teachers' assessments and national test results: evidence from
sweden: Working Paper, IFAU-Institute for Labour Market Policy Evaluation.
Rumberger, R. W., & Palardy, G. J. (2004). Multilevel models for school effectiveness research.
Handbook of quantitative methodology for the social sciences, 235-258.
Sandoval-Hernandez, A. (2008). School effectiveness research: a review of criticisms and some
proposals to address them. Educate~, 1(1), 31-44.
Sandqvist, J. (2007). Provbetyg-slutbetyg-likvärdig bedömning?: en statistisk analys av
sambandet mellan nationella prov och slutbetyg i grundskolans årskurs 9, 1998-2006:
Skolverket.
Visscher, H. L., * Adrie, & Witziers, B. (2005). School effectiveness research: From a review
of the criticism to recommendations for further development. School effectiveness and
school improvement, 16(3), 249-279.
von Greiff, C. (2009). Lika skola med olika resurser. En ESO-rapport om likvärdighet och
resursfördelning, ESO rapport, 5.
Östh, J., Andersson, E., & Malmberg, B. (2013). School choice and increasing performance
difference: A counterfactual approach. Urban Studies, 50(2), 407-425.

56
10. Appendix
Table A1. Models for math. Individual level variables
Math
(1) (2) (3) (4)
boy -0.64* (0.35) -0.63* (0.35) -1.01*** (0.33) -0.34 (0.24)
non-native, taking Swedish 0.27 (0.47) -0.22 (0.45) -0.31 (0.33)
non-native, taking Swedish as 2nd lang -2.65*** (0.53) -2.73*** (0.51) -0.04 (0.40)
other European, taking Swedish -0.37 (0.62)
other European, taking Swedish as 2nd lang -1.50 (1.18)
other non-European, taking Swedish 0.90 (0.62)
other non-European taking Swedish as 2nd lang -2.67*** (0.54)
absence: less than 5% (ref.)
5-10% -0.33 (0.45) -0.49 (0.33)
10-20% -1.39*** (0.45) -0.73** (0.33)
20-50% -4.11*** (0.52) -1.76*** (0.39)
50% and more -8.01*** (1.03) -2.11*** (0.79)
not qualified for high school -8.53*** (0.31)
Constant 11.29*** (0.38) 11.27*** (0.38) 12.91*** (0.52) 13.61*** (0.41)
class variance 0.95 0.94 0.82 0.83
school variance 0 0 0 0.14
student variance 3.9 3.9 3.9 3.9
Notes: Standard error in brackets; * p<0.05, ** p<0.01, *** p<0.001. Students are scored on a scale ranging from 0 to 20, in the new grading
system this is equivalent to a grade of F to A, with F indicating that the student has failed the course

57
Table A2. Models for math. Class and school level variables
Math
(1) (2) (3) (4) (5)
boy -1.01*** (0.33) -1.00*** (0.33) -1.00*** (0.33) -0.99*** (0.33) -0.96*** (0.33)
non-native, taking Swedish -0.22 (0.45) -0.26 (0.46) -0.14 (0.46) -0.17 (0.46) -0.19 (0.46)
non-native taking Swedish as 2nd lang -2.73*** (0.51) -2.75*** (0.55) -2.49*** (0.56) -2.42*** (0.56) -2.38*** (0.57)
Absence: less than 5% (ref.)
5-10% -0.33 (0.45) -0.35 (0.45) -0.37 (0.45) -0.36 (0.45) -0.35 (0.45)
10-20% -1.39*** (0.45) -1.41*** (0.45) -1.41*** (0.45) -1.40*** (0.45) -1.39*** (0.45)
20-50% -4.11*** (0.52) -4.13*** (0.52) -4.12*** (0.52) -4.14*** (0.52) -4.13*** (0.52)
50% and more -8.01*** (1.03) -8.07*** (1.03) -7.96*** (1.03) -7.96*** (1.03) -7.97*** (1.03)
School level
share of students with 2 parents from abroad 0.20 (0.15) 0.25* (0.15) 0.21 (0.17) 0.18 (0.16)
share of low/unknown parental education -0.24 (0.19) -0.18 (0.19) -0.16 (0.21) -0.13 (0.20)
Class level
share of foreign language speakers) -4.02** (1.90) -0.55 (2.81) -0.56 (2.77)
share of students with 2 parents having job 0.04 (0.03) 0.02 (0.03)
hdilg -0.06 (0.04)
Constant 12.91*** (0.52) 12.76*** (0.69) 12.80*** (0.68) 9.30*** (2.25) 10.90*** (2.44)
class variance 0.95 0.94 0.82 0.83 0.84
school variance 0 0 0 0.14 0
student variance 3.9 3.9 3.9 3.9 3.9
Notes: Standard error in brackets; * p<0.05, ** p<0.01, *** p<0.001. Students are scored on a scale ranging from 0 to 20, in the new grading system this is equivalent to a
grade of F to A, with F indicating that the student has failed the course; hdilg=Human Development Index (low).

58
Table A3.Models for English. Individual level variables
English
(1) (2) (3) (4)
boy -1.10*** (0.36) -1.08*** (0.36) -1.41*** (0.34) -0.75*** (0.26)
non-native, taking Swedish 1.07** (0.49) 0.73 (0.47) 0.60* (0.36)
non-native, taking Swedish as 2nd lang -4.49*** (0.55) -4.72*** (0.53) -2.27*** (0.41)
other European, taking Swedish 1.39** (0.63)
other European, taking Swedish as 2nd lang -2.88** (1.21)
other non-European, taking Swedish 0.72 (0.64)
other non-European taking Swedish as 2nd lang -4.76*** (0.57)
absence: less than 5% (ref.) 0.42 (0.47) 0.31 (0.35)
5-10% -0.46 (0.47) 0.23 (0.36)
10-20% -2.68*** (0.55) -0.33 (0.42)
20-50% -7.22*** (1.09) -1.29 (0.85)
50% and more -8.77*** (0.33)
not qualified for high school 13.03*** (0.41) 13.02*** (0.40) 13.94*** (0.52) 14.70*** (0.39)
Constant -1.10*** (0.36) -1.08*** (0.36) -1.41*** (0.34) -0.75*** (0.26)
class variance 1.62 1.62 1.53 0.7
school variance 0.3 0.13 0.48 0.62
student variance 5.26 5.26 5.05 3.83
Notes: Standard error in brackets; * p<0.05, ** p<0.01, *** p<0.001. Students are scored on a scale ranging from 0 to 20, in the new grading system this is equivalent to a
grade of F to A, with F indicating that the student has failed the course

59
Table A4. Models for English. Class and school level variables
English
(1) (2) (3) (4) (5)
boy -1.41*** (0.34) -1.41*** (0.34) -1.40*** (0.34) -1.38*** (0.34) -1.34*** (0.34)
non-native, taking Swedish 0.73 (0.47) 0.69 (0.48) 0.95** (0.48) 0.90* (0.48) 0.89* (0.48)
non-native taking Swedish as 2nd lang -4.72*** (0.53) -4.68*** (0.57) -4.32*** (0.58) -4.23*** (0.58) -4.20*** (0.58)
absence: less than 5% (ref.)
5-10% 0.42 (0.47) 0.41 (0.47) 0.36 (0.47) 0.35 (0.47) 0.37 (0.47)
10-20% -0.46 (0.47) -0.48 (0.47) -0.49 (0.47) -0.50 (0.47) -0.48 (0.47)
20-50% -2.68*** (0.55) -2.72*** (0.55) -2.71*** (0.55) -2.73*** (0.55) -2.71*** (0.55)
50% and more -7.22*** (1.09) -7.28*** (1.10) -7.15*** (1.09) -7.06*** (1.09) -7.05*** (1.09)
School level
share of students with 2 parents from abroad 0.18 (0.13) 0.29** (0.12) 0.24** (0.11) 0.20* (0.11)
share of low/unknown parental education -0.23 (0.17) -0.09 (0.15) -0.06 (0.14) -0.03 (0.13)
Class level
share of foreign language speakers -9.37*** (1.96) -5.00* (2.83) -4.51* (2.74)
share of students with 2 parents having job 0.05** (0.02) 0.03 (0.03)
hdilg -0.08* (0.04)
Constant 13.94*** (0.52) 13.89*** (0.68) 14.00*** (0.62) 9.63*** (2.19) 11.33*** (2.28)
class variance 0.93 0.91 0.82 0.82 0.84
school variance 0 0 0 0.2 0
student variance 3.91 3.91 3.9 3.9 3.9
Notes: Standard error in brackets; * p<0.05, ** p<0.01, *** p<0.001. Students are scored on a scale ranging from 0 to 20, in the new grading system this is equivalent to a
grade of F to A, with F indicating that the student has failed the course; hdilg=Human Development Index (low).

60
Table A5. Swedish as the native language. Individual level variables
Swedish
(1) (2) (3) (4)
Boy -2.70*** (0.31) -2.70*** (0.31) -3.08*** (0.30) -2.70*** (0.24)
non-native, taking Swedish 0.79** (0.38) 0.37 (0.36) 0.19 (0.29)
other European, taking Swedish 0.49 (0.50)
other non-European, taking Swedish 1.10** (0.50)
Absence: less than 5% (ref.)
5-10% -0.03 (0.41) -0.16 (0.32)
10-20% -1.08*** (0.40) -0.60* (0.32)
20-50% -3.35*** (0.49) -1.85*** (0.39)
50% and more -5.79*** (0.93) -1.18 (0.77)
not qualified for high school -6.58*** (0.32)
Constant 13.62*** (0.30) 13.61*** (0.30) 14.95*** (0.39) 15.52*** (0.35)
class variance 0.93 0.91 0.82 0.82
school variance 0 0 0 0.2
student variance 3.91 3.91 3.9 3.9
Notes: Standard error in brackets; * p<0.05, ** p<0.01, *** p<0.001. Students are scored on a scale ranging from 0 to 20, in the new
grading system this is equivalent to a grade of F to A, with F indicating that the student has failed the course

61
Table A6. Swedish as the native language. Class and school level variables
Swedish
(1) (2) (3) (4) (5)
boy -3.08*** (0.30) -3.09*** (0.30) -3.05*** (0.30) -3.04*** (0.30) -3.03*** (0.30)
non-native, taking Swedish 0.37 (0.36) 0.41 (0.38) 0.57 (0.38) 0.56 (0.38) 0.56 (0.38)
absence: less than 5% (ref.)
5-10% -0.03 (0.41) -0.04 (0.41) -0.06 (0.41) -0.06 (0.41) -0.05 (0.41)
10-20% -1.08*** (0.40) -1.07*** (0.40) -1.06*** (0.40) -1.06*** (0.40) -1.05*** (0.40)
20-50% -3.35*** (0.49) -3.34*** (0.49) -3.29*** (0.49) -3.29*** (0.49) -3.29*** (0.49)
50% and more -5.79*** (0.93) -5.73*** (0.93) -5.68*** (0.93) -5.61*** (0.93) -5.63*** (0.93)
School level
share of students with 2 parents from abroad 0.12 (0.08) 0.17** (0.08) 0.16* (0.09) 0.15* (0.09)
share of low/unknown parental education -0.19* (0.11) -0.10 (0.11) -0.10 (0.11) -0.08 (0.11)
Class level
share of foreign language speakers -4.88** (1.93) -3.51 (2.53) -3.55 (2.54)
share of students with 2 parents having job 0.02 (0.02) 0.01 (0.02)
hdilg -0.03 (0.04)
Constant 14.95*** (0.39) 15.20*** (0.49) 15.19*** (0.47) 13.60*** (1.94) 14.17*** (2.08)
class variance 0.93 0.91 0.82 0.82 0.84
school variance 0 0 0 0.2 0
student variance 3.91 3.91 3.9 3.9 3.9
Notes: Standard error in brackets; * p<0.05, ** p<0.01, *** p<0.001. Students are scored on a scale ranging from 0 to 20, in the new grading system this is
equivalent to a grade of F to A, with F indicating that the student has failed the course; hdilg=Human Development Index (low).

62
Table A7. Swedish as a second language. Individual level variables
Swedish as a second language
(1) (2)
boy -1.07 (0.81) -1.21 (0.77)
European, taking Swedish as 2nd lang (ref.)
non-European taking Swedish as 2nd lang -0.44 (1.23) -0.19 (1.15)
Absence: less than 5% (ref.)
5-10% -1.57 (1.03)
10-20% -0.74 (1.19)
20-50% -5.05*** (1.12)
50% and more -5.72** (2.38)
Constant 8.53*** (1.68) 10.20*** (1.85)
class variance 0.85 1.33
school variance 2.91 3.23
student variance 5.29 4.9
Notes: Standard error in brackets; * p<0.05, ** p<0.01, *** p<0.001. Students are scored on a scale
ranging from 0 to 20, in the new grading system this is equivalent to a grade of F to A, with F
indicating that the student has failed the course

63
Table A8. Swedish as a second language. class and school level variables
Swedish as a second language
(1) (2) (3) (4) (5)
boy -3.08*** (0.30) -3.09*** (0.30) -3.06*** (0.30) -3.04*** (0.30) -3.04*** (0.30)
absence: less than 5% (ref.)
5-10% -0.04 (0.41) -0.06 (0.41) -0.08 (0.41) -0.08 (0.41) -0.07 (0.41)
10-20% -1.12*** (0.40) -1.12*** (0.40) -1.13*** (0.40) -1.13*** (0.40) -1.12*** (0.40)
20-50% -3.40*** (0.48) -3.39*** (0.48) -3.38*** (0.48) -3.37*** (0.48) -3.37*** (0.48)
50% and more -5.88*** (0.92) -5.86*** (0.93) -5.85*** (0.92) -5.78*** (0.93) -5.80*** (0.93)
School level
share of students with 2 parents from abroad 0.13 (0.08) 0.18** (0.08) 0.16* (0.09) 0.15* (0.09)
share of low/unknown parental education -0.19* (0.11) -0.11 (0.11) -0.10 (0.12) -0.08 (0.11)
Class level
share of foreign language speakers -4.37** (1.90) -2.88 (2.50) -2.97 (2.50)
share of students with 2 parents having job 0.02 (0.02) 0.01 (0.02)
hdilg -0.03 (0.04)
Constant 15.06*** (0.38) 15.24*** (0.48) 15.25*** (0.47) 13.52*** (1.94) 14.13*** (2.08)
class variance 0.93 0.91 0.82 0.82 0.84
school variance 0 0 0 0.2 0
student variance 3.91 3.91 3.9 3.9 3.9
Notes: Standard error in brackets; * p<0.05, ** p<0.01, *** p<0.001. Students are scored on a scale ranging from 0 to 20, in the new grading system
this is equivalent to a grade of F to A, with F indicating that the student has failed the course; hdilg=Human Development Index (low).

64
Table A9. Grade point average (meritvärde). Individual and class level variables
Grade point average
1 2 3 4 5 6 7 8 9
boy -23.0*** (4.2) -23.4*** (4.2) -23.4*** (4.2) -29.8*** (3.6) -29.8*** (3.6) -22.7*** (2.7) -22.8*** (2.7) -32.4*** (3.8) -32.4*** (3.8)
non-native, taking Swedish 10.2* (5.7) 2.5 (4.9) 3.5 (4.9) 1.7 (3.6) 2.1 (3.6) 2.5 (5.2) 3.0 (5.2)
non-native, taking Swedish as 2nd lang -32.1*** (6.5) -34.3*** (5.7) -29.2*** (5.7) -8.0* (4.3) -6.0 (4.4) -26.0*** (7.3) -23.9*** (7.6)
other European, taking Swedish 9.0 (7.5) 9.8 (7.5)
other European, taking Swedish as 2nd
lang -31.4** (14.3) -27.9** (14.2)
other non-European, taking Swedish 12.1 (7.4) 12.6* (7.4)
other non-European taking Swedish as 2nd
lang -30.5*** (6.8) -24.8*** (6.8)
absence: less than 5 % (ref.)
5-10% -7.1 (4.9) -6.7 (4.9) -7.9** (3.6) -7.8** (3.6) -7.5 (5.2) -7.6 (5.2)
10-20% -23.5*** (4.9) -23.1*** (4.9) -15.7*** (3.7) -15.6*** (3.7) -26.4*** (5.3) -26.3*** (5.3)
20-50% -74.5*** (5.7) -73.8*** (5.6) -47.1*** (4.3) -47.3*** (4.3) -74.3*** (6.2) -74.5*** (6.2)
50 % and more -151.0***
(10.7)
-151.0***
(10.6) -84.2*** (8.3) -84.8*** (8.3)
-154.9***
(11.3)
-154.8***
(11.3)
not qualified for high school -93.1*** (3.4) -92.2*** (3.4)
went to the same school at grade 6 1.2 (5.7) 0.6 (5.7)
Class level
migrated to Sweden past 4 years -0.9*** (0.2) -0.9*** (0.2) -0.3** (0.2) -0.3 (0.4)
Constant 212.3*** (4.8) 212.1*** (4.9) 217.0*** (4.4) 243.2*** (5.6) 247.6*** (5.1) 250.9*** (4.2) 252.4*** (4.2) 247.9*** (5.6) 249.1*** (5.8)
class variance 20.52 20.75 15.88 19.73 14.75 12.67 11.95 14.02 14.22
school variance 0 0 0 3.01 0 4.99 4.85 0 0
student variance 62.2 62.21 62.13 52.67 52.6 39.03 39.01 50.54 50.53
Notes: Standard error in brackets; * p<0.05, ** p<0.01, *** p<0.001.The grade point average for primary schools is created by summing the 16 best final grades. The grade according to the old
grading system is MVG=20, VG=15 and G=10. The grade point average may be calculated according to the new by summing the value of each given grade: A=20, B=17, 5, C=15, D=12, 5 E=10 and
F= 0; hdilg=Human Development Index (low)

65
Table A10. Grade point average (meritvärde) .Individual, class and school level variables
Grade point average
1 2 3 4 5 6 7
boy -29.8*** (3.6) -29.9*** (3.6) -29.8*** (3.6) -29.9*** (3.6) -29.7*** (3.6) -29.1*** (3.5) -28.8*** (3.5)
non-native, taking Swedish 2.5 (4.9) 2.7 (5.0) 3.7 (5.0) 2.7 (5.0) 5.6 (5.0) 5.1 (5.0) 5.0 (5.0)
non-native taking Swedish as 2nd lang -34.3*** (5.7) -31.9*** (6.0) -33.7*** (6.0) -31.8*** (6.1) -29.8*** (6.1) -28.7*** (6.1) -28.3*** (6.1)
absence: less than 5% (ref.)
5-10% -7.1 (4.9) -7.3 (4.9) -6.9 (4.9) -7.3 (4.9) -7.1 (4.9) -7.0 (4.9) -6.7 (4.9)
10-20% -23.5*** (4.9) -23.9*** (4.9) -23.0*** (4.9) -23.9*** (5.0) -22.9*** (4.9) -22.6*** (4.9) -22.4*** (4.9)
20-50% -74.5*** (5.7) -74.7*** (5.7) -74.2*** (5.7) -74.7*** (5.7) -73.7*** (5.6) -73.1*** (5.6) -72.9*** (5.6)
50% and more -151.0***
(10.7)
-151.2***
(10.7)
-150.9***
(10.7)
-151.1***
(10.7)
-149.9***
(10.7)
-148.0***
(10.6)
-147.9***
(10.6)
School level
share of students with 2 parents from
abroad 2.6* (1.4) 1.8* (1.1) 1.8 (1.3) 3.3*** (0.9) 2.9*** (0.8) 2.3*** (0.9)
share of low/unknown parental education -3.7** (1.8)
share of unknown parental education -16.8** (8.1) -9.6 (7.0) -11.0* (6.2) -7.9 (6.1)
share of low parental education -3.3* (2.0)
Class level
share of foreign language speakers -1.0*** (0.2) -0.2 (0.3) -0.1 (0.3)
share of students with 2 parents having job 1.0*** (0.3) 0.7*** (0.3)
hdilg -0.8* (0.4)
Constant 243.2*** (5.6) 247.4*** (7.3) 253.4*** (8.0) 246.0*** (7.5) 251.7*** (7.0) 168.4***
(23.8)
187.6***
(24.7)
class variance 19.73 19.12 19.03 19.63 14.66 11.24 10.64
school variance 3.01 0 0 0 0 2.53 0
student variance 52.67 52.66 52.66 52.66 52.63 52.61 52.62
Notes: Standard error in brackets; * p<0.05, ** p<0.01, *** p<0.001. The grade point average for primary schools is created by summing the 16 best final grades. The
grade according to the old grading system is MVG=20, VG=15 and G=10. The grade point average may be calculated according to the new by summing the value of each
given grade: A=20, B=17, 5, C=15, D=12, 5 E=10 and F= 0; hdilg=Human Development Index (low).

66
Table A11: Background characteristics of children by language origin
Education Human Development Index
Group
Single
parent
Financial
Assistance
Both
parents
employed
Unknown Basic High
School
After High
School
Low Middle High Very
High
Swedish 10.5 10.0 69.5 0.2 7.0 44.7 47.3 3.0 4.1 2.4 1.0
other European, taking Swedish 13.4 16.3 59.4 0.7 12.5 35.1 50.8 5.6 8.9 4.1 0.9
other European, taking Swedish
as 2nd lang
15.9 29.9 35.4 1.9 19.9 48.0 30.4 9.7 15.0 2.1 4.3
other non-European, taking
Swedish
14.3 22.4 52.5 0.9 15.2 44.4 39.1 6.8 11.6 5.2 0.6
other non-European taking
Swedish as 2nd lang
16.9 29.2 35.8 3.4 21.7 44.2 31.5 11.8 17.9 5.0 2.2
Note: All the indicators in this table refer to the proportion of children in each class.

67
Figure A1. World map indicating the categories of Human Development Index by country (based on 2013 data, published on July 24, 2014).

68
Table A12: Background information on Navestadsskolan
class 1 2 3 4 6
number of students 28 25 26 22 15
non-native, taking Swedish 46.4 62.5 28 36.4 6.7
non-native, taking Swedish as a
second language 17.9 8.3 8 9.1 93.3
mother-tongue Somaliska,
Arabiska,
Dari/Parsi/Persian,
Syriska,
Serbokroatiska,
Bosniska
Syriska,
Arabiska,
Engelska,
Mandarin,
Somaliska,
Serbokroatiska,
Kurdiska, Finska,
Romani,
Turkiska
Arabiska,
Spanska, Polska
Arabiska,
Spanska,
Kinyarwanda,
Syriska,
Somaliska
Arabiska, Syriska,
Dari/Parsi/Persian,
Somaliska,
Serbokroatiska,
Polska
unknown education 0 0 0 0 17.6
low education 22.2 20 0 13.6 52.9
high school education 51.9 40 24 45.5 17.6
after high school education 22.2 40 72 40.9 17.6
single parent 11.1 16 16 13.6 17.6
benefit receiving households 22.2 32 0 18.2 17.6
both parents employed 40.7 40 72 59.1 0
migrated to Sweden 2 years ago 11.1 0 0 0 52.9
migrated to Sweden 4 years ago 14.8 0 0 13.6 100
migrated to Sweden 6 years ago 22.2 12 0 13.6 100
Note: The socio-economic variables in this table refer to the share of children in each class.

69
Table A13. Classification of languages
European Albanska, Bosniska, Engelska, Finska, Franska, Grekiska, Italienska, Kroatiska, Lettiska, Makedonska, Polska, Ryska, Serbiska, Serbokroatiska, Spanska, Tyska
non-European Arabiska, Bengaliska, Dari/Parsi/Persian, Kinesiska: Mandarin, Kinyarwanda, Kurdiska, centr. (Irak), Kurdiska, norra (Turkiet), Kurdiska, södra (Iran), Lingala, (Kongo-Kinshasa, Kongo-Brazzaville), Luganda/Ganda, (Uganda), OLDKurdiska, OLDRomani, Oromo (Etiopien, Kenya), Persiska, Punjabi (Indien), Romani: Arli, Dzambasi, Gurbeti, Somaliska, Syriska, Syriska, Assyriska, Aturaya, Sooreth, Sureth, Suryaya, Swada, Tagalog (Filippinerna), Thai, (Thailand), Tigre, (Eritrea), Tigrinja ((Etiopien, Eritrea), Tjeckiska, Turkiska