mincon annual report & consolidated financial statements · our 2015 performance and results...
TRANSCRIPT

The Driller’s Choice Worldwide
YEAR ENDED 31 DECEMBER 2015
MINCONANNUAL REPORT& CONSOLIDATEDFINANCIALSTATEMENTS

MINCONBECAUSE THETOUGHEST JOBSDEMAND THETOUGHEST TOOLS.At MINCON, we understand that high quality products increase productivity. That’s why we set and
maintain industry-leading standards across our range of products for durability, reliability and longevity.

_________________________________________________________________________________________ TABLE OF CONTENTS
Page Corporate Profile 1 Chairman’s Statement 2 Chief Executive Officer’s Review 3 Operating and Financial Review 4 Strategy of the Group 9 Directors and management 11 Directors’ Report 14 Directors’ Statement on Corporate Governance 17 Principal Risks and Uncertainties 20 Group Financial Statements: Statement of Directors’ Responsibilities 23 Independent Auditor’s Report 24 Consolidated Income Statement 26 Consolidated Statement of Comprehensive Income 27 Consolidated Statement of Financial Position 28 Consolidated Statement of Cash Flows 29 Consolidated Statement of Changes in Equity 30 Notes to the Consolidated Financial Statements 31 Separate Financial Statements of the Company: Company Statement of Financial Position 57 Company Statement of Cash Flow 58 Company Statement of Changes in Equity 59 Notes to the Company Financial Statements 60

CORPORATE PROFILE
1
Mincon Group Plc (“the Company” or “the Group”) is an Irish engineering group with its shares trading on the AIM market of the London Stock Exchange and the ESM market of the Irish Stock Exchange. The Company specialises in the design, manufacture, sale and servicing of rock drilling tools and associated products. The Company’s strategy is to increase its share of the global rock-drilling consumables market through organic growth and acquisitions. Its manufacturing facilities are located in Ireland, the UK, the USA, Canada and Australia. The Company also maintains a network of sales and distribution companies in a number of international markets to provide after sales support and service to customers.
Directors: Padraig McManus - Non Executive Chairman (Irish) Kevin Barry – Non Executive Director (Irish) Rose Hynes – Senior Independent Non-Executive Director (Irish)
Joseph Purcell – Chief Executive Officer (Irish) Thomas Purcell – Sales Director (USA) Patrick Purcell – Non Executive Director (Irish) Company Secretary: John Doris (Irish) Registered Office: Smithstown Industrial Estate Shannon Co. Clare Ireland Nominated Adviser, ESM Adviser Davy and Broker: 49 Dawson Street Dublin 2 Ireland Legal advisers to the Company: William Fry 2 Grand Canal Square Dublin 2 Ireland Auditor: KPMG 1 Stokes Place St Stephen’s Green Dublin 2 Ireland Registrar: Computershare Investor Services (Ireland) Limited Heron House Corrig Road Sandyford Industrial Estate Dublin 18 Ireland Principal Bank: Allied Irish Banks plc Shannon Co. Clare Ireland Company Website: www.mincon.com Ticker Symbols: ESM: MIO.IR AIM: MCON.L

CHAIRMAN’S STATEMENT
2
Overview
The success of Mincon is predicated on three core principles:
- A continuous programme of product and process development ensuring quality products, profits and positive cash flow;
- Dedicated after sales customer service and support; and - A recognition of the importance of the role of all our people in the success of our business.
When deciding to embark on life as a public company in 2013, the objectives were clear – to increase Mincon’s share of the rock-drilling consumables market through:
- Research and development; - Organic growth; and - Acquisitions.
With this in mind, certain specific targets were set, which have been reproduced in the strategy section of this annual report. During the past year the Group has made significant progress towards achieving those goals. We have taken the opportunity to update you on this progress here and in the strategy section. In addition, Management continue to pursue a number of additional acquisitions which offer the opportunity to further extend our existing product range and add new customers and new geographic markets. 2015 performance 2015 was another challenging year for the mining sector, Mincon’s largest business sector. Mincon is not immune to the challenges faced by all market participants in this industry. However, Mincon has continued to perform strongly through this cycle. The highlights of the past financial year were:
- 29% increase in revenue; - Operating margin of 14% (2014: 19%); - €7.4 million (2014: €4.8 million) net cash provided by operating activities; - Significant addition to our manufactured product range through the acquisition of Marshalls Carbide,
which produces tungsten carbide inserts used in the manufacture of our existing product range (DTH drill bits & Rotary drill bits);
- Increase in our global footprint with the acquisition of Mincon Chile, Mincon Tanzania and Ozmine (in Australia);
Further details are outlined in the operating and financial review section. We take a medium to long term outlook of our Company and the markets that we serve. The fundamentals of profits and cash flow are healthy in Mincon. Industry cycles are a fact of life and it is the objective of the management team to ensure the effects of the troughs of these cycles are controlled and minimised. In this context, availing of opportunities in the best long-term interest of the Company and shareholders is the key objective of the Company and the Board. Management change In May 2015, Joe Purcell was appointed Chief Executive Officer of the Mincon Group on the retirement of Kevin Barry. Joe has been with Mincon for 27 years, most recently serving as Chief Technical Officer for the Group, with oversight for the design and development of Mincon’s product range. We are delighted that Joe has taken over the role and we wish him every success in the future. Kevin Barry retired after 31 years with the Group, during which time he served as CEO of Mincon for 25 years. We are very pleased that Kevin has agreed to remain on the Board of Mincon in a non-executive capacity and we would like to record our appreciation for the many years of service that he has given to the Group. On behalf of the Board, I would like to thank all Group management and employees for their contribution to Mincon’s successful performance in 2015. Padraig McManus Chairman

CHIEF EXECUTIVE OFFICER’S REVIEW
3
The Mincon Group has delivered another strong performance in 2015 despite the downturn in the mining industry and the challenges faced by certain markets that we serve. In this difficult environment we grew our revenue by a healthy 29% and achieved a net profit margin of 11.4%. The decline in the commodity prices of base and precious metals such as gold, iron ore and copper has had a major impact on the global exploration and mining market and has also been a factor in the significant devaluation of certain key currencies in which we trade, particularly the South African Rand and the Australian Dollar. Given this global macroeconomic environment we are pleased with the robustness of our business model and the strong net margin delivered by the Group. The exploration industry is cyclical in nature and therefore our focus has always been on the production mining and other market sectors such as waterwell, geothermal and construction drilling, which are less cyclical and provide a more stable platform for the long term success and growth of the business. We continued to grow our product range through the acquisition in March 2015 of a carbide insert manufacturer (Marshalls), which are key components of our current range of pneumatic down-the-hole (DTH) bits and Rotary bits. Mincon is an engineering company at heart and our focus is always on the quality of our products. We are confident that the company with the best products will emerge from the current downturn in the mining industry in the strongest position. 2015 Financial Performance €15.7 million (29%) increase in revenue driven primarily by the following factors:
x Acquisition of Marshalls, which added €2.5 million of tungsten carbide insert sales in the nine month period post acquisition.
x Increased global presence with acquisitions in Chile, Australia and Tanzania. x DTH product sales increased 8% on a like for like basis. DTH product sales account for 52% of Group
revenue. x €3.0 million increase in Rotary product sales reflected the full year impact of the acquisition of Rotacan
in August 2014 (five months revenue in 2014). x Currency movements had a positive impact on revenue of approximately €2.2 million.
Net profit has decreased €1.2 million (13%) driven primarily by currency devaluation in the second half of 2015, most significantly in the South African Rand, which has resulted in a currency loss of approximately €1.2 million compared to a gain of €0.6 million in 2014. Other significant factors impacting net profit included:
x A €4.7 million increase in gross profit offset by a €5.1 million increase in operating expenses. The increase in gross profit and operating expenses has been largely driven by the seven acquisitions in the past two years.
x The Group’s investment in the future of the operation with the addition of key management personnel in areas such as research & development and sales.
x The impact on gross margin of pricing pressure for Mincon manufactured product and reduced margins on third party product distributed;
x A reduction in net finance income of €0.4 million due to the reduction in deposit rates for the Group’s net cash;
x A fair value gain in the calculation of the contingent liability for future buy-out options on majority owned subsidiaries.
Our 2015 performance and results reflect the strength of Mincon’s global manufacturing, sales and distribution platform and diversification across a number of different drilling industries such as production mining, exploration, geothermal, waterwell, construction and quarrying. Our developing market strategies continued to deliver strong performance despite a global background of reduced economic growth, falling precious metal prices and significant currency headwinds. In the past 12 months we have significantly increased our investment in the Group’s operations. We have done so in order to be well positioned to take advantage of expected improvements in our key markets. Although we still face challenges in several markets and sectors arising from economic uncertainty and continuing competitive and customer pressures, our strong financial position will provide us with the resources to capitalise on growth opportunities as they arise. Joe Purcell Chief Executive Officer

OPERATING AND FINANCIAL REVIEW
4
INDUSTRY OVERVIEW Mincon manufactures a range of rock-drilling DTH Hammers and Bits for a variety of industries including mining exploration, mining production, oil and gas drilling, water well drilling, geothermal drilling, construction, quarrying and seismic drilling. Mincon also provides a hard-rock HDD system to provide access for fibre optic cable laying and similar activities. In addition, Mincon through its subsidiary Marshalls Carbide Ltd manufacture tungsten carbide powder that is used in manufacturing process of Mincon DTH & Tricone bits and to service the global oilfield and gas sectors. Mincon’s largest customer market for product sales is the global mining industry. This industry is currently experiencing a period of contraction after recent years of strong growth. Metal commodities prices have fallen steadily since their peak in 2011 and 2012 back to levels not seen since late 2008. These declines forced many participants in the industry to start reducing their capital expenditure spends in line with this. There has been negative inventory growth for the major mining equipment manufacturers as they seek to protect their working capital position given uncertainty over the prospect of substantial capital goods orders by customers in the current environment. Despite some of the recent uncertainties as highlighted above, Mincon has been able to continue to grow its business due to a number of more specialised trends emerging in the global mining industry. Declining ore grades have now become a structural driver of the mining equipment market, especially in the consumables products space in which Mincon has particular specialisation. Complex, lower grade ore bodies lead to the requirement for more ore to be processed by miners, leading to higher utilization rates of equipment and increased wear and replacement volumes as a result. The aftermarket service offering and spare parts and consumables supplies have become important components of mining equipment manufacturers’ revenue streams and are of increasing importance in a slower industry growth scenario. Higher utilisation of equipment as described above, coupled with the increase in mine supplies means that customers now demand effective service, spare parts and consumables, often in the form of contracts where availability and productivity are key criteria. The spare parts and consumables market is also less cyclical than the larger capital goods segment and can result in more stable margins for participants with service offerings in the space. Despite the current slowdown being experienced by some players in the mining and drilling equipment industry, Mincon’s operating profitability has averaged 20% for the past three years, with 2015 being 14%. The Directors believe that this is due to Mincon’s focus on consumable rather than capital sales. During slowdowns in the mining industry, large capital purchases are frequently put on hold by mining companies, however they must continue with revenue generating activities which results in relatively stable usage of consumable equipment. Management has also observed that there has been a growth in sales within the HDD sector in recent years due to increasing acceptance by end users of this new and innovative drilling method. This, coupled with the Company’s focus on operational efficiency, investment to drive future performance and increasing market share in the markets in which it competes, has resulted in the strong performance in 2015.

OPERATING AND FINANCIAL REVIEW
5
HISTORICAL FINANCIAL PERFORMANCE
2015 2014 2013* 2012 2011 2010 Audited Audited Audited Audited Audited Audited Income statement €’000 €’000 €’000 €’000 €’000 €’000 Revenue 70,266 54,544 52,343 63,143 41,145 33,821 Gross profit 28,277 23,552 25,722 26,891 21,212 14,635 Operating profit 9,990 10,350 15,012 12,724 12,555 5,789 Profit before tax 9,623 11,249 13,732 13,228 11,266 6,206 Profit after tax 8,028 9,264 11,159 10,323 9,005 4,764 * Before exceptional items
Revenue mix A proportion of Mincon’s revenue is achieved from the sale of third party products through Mincon’s global distribution network. These products are complementary to Mincon’s core product offering of Hammers and Bits and include a range of products used by drillers on active sites, for example, drill rigs, drill pipe, top hammer product, coring product, mud pumps, tungsten carbide insert grinders and lubricants. The split of revenue between Mincon manufactured product and third party product is typically approximately 75/25. The most significant deviation from this split was in 2012 (67/33), mainly driven by a number of once-off sales of capital equipment in South Africa, Angola and the Democratic Republic of the Congo. Revenue – Mincon Manufactured Products Demand for Mincon manufactured product has increased by €11.0 million (26%). This growth was primarily driven by three factors
- A growth of €3.3 million (8%) in legacy Mincon product sales (excluding currency movements) largely due to the Group’s expanded global sales network.
- Additions to the Mincon product range through the acquisition of a Rotary product manufacturer in 2014 and a Tungsten carbide insert manufacturer in 2015. Combined, these entities contributed approximately €5.5 million of the increase in revenue.
- Favourable foreign currency movements, mainly in the US dollar, contributing €2.2 million. Revenue from our conventional down-the-hole (DTH) hammer represented 52% (2014: 59%) of Group turnover with sales of Reverse Circulation (RC), Horizontal Directional Drilling (HDD) and Rotary product representing 20% (2014: 18%) of Group turnover. Demand for our DTH grew 8% (excluding currency) driven by an increase in market share in West Africa, Southern Africa and Australia. HDD product was flat year-on-year with a slight increase in the demand for RC product, primarily in Africa. RC product sales are more cyclical depending largely on the global prices for precious metals and the corresponding demand for exploration product. This market is at an extremely low ebb currently, resulting in a significant reduction in invoiced sales of Mincon RC product from 2011 – 2013 levels.
€52.8m
€41.8m €40.7m €42.6m
€34.0m
€26.3m
€17.5m
€12.7m €11.6m€20.5m
€7.1m
€7.5m
€70.3m
€54.5m €52.3m
€63.1m
€41.1m€33.8m
€10.0m €10.4m€15.0m €12.7m €12.6m
€5.8m
2015 2014 2013* 2012 2011 2010
3rd Party Products
Mincon Products
Operating Profit

OPERATING AND FINANCIAL REVIEW
6
Revenue – Sale of third party products Sales of non Mincon manufactured product increased overall by 37% (€4.75 million) year-on-year. This increase was driven by the acquisition of three additional sales offices in Chile, Western Australia and Tanzania during 2015 and the full year impact of acquiring sales offices in Namibia and Eastern Australia in 2014. These acquisitions added in excess of €3.0 million of revenue in the five months of trading in 2014 post acquisition. Offsetting these increases were the lack of rig sales in 2015 (€2.2 million in 2014). Profit margins The reduction in gross margin from 43% in 2014 to 40% in 2015 is primarily attributable to the 37% increase in third party product sales, which earn a lower margin for the Group. Additionally, sales of Tungsten Carbide product earns a significantly lower gross margin than other Mincon manufactured products. Other factors impacting the gross margin for the year were pricing pressure on Mincon product sales and the impact of a reduction in RC product sales. Management’s primary focus is on the growth in sales of Mincon manufactured product, which generates a significantly higher margin compared to the distributorship margin received on the sale of third party product. Currency The Group’s worldwide presence creates currency volatility when compared year on year. In 2015, there were two major movements in Mincon’s operational currencies:
- A strengthening in the US Dollar of 16% on average compared to 2014, which resulted in an increase in the reported revenue for the year. Mincon has a significant US Dollar cost base through our operations in Illinois and Virginia in the USA and indirectly through our manufacturing plant in North Bay, Canada. As a result, the strengthening US Dollar did not significantly impact reported profit for 2015.
- A significant devaluation in the South African rand in the second half of the year with the closing rate being 20% lower than at 31 December 2014. This has resulted in a foreign currency loss of €1.2 million being recorded as a financing expense.
While Group management makes every effort to reduce the impact of this currency volatility, it is impossible to eliminate or significantly reduce this volatility given the location of our primary manufacturing facilities (mainly euro, GBP or USD denominated) and the markets which we serve (60% of revenue is to non-euro, GBP or USD markets). Additionally, the ability to increase prices for our products in these jurisdictions is limited by current market factors. Operating Costs Operating costs have increased by €5.1 million (38%) to €18.3 million primarily due to the seven acquisitions completed between August 2014 and March 2015, which added €4.2 million in operating expenses including restructuring and acquisition related costs. Total operating costs (excluding cost of sales) are on average 22% of revenue for the past four years and amounted to 26% in 2015. On a like for like basis, operating costs increased €0.9 million predominantly due to the investment in sales, research and development personnel and the increased promotional and marketing efforts of the Group.
Operating Profit and Profit attributable to shareholders
Operating profit declined €0.4 million (3%) in 2015 due to the increase in gross profit offset by the increase in operating expenses as outlined above. Profit attributable to shareholders reduced by €1.2 million as a result of:
- A reduction in operating profit of €0.4 million; - A reduction in net interest income of €0.4 million due to the reduction in deposit interest rates; and - A foreign exchange loss of €1.2 million compared to a gain in 2014 of €0.6 million, as noted earlier.
These were offset by: - A fair value gain of €0.7 million on the valuation of the contingent liability for remaining payments on
acquisitions completed in the past two years. The two most significant factors affecting this were a positive foreign exchange movement of €0.4 million and the early completion of the ABC Products buyout in Eastern Australia; and
- The reduction in the effective rate of tax from 18% in 2014 to 17% in 2015 was due to the change in the geographic spread of profits of the Group entities, reflective of (i) the impact on margins of the weakening of currencies in non-euro jurisdictions, and (ii) the change in mix of Mincon product revenue in 2015.

OPERATING AND FINANCIAL REVIEW
7
SUMMARY HISTORICAL FINANCIAL INFORMATION
2015 2014 2013 2012 2011 Audited Audited Audited Audited Audited Balance Sheet €’000 €’000 €’000 €’000 €’000 Assets employed Property, plant & equipment 17,277 16,399 13,540 14,701 11,612 Net working capital 36,926 34,179 23,539 24,810 17,635 Net taxation asset/(liability) 359 (488) (1,259) (1,537) (1,649) Investments and other liabilities Goodwill & other assets 11,801 10,443 2,041 2,478 2,655 Deferred contingent consideration and other liabilities (7,069) (6,857) - - - Financing assets/(liabilities) Net cash/(debt) 38,610 41,754 48,600 6,451 6,316 Total equity 97,904 95,430 86,337 46,903 36,569
Mincon’s balance sheet remains very strong with net assets of €97.9 million and net cash of approximately €38.6 million available for investment (2014: €41.7 million). The increase in net working capital of €2.7 million during 2015 was primarily attributable to the acquisition of three companies which added €1.4 million. Long term investments Mincon has adopted a long term approach to ensure that Mincon’s facilities and equipment meet the needs of future business and projects. This approach led to Mincon’s timely expansion into its modern and purpose built facilities in Benton, Illinois in the USA and Perth, Australia to adequately meet the needs of customers and suppliers in these two important markets. Mincon has invested approximately €17.5 million (2015: €1.8 million) over the past six years on capital expenditure projects resulting in spare capacity for future growth and significantly lower maintenance capital expenditure being anticipated on existing facilities over the next three years. However, the Group will continue to invest strategically in expansion capital expenditure over the coming years as it works towards meeting its IPO strategy of increasing the Group’s product range and expands into new geographical territories. The increase in property, plant and equipment in 2015 was mainly due to the acquisition of three companies during the year with property, plant and equipment valued at €1.7 million. Capital expenditure less disposals was significantly less than the depreciation charge for the year. For existing operations and products, the Group policy is for capital expenditure to be broadly equal to depreciation for the foreseeable future, unless there is a specific new project – which will be evaluated on its own merits. Net working capital Inventory – excluding drill rigs The nature of the industry in which Mincon operates requires the Group to maintain significant quantities of inventory on hand, of both (i) raw materials that have significant lead times for manufacturing plants, and (ii) finished goods in global locations to actively serve and service Mincon’s diverse customer base. As at 31 December 2015, Mincon had €28.2 million of inventory on hand, an increase of €4.1 million. This increase was primarily due to the acquisitions completed during the year. Due to the current state of the mining sector, these acquired entities were significantly undercapitalised at the date of acquisition, with approximately €1.8 million of inventory. Since acquisition, Mincon has invested heavily in these entities adding approximately €3.4 million of inventory with a view to increasing Mincon’s market share. Offsetting this increase, has been the impact of foreign currency which has reduced reported inventory by approximately €0.9 million at 31 December 2015 compared to 31 December 2014. Inventory – drill rigs In FY14 Mincon received the agency for the sale and service of two distinct models of production drill rigs in Southern Africa. These rigs are new to the market and the Group believes that this provides a significant opportunity to compete with the two established brands as Mincon seeks to grow market share in Southern Africa. In FY14, the Group purchased 13 Rigs, of which two have been sold and the board is confident that the remaining rigs will be sold or leased in 2016.

OPERATING AND FINANCIAL REVIEW
8
Net working capital (continued) Receivables Trade and other receivables amounted to €13.0 million at 31 December 2015, an increase of €1.2 million since 31 December 2014. This increase was entirely attributable to the acquisitions in the year (€1.5 million). On an overall basis, 89% of receivables are current (less than 90 days) at 31 December 2015, compared to 88% at 31 December 2014. Financing and cash flows Historically, the expansion of the business was primarily financed through internal cash resources and the Group continues to operate with low levels of debt. During 2015, Mincon generated operating cash flow of €7.4 million (2014: €4.8 million), which were utilised for capital expenditure of €1.8 million and paying dividends of €4.2 million. In November 2013, the Group raised €47.1 million by way of an initial public offering on ESM and AIM for the purpose of expanding the Group by way of acquisition and organic growth. During the year, Mincon purchased a majority share in four companies at a net cash cost of €4.6 million, bringing the Group’s total acquisition related spend to €10.8 million over the past two years. As part of these acquisitions, Mincon is committed to making further payments of approximately €6.4 million in the next two to four years to purchase the remaining 35% - 40% minority interest in four of these companies. Bank loans and finance leases amounted to €2.8 million as at 31 December 2015 (2014: €3.0 million). Where it makes economic sense, the Group will continue to maintain some level of operational debt for natural hedging and asset financing purposes.
STRATEGY OF THE GROUP
9
The Mincon strategy is straight-forward. Mincon has a small percentage of the global rock-drilling consumables market. The aim is to increase the Mincon share of this market through organic growth and through acquisitions with the objective of becoming a “one-stop-shop” for rock drilling consumables. Controlling the supply chain from manufacture to end-user, providing a high quality customer service and receiving real-time feedback from customers to inform product development is expected to enable the Group to maximise its margins.
Research and development
The Group’s strategy around research and development is to: x maintain a strong emphasis on continuing new product development of the consumable product lines; x improve the existing product range; and x continue to work closely with customers to design and manufacture products that better suit their
specific requirements on a bespoke basis.
Organic growth
The Group’s strategy around organic growth is to: x expand into geographical territories adjacent to Mincon’s existing geographic footprint; x enter into joint ventures with local partners in geographic territories where it is appropriate to do so; x open new manufacturing plants or new sales and distribution offices where it makes commercial sense
to do so; and x enter into strategic alliances with third parties which will add to Mincon’s suite of products available for
sale.
Acquisitions
Mincon has identified a pipeline of acquisition targets which are designed to: x extend the existing product range; or x defend margins or secure the supply of raw materials; or x add new products which are complementary to the existing product range or which add new customers
and/or new geographic markets. Acquisition candidates which the Company is considering represent a good geographic spread of opportunities and consideration payable on individual acquisitions is expected to be based on enterprise value in the region of €10-30m. The Board will assess and prioritise acquisitions on an ongoing basis based on an assessment of product (technical and commercial diligence), culture (assessment of integration issues and management fit) and price (delivering a sensible return on investment and being accretive to earnings). Mincon intends to use its liquid resources to further this objective over the next 12-24 months.
Strategic goals
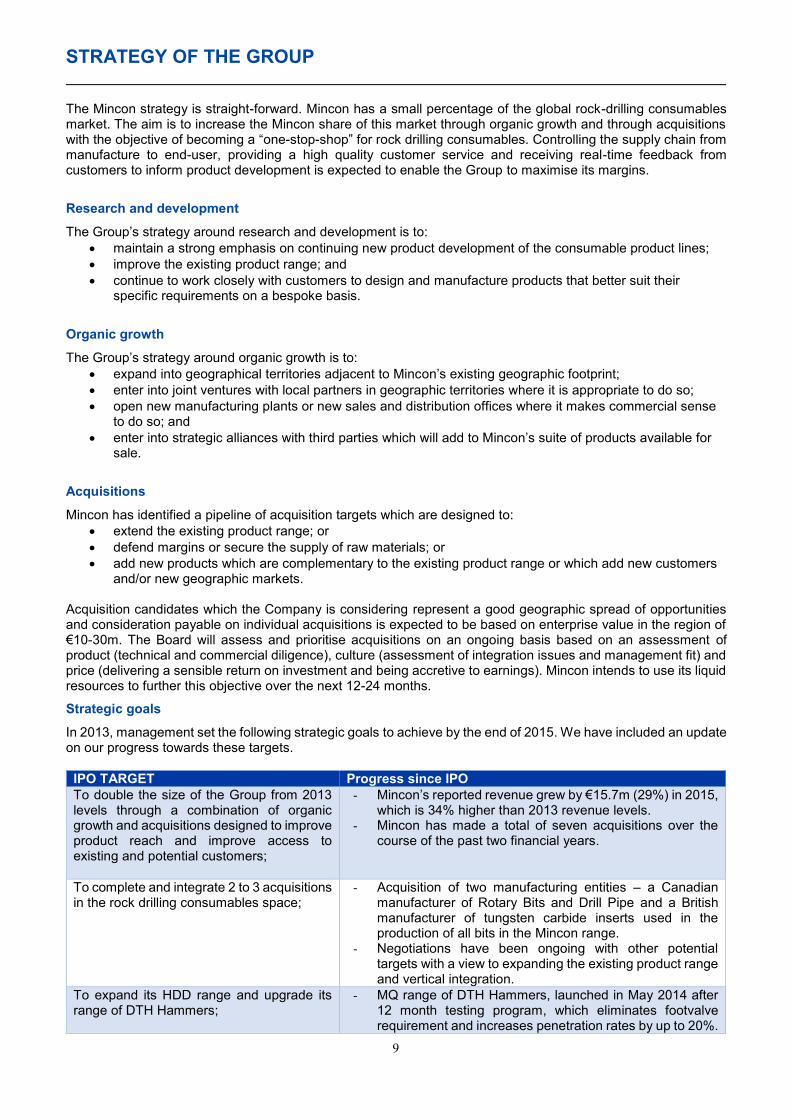
In 2013, management set the following strategic goals to achieve by the end of 2015. We have included an update on our progress towards these targets.
IPO TARGET Progress since IPO To double the size of the Group from 2013 levels through a combination of organic growth and acquisitions designed to improve product reach and improve access to existing and potential customers;
- Mincon’s reported revenue grew by €15.7m (29%) in 2015, which is 34% higher than 2013 revenue levels.
- Mincon has made a total of seven acquisitions over the course of the past two financial years.
To complete and integrate 2 to 3 acquisitions in the rock drilling consumables space;
- Acquisition of two manufacturing entities – a Canadian manufacturer of Rotary Bits and Drill Pipe and a British manufacturer of tungsten carbide inserts used in the production of all bits in the Mincon range.
- Negotiations have been ongoing with other potential targets with a view to expanding the existing product range and vertical integration.
To expand its HDD range and upgrade its range of DTH Hammers;
- MQ range of DTH Hammers, launched in May 2014 after 12 month testing program, which eliminates footvalve requirement and increases penetration rates by up to 20%.

STRATEGY OF THE GROUP
10
IPO TARGET Progress since IPO - Prototype testing complete on new DTH hammer. - Significant investment into R&D department with two new
hires in 2015. - Mincon has obtained the agency for the sale and service
of two distinct models of production drill rigs in Southern Africa. These rigs are new to the market and create a significant opportunity to compete with the two established brands as Mincon grows market share.
To enter new markets with sales offices in the Americas, EMEA and Australasia;
- New sales office opened in Peru in January 2014. - Acquisition of ABC Products in Queensland, Australia to
serve the east coast of Australia. - Acquisition of Mincon Namibia - Acquisition of Two Tusks Tanzania (Mincon Tanzania) - Acquisition of Ozmine International in Perth, Australia - Acquisition of Rotacan Sudamericana and Autana in Chile
(now Mincon Chile) - Will expand footprint further in 2016.
To strengthen the management team and add additional non-executive directors with appropriate skills; and
- New VP of Sales, Robert Fassl joined in August 2014 after the acquisition of Rotacan.
- CFO, Brian Lenihan hired in January 2014. - Peter Lynch stepped down as Chairman of the Group in
August 2014 and joined the management team as Chief Operating Officer in 2015.
- Rose Hynes joined the board of Mincon as Senior Independent non-Executive Director in December 2014. You can read further on the experience that each of these bring to the Group in the management profiles section.
To establish a progressive dividend policy. - Potential dividend block cleared by way of High Court order in May 2014.
- Fiscal year 2014 dividends amount to €4.2 million (€0.02 per share), being 46% of the FY14 attributable profit.
- Interim dividend for 2015 of €0.01 per share paid in September 2015.
- Final dividend of €0.01 per share recommended by the directors. Dividend will be subject to approval at AGM in May 2016 and paid within 28 days, if approved.
- This represents a dividend yield of approx. 2.3% on IPO market capitalisation.
- The Directors propose to keep the dividend at current levels for the foreseeable future, depending on profitability of the Group and having sufficient distributable profits.
To adopt a commercially sensible level of leverage;
- Mincon has taken on some external debt in Australia and the USA for natural hedging purposes. Will consider similar approach elsewhere.
- Other than for natural hedging purposes, there is no requirement to take on significant levels of debt at present.
- Company continues to be cash flow positive both on an operational level and also on a net basis, when acquisitions are excluded.
- Strong balance sheet with €38.6 million of net cash at 31 December 2015.

DIRECTORS AND MANAGEMENT
11
At 31 December 2015, the Board of Mincon comprised of four Non-Executive Directors and two Executive Directors. Details of the directors are set out below: NON-EXECUTIVE DIRECTORS Padraig McManus (Age 65) (Non-Executive Chairman) Padraig currently serves as Chairman of Eircom, Ireland’s largest telecommunications company, and was previously Chief Executive of Ireland's leading energy company, ESB, from 2002 to 2011. While Chief Executive of ESB, he oversaw some of the most significant transactions in the Group’s history including (i) the 2010 acquisition of NIE Networks for Stg£1.2 billion, personally overseeing the financial, political and general stakeholder issues in integrating the business into the ESB Group; (ii) the 2008 sale of a tranche of ESB’s Power Generation Portfolio to Endesa of Spain in a ground-breaking deal with trade unions and the Irish energy regulator to reduce dominance and allow competitors into the market; (iii) ESB’s first private placement fundraising package in the US of €0.9 billion in 2003; and (iv) the sale of ESB’s electrical appliance retail business and outlets to Bank of Scotland Ireland in 2005. He previously worked as a HR Manager in ESB and was part of every major restructuring programme in ESB that reduced core staff levels below 6,000. He led projects for ESB in Ghana, Sierra Leone, Gambia, Cambodia, the Philippines and Vietnam. Padraig is Chairman of the Council of the Economic and Social Research Institute of Ireland (ESRI) and the Curragh Racecourse. He has also served on a number of other boards including The Conference Board of the US. Rose Hynes (Age 58) (Senior Independent Non-Executive Director) Rose is a highly experienced non-executive director, having served on the boards of companies in a diverse range of industries over her career. She currently serves as Chairman of Shannon Group plc and Origin Enterprises plc, and also holds the position of senior independent non-executive director in Total Produce plc and One Fifty One plc. Rose previously held a number of senior executive positions with GPA Group plc and is a former board member of Ervia (formerly Bord Gais Eireann) Fyffes plc, Aer Lingus Group plc and Bank of Ireland. A lawyer by profession, Rose is a law graduate of University College Dublin and is also an Associate of the Irish Institute of Taxation and the Chartered Institute of Arbitrators. Patrick Purcell (Age 78) (Non-Executive Director) Patrick served an apprenticeship in the Irish Air Corps in the 1950s and later qualified as an accountant in Australia in 1961. When he returned to Ireland in 1967 he joined Shannon Diamond & Carbide Ltd, (later Boart Longyear) and worked in various capacities with their European Group Companies for the next 10 years. His roles with Shannon Diamond & Carbide included that of cost accountant, sales and marketing director and a period as a general manager of their manufacturing plant in Norway before becoming their director for European Sales Companies and Product Development. Patrick set up Mincon in 1977 and developed the Group, firstly in Ireland and then into overseas areas including USA, Canada, Australia, South Africa and Sweden. Patrick remained as Executive Chairman until 2012 but continued to work with the Company as an adviser on new projects. Kevin Barry (Age 60) (Non-Executive Director) Kevin commenced his career as a trainee accountant in practice in 1973. He joined Kraus & Naimer Ireland Limited as an accountant in 1977. He qualified as a Certified Public Accountant (“CPA”) and began working with Mincon International Limited in 1984 as Financial Controller. He was appointed Chief Executive Officer of the Mincon Group of companies in 1991 and was responsible for expanding the Group’s activities by extending the Mincon product range through organic growth and by setting up the Group’s international subsidiaries. Kevin resigned as Chief Executive Officer of Mincon Group plc in May 2015. Kevin has remained on the board of Mincon Group plc as a Non-Executive Director.

DIRECTORS AND MANAGEMENT
12
EXECUTIVE DIRECTORS Joseph Purcell (Age 49) (Chief Executive Officer) Joe qualified as a Mechanical Engineer in 1988 at University College Galway, in Ireland and since then has worked with Mincon in various capacities. DTH hammer design has been his main area of specialisation although he has extensive experience in manufacturing methods, heat treatment and process development. His hammer design work has included seven years in Perth, Australia where he developed a successful range of Reverse Circulation and Conventional DTH hammers for local and export markets. Joe was appointed as Chief Technical Officer for the Mincon Group on his return from Australia in 1998. In May 2015, Joe succeeded Kevin Barry as the Chief Executive Officer of Mincon Group plc. Thomas Purcell (Age 44) (Sales Director) Tom Purcell studied with the Association of Chartered Certified Accountants (“ACCA”) from 1989 to 1993. He worked for a year in professional practice at Vaughan & Company in Ennis, Ireland. Prior to completing his ACCA studies, he immigrated to the USA to work with Mincon on a new joint venture opportunity in the country. He worked for the Mincon Group in the dimensional stone quarrying industry during which time he was key in setting up operations in Virginia and North Carolina. In 1996, Mincon sold its investment in the quarrying entities to Marlin Group of South Africa. He worked in various positions with their USA subsidiary from Purchasing and Safety Manager of four quarrying companies, to CFO and Operations Manager for their Atlanta based operation, Stone Connection. He re-joined the Mincon Group in 1999 as president of Mincon, Inc. He continues to serve in this position in addition to his role as Group Sales Director. COMPANY SECRETARY John Doris (Age 69) (Company Secretary) John Doris B.Sc., M.B.A., F.C.C.A. is principal of Meridian Business Advisors Limited, a Dublin based consultancy firm. He graduated from University College Dublin with a B.Sc. in experimental physics in 1969 and completed his M.B.A. in 1977. He also qualified as an ACCA in 1974. He gained broad experience in both financial and marketing roles in industry, moving into rescue banking and corporate finance. He managed the successful Riada Business Expansion Funds when he was a director of ABN Amro Corporate Finance (Ireland) Limited. John serves on the boards of a number of private companies and is a former president of ACCA Ireland. John is widely experienced in manufacturing, distribution and corporate finance. John joined Mincon in September 2013 as interim Chief Financial Officer and Company Secretary and continues to serve as Company Secretary since the appointment of a Chief Financial Officer in January 2014. EXECUTIVE MANAGEMENT Mincon has a highly experienced team of senior managers that has helped to drive the development of the Group across its global locations. Brief profiles of the Mincon senior management team are set out below: Robert Fassl (Age 53) (Vice President of Sales and Managing Director of Rotacan) Robert joined Mincon in August 2014 after the acquisition of Rotacan - where he was assisting in an advisory role. He has over 30 years’ experience of the mining and construction industries. Prior to joining Rotacan, he served as Senior Executive Vice President and President of Mining and Rock Excavation Technique Business at Atlas Copco AB from July 1, 2011 to July 31, 2013. Mr. Fassl joined the Atlas Copco Group in 1982. From 1982 to 1998 he held several management positions in Atlas Copco Construction and Mining Technique business area in finance, service, logistics, purchasing and manufacturing. Between 1998 and 1999, he was General Manager in Atlas Copco Kango, Great Britain, a product company in the Atlas Copco Group. From 1999 to 2004, he was General Manager for Atlas Copco Exploration Products and from 2004 to 2011 he served as Divisional President for Atlas Copco Drilling Solutions. He managed the acquisition process of Ingersoll-Rand Drilling Solutions and was responsible for its integration into the Atlas Copco Group. Mr. Fassl has a Degree in Business Administration from Ekliden College, Nacka, Sweden.

DIRECTORS AND MANAGEMENT
13
Brian Lenihan (Age 34) (Chief Financial Officer) Brian Lenihan, ACA, AITI, joined Mincon Group plc as its Chief Financial Officer in January 2014. Brian is a Chartered Accountant (ACA), having qualified with KPMG in 2004. From 2005 to 2008, Brian worked in the audit practice of KPMG Boston. He was a director in KPMG since 2010. Brian has extensive experience of providing audit and capital market services to large Irish companies in the energy, manufacturing and pharmaceutical sectors. Brian has worked on public company transactions in both Ireland and the United States. Brian is also a Chartered Tax Advisor (AITI) in Ireland, holds a Bachelor degree in Accounting from University College Cork and is a former member of the American Institute of Certified Public Accountants (CPA). Peter E. Lynch (Age 58) (Chief Operating Officer) Mr. Lynch was Chairman of the Mincon Group from September 2013 to August 2014, when he stepped down to take an executive management position in the Group. In February 2015, he was appointed Chief Operating Officer. Mr Lynch qualified as a Chartered Accountant with KPMG in 1985. He joined NCB Stockbrokers in 1985 and, after a period as finance director of a software company, joined Riada Corporate Finance in 1988. He held a number of senior positions in ABN AMRO in Ireland including that of Group Operations Director, and Managing Director. In 1995 Mr Lynch joined Adare Printing Group plc as finance director. In 2000 he joined Eircom Group plc as chief financial officer. Circa €10 billion of transactions were led and executed by the team assembled by Mr Lynch during his six year tenure with Eircom including the takeover by Valentia for €3 billion, a bond issue of over US$1 billion, a second initial public offering of €800 million, a rights issue of €420 million, the acquisition of Meteor Mobile Communications Limited and the sale to Babcock and Brown Infrastructure Limited for €4.4 billion, as well as a number of multi-billion euro bank refinancings. Mr Lynch was executive chairman of Prime Active Capital, a quoted company on AIM and ESM, from May 2007 to May 2014. Mr Lynch graduated in economics from Trinity College Dublin in 1981 and is a member of the Securities Institute.

DIRECTORS REPORT
14
The Directors present the Directors’ report and the consolidated financial statements of Mincon Group plc (“Mincon”) for the year ended 31 December 2015. Principal activities of the Group Mincon is an Irish engineering group, specialising in the design, manufacture, sales and servicing of rock drilling tools and associated products. The Company’s manufacturing facilities are located in Shannon, Ireland, in Sheffield, in the UK, in Benton, Illinois in the USA, Ontario in Canada and in Perth, Australia. Mincon also maintains a network of sales and distribution companies in a number of international markets to provide after sales support and service to customers. Products, comprising both Mincon manufactured products and third party products which are complementary to Mincon’s own products, are sold directly to the end user or through distributors. Mincon manufactured product can be broken down into five distinct product lines:
1. Conventional Down The Hole (DTH) product
2. Reverse Circulation (RC) DTH product
3. Horizontal Directional Drilling (HDD) product
4. Rotary Drilling Product
5. Tungsten Carbide product
Mincon manufactured Hammers and Bits (including rotary bits) are used for a variety of drilling industries including production and exploration mining, water well, geothermal, construction, oil and gas and seismic drilling. Mincon also provides a hard-rock HDD system to provide access for fibre optic cable laying and similar activities. In addition, Mincon through its subsidiary Marshalls Carbide Limited, manufacture tungsten carbide inserts, its core markets being mining, construction and the oil & gas industry. DTH, RC & HDD products have distinct sales lines for associated parts, namely Hammers, Spares and Bits. Bits can be sold separate to the Hammer. Mincon manufactures a range of Bits to an industry standard size and can therefore be used in conjunction with Hammers manufactured by competitors. Rotary bits are made to industry standard size and are used in the same applications and industries as Mincon’s DTH Hammers and Bits. Tungsten Carbide high quality impact buttons are used on the face of DTH, Drifter & Tricone drill bits. The Mincon Hammers and Bits are considered consumable items in the drilling industry in contrast with capital items such as truck/track-mounted drilling rigs and large air compressors. As products of a consumable nature, Mincon products have a shorter life cycle than capital goods (such as rigs and compressors). Business review Commentaries on performance in the year ended 31 December 2015, including information on recent events and likely future developments, are contained in the Chairman’s Statement, Chief Executive Officer’s Review and Operating and Financial Review. The performance of the business and its financial position together with the principal risks faced by the Group are reflected in the Operating and Financial Review as well as the risk review section. The following table sets forth for the periods indicated certain financial data and the percentage change in these items compared to the prior period, being the key performance indicators used by management. The trends illustrated in the following table may not be indicative of future results. Percentage change in 2015 2014 period
Product revenue: €’000 €’000 Sale of Mincon product ................................................................................................. 52,786 41,816 26% Sale of third party product ............................................................................................. 17,480 12,728 37% Total revenue ................................................................................................................ 70,266 54,544 29%
Operating profit (excluding exceptional items) .............................................................. 9,990 10,350 (3%)
Net profit attributable to shareholders of the parent company ........................................ 7,980 9,134 (13%)

DIRECTORS REPORT
15
Dividend In September 2015, Mincon Group plc paid an interim dividend in the amount of €0.01 (1 cent) per ordinary share (€2.1 million total payment), which was paid to shareholders on the register at the close of business on 28 August 2015. The Directors recommend the payment of a final dividend of 1 cent per share for the year ended 31 December 2015. Directors and secretary The current serving directors and secretary of the Company are set out on page 1. The dates of appointments and resignations of the Company’s directors and secretary are set out in the table below: Director Date of appointment Padraig McManus 23 September 2013 Kevin Barry 16 August 2013 Rose Hynes 22 December 2014 Patrick Purcell 16 August 2013 Joseph Purcell 23 September 2013 Thomas Purcell 23 September 2013
Company Secretary John Doris 23 September 2013 Substantial shareholders As at close of business on 8 March 2016, in so far as is known to the Company, the following persons are, directly or indirectly, interested in 3% or more of the issued share capital of the Company: Shareholder Ordinary
Shares as at the date of
this Document
Percentage of Enlarged
Issued Ordinary Share
Capital Kingbell Company 119,671,200 56.84% Ballybell Limited 29,917,800 14.21% Setanta Asset Management 21,174,012 10.06% Langfrist 11,098,140 5.27% FMR LLC 6,526,958 3.10%
None of the Company’s major shareholders, as listed above, have different voting rights attaching to Ordinary Shares held by them in the Company. Both the Purcell and Barry family vehicles (Kingbell Company and Ballybell Limited) have certain board nomination rights for so long as their respective shareholdings remain above certain thresholds. Financial risk management The Group’s operations expose it to financial risks including credit risk, interest rate risk and foreign currency risk. The Group manages risk in order to reduce the impact of these risks on the performance of the Group and it is the Group’s policy to manage these risks on a non-speculative manner. The Group does not utilise derivative financial instruments to hedge economic exposures. Details of the Group’s financial risk management objectives and policies are set out in note 20 to the financial statements.

DIRECTORS REPORT
16
Political donations The Group and Company did not make any donations during the year disclosable in accordance with the Electoral Act 1997. Research and development The Group’s strategy around research and development is to set out in the Strategy section of this Annual Report. The Group invested approximately €0.7 million on research and development in 2015, all of which has been expensed in the period. Corporate governance The Board of Mincon is committed to achieving high standards of corporate governance, integrity and business ethics for all activities as set out in the Directors’ Statement on Corporate Governance of this Annual Report. Accounting records The directors believe that they have complied with the requirement of Section 281 to 285 of the Companies Act 2014 with regard to keeping adequate accounting records by employing accounting personnel with appropriate expertise and by providing adequate resources to the financial function. The accounting records of the company are maintained at the company’s offices at Smithstown Industrial Estate, Shannon, Co Clare. Significant events since year-end Details of significant events since year-end are set out in Note 26 to the financial statements. Going concern The Directors, having made enquiries, have a reasonable expectation that the Group and the Company have adequate resources to continue in operational existence for the foreseeable future. For this reason, they continue to adopt the going concern basis in preparing the financial statements. Auditor KPMG, Chartered Accountants continue in office in accordance with Section 383(2) of the Companies Act 2014. On behalf of the Board Padraig McManus Joe Purcell Chairman Chief Executive Officer 8 March 2016

DIRECTORS’ STATEMENT ON CORPORATE GOVERNANCE
17
The Board of Mincon is committed to maintaining high standards of corporate governance and has regard to the Quoted Companies Alliance set of governance guidelines for smaller quoted companies (the “QCA Guidelines”), which includes a code of best practice for AIM companies, comprising principles intended as a minimum standard, and recommendations for reporting corporate governance matters. The Directors recognise the importance of sound corporate governance and has taken account of the main principles of the QCA Guidelines, wherever possible and as appropriate to the size, nature and resources of the Group. It is also our intention to be as open and transparent about our governance arrangements as possible and use the annual report to give details of changes and improvements we have made during the year. The key aspects of the Company’s corporate governance are set out below. Managing and communicating risk and implementing internal control The Board is responsible for putting in place and communicating a sound system to manage risk and implementing internal control. The directors have outlined in the Principal Risks and Uncertainties section the key risks facing the Group and strategies to manage these risks.
Corporate communication and investor relations The Group recognises the importance of shareholder communications. There is regular dialogue between the executive directors and institutional shareholders as well as presentations at the time of release of annual and half year results. The Board is subsequently briefed on the views and concerns of institutional shareholders. The Group issues its results promptly to shareholders and they are also published on the Group’s website, www.mincon.com. The Company’s Annual General Meeting will afford each shareholder the opportunity to meet and engage directly with the Chairman of the Board and all other Board members. The annual report, including the notice of the Annual General Meeting, will be sent to all shareholders at least 21 days prior to the meeting.
The Board The Company is controlled through its Board of Directors. The Board comprises four non-executive directors and two executive directors. Biographical details on the Board members are set out in the section entitled “Board of Directors”. The Board is responsible for formulating, reviewing and approving the Group’s strategy, budgets and corporate actions. The Directors hold Board meetings at least quarterly and at other times as and when required. The Board has delegated responsibility for the day to day management of the Group to the Group’s executive management. There are clear divisions of responsibilities between the roles of the Chairman and Chief Executive Officer. Directors’ independence The Board currently comprises four non-executive directors and two executive directors. The Board has determined that Padraig McManus and Rose Hynes are independent within the meaning of the Quoted Companies Alliance (“QCA”) Guidelines as they have no direct or indirect interest in the shareholding of the Group, or any other relationship with a Group Company other than through their role as directors for Mincon Group plc. Patrick Purcell and Kevin Barry are not considered independent within the requirements of the QCA Guidelines by virtue of their shareholding in the Company. The two executives on the Board are Joe Purcell and Tom Purcell. Board Committees The Board has established an Audit Committee, a Remuneration Committee and a Nomination Committee with formally delegated duties and responsibilities. The Board deals with matters relating to health and safety and risk through the Board (as opposed to through a separate sub-committee). Audit committee The Audit Committee consists of three non-executive Directors; Rose Hynes, Kevin Barry and Padraig McManus. Padraig McManus served as Chairperson of the Audit Committee from 22 August 2014 to 5 March 2015. Rose Hynes was appointed to the Audit Committee on 5 March 2015 as Chairperson. From 1 January 2015 until 5 March 2015, Padraig McManus and Patrick Purcell were the serving members on the audit committee. Patrick Purcell resigned from the audit committee on 17 August 2015 and was replaced by Kevin Barry. The chief financial officer may also be invited to attend meetings of the committee. The committee is required to meet at least three times a year and is responsible for ensuring that the financial performance of the Group is properly monitored and reported on and for meeting with the auditors and reviewing findings of the audit with the external auditor. During 2015, the committee met on four occasions. It is authorised to seek any information it properly requires from any employee and may ask questions of any employee. It meets with the auditors at least once a year without any members of the management being present and is also responsible for considering and making recommendations regarding the identity and remuneration of such auditors. The terms of reference of the Committee are available on our website. The committee convened three times during 2015. All members were present at these meetings. The committee sets the remuneration of the external auditors.

DIRECTORS’ STATEMENT ON CORPORATE GOVERNANCE
18
Remuneration committee The Remuneration Committee consists of three Non-executive Directors; Padraig McManus as Chairman, Kevin Barry and Rose Hynes (appointed 5 March 2015). Kevin Barry replaced Patrick Purcell on the committee on 17 December 2015. It met once during 2015, considered and recommended to the Board the framework for the remuneration of the Chief Executive Officer, Chairman, Company Secretary, Chief Financial Officer, Executive Directors and such other officers as it is designated to consider and, within the terms of the agreed policy will, consider and recommend to the Board the total individual remuneration package of each Executive Director including bonuses, incentive payments and share awards. It is responsible for designing all incentive plans for approval by the Board and Shareholders and, for each such plan, recommend whether awards are made and, if so, the overall amount of such awards, the individual awards to Executive Directors and the performance targets to be used. No Director will be involved in decisions concerning his/her own remuneration. Details on Directors’ remuneration for the year is set out below. The terms of reference of the Committee are available upon request. Nomination committee The Nominations Committee consists of two Non-executive Directors; Padraig McManus as Chairman and Patrick Purcell. It met once during 2015 to consider the selection and re-appointment of Directors and the appointment of the Group Chief Executive Officer. It will identify and nominate candidates for all Board vacancies and review regularly the structure, size and composition (including the skills, knowledge and experience) of the Board and make recommendations to the Board with regard to any changes. Share ownership and dealing Mincon has adopted a Share Dealing policy that complies with Rule 21 of the AIM Rules and Rule 21 of the ESM Rules relating to directors’ dealings as applicable to AIM and ESM companies respectively. Mincon takes all reasonable steps to ensure compliance by applicable employees. Directors’ Remuneration Details of individual remuneration of directors are set out in the table below:
31 December 2015 31 December 2014
Name Title Salary €’000
Fees €’000
Pension €’000
Total €’000
Salary €’000
Fees €’000
Pension €’000
Total €’000
Padraig McManus Non-Executive Chairman - 42 - 42 - 42 - 42 Peter E. Lynch** Resigned - - - - - 23 - 23
Patrick Purcell Non-Executive Director - 10 - 10 - 40 - 40
Kevin Barry* Non-Executive Director 92 - 11 103 200 - 26 226
Rose Hynes Non-Executive Director - 40 - 40 - - - -
Joseph Purcell Chief Executive Officer 193 - 23 216 175 - 23 198
Thomas Purcell Group Sales Director 206 - 5 211 152 - 24 176 Total executive and non-executive remuneration 491 92 39 622 527 105 73 705
* Until date of resignation on 28 May 2015 ** From 1 January 2014 to date of resignation as a director on 22 August 2014 Patrick Purcell and Kevin Barry waived FY2015 board fees available to them in the amounts of €30,000 and €23,300 respectively. All Directors are paid directly by the Company with the exception of Thomas Purcell who is paid by Mincon Inc. The Executive Directors employment contracts dated 4 November 2013, include the ability to earn performance bonuses dependent on the performance of the Group and payable at the discretion of the Remuneration Committee. Each Executive Directors’ service contracts allows the company to terminate their employment by making a lump sum payment of one year’s base salary. The executive Directors received no bonuses for the year-ended 31 December 2015 (2014: €Nil).
DIRECTORS’ STATEMENT ON CORPORATE GOVERNANCE
19
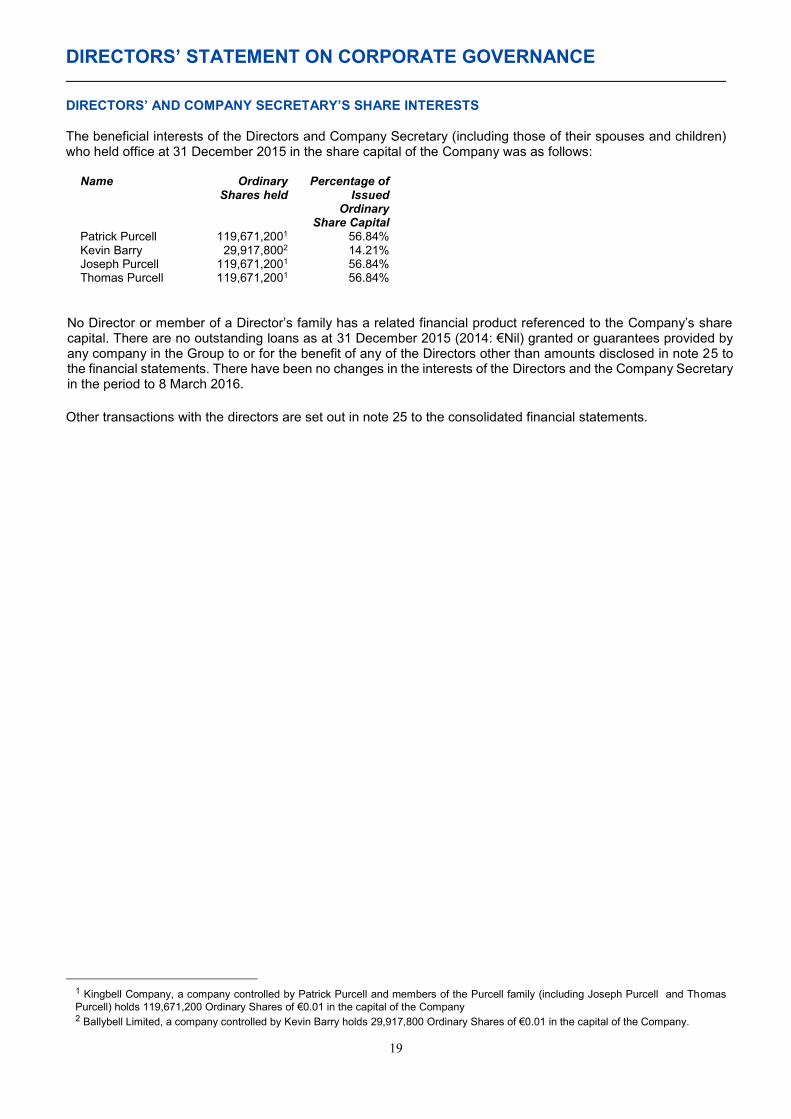
DIRECTORS’ AND COMPANY SECRETARY’S SHARE INTERESTS The beneficial interests of the Directors and Company Secretary (including those of their spouses and children) who held office at 31 December 2015 in the share capital of the Company was as follows:
Name Ordinary Shares held
Percentage of Issued
Ordinary Share Capital
Patrick Purcell 119,671,2001 56.84% Kevin Barry 29,917,8002 14.21% Joseph Purcell 119,671,2001 56.84% Thomas Purcell 119,671,2001 56.84%
No Director or member of a Director’s family has a related financial product referenced to the Company’s share capital. There are no outstanding loans as at 31 December 2015 (2014: €Nil) granted or guarantees provided by any company in the Group to or for the benefit of any of the Directors other than amounts disclosed in note 25 to the financial statements. There have been no changes in the interests of the Directors and the Company Secretary in the period to 8 March 2016. Other transactions with the directors are set out in note 25 to the consolidated financial statements.
1 Kingbell Company, a company controlled by Patrick Purcell and members of the Purcell family (including Joseph Purcell and Thomas Purcell) holds 119,671,200 Ordinary Shares of €0.01 in the capital of the Company 2 Ballybell Limited, a company controlled by Kevin Barry holds 29,917,800 Ordinary Shares of €0.01 in the capital of the Company.

PRINCIPAL RISKS AND UNCERTAINTIES
20
The Group’s principal risks and uncertainties are outlined in this section. Mincon has adopted appropriate controls and recruited management with the necessary skills and experience to manage and mitigate these risks where possible and thus enable execution of the Group’s business strategy as outlined in the Strategy section. PRINCIPAL RISKS RELATING TO THE COMPANY’S INDUSTRY The Group’s products are used in industries which are either cyclical or affected by general economic condition The demand for the Group’s products and services is affected by changes in customers’ investment plans and activity levels. Customers’ investment plans could change depending on global, regional and national economic conditions or in the case of a widespread financial crisis or economic downturn. The demand for the Group’s products is affected by the level of construction and mining activities as well as mineral prices. Financial crises may also have an impact on customers’ ability to finance their investments. In addition, changes in the political situation in a region or country or political decisions affecting an industry or country could also materially impact on investments in consumable equipment. Although the Company believes that its sales are well diversified with customers located in disparate geographic markets, it is likely that the Group would be affected by an economic downturn in the markets in which it operates. The Group is exposed to risks associated with operations in emerging markets The Group’s international operations may be susceptible to political, social and economic instability and civil disturbances. Risks of the Group operating in such areas may include:
x disruption to operations, including strikes, civil actions, international conflict or political interference; x changes to the fiscal regime including changes in the rates of income and corporation taxes; x reversal of current policies encouraging foreign investment or foreign trade by the governments of
certain countries in which the Group operates; x limited access to markets for periods of time; x increased inflation; and x expropriation or forced divestment of assets.
Any of the above factors could result in disruptions to the Group’s business, increased costs or reduced future growth opportunities. Potential losses caused by these disruptions may not be covered by insurance. The Group operates in countries with less developed legal systems The countries in which the Group operates may have less developed legal systems than countries with more established economies, which may result in risks such as:
x effective legal redress in the courts of such jurisdictions, whether in respect of a breach of law or regulation or in an ownership dispute, being more difficult to obtain;
x a higher degree of discretion on the part of governmental authorities; x a lack of judicial or administrative guidance on interpreting applicable rules and regulations; x an inability on the part of the Group to adequately protect its assets in these jurisdictions; x inconsistencies or conflicts between and within various laws, regulations, decrees, orders and
resolutions; or x relative inexperience of the judiciary and courts in such matters.
In certain jurisdictions, the commitment of local business people, government officials and agencies and the judicial system to abide by legal requirements and negotiated agreements may be more uncertain, creating particular concerns with respect to licences and agreements for business. These may be susceptible to revision or cancellation and legal redress may be uncertain or delayed. There can be no assurance that joint ventures, licences or other legal arrangements will not be adversely affected by the actions of government authorities or others and the effectiveness of and enforcement of such arrangements in these jurisdictions cannot be assured.

PRINCIPAL RISKS AND UNCERTAINTIES
21
RISKS RELATING TO THE COMPANY’S BUSINESS If the Group fails to develop, launch and market new products, respond to technological development or compete effectively, its business and revenues may suffer The Group’s long-term growth and profitability is dependent on our ability to develop and successfully launch and market new products. The Group’s revenues and market share may suffer if it is unable to successfully introduce new products in a timely fashion or if any new or enhanced products or services are introduced by our competitors that customers find more advanced and/or better suited to their needs. While the Group continuously invests in research and development to develop products in line with customer demand and expectations, if it is not able to keep pace with product development and technological advances, including also shifts in technology in the markets in which it operates, or to meet customer demands, this could have a material adverse effect on the Group’s business, results of operations and financial condition. The Group is dependent on the efficiency of our distribution network The Group distributes products primarily through distributors and also directly to end customers. Should the distribution network be subject to disruptions, it could have a material adverse effect on the Group’s revenues and results of operations. If the Group’s manufacturing and production facilities are damaged, destroyed or closed for any reason, our ability to distribute products will be significantly affected The Group has five manufacturing facilities located in Ireland, the UK, Australia, Canada and the United States and an assembly facility in the United States. Should any of these facilities be destroyed or closed for any reason, or the equipment in the facilities be significantly damaged, the Group is likely to face setbacks in our ability to manufacture and distribute products to customers. Such circumstances, to the extent that it is not possible to find an alternative manufacturing and production facility, or transfer manufacturing to other Group facilities or repair the damaged facilities or damaged equipment in a timely and cost-efficient manner, could have a material adverse effect on the Group’s business, results of operations and financial condition. In addition, the availability of manufacturing components is dependent on suppliers to the Group and, if they suffer interruptions or if they do not have sufficient capacity, this could have an adverse effect on the Group’s business and results of operations. Financial Condition Risks Future Revenues The Group relies on the ability to secure orders with new customers as well as maintain relationships with existing customers to generate most of our revenue. Investors should not rely on period to period comparisons of revenue as an indicator of future performance. Competition The markets for the Group’s products are highly competitive in terms of pricing, product design, service and quality, the timing and development and introduction of new products, customer services and terms of financing. The Group faces intense competition from significant competitors and to a lesser extent small regional companies. If we do not compete successfully in all of our business areas and do not anticipate and respond to changes in evolving market demands, including for new products, we will not be able to compete successfully in our markets, which could have a material adverse effect on the Group’s business, results of operations and financial condition. The Group is subject to competition in the markets in which it operates and some of its competitors are significantly larger and have significantly greater resources than the Group. The Group’s principle competitors are Atlas Copco which is headquartered in Stockholm, Sweden with a global reach spanning more than 170 countries and Sandvik which is also headquartered in Stockholm, Sweden with business activities in more than 130 countries. There can be no guarantee that the Group’s competitors or new market entrants will not introduce superior products or a superior service offering. Such competitors may have greater development, marketing, personnel and financial resources than the Group. Should these or other competitors decide to compete aggressively with the Group on price in the markets and industries in which it operates while offering comparable or superior quality products this could have a material adverse effect on the Group’s financial position, trading performance and prospects.

PRINCIPAL RISKS AND UNCERTAINTIES
22
RISKS RELATING TO THE COMPANY’S BUSINESS (continued) Financial Condition Risks (continued) The Group is exposed to the risk of currency fluctuation The Group’s financial condition and results of operations are reported in euro but a large proportion of its revenues are denominated in currencies other than euro, including the US dollar, the Australian dollar and the South African rand. Adverse currency exchange rate movements may hinder the Group’s ability to procure important materials and services from vendors and suppliers, may affect the value of its level of indebtedness, and may have a significant adverse effect on its revenues and overall financial results. In the past, the Group has experienced gains and losses from exchange rate fluctuations, including foreign exchange gains and losses from transactions risks associated with assets and liabilities denominated in foreign currencies, including inter-company financings. The Group has introduced measures to improve its ability to respond to currency exchange rate risks. However, these measures may prove ineffective, and exchange rate volatility, particularly between currency pairs that have traditionally been rather stable, may develop. As a result, the Group may continue to suffer exchange rate losses, which could cause operating results to fluctuate significantly and could have a material adverse effect on the Group’s business and financial condition. Contractual Arrangements The Group derives some of its revenue from large transactions (which may be non-recurring in nature). Prospective sales are subject to delays or cancellation over which the Group has little or no control and these delays could adversely affect results. Also to address the non-recurring nature of some of these transactions, the Group needs to focus on securing new lines of business on a regular basis. Customer Concentration Over the past three years, the Group’s top ten customers have accounted for approximately 28% of its revenues. If, in the future, these customers fail to meet their contractual obligations, decide not to purchase the Group’s products or decide to purchase few products, this could disrupt the Group’s business and require it to expend time and effort to develop relationships with new customers, which could have a material adverse effect on the Group’s business, results of operations and financial condition. There can be no assurance that, even if the Group could find alternate customers, the Group could receive the same price for its products. The Group is exposed to fluctuations in the price of raw materials The Group’s operations give rise to risks due to changes in the price of market-quoted raw materials, mainly steel and tungsten. The prices can vary significantly during a year. If the market does not permit a transfer of the effects of changing raw material prices into the end-price of the products, this may have a material adverse effect on the Group’s business, results of operations and financial condition.

STATEMENT OF DIRECTORS’ RESPONSIBILITIES
23
The directors are responsible for preparing the Annual report and the Group and Company financial statements, in accordance with applicable law and regulations. Company law requires the directors to prepare Group and Company financial statements for each financial year. Under that law and in accordance with AIM/ESM Rules, the Directors are required to prepare the Group financial statements in accordance with IFRS as adopted by the EU and applicable law and have elected to prepare the Company financial statements in accordance with IFRS as adopted by the EU and as applied in accordance with the Companies Act 2014. Under company law the directors must not approve the Group and Company financial statements unless they are satisfied that they give a true and fair view of the assets, liabilities and financial position of the Group and Company and of the Group’s profit or loss for that year. In preparing each of the Group and Company financial statements, the directors are required to: x select suitable accounting policies and then apply them consistently; x make judgements and estimates that are reasonable and prudent; x state whether they have been prepared in accordance with IFRS as adopted by the EU; and x prepare the financial statements on the going concern basis unless it is inappropriate to presume that the
Group and Company will continue in business. The directors are responsible for keeping adequate accounting records which disclose with reasonable accuracy at any time the assets, liabilities, financial position and profit or loss of the Company and which enable them to ensure that the financial statements of the Group are prepared in accordance with applicable IFRS, as adopted by the EU and comply with the provisions of the Companies Act 2014. They have general responsibility for taking such steps as are reasonably open to them to safeguard the assets of the Group and to prevent and detect fraud and other irregularities. Under applicable law, the directors are also responsible for preparing a Directors’ Report that complies with the Companies Act 2014. The directors are responsible for the maintenance and integrity of the corporate and financial information included on the Company's website. Legislation in the Republic of Ireland governing the preparation and dissemination of financial statements may differ from legislation in other jurisdictions.
On behalf of the Board Padraig McManus Joe Purcell Chairman Chief Executive Officer
INDEPENDENT AUDITOR’S REPORT
24
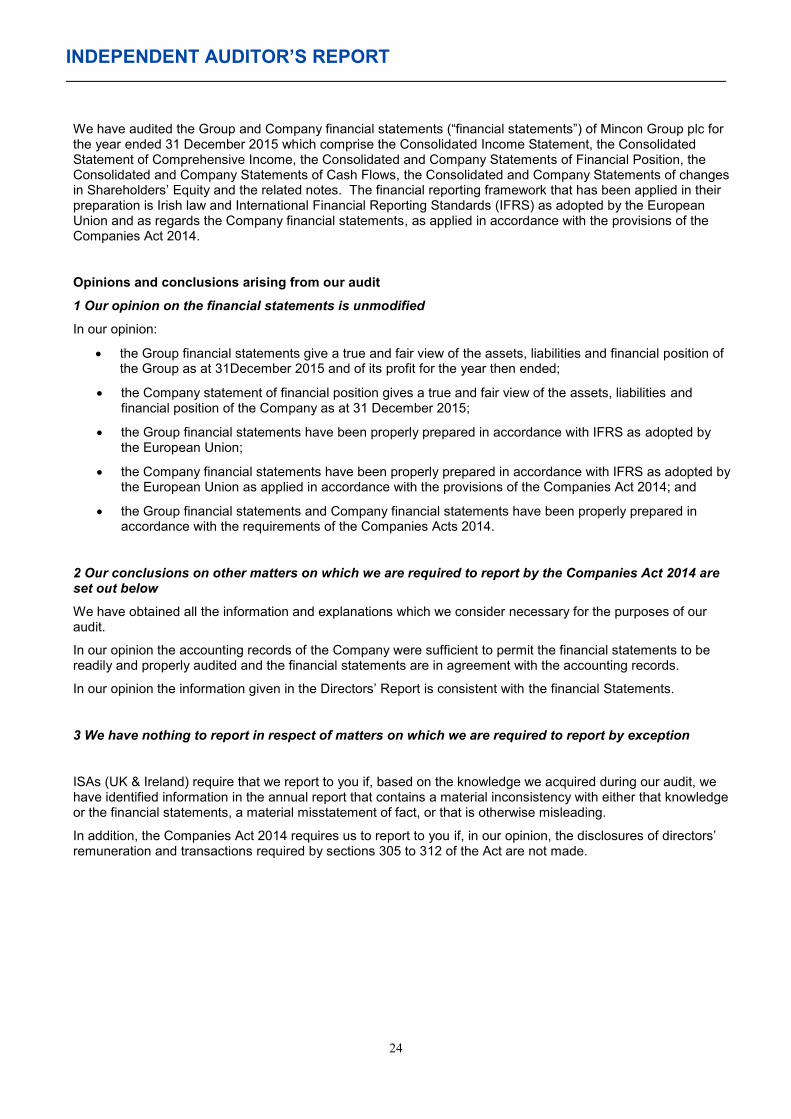
We have audited the Group and Company financial statements (“financial statements”) of Mincon Group plc for the year ended 31 December 2015 which comprise the Consolidated Income Statement, the Consolidated Statement of Comprehensive Income, the Consolidated and Company Statements of Financial Position, the Consolidated and Company Statements of Cash Flows, the Consolidated and Company Statements of changes in Shareholders’ Equity and the related notes. The financial reporting framework that has been applied in their preparation is Irish law and International Financial Reporting Standards (IFRS) as adopted by the European Union and as regards the Company financial statements, as applied in accordance with the provisions of the Companies Act 2014.
Opinions and conclusions arising from our audit
1 Our opinion on the financial statements is unmodified
In our opinion:
x the Group financial statements give a true and fair view of the assets, liabilities and financial position of the Group as at 31December 2015 and of its profit for the year then ended;
x the Company statement of financial position gives a true and fair view of the assets, liabilities and financial position of the Company as at 31 December 2015;
x the Group financial statements have been properly prepared in accordance with IFRS as adopted by the European Union;
x the Company financial statements have been properly prepared in accordance with IFRS as adopted by the European Union as applied in accordance with the provisions of the Companies Act 2014; and
x the Group financial statements and Company financial statements have been properly prepared in accordance with the requirements of the Companies Acts 2014.
2 Our conclusions on other matters on which we are required to report by the Companies Act 2014 are set out below
We have obtained all the information and explanations which we consider necessary for the purposes of our audit.
In our opinion the accounting records of the Company were sufficient to permit the financial statements to be readily and properly audited and the financial statements are in agreement with the accounting records.
In our opinion the information given in the Directors’ Report is consistent with the financial Statements.
3 We have nothing to report in respect of matters on which we are required to report by exception
ISAs (UK & Ireland) require that we report to you if, based on the knowledge we acquired during our audit, we have identified information in the annual report that contains a material inconsistency with either that knowledge or the financial statements, a material misstatement of fact, or that is otherwise misleading.
In addition, the Companies Act 2014 requires us to report to you if, in our opinion, the disclosures of directors’ remuneration and transactions required by sections 305 to 312 of the Act are not made.

INDEPENDENT AUDITOR’S REPORT
25
Basis of our report, responsibilities and restrictions on use As explained more fully in the Statement of Directors’ Responsibilities set out on page 23 the directors are responsible for the preparation of the financial statements and for being satisfied that they give a true and fair view and otherwise comply with the Companies Act 2014. Our responsibility is to audit and express an opinion on the financial statements in accordance with Irish law and International Standards on Auditing (UK and Ireland). Those standards require us to comply with the Financial Reporting Council’s Ethical Standards for Auditors. An audit undertaken in accordance with ISAs (UK & Ireland) involves obtaining evidence about the amounts and disclosures in the financial statements sufficient to give reasonable assurance that the financial statements are free from material misstatement, whether caused by fraud or error. This includes an assessment of: whether the accounting policies are appropriate to the Group and Company’ s circumstances and have been consistently applied and adequately disclosed; the reasonableness of significant accounting estimates made by the directors; and the overall presentation of the financial statements. In addition, we read all the financial and non-financial information in the Annual Report to identify material inconsistencies with the audited financial statements and to identify any information that is apparently materially incorrect based on, or materially inconsistent with, the knowledge acquired by us in the course of performing the audit. If we become aware of any apparent material misstatements or inconsistencies we consider the implications for our report. Whilst an audit conducted in accordance with ISAs (UK & Ireland) is designed to provide reasonable assurance of identifying material misstatements or omissions it is not guaranteed to do so. Rather the auditor plans the audit to determine the extent of testing needed to reduce to an appropriately low level the probability that the aggregate of uncorrected and undetected misstatements does not exceed materiality for the financial statements as a whole. This testing requires us to conduct significant audit work on a broad range of assets, liabilities, income and expense as well as devoting significant time of the most experienced members of the audit team, in particular the engagement partner responsible for the audit, to subjective areas of the accounting and reporting. Our report is made solely to the Company’s members, as a body, in accordance with section 391 of the Companies Act 2014. Our audit work has been undertaken so that we might state to the Company’s members those matters we are required to state to them in an auditor’s report and for no other purpose. To the fullest extent permitted by law, we do not accept or assume responsibility to anyone other than the Company and the Company’ s members as a body, for our audit work, for this report, or for the opinions we have formed. Ruaidhri Gibbons 8 March 2016 For and on behalf of KPMG Chartered Accountants, Statutory Audit Firm 1 Stokes Place St. Stephen’s Green Dublin 2, Ireland

CONSOLIDATED INCOME STATEMENT
26
For the year ended 31 December 2015 Notes
2015 €’000
2014 €’000
Continuing operations Revenue ........................................................................................................ 4 70,266 54,544 Cost of sales ................................................................................................. 6 (41,989) (30,992) Gross profit ................................................................................................. 28,277 23,552 General, selling and distribution expenses .................................................... 6 (18,287) (13,202) Operating profit ............................................................................................ 9 9,990 10,350 Finance cost ................................................................................................... (183) (204) Finance income ............................................................................................. 297 739 Foreign exchange gain/(loss) ........................................................................ (1,203) 580 Movement on contingent consideration ......................................................... 20(e) 722 (216) Profit before tax .......................................................................................... 9,623 11,249 Income tax expense ....................................................................................... 10 (1,595) (1,985) Profit for the year ........................................................................................ 8,028 9,264 Profit attributable to: - owners of the Parent .................................................................................. 7,980 9,134 - non-controlling interests .............................................................................. 48 130
Earnings per Ordinary Share Basic earnings per share, € .......................................................................... 18 3.79c 4.40c Diluted earnings per share, € ......................................................................... 18 3.79c 4.40c Weighted average number of ordinary shares in issue (’000)……...……… 210,541 207,581
The accompanying notes are an integral part of these financial statements.

CONSOLIDATED STATEMENT OF COMPREHENSIVE INCOME
27
For the Year Ended 31 December 2015 2015 2014 €’000 €’000 Profit for the year ..................................................................................................................... 8,028 9,264 Other comprehensive income/(loss): Items that are or may be reclassified subsequently to profit or loss: Foreign currency translation – foreign operations ...................................................................... (1,344) 1,818 Other comprehensive income/(loss) for the year ...................................................................... (1,344) 1,818 Total comprehensive income for the year ............................................................................. 6,684 11,082 Total comprehensive income attributable to: - owners of the Parent ............................................................................................................... 6,636 10,952 - non-controlling interests ........................................................................................................... 48 130
The accompanying notes are an integral part of these financial statements.

CONSOLIDATED STATEMENT OF FINANCIAL POSITION
28
As at 31 December 2015 2015 2014 Notes €’000 €’000 Non-Current Assets Goodwill ........................................................................................ 11 11,459 9,870 Property, plant and equipment ..................................................... 13 17,277 16,399 Deferred tax asset ........................................................................ 10 480 278 Other non-current assets ............................................................. 12 342 573 Total Non-Current Assets .......................................................... 29,558 27,120 Current Assets Inventory ...................................................................................... 14 32,045 28,365 Trade and other receivables ........................................................ 15 13,021 11,822 Other current assets ..................................................................... 649 116 Current tax asset .......................................................................... 733 408 Short term deposits ...................................................................... 20 30,781 30,630 Cash and cash equivalents .......................................................... 20 10,644 14,082 Total Current Assets .................................................................. 87,873 85,423 Total Assets ................................................................................ 117,431 112,543 Equity Ordinary share capital .................................................................. 17 2,105 2,105 Share premium ............................................................................. 17 67,647 67,647 Undenominated capital ................................................................ 39 39 Merger reserve .............................................................................. (17,393) (17,393) Share based payment reserve ..................................................... 19 16 16 Foreign currency translation reserve ............................................ (1,460) (116) Retained earnings ........................................................................ 46,485 42,715 Equity attributable to owners of Mincon Group plc ................ 97,439 95,013 Non-controlling interests ............................................................... 465 417 Total Equity ................................................................................ 97,904 95,430 Non-Current Liabilities Loans and borrowings .................................................................. 16 2,141 2,065 Deferred tax liability ...................................................................... 10 556 757 Deferred contingent consideration ................................................ 20 6,347 6,717 Other liabilities ............................................................................. 722 140 Total Non-Current Liabilities ..................................................... 9,766 9,679 Current Liabilities Loans and borrowings .................................................................. 16 674 893 Trade and other payables ............................................................ 6,780 3,804 Accrued and other liabilities ......................................................... 2,009 2,320 Current tax liability ....................................................................... 298 417 Total Current Liabilities ............................................................. 9,761 7,434 Total Liabilities ........................................................................... 19,527 17,113 Total Equity and Liabilities ......................................................... 117,431 112,543 The accompanying notes are an integral part of these financial statements. On behalf of the Board: Padraig McManus Joe Purcell Chairman Chief Executive Officer

CONSOLIDATED STATEMENT OF CASH FLOWS
29
For the Year Ended 31 December 2015 2015 2014 €’000 €’000 Operating activities: Profit for the period .................................................................................................................. 8,028 9,264 Adjustments to reconcile profit to net cash provided by operating activities: Depreciation ............................................................................................................................. 2,346 2,053 Fair value movement on deferred contingent consideration ..................................................... (722) 216 Finance cost ............................................................................................................................ 183 204 Finance income ....................................................................................................................... (297) (739) Income tax expense ................................................................................................................. 1,595 1,985 Other non-cash movements ..................................................................................................... 1,075 291 12,208 13,274 Changes in trade and other receivables ................................................................................. (1,572) (1,121) Changes in prepayments and other assets ............................................................................. (438) 185 Changes in inventory .............................................................................................................. (2,753) (1,684) Changes in capital equipment inventory .................................................................................. (338) (3,239) Changes in trade and other payables ...................................................................................... 2,264 (644) Cash provided by operations .................................................................................................. 9,371 6,771 Interest received ..................................................................................................................... 297 739 Interest paid ............................................................................................................................ (183) (204) Income taxes paid ................................................................................................................... (2,084) (2,512) Net cash provided by operating activities .......................................................................... 7,401 4,794 Investing activities Purchase of property, plant and equipment ............................................................................ (1,768) (2,365) Disposal of property, plant and equipment .............................................................................. - 615 Acquisitions, net of cash acquired ............................................................................................ (4,149) (6,198) Payment of deferred contingent consideration ......................................................................... (421) - Redemption of/(investment in) short term deposit ................................................................... (151) 9,370 (Investment in)/proceeds from joint venture investments ......................................................... 266 24 Net cash used in investing activities ................................................................................... (6,223) 1,446 Financing activities Dividends paid ......................................................................................................................... (4,210) (2,074) Repayment of loans and finance leases .................................................................................. (1,352) (2,105) Drawdown of loans ................................................................................................................. 1,100 1,900 Net cash provided by/(used in) financing activities ........................................................... (4,462) (2,279) Effect of foreign exchange rate changes on cash ................................................................... (154) 2 Net increase/(decrease) in cash and cash equivalents ..................................................... (3,438) 3,963 Cash and cash equivalents at the beginning of the year ......................................................... 14,082 10,119 Cash and cash equivalents at the end of the year ............................................................. 10,644 14,082 The accompanying notes are an integral part of these financial statements

CONSOLIDATED STATEMENT OF CHANGES IN EQUITY
30
For the year ended 31 December 2015
Share capital
Share premium
Merger reserve
Other reserve
Un-denominated
capital Capital
contribution
Share based
payment reserve
Foreign currency
translation reserve
Retained earnings Total
Non-controlling
interests Total
equity €’000 €’000 €’000 €’000 €’000 €’000 €’000 €’000 €’000 €’000 €’000 €’000 Balances at 1 January 2014 ....................... 2,113 145,036 (17,393) (79,300) - 953 - (1,934) 35,883 85,358 979 86,337 Comprehensive income: Profit for the year ......................................... - - - - - - - - 9,134 9,134 130 9,264 Other comprehensive income/(loss): Foreign currency translation ......................... - - - - - - - 1,818 - 1,818 - 1,818 Total comprehensive income .................... - - - - - - - 1,818 9,134 10,952 130 11,082 Transactions with Shareholders: Share based payments ................................ - - - - - - 16 - - 16 - 16 Dividends ..................................................... - - - - - - - - (2,074) (2,074) - (2,074) Acquisition of non-controlling interests ......... 31 1,911 - - - - - - (1,142) 800 (800) - Redemption of subscriber shares ................ (39) - - - 39 - - - (39) (39) - (39) Recognition of non-controlling interest on acquisition .................................................... - - - - - - - - - - 108 108
Reduction of share premium ........................ - (79,300) - 79,300 - - - - - - - - Recycle of capital contribution to retained earnings ....................................................... - - - - - (953) - - 953 - - -
Balances at 31 December 2014 ................. 2,105 67,647 (17,393) - 39 - 16 (116) 42,715 95,013 417 95,430 Comprehensive income: Profit for the year ......................................... - - - - - - - - 7,980 7,980 48 8,028 Other comprehensive income/(loss): Foreign currency translation ......................... - - - - - - - (1,344) - (1,344) - (1,344) Total comprehensive income .................... (1,344) 7,980 6,636 48 6,684 Transactions with Shareholders: Dividends ..................................................... - - - - - - - - (4,210) (4,210) - (4,210) Balances at 31 December 2015 ................. 2,105 67,647 (17,393) - 39 - 16 (1,460) 46,485 97,439 465 97,904
The accompanying notes are an integral part of these financial statements.

Notes to the Consolidated Financial Statements
31
1. Description of business The consolidated financial statements of Mincon Group Plc (also referred to as “Mincon” or “the Company”) comprises the Company and its subsidiaries (together referred to as “the Group”) and the Group’s interest in joint ventures.
The Group is an Irish engineering group, specialising in the design, manufacturing, sale and servicing of rock drilling tools and associated products. Mincon Group Plc is domiciled in Shannon, Ireland. The Mincon Group comprises Mincon Group plc and its subsidiaries as outlined in Note 21. The consolidated financial statements of Mincon Group plc are prepared on the basis that the Company is a continuation of the Smithstown Holdings Group, reflecting the substance of the arrangement. On 26 November 2013, Mincon Group plc was admitted to trading on the Enterprise Securities Market (ESM) of the Irish Stock Exchange and the Alternative Investment Market (AIM) of the London Stock Exchange. 2. Basis of Preparation These consolidated financial statements have been prepared in accordance with the International Financial Reporting Standards as adopted by the European Union (EU IFRS), which comprise standards and interpretations approved by the International Accounting Standards Board (IASB). The individual financial statements of the Company have been prepared in accordance with IFRSs as adopted by the EU and as applied in accordance with the Companies Acts 2014 which permit a company that publishes its Group and Company financial statements together to take advantage of the exemption in Section 304 of the Companies Act 2014 from presenting to its members its Company income statement, statement of comprehensive income and related notes that form part of the approved Company financial statements. The accounting policies set out in note 3 have been applied consistently in preparing the Group and Company financial statements for the years ended 31 December 2015 and 31 December 2014.
The Group and Company financial statements are presented in euro, which is the functional currency of the Company and also the presentation currency for the Group’s financial reporting. Unless otherwise indicated, the amounts are presented in thousands of euro. These financial statements are prepared on the historical cost basis. The preparation of the consolidated financial statements in conformity with IFRS requires management to make judgements, estimates and assumptions that affect the application of policies and reported amounts of assets and liabilities, income and expenses. The judgements, estimates and associated assumptions are based on historical experience and various other factors that are believed to be reasonable under the circumstances. Actual results could differ materially from these estimates. The areas involving a high degree of judgement and the areas where estimates and assumptions are critical to the consolidated financial statements are discussed in Note 3. The directors believe that the Group has adequate resources to continue in operational existence for the foreseeable future and that it is appropriate to continue to prepare our consolidated financial statements on a going concern basis.

Notes to the Consolidated Financial statements (continued)
32
2. Basis of Preparation (continued) New standards and interpretations The accounting policies applied in the preparation of these consolidated financial statements have been applied consistently during the year and prior year, except as highlighted below in ‘Recent accounting pronouncements’. Recent accounting pronouncements A number of new Standards, Amendments to Standards and Interpretations are effective for annual periods beginning after 1 January 2016, and have not been applied in preparing these consolidated financial statements. These are set out as follows: x Annual improvements to IFRSs 2010-2012 Cycle x Annual Improvements to IFRSs 2012-2014 Cycle x Amendments to IAS 1: Disclosure Initiative x Amendments to IAS 16 and IAS 38: Clarification of acceptable methods of depreciation and amortisation x Amendments to IAS 16 Property, Plant and Equipment and IAS 41 Bearer Plants x Amendments to IFRS 10 and IAS 28: Sale or contribution of assets between an investor and its associate or
joint venture* x IFRS 9 Financial Instruments (2009, and subsequent amendments in 2010 and 2013)* x IFRS 15: Revenue from contracts with customers* * These Standards, Interpretations and Amendments to Published Standards have yet to be endorsed by the EU and will only be implemented once they have been endorsed by the EU. The Group has not yet completed its assessment of the full impact on the Group financial statements of these new Standards, Interpretations and Amendments to Published Standards. Amendments to existing standards During the period, a number of amendments to existing accounting standards became effective. These have been considered by the directors and have not had a significant impact on the Group’s consolidated financial statements. New IFRSs not yet adopted The following provides a brief outline of the likely impact on future financial statements of relevant IFRSs which are not yet effective and have not been adopted early in these consolidated financial statements.
x IFRS 15 ‘Revenue from Contracts with Customers’ (effective for the Group’s 2017 consolidated financial statements)
x IFRS 9 ‘Financial Instruments’ (effective for the Group’s 2018 consolidated financial statements) x IFRS 16 ‘Leases’ (effective for the Group’s 2019 consolidated financial statements)
The directors do not believe that the above standards will have a significant impact on Group reporting. There are other amendments which have been considered but are not likely to have a significant impact on the Group’s accounting policies.
3. Significant accounting principles, accounting estimates and judgements The accounting principles as set out in the following paragraphs have, unless otherwise stated, been consistently applied to all periods presented in the consolidated financial statements and for all entities included in the consolidated financial statements.
Revenue recognition Revenue is measured at the fair value of the consideration received or receivable, net of sales taxes, goods returned, and discounts and other similar deductions. Revenue from sale of goods is recognised when the significant risks and rewards of ownership have been transferred to the buyer, which in most cases occurs on delivery. Revenue is recognised when recovery of the consideration is considered probable and the revenue and associated costs can be measured reliably. No revenue is recognised if there are significant uncertainties regarding the possible return of goods. Segment reporting An operating segment is a component of the Group that engages in business activities from which it may earn revenue and incur expenses, and for which discrete financial information is available. The operating results of all operating segments are reviewed regularly by the Board of Directors, the chief operating decision maker, to make decisions about allocation of resources to the segments and also to assess their performance. See Note 5 for additional information.

Notes to the Consolidated Financial statements (continued)
33
3. Significant accounting principles, accounting estimates and judgements (continued) Earnings per share Basic earnings per share is calculated based on the profit for the year attributable to owners of the Company and the basic weighted average number of shares outstanding. Diluted earnings per share is calculated based on the profit for the year attributable to owners of the Company and the diluted weighted average number of shares outstanding. Income taxes Income taxes include both current and deferred taxes in the consolidated financial statements. Income taxes are reported in profit or loss unless the underlying transaction is reported in other comprehensive income or in equity. In those cases, the related income tax is also reported in other comprehensive income or in equity. A current tax liability or asset is recognised for the estimated taxes payable or refundable for the current or prior years.
Deferred tax is recognised using the statement of financial position liability method. The calculation of deferred taxes is based on either the differences between the values reported in the statement of financial position and their respective values for taxation, which are referred to as temporary differences, or the carry forward of unused tax losses and tax credits. Temporary differences related to the following are not provided for: the initial recognition of goodwill, the initial recognition (other than in business combinations) of assets or liabilities that affect neither accounting nor taxable profit, and differences related to investments in subsidiary companies to the extent that they will not reverse in the foreseeable future.
The measurement of deferred tax reflects the tax consequences that would follow the manner in which the Group expects, at the end of the reporting period, to recover or settle the carrying amount of its assets and liabilities. A deferred tax asset is recognised only to the extent that it is probable that future taxable profits will be available against which the asset can be utilised. Deferred tax assets are reduced to the extent that it is no longer probable that the related tax benefit will be realised. In the calculation of deferred taxes, enacted or substantively enacted tax rates are used for the individual tax jurisdictions. Deferred tax assets and liabilities are offset when there is a legally enforceable right to set off current tax assets against current tax liabilities and when they relate to income taxes levied by the same taxation authority and the Group intends to settle its current tax assets and liabilities on a net basis. Inventories Inventories are valued at the lower of cost or net realisable value. Net realisable value is the estimated selling price in the ordinary course of business less the estimated costs of completion and selling expenses. The cost of inventories is based on the first-in, first-out principle and includes the costs of acquiring inventories and bringing them to their existing location and condition. Inventories manufactured by the Group and work in progress include an appropriate share of production overheads based on normal operating capacity. Inventories are reported net of deductions for obsolescence. Foreign currency
Foreign currency transactions Transactions in foreign currencies (those which are denominated in a currency other than the functional currency) are translated at the foreign exchange rate ruling at the date of the transaction. Monetary assets and liabilities denominated in foreign currencies are translated using the foreign exchange rate at the statement of financial position date. Exchange gains and losses related to trade receivables and payables, other financial assets and payables, and other operating receivables and payables are separately presented on the face of the income statement.
Exchange rate differences on translation to functional currency are reported in profit or loss, except when reported in other comprehensive income for the translation of intra-group receivables from, or liabilities to, a foreign operation that in substance is part of the net investment in the foreign operation.
Exchange rates for major currencies used in the various reporting periods are shown in Note 20.
Translation of accounts of foreign entities The assets and liabilities of foreign entities, including goodwill and fair value adjustments arising on consolidation, are translated to Euro at the exchange rates ruling at the reporting date. Revenues, expenses, gains, and losses are translated at average exchange rates, when these approximate the exchange rate for the respective transaction. Foreign exchange differences arising on translation of foreign entities are recognised in other comprehensive income and are accumulated in a separate component of equity as a translation reserve. On divestment of foreign entities, the accumulated exchange differences, are recycled through profit or loss, increasing or decreasing the profit or loss on divestments.

Notes to the Consolidated Financial statements (continued)
34
3. Significant accounting principles, accounting estimates and judgements (continued) Business combinations and consolidation The consolidated financial statements include the financial statements of the Group and all companies in which Mincon Group plc, directly or indirectly, has control. The Group controls an entity when it is exposed to, or has rights to, variable returns from its involvement with the entity and has the ability to affect those returns through its power over the entity. The financial statements of subsidiaries are included in the consolidated financial statements from the date on which control commences until the date on which control ceases.
The consolidated financial statements have been prepared in accordance with the acquisition method. According to this method, business combinations are seen as if the Group directly acquires the assets and assumes the liabilities of the entity acquired. At the acquisition date, i.e. the date on which control is obtained, each identifiable asset acquired and liability assumed is recognised at its acquisition-date fair value.
Consideration transferred is measured at its fair value. It includes the sum of the acquisition date fair values of the assets transferred, liabilities incurred to the previous owners of the acquiree, and equity interests issued by the Group. Deferred contingent consideration is initially measured at its acquisition-date fair value. Any subsequent change in such fair value is recognised in profit or loss, unless the deferred contingent consideration is classified as equity. In that case, there is no remeasurement and the subsequent settlement is accounted for within equity.
Transaction costs that the Group incurs in connection with a business combination, such as legal fees, due diligence fees, and other professional and consulting fees are expensed as incurred.
Goodwill is measured as the excess of the fair value of the consideration transferred, the amount of any non-controlling interest in the acquiree, and the fair value of the Group’s previously held equity interest in the acquiree (if any) over the net of acquisition-date fair values of the identifiable assets acquired and liabilities assumed. Goodwill is not amortised but tested for impairment at least annually.
Non-controlling interest is initially measured either at fair value or at the non-controlling interest’s proportionate share of the fair value of the acquiree’s identifiable net assets. This means that goodwill is either recorded in “full” (on the total acquired net assets) or in “part” (only on the Group’s share of net assets). The choice of measurement basis is made on an acquisition-by-acquisition basis.
Earnings from the acquires are reported in the consolidated income statement from the date of control.
Intra-group balances and transactions such as income, expenses and dividends are eliminated in preparing the consolidated financial statements. Profits and losses resulting from intra-group transactions that are recognised in assets, such as inventory, are eliminated in full, but losses are only eliminated to the extent that there is no evidence of impairment. Property, plant and equipment Items of property, plant and equipment are carried at cost less accumulated depreciation and impairment losses. Cost of an item of property, plant and equipment comprises the purchase price, import duties, and any cost directly attributable to bringing the asset to location and condition for use. The Group capitalises costs on initial recognition and on replacement of significant parts of property, plant and equipment, if it is probable that the future economic benefits embodied will flow to the Group and the cost can be measured reliably. All other costs are recognised as an expense in profit or loss when incurred. Depreciation Depreciation is calculated based on cost using the straight-line method over the estimated useful life of the asset.
The following useful lives are used for depreciation:
Years Buildings 20–30 Leasehold improvements 3–10 Machinery and equipment 3–10 Vehicles 3–5 Computer hardware and other 3–5
The depreciation methods, useful lives and residual values are reassessed annually. Land is not depreciated.

Notes to the Consolidated Financial statements (continued)
35
3. Significant accounting principles, accounting estimates and judgements (continued)
Leased assets
In the consolidated financial statements, leases are classified as either finance leases or operating leases. A finance lease entails the transfer to the lessee of substantially all of the economic risks and benefits associated with ownership. If this is not the case, the lease is accounted for as an operating lease.
For the lessee, a finance lease requires that the asset leased is recognised as an asset in the statement of financial position. Upon initial recognition, the leased asset is measured at an amount equal to the lower of its fair value and the present value of the future minimum lease payments. Initially, a corresponding liability is recorded. Assets under finance leases are depreciated over their estimated useful lives, while the lease payments are reported as interest and amortisation of the lease liability. For operating leases, the lessee does not account for the leased asset in its statement of financial position. In profit or loss, the costs of operating leases are recorded on a straight-line basis over the term of the lease.
Financial assets and liabilities Recognition and derecognition Financial assets and liabilities are recognised at fair value when the Group becomes a party to the contractual provisions of the instrument. Purchases and sales of financial assets are accounted for at trade date, which is the day when the Group contractually commits to acquire or dispose of the assets. Trade receivables are recognised on delivery of product. Liabilities are recognised when the other party has performed and there is a contractual obligation to pay. Derecognition (fully or partially) of a financial asset occurs when the rights to receive cash flows from the financial instruments expire or are transferred and substantially all of the risks and rewards of ownership have been removed from the Group. The Group derecognises (fully or partially) a financial liability when the obligation specified in the contract is discharged or otherwise expires. A financial asset and a financial liability are offset and the net amount presented in the statement of financial position when there is a legally enforceable right to set off the recognised amounts and there is an intention to either settle on a net basis or to realise the asset and settle the liability simultaneously. Effective interest method The effective interest method is a method of calculating the amortised cost of a financial asset or a financial liability and of allocating the interest income or interest expense over the relevant periods. The effective interest rate is the rate that exactly discounts estimated future cash payments or receipts through the expected life of the financial instrument, or when appropriate a shorter period, to the net carrying amount of the financial asset or financial liability. The calculation includes all fees and points paid or received between parties to the contract that are an integral part of the effective interest rate, transaction costs, and all other premiums or discounts. Borrowing costs All borrowing costs are expensed in accordance with the effective interest rate method. Investments in subsidiaries - Company Investments in subsidiary undertakings are stated at cost less provision for impairment in the Company’s statement of financial position. Loans to subsidiary undertakings are initially recorded at fair value in the Company statement of financial position and subsequently at amortised cost using an effective interest rate methodology. Impairment of financial assets Financial assets are assessed at each reporting date to determine whether there is any objective evidence that they are impaired. A financial asset is considered to be impaired if objective evidence indicates that one or more events have had a negative effect on the estimated future cash flows of that asset. Equity Shares are classified as equity. Incremental costs directly attributable to the issue of ordinary shares and share options are recognised as a deduction from equity, net of any tax effect. Contingent liabilities A contingent liability is a possible obligation or a present obligation that arises from past events that is not reported as a liability or provision, as it is not probable that an outflow of resources will be required to settle the obligation or that a sufficiently reliable calculation of the amount cannot be made. Financial instruments carried at fair value: Non-derivative financial liabilities Fair value is calculated based on the present value of future principal and interest cash flows, discounted at the market rate of interest at the reporting date. Financial income and expenses Finance income and expense are included in profit or loss using the effective interest method.

Notes to the Consolidated Financial statements (continued)
36
3. Significant accounting principles, accounting estimates and judgements (continued) Provisions A provision is recognised in the statement of financial position when the Group has a legal or constructive obligation as a result of a past event, it is probable that an outflow of economic benefits will be required to settle the obligation, and the outflow can be estimated reliably. The amount recognised as a provision is the best estimate of the expenditure required to settle the present obligation at the reporting date. If the effect of the time value of money is material, the provision is determined by discounting the expected future cash flows at a pre-tax rate that reflects the current market assessments of the time value of money and, where appropriate, the risks specific to the liability.
A provision for restructuring is recognised when the Group has approved a detailed and formal restructuring plan and the restructuring has either commenced or been announced publicly. Future operating losses are not provided for. Exceptional items The Group has used the term “exceptional” to describe certain items which, in management’s view, warrant separate disclosure by virtue of their size or incidence, or due to the fact that certain gains or losses are determined to be non-recurring in nature. Exceptional items may include restructuring, significant impairments, profit or loss on asset disposals, material changes in estimates or once off costs where separate identification is important to gain an understanding of the financial statements. Defined contribution plans A defined contribution pension plan is a post-employment benefit plan under which the Group pays fixed contributions into a separate entity and will have no legal or constructive obligation to pay further amounts. Obligations for contributions to defined contribution pension plans are recognised as an employee benefit expense in profit or loss when employees provide services entitling them to the contributions. Critical accounting estimates and judgements The preparation of financial statements requires management’s judgement and the use of estimates and assumptions that affect the amounts reported in the consolidated financial statements and accompanying notes. These estimates and associated assumptions are based on historical experience and various other factors that are believed to be reasonable under the prevailing circumstances. Actual results may differ from those estimates. The estimates and assumptions are reviewed on an ongoing basis. Revisions to the accounting estimates are recognised in the period in which they are revised and in any future periods affected.
Following are the estimates and judgements which, in the opinion of management, are significant to the underlying amounts included in the financial reports and for which there is a significant risk that future events or new information could entail a change in those estimates or judgements. Trade and other receivables The Group estimates the risk that receivables will not be paid and provides for doubtful accounts based on specific provisions for known cases and collective provisions for losses based on historical profit levels.
Total allowances for estimated losses as of 31 December 2015, were €0.6m (2014: €0.3m) for trade and other receivables with a corresponding gross amount of €13.7m (2014: €12.1m).

Notes to the Consolidated Financial statements (continued)
37
4. Revenue 2015 2014 €’000 €’000 Product revenue: Sale of Mincon product ............................................................................................... 52,786 41,816 Sale of third party product ............................................................................................ 17,480 12,728 Total revenue .............................................................................................................. 70,266 54,544 5. Operating Segments Results are reported in a manner consistent with the internal reporting provided to the chief operating decision maker (CODM). Our CODM has been identified as the Board of Directors. The Group has determined that it has one reportable segment. The Group is managed as a single business unit that sells drilling equipment, primarily manufactured by Mincon manufacturing sites. The CODM assesses operating segment performance based on a measure of operating profit. Segment revenue for the year ended 31 December 2015 of €70.3 million (2014: €54.5 million) is wholly derived from sales to external customers. Entity-wide disclosures The business is managed on a worldwide basis but operates manufacturing facilities and sales offices in Ireland, UK, Western Australia, the United States and Canada and sales offices in eight other locations including Eastern & Western Australia, South Africa, Senegal, Ghana, Namibia, Tanzania, Sweden, Poland, Chile and Peru. In presenting information on geography, revenue is based on the geographical location of customers and non-current assets based on the location of these assets. Revenue by region (by location of customers): 2015 2014 €’000 €’000 Region: Ireland ......................................................................................................................... 651 580 Americas ...................................................................................................................... 20,771 15,753 Australasia .................................................................................................................... 15,230 9,510 Europe, Middle East, Africa ......................................................................................... 33,614 28,701 Total revenue from continuing operations ............................................................. 70,266 54,544 Non-current assets by region (location of assets): 2015 2014 €’000 €’000 Region: Ireland ......................................................................................................................... 5,681 5,871 Americas ...................................................................................................................... 12,303 12,852 Australasia .................................................................................................................... 6,846 5,645 Europe, Middle East, Africa ......................................................................................... 4,248 2,474 Total non-current assets(1) ........................................................................................ 29,078 26,842
(1) Non-current assets exclude deferred tax assets.

Notes to the Consolidated Financial statements (continued)
38
6. Cost of Sales and operating expenses Included within cost of sales, selling and distribution expenses and general and administrative expenses were the following major components: Cost of sales
2015 2014 €’000 €’000
Raw materials ............................................................................................................... 15,166 11,035 Third party product purchases ..................................................................................... 13,772 10,010 Employee costs ............................................................................................................ 6,714 4,951 Depreciation ................................................................................................................. 1,720 1,574 Other ............................................................................................................................ 4,617 3,422 Total cost of sales ..................................................................................................... 41,989 30,992 General, selling and distribution expenses
2015 2014 €’000 €’000
Employee costs (including director emoluments) .......................................................... 10,810 6,868 Depreciation ................................................................................................................... 626 479 Acquisition costs............................................................................................................. 175 361 Other .............................................................................................................................. 6,676 5,494 Total other operating costs ......................................................................................... 18,287 13,202 The Group invested approximately €0.7 million on research and development projects in 2015, all of which has been expensed in the period. 7. Employee information 2015 2014 €’000 €’000
Wages and salaries – excluding directors ..................................................................... 15,012 10,022 Wages, salaries & fees – directors................................................................................. 583 632 Termination payments .................................................................................................... 166 - Social security costs ...................................................................................................... 1,132 748 Pension costs of defined contribution plans .................................................................. 631 417 Total employee costs ................................................................................................... 17,524 11,819 The average number of employees was as follows: 2015 2014 Number Number
Sales and distribution .................................................................................................... 93 57 General and administration ........................................................................................... 55 33 Manufacturing, service and development ..................................................................... 122 97 Average number of persons employed ................................................................... 270 187 Pension and Other Employee Benefit Plans The Group operates various defined contribution pension plans. During the year ended 31 December 2015, the Group recorded €0.6 million (2014: €0.4 million) of an expense in connection with these plans.

Notes to the Consolidated Financial statements (continued)
39
8. Acquisitions A key strategy of the Group is to increase and diversify its product portfolio and to extend its distribution network through acquisitions. In line with this strategy, the principal acquisitions completed by the Group during the year ended 31 December 2015, together with percentages acquired were as follows: x the acquisition of 100% of Ozmine International Pty Limited, a sales and distribution company in Western
Australia. Ozmine will extend Mincon’s distribution network in Western Australia, Indonesia and Papua New Guinea in line with the Mincon stated strategy to supply product directly to the end user where possible. The deal was completed in January 2015.
x the acquisition of 100% of Marshalls Carbide, one of Europe’s leading tungsten carbide manufacturers located in Sheffield, England. Marshalls Carbide Limited, a 100% subsidiary of Mincon Group plc acquired the entire business and assets of Marshalls Carbide Hard Metals Limited. Tungsten carbide insets are a key raw material in Mincon manufactured product and this strategic investment further strengthens Mincon’s control over the production process and quality control procedures employed in the manufacturing process. The deal was completed in March 2015.
x the acquisition of 70% of Two Tusks Tanzania Limited, a sales and distribution company based in Tanzania, completed in March 2015.
x the acquisition of 100% of Rotacan Sudamericana, SA a sales and distribution company based in Chile, completed in March 2015. * Full legal names disclosed in Note 21.
In the twelve months to December 2015, these acquisitions contributed net additional revenue of €5.7 million and €0.1 million net loss to the Group’s results. If all the acquisitions had occurred on 1 January 2015, management estimates that net additional revenues from these acquisitions would have been €7.1 million. Consolidated profit for the year would not have changed materially. In determining these amounts, management has assumed that the fair value adjustments, determined provisionally, that arose on the date of acquisition would have been the same if the acquisition had occurred on 1 January 2015.
A. Consideration transferred The following table summarises the acquisition date fair value of each major class of consideration transferred. Total €’000
Cash…………………………………………………………………………………………………... 4,669 Deferred contingent consideration ………………………………………………………………... 773 Total consideration transferred……………………………………………………………….… 5,442 Deferred contingent consideration Ozmine The previous owners of Ozmine will receive additional payment up to the maximum of €680,000 over three years based on the achievement of certain profits by the business during the years ending 31 December 2015, 2016 and 2017. This deferred contingent consideration is included in the fair value of the consideration transferred in the table above. Two Tusks Mincon has an option to purchase the remaining 30% of Two Tusks in three years (for consideration based on a profit after tax multiple). The 30% shareholder will also have a put option beginning in three years’ time. In accordance with IFRS 3 Business Combinations, the Group has accounted for the put and call option arrangement under the anticipated acquisition method and accordingly the financial liability arising from the arrangement is included in the fair value of the consideration transferred as deferred contingent consideration in the table above. No non-controlling interests are presented on the basis that the Group has treated the put option as a financial liability that is outside management control.

Notes to the Consolidated Financial statements (continued)
40
8. Acquisitions (continued) B. Identifiable assets acquired and liabilities assumed The following table summarises the recognised amounts of assets and liabilities assumed at the date of acquisition. Total €’000
Property, plant and equipment….………………………............................................... 1,668 Inventories…………………………………………………………………………………… 1,792 Trade Receivables………………………………………………………………………….. 1,477 Cash and cash equivalents………………………………………………………………… 520 Other assets…………………………………………………………………………………. 195 Other liabilities………………………………………………………………………………. (537) Trade and other payables………………………………………………………………….. (2,099) Fair value or identifiable net assets acquired…….………………………………….. 3,016 Measurement of fair values The valuation techniques used for measuring the fair value of material assets acquired were as follows. Assets acquired Valuation Technique
Property, plant and equipment
Market comparison technique and cost technique: The valuation model considers quoted market prices for similar items when they are available, and depreciated replacement cost when appropriate. Depreciated replacement cost reflects adjustments for physical deterioration as well as functional and economic obsolescence.
Inventories Market comparison technique: The fair value is determined based on the estimated selling price in the ordinary course of business less the estimated costs of completion and sale, and a reasonable profit margin based on the effort required to complete and sell the inventories.
If the information obtained within one year of the date of acquisition about facts and circumstances that existed at the date of acquisition identifies adjustments to the above amounts, or any additional provisions that existed at the date of acquisitions, then the accounting for the acquisition will be revised. C. Goodwill Goodwill arising from the acquisition has been recognised as follows.
Total
Consideration transferred………………………………………………………………….. 5,442 Fair value of identifiable net assets……………………………………………………….. (3,016)
Goodwill……………………………………………………………………………………… 2,426 The goodwill created in the acquisition in the period is primarily related to the synergies expected to be achieved from integrating these companies into the Group’s existing structure. Manufactured carbide product will be sold to the Groups existing manufacturing facilities and the new sales office are expected to increase Mincon’s market share and sale of own manufactured product. D. Acquisition – related costs Acquisition related costs amounted to approximately €175,000 and were included in “operating expenses” in the income statement.
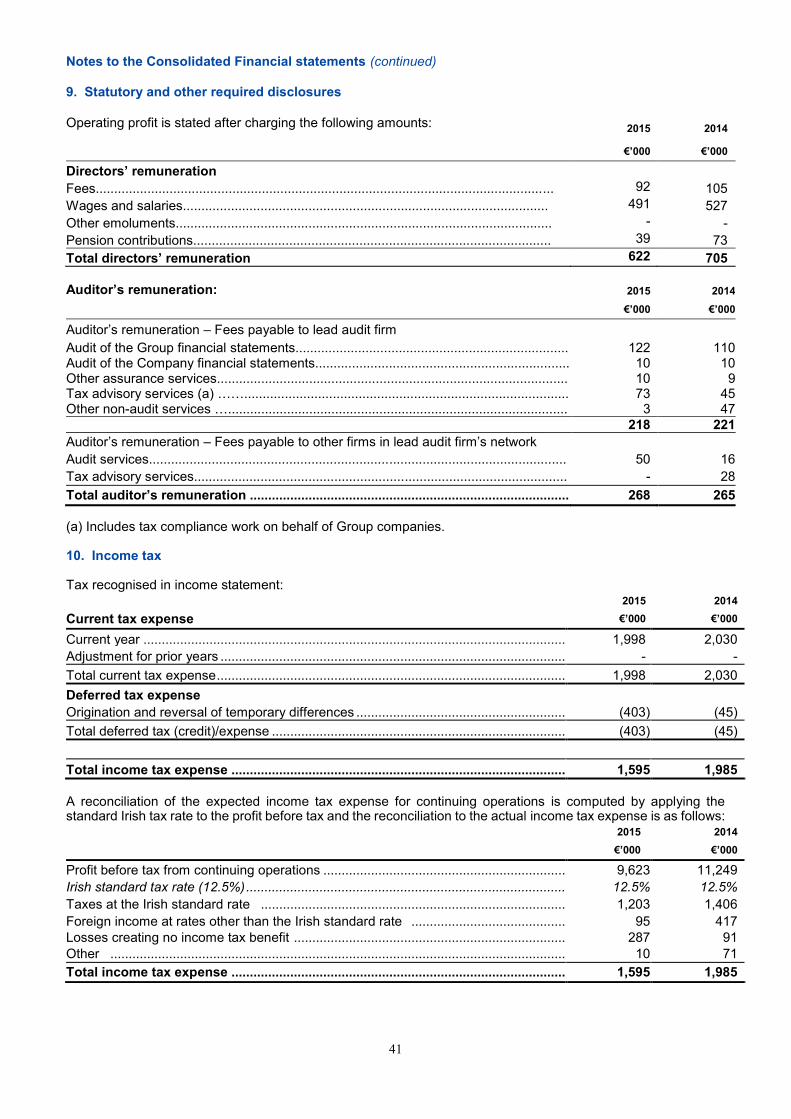
Notes to the Consolidated Financial statements (continued)
41
9. Statutory and other required disclosures Operating profit is stated after charging the following amounts:
2015 2014
€’000 €’000
Directors’ remuneration Fees............................................................................................................................ 92 105 Wages and salaries................................................................................................... 491 527 Other emoluments...................................................................................................... - - Pension contributions................................................................................................. 39 73 Total directors’ remuneration 622 705
Auditor’s remuneration: 2015 2014
€’000 €’000
Auditor’s remuneration – Fees payable to lead audit firm Audit of the Group financial statements.......................................................................... 122 110 Audit of the Company financial statements..................................................................... 10 10 Other assurance services............................................................................................... 10 9 Tax advisory services (a) ……........................................................................................ 73 45 Other non-audit services …............................................................................................ 3 47 218 221 Auditor’s remuneration – Fees payable to other firms in lead audit firm’s network Audit services................................................................................................................. 50 16 Tax advisory services..................................................................................................... - 28 Total auditor’s remuneration ....................................................................................... 268 265
(a) Includes tax compliance work on behalf of Group companies. 10. Income tax Tax recognised in income statement: 2015 2014
Current tax expense €’000 €’000 Current year ................................................................................................................... 1,998 2,030 Adjustment for prior years .............................................................................................. - - Total current tax expense ............................................................................................... 1,998 2,030 Deferred tax expense Origination and reversal of temporary differences ......................................................... (403) (45) Total deferred tax (credit)/expense ................................................................................ (403) (45) Total income tax expense ........................................................................................... 1,595 1,985 A reconciliation of the expected income tax expense for continuing operations is computed by applying the standard Irish tax rate to the profit before tax and the reconciliation to the actual income tax expense is as follows: 2015 2014
€’000 €’000 Profit before tax from continuing operations .................................................................. 9,623 11,249 Irish standard tax rate (12.5%) ....................................................................................... 12.5% 12.5% Taxes at the Irish standard rate ................................................................................... 1,203 1,406 Foreign income at rates other than the Irish standard rate .......................................... 95 417 Losses creating no income tax benefit .......................................................................... 287 91 Other ............................................................................................................................ 10 71 Total income tax expense ........................................................................................... 1,595 1,985
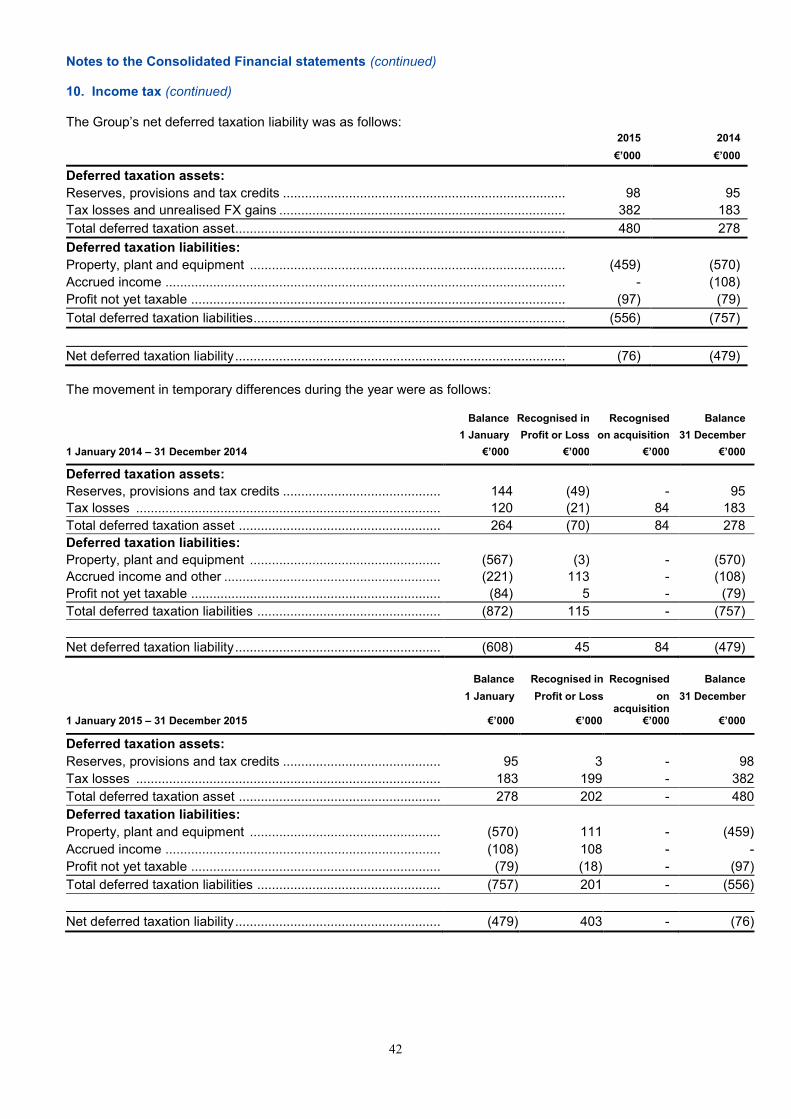
Notes to the Consolidated Financial statements (continued)
42
10. Income tax (continued) The Group’s net deferred taxation liability was as follows: 2015 2014 €’000 €’000
Deferred taxation assets: Reserves, provisions and tax credits ............................................................................. 98 95 Tax losses and unrealised FX gains .............................................................................. 382 183 Total deferred taxation asset .......................................................................................... 480 278 Deferred taxation liabilities: Property, plant and equipment ...................................................................................... (459) (570) Accrued income ............................................................................................................. - (108) Profit not yet taxable ...................................................................................................... (97) (79) Total deferred taxation liabilities ..................................................................................... (556) (757) Net deferred taxation liability .......................................................................................... (76) (479) The movement in temporary differences during the year were as follows: Balance Recognised in Recognised Balance
1 January Profit or Loss on acquisition 31 December 1 January 2014 – 31 December 2014 €’000 €’000 €’000 €’000
Deferred taxation assets: Reserves, provisions and tax credits ........................................... 144 (49) - 95 Tax losses ................................................................................... 120 (21) 84 183 Total deferred taxation asset ....................................................... 264 (70) 84 278 Deferred taxation liabilities: Property, plant and equipment .................................................... (567) (3) - (570) Accrued income and other ........................................................... (221) 113 - (108) Profit not yet taxable .................................................................... (84) 5 - (79) Total deferred taxation liabilities .................................................. (872) 115 - (757) Net deferred taxation liability ........................................................ (608) 45 84 (479) Balance Recognised in Recognised Balance
1 January Profit or Loss on
acquisition 31 December
1 January 2015 – 31 December 2015 €’000 €’000 €’000 €’000
Deferred taxation assets: Reserves, provisions and tax credits ........................................... 95 3 - 98 Tax losses ................................................................................... 183 199 - 382 Total deferred taxation asset ....................................................... 278 202 - 480 Deferred taxation liabilities: Property, plant and equipment .................................................... (570) 111 - (459) Accrued income ........................................................................... (108) 108 - - Profit not yet taxable .................................................................... (79) (18) - (97) Total deferred taxation liabilities .................................................. (757) 201 - (556) Net deferred taxation liability ........................................................ (479) 403 - (76)
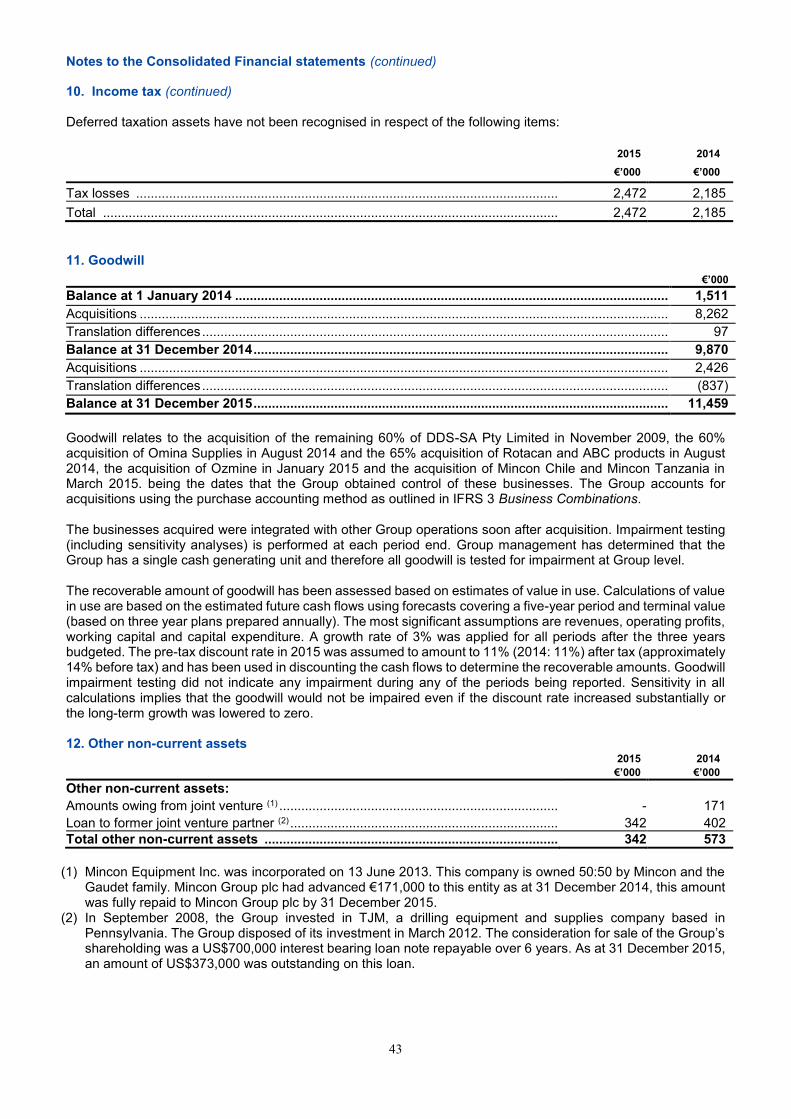
Notes to the Consolidated Financial statements (continued)
43
10. Income tax (continued) Deferred taxation assets have not been recognised in respect of the following items: 2015 2014 €’000 €’000
Tax losses ................................................................................................................... 2,472 2,185 Total ............................................................................................................................ 2,472 2,185 11. Goodwill €’000 Balance at 1 January 2014 ...................................................................................................................... 1,511 Acquisitions ................................................................................................................................................ 8,262 Translation differences ............................................................................................................................... 97 Balance at 31 December 2014 ................................................................................................................. 9,870 Acquisitions ................................................................................................................................................ 2,426 Translation differences ............................................................................................................................... (837) Balance at 31 December 2015 ................................................................................................................. 11,459 Goodwill relates to the acquisition of the remaining 60% of DDS-SA Pty Limited in November 2009, the 60% acquisition of Omina Supplies in August 2014 and the 65% acquisition of Rotacan and ABC products in August 2014, the acquisition of Ozmine in January 2015 and the acquisition of Mincon Chile and Mincon Tanzania in March 2015. being the dates that the Group obtained control of these businesses. The Group accounts for acquisitions using the purchase accounting method as outlined in IFRS 3 Business Combinations. The businesses acquired were integrated with other Group operations soon after acquisition. Impairment testing (including sensitivity analyses) is performed at each period end. Group management has determined that the Group has a single cash generating unit and therefore all goodwill is tested for impairment at Group level. The recoverable amount of goodwill has been assessed based on estimates of value in use. Calculations of value in use are based on the estimated future cash flows using forecasts covering a five-year period and terminal value (based on three year plans prepared annually). The most significant assumptions are revenues, operating profits, working capital and capital expenditure. A growth rate of 3% was applied for all periods after the three years budgeted. The pre-tax discount rate in 2015 was assumed to amount to 11% (2014: 11%) after tax (approximately 14% before tax) and has been used in discounting the cash flows to determine the recoverable amounts. Goodwill impairment testing did not indicate any impairment during any of the periods being reported. Sensitivity in all calculations implies that the goodwill would not be impaired even if the discount rate increased substantially or the long-term growth was lowered to zero. 12. Other non-current assets 2015 2014 €’000 €’000 Other non-current assets: Amounts owing from joint venture (1) ............................................................................ - 171 Loan to former joint venture partner (2) ......................................................................... 342 402 Total other non-current assets ................................................................................ 342 573
(1) Mincon Equipment Inc. was incorporated on 13 June 2013. This company is owned 50:50 by Mincon and the Gaudet family. Mincon Group plc had advanced €171,000 to this entity as at 31 December 2014, this amount was fully repaid to Mincon Group plc by 31 December 2015.
(2) In September 2008, the Group invested in TJM, a drilling equipment and supplies company based in Pennsylvania. The Group disposed of its investment in March 2012. The consideration for sale of the Group’s shareholding was a US$700,000 interest bearing loan note repayable over 6 years. As at 31 December 2015, an amount of US$373,000 was outstanding on this loan.

Notes to the Consolidated Financial statements (continued)
44
13. Property, Plant and Equipment Land &(1) Plant & Buildings Equipment Total €’000 €’000 €’000
Cost:
At 1 January 2014 ............................................................................................. 6,953 16,500 23,453 Acquisitions - 2,530 2,530 Additions ........................................................................................................... 1,070 1,295 2,365 Disposals .......................................................................................................... (4) (757) (761) Foreign exchange differences ........................................................................... 261 624 885 At 31 December 2014 ....................................................................................... 8,280 20,192 28,472 Acquisitions ...................................................................................................... 725 943 1,668 Additions ........................................................................................................... 180 1,588 1,768 Disposals .......................................................................................................... - (370) (370) Foreign exchange differences .......................................................................... (28) 125 97 At 31 December 2015 ...................................................................................... 9,157 22,478 31,635 Accumulated depreciation: At 1 January 2014 ............................................................................................. (1,484) (8,429) (9,913) Charged in year ................................................................................................ (200) (1,853) (2,053) Disposals .......................................................................................................... - 299 299 Foreign exchange differences ........................................................................... (43) (363) (406) At 31 December 2014 ....................................................................................... (1,727) (10,346) (12,073) Charged in year ................................................................................................ (244) (2,102) (2,346) Disposals .......................................................................................................... - 235 235 Foreign exchange differences .......................................................................... (23) (151) (174) At 31 December 2015 ...................................................................................... (1,994) (12,364) (14,358) Carrying amount: 31 December 2015 ............................................................ 7,163 10,114 17,277 Carrying amount: 31 December 2014 ............................................................... 6,553 9,846 16,399 Carrying amount: 1 January 2014 ..................................................................... 5,469 8,071 13,540 (1) Land and buildings include leasehold improvement assets. The depreciation charge for property, plant and equipment is recognised in the following line items in the income statement: 2015 2014 €’000 €’000
Cost of sales .................................................................................................................... 1,720 1,574 General, selling and distribution expenses .................................................................... 626 479 Total depreciation charge for property, plant and equipment ......................................... 2,346 2,053

Notes to the Consolidated Financial statements (continued)
45
14. Inventory 2015 2014
€’000 €’000
Finished goods and work-in-progress .......................................................................... 23,408 18,454 Capital equipment ....................................................................................................... 3,805 4,232 Raw materials .............................................................................................................. 4,832 5,679 Total inventory .............................................................................................................. 32,045 28,365 The company recorded write-downs of €0.45 million against inventory to net realisable value during the year ended 31 December 2015 (2014: €Nil). Write-downs are included in cost of sales. Included in capital equipment inventory are third party rigs held for resale in Southern Africa. 15. Trade and other receivables 2015 2014
€’000 €’000
Gross receivable .......................................................................................................... 13,669 12,110 Provision for impairment .............................................................................................. (648) (288) Net trade and other receivables .................................................................................. 13,021 11,822 2015 2014 €’000 €’000 Less than 60 days ........................................................................................................ 9,607 8,846 61 to 90 days ............................................................................................................... 1,931 1,570 Greater than 90 days .................................................................................................. 1,483 1,406 Net trade and other receivables ................................................................................... 13,021 11,822 At 31 December 2015, €1.5 million (11%) of trade receivables of our total trade and other receivables balance was past due but not impaired (2014: €1.4 million (12%)).
No customer accounted for more than 10% of trade and other receivables balance at any period end.
16. Loans and borrowings 2015 2014 Maturity €’000 €’000
Bank loans ............................................................................................. 2016-2021 1,684 1,398 Finance leases ...................................................................................... 2016-2020 1,131 1,560 Total Loans and borrowings………………………………………….… 2,815 2,958 Current………………………………………………………………….…… 674 893 Non-current…………………………………………………………..…….. 2,141 2,065 The Group has a number of bank loans and finance leases in the United States and Australia with a mixture of variable and fixed interest rates. The Group has not been in default on any of these debt agreements during any of the periods presented. None of the debt agreements carry restrictive financial covenants. In January 2014, Mincon Rockdrills Pty Limited drew down AUS$2.4 million (circa €1.6 million) on a 15 year variable interest loan which is secured on land & buildings of that company with a net book value of approximately AUS$3,500,000 (circa €2.3 million). AUS$1.2 million (€0.8 million) has been repaid by 31 December 2015. In December 2014, Mincon Inc. drew down US$338,000 (circa €0.3 million) on a 10 year variable interest loan which is secured on land and buildings of that company with a net book value of approximately USD$972,000 (circa €0.8 million). In April 2015, Mincon Rockdrills USA Inc. drew down US$1,200,000 (circa €1.2 million) on a 5 year fixed finance lease which is secured on plant and equipment of that company with a net book value of approximately USD$727,000 (circa €0.6 million).

Notes to the Consolidated Financial statements (continued)
46
17. Share capital and reserves At 31 December 2014 and 2015 Authorised Share Capital Number €000 Ordinary Shares of €0.01 each ....................................................... 496,150,000 4,962 Allotted, called-up and fully paid up shares Number €000 Ordinary Shares of €0.01 each ....................................................... 210,541,102 2,105 Share Issuances On 26 November 2013, Mincon Group plc was admitted to trading on the Enterprise Securities Market (ESM) of the Irish Stock Exchange and the Alternative Investment Market (AIM) of the London Stock Exchange. On admission, 57,471,264 new ordinary shares were issued representing the new shares being placed by the Company at the time of admission. These shares had a nominal value of €0.01 per share and placed at €0.87 (GBP£0.73) per ordinary share resulting in gross proceeds of €50.0 million. Share premium of €46.6 million was recorded after deduction of IPO costs of €2.9 million. On 19 December 2014, Mincon Group plc acquired the remaining 25% non-controlling interest in Mincon Rockdrills USA Inc. satisfied by the issue of 3,069,838 new ordinary shares at nominal value €0.01 each. These shares were admitted to trading on ESM and AIM on 24 December 2014. Voting rights The holders of Ordinary Shares have the right to receive notice of and attend and vote at all general meetings of the Company and they are entitled, on a poll or a show of hands, to one vote for every Ordinary Share they hold. Votes at general meetings may be given either personally or by proxy. Subject to the Companies Act and any special rights or restrictions as to voting attached to any shares, on a show of hands every member who (being an individual) is present in person and every proxy and every member (being a corporation) who is present by a representative duly authorised, shall have one vote, so, however, that no individual shall have more than one vote for every share carrying voting rights and on a poll every member present in person or by proxy shall have one vote for every share of which he is the holder. Dividends On 26 September 2014, Mincon Group plc paid an interim dividend for 2014 in the amount of €0.01 (1 cent) per ordinary share. On 30 June 2015, Mincon Group plc paid a final dividend for 2014 of €0.01 (1 cent) per ordinary share. On 25 September 2015, Mincon Group plc paid an interim dividend for 2015 of €0.01 (1 cent) per ordinary share. The directors are recommending a final dividend of €0.01 (1 cent) per ordinary share for 2015 which will be subject to approval at the company’s AGM on 29 May 2016. Share premium and other reserve As part of a Group reorganisation the Company, Mincon Group plc, became the ultimate parent entity of the Group. On 30 August 2013, the Company acquired 100% of the issued share capital in Smithstown Holdings and acquired (directly or indirectly) the shareholdings previously held by Smithstown Holdings in each of its subsidiaries. As a consequence of the Company electing to record the investment in Smithstown Holdings at cost a difference of €79.3 million arose between this investment and the amount that company law requires to be included in share capital and share premium. This amount was recorded as an “other reserve” in the Company’s Statement of Financial Position. The members of the Company passed a resolution on 1 November 2013 that, subject to the confirmation of the High Court of Ireland, the Company’s share capital be reduced by an amount of €79.3 million and that the reserve so created would be used to cancel the other reserve (or such part thereof as the High Court of Ireland may determine). The application to the High Court was heard on 1 May 2014 and, by order of the High Court, the Company reduced its share premium account by €79.3 million and used the reserve so created to eliminate its “other reserve”.

Notes to the Consolidated Financial statements (continued)
47
18. Earnings per share Basic earnings per share (EPS) is computed by dividing the profit for the period available to ordinary shareholders by the weighted average number of Ordinary Shares outstanding during the period. Diluted earnings per share is computed by dividing the profit for the period by the weighted average number of Ordinary Shares outstanding and, when dilutive, adjusted for the effect of all potentially dilutive shares. The following table sets forth the computation for basic and diluted net profit per share for the years ended 31 December:
2015 2014
€’000 €’000 Numerator (amounts in €’000): Profit attributable to owners of the Parent ........................................................ 7,980 9,134 Earnings per Ordinary Share Basic and diluted earnings per share, € ............................................................ 3.79c 4.40c
Denominator (Number): Basic and diluted weighted-average shares outstanding................................................................................................
210,541,102 207,580,607
There were a number of outstanding restricted share awards (RSAs) in issue at 31 December 2014 and 2015 (Note 19). None of the RSAs were dilutive at 31 December 2014 or 2015 for the purposes of the EPS calculations. 19. Share based payment During the year ended 31 December 2014, the Remuneration Committee of the Board of Directors made its first grant of approximately 193,000 Restricted Share Awards (RSAs) to members of the senior management team, excluding executive directors. There have been no subsequent grants. The terms and conditions of the Group’s Long Term Incentive Plan are disclosed in section 10 of Part IV of the Group’s Admission Document dated 20 November 2014. The fair value of services received in return for RSAs granted are measured by reference to the fair value of RSAs granted.

Notes to the Consolidated Financial statements (continued)
48
20. Financial Risk Management The Group is exposed to various financial risks arising in the normal course of business. Its financial risk exposures are predominantly related to changes in foreign currency exchange rates and interest rates, as well as the creditworthiness of our counterparties. a) Liquidity and Capital The Group defines liquid resources as the total of its cash, cash equivalents and short term deposits. Capital is defined as the Group’s shareholders’ equity and borrowings. The Group’s objectives when managing its liquid resources are: • To maintain adequate liquid resources to fund its ongoing operations and safeguard its ability to continue
as a going concern, so that it can continue to create value for investors; • To have available the necessary financial resources to allow it to invest in areas that may create value
for shareholders; and • To maintain sufficient financial resources to mitigate against risks and unforeseen events.
Liquid and capital resources are monitored on the basis of the total amount of such resources available and the Group’s anticipated requirements for the foreseeable future. The Group’s liquid resources and shareholders’ equity at 31 December 2015 were as follows: 2015 2014 €’000 €’000
Cash and cash equivalents ....................................................................................................... 10,644 14,082 Short term deposits ................................................................................................................... 30,781 30,630 Loans and borrowings ............................................................................................................... 2,815 2,958 Shareholders’ equity ................................................................................................................. 97,439 95,013 At 31 December 2015, the Group had €30.8 million on deposit with two financial institutions in Ireland. These monies can be withdrawn at any time for corporate purposes, but have nominal maturity dates of June 2016 and December 2016. IAS 7 Statement of Cash Flows requires any investment with a maturity date of greater than three months to be disclosed other than as cash or cash equivalents. At year-end, the Group’s total cash and cash equivalents and short term deposits were held in the following jurisdictions: 31 December 31 December 2015 2014 €’000 €’000 Ireland ............................................................................................................................ 34,134 39,084 Americas ........................................................................................................................ 2,371 1,115 Australasia ...................................................................................................................... 1,198 1,910 Europe, Middle East, Africa ............................................................................................ 3,722 2,603 Total cash, cash equivalents and short term deposits ................................................... 41,425 44,712 There are currently no restrictions that would have a material adverse impact on the Group in relation to the intercompany transfer of cash held by its foreign subsidiaries. The Group continually evaluates its liquidity requirements, capital needs and availability of resources in view of, among other things, alternative uses of capital the cost of debt and equity capital and estimated future operating cash flow.

Notes to the Consolidated Financial statements (continued)
49
20. Financial Risk Management (continued) a) Liquidity and Capital (continued) In the normal course of business, the Group may investigate, evaluate, discuss and engage in future company or product acquisitions, capital expenditures, investments and other business opportunities. In the event of any future acquisitions, capital expenditures, investments or other business opportunities, the Group may consider using available cash or raising additional capital, including the issuance of additional debt. The maturity of the contractual undiscounted cash flows (including estimated future interest payments on debt) of the Group’s financial liabilities were as follows: Total Total
Carrying Contractual Less than More than Value Cash Flows 1 Year 1-3 Years 3-5 Years 5 Years €’000 €’000 €’000 €’000 €’000 €’000
At 31 December 2014: Deferred contingent consideration ............................. 6,717 9,169 - - 9,169 - Loans and borrowings ................................................ 1,398 1,514 261 472 293 488 Finance leases .......................................................... 1,560 1,634 563 949 122 - Trade and other payables .......................................... 3,804 3,804 3,804 - - - Accrued and other financial liabilities .......................... 2,320 2,320 2,320 - - - Total at 31 December 2014 ........................................ 15,799 18,441 6,948 1,421 9,584 488 At 31 December 2015: Deferred contingent consideration ............................. 6,347 6,990 344 1,371 5,275 - Loans and borrowings ................................................ 1,684 1,892 270 811 541 270 Finance leases .......................................................... 1,131 1,255 420 835 - - Trade and other payables .......................................... 6,780 6,780 6,780 - - - Accrued and other financial liabilities .......................... 2,009 2,009 2,009 - - - Total at 31 December 2015 ........................................ 17,951 18,926 9,823 3,017 5,816 270 b) Foreign currency risk The Group is a multinational business operating in a number of countries and the euro is the presentation currency. The Group, however, does have revenues, costs, assets and liabilities denominated in currencies other than euros. Transactions in foreign currencies are recorded at the exchange rate prevailing at the date of the transaction. The resulting monetary assets and liabilities are translated into the appropriate functional currency at exchange rates prevailing at the reporting date and the resulting gains and losses are recognised in the income statement. The Group manages some of its transaction exposure by matching cash inflows and outflows of the same currencies. The Group does not engage in hedging transactions and therefore any movements in the primary transactional currencies will impact profitability. The Group continues to monitor appropriateness of this policy. The Group’s global operations create a translation exposure on the Group’s net assets since the financial statements of entities with non-euro functional currencies are translated to euro when preparing the consolidated financial statements. The Group does not use derivative instruments to hedge these net investments. The principal foreign currency risks to which the Group is exposed relate to movements in the exchange rate of the euro against US dollar, South African rand, Australian dollar and Swedish Krona. The Group has material subsidiaries with a functional currency other than the euro, such as US dollar, Australian dollar, South African rand, Canadian dollar, British Pound and Swedish krona.

Notes to the Consolidated Financial statements (continued)
50
20. Financial Risk Management (continued) b) Foreign currency risk (continued) The Group’s worldwide presence creates currency volatility when compared year on year. In 2015, there were two major movements Mincon’s operational currencies:
x A strengthening in the US Dollar of 16% on average compared to 2014, which resulted in an increase in reported revenue for the year of approximately €2.2 million. However, Mincon also has a significant US Dollar cost base through our operations in Illinois and Virginia in the USA and North Bay in Canada. As a result, the strengthening US Dollar did not significantly impact reported profit for 2015.
x A significant devaluation in the South African rand in the second half of the year with the closing rate being 20% lower than at 31 December 2014. This has resulted in a foreign currency loss of €1.2 million being recorded as a financing expense.
In 2014, there was a significant devaluation in three of the major currencies in which Mincon trades, namely the South African Rand (ZAR), Australian Dollar (AUD) and Swedish Krona (SEK). On an average basis, these currencies devalued by 12.3% (ZAR), 6.5% (AUD) and 5.2% (SEK) in 2014 compared to 2013. In 2015, almost 45% of Mincon’s revenue (approx. €31.6 million) was generated in ZAR, AUD and SEK, compared to less than 10% of the Group’s cost of sales. The majority of the group’s manufacturing base has a euro or US dollar cost base. While Group management makes every effort to reduce the impact of this currency volatility, it is impossible to eliminate or significantly reduce given the fact that the highest grades of our key raw materials are either not available or not denominated in these markets and currencies. Additionally, the ability to increase prices for our products in these jurisdictions is limited by the current market factors. 2015 2014 Euro exchange rates Closing Average Closing Average
US Dollar ............................................................. 1.09 1.11 1.22 1.33 Australian Dollar ................................................. 1.49 1.48 1.49 1.47 South African Rand ............................................ 16.93 14.16 14.10 14.4 Swedish Krona ................................................... 9.18 9.35 9.4 9.1 The table below shows the Group’s net monetary asset/(liability) exposure. Such exposure comprises the monetary assets and monetary liabilities that are not denominated in the functional currency of the operating unit involved. These exposures were as follows: Net Foreign Currency 2015 2014 Monetary Assets/(Liabilities) €’000 €’000
Euro ............................................................................................................................. 258 (903) US Dollar ..................................................................................................................... 10,385 6,610 Australian Dollar ......................................................................................................... 6,925 7,500 South African Rand .................................................................................................... 10,406 4,046 Other .......................................................................................................................... 229 211 Total ........................................................................................................................... 28,203 17,464 A 10% strengthening of the Euro against the Group’s primary operating currencies at 31 December 2015 would have increased/(decreased) shareholders’ equity and net profit by approximately the amounts shown below. This analysis assumes that all other variables, remain constant. 2015 2014
OCI* Net Profit OCI* Net Profit €’000 €’000 €’000 €’000
US dollar ............................................................... (1,007) (410) (1,167) (253) Australian dollar .................................................... (1,219) (90) (1,181) (696) South African Rand .............................................. (632) (635) (615) (1,200) * Includes net investment exposure A 10% weakening of the Euro against the above currencies would have had the equal but opposite effect on the above currencies to the amounts shown above, on the basis that all other variables remain constant.

Notes to the Consolidated Financial statements (continued)
51
20. Financial Risk Management (continued) c) Credit Risk The majority of the Group’s customers are third party distributors of drilling tools and equipment. The maximum exposure to credit risk for trade and other receivables at 31 December by geographic region was as follows: 2015 2014
€’000 €’000
Ireland ........................................................................................................................... 51 39 Americas ....................................................................................................................... 3,693 4,243 Australasia ..................................................................................................................... 2,746 2,020 Europe, Middle East, Africa .......................................................................................... 6,531 5,520 Total amounts owed ................................................................................................... 13,021 11,822 The Group is also exposed to credit risk on its liquid resources (cash and short term deposits), of which €30.8 million was invested with government backed financial institutions in Ireland. The Directors actively monitor the credit risk associated with this exposure. d) Interest Rate Risk Interest Rate Risk on financial liabilities The Group is primarily equity and cash funded and has drawn down small amounts of debt for natural hedging purposes. Movements in interest rates had no significant impact on our financial liabilities or finance cost recognised in either 2014 or 2015.
Interest Rate Risk on cash and cash equivalents Our exposure to interest rate risk on cash and cash equivalents is actively monitored and managed with an average duration of less than three months. Interest rate risk on cash and cash equivalents is not considered material to the Group. e) Fair values Fair value is the amount at which a financial instrument could be exchanged in an arms-length transaction between informed and willing parties, other than in a forced or liquidation sale. The contractual amounts payable less impairment provision of trade receivables, trade payables and other accrued liabilities approximate to their fair values. Under IFRS 7, the disclosure of fair values is not required when the carrying amount is the reasonable approximation of fair value. There are no material differences between the carrying amounts and fair value of our financial liabilities as at 31 December 2014 or 2015.

Notes to the Consolidated Financial statements (continued)
52
20. Financial Risk Management (continued) e) Fair values (continued) Financial instruments carried at fair value The deferred contingent consideration payable represents management’s best estimate of the fair value of the amounts that will be payable, discounted as appropriate using a market interest rate. The fair value was estimated by assigning probabilities, based on management’s current expectations, to the potential pay-out scenarios. The fair value of deferred contingent consideration is primarily dependent on the future performance of the acquired businesses against predetermined targets and on management’s current expectations thereof. An increase and decrease of 10% in management’s expectation as to the amounts that will be paid out would increase or decrease the value of contingent deferred contingent consideration at 31 December 2015 by €0.6 million. In August 2014, Mincon Group plc purchased a 65% shareholding in ABC Products (Rocky) Pty Ltd, with an option to purchase the remaining 30% shareholding that was held by the former owner of the company. Mincon elected to apply the anticipated acquisition method in accounting for the option, whereby the non-controlling interest is not recognised but rather treated as already acquired by Mincon both in the Consolidated financial statements. This was adopted based on the view that the structure and timing of the option contract had transferred sufficient risks and rewards to Mincon. A deferred contingent consideration liability was created on acquisition for this option. In October 2015, the option contract was terminated early with Mincon paying an agreed price of approximately €421,000 to purchase the remaining 30% shareholding. This early termination resulted in a positive movement on contingent consideration being recorded in the Consolidated Income Statement during the year ended 31 December 2015. The significant unobservable inputs are the performance of the acquired businesses and the timing of the pay-out. Other than changes in foreign currency exchange rates, there were no other material changes in the estimates underlying the deferred contingent consideration liability during the year ended 31 December 2015. Movements in the year in respect of Level 3 financial instruments carried at fair value The movements in respect of the financial assets and liabilities carried at fair value in the year to 31 December are as follows:
Deferred contingent consideration
€’000 Balance at 1 January 2015 ........................................................................................... 6,717 Arising on acquisition (Note 8) ...................................................................................... 773 Cash payment ............................................................................................................... (421) Fair value movement ..................................................................................................... (303) Foreign currency translation adjustment ...................................................................... (419) Balance at 31 December 2015 .................................................................................... 6,347

Notes to the Consolidated Financial statements (continued)
53
21. Subsidiary and Associate Undertakings At 31 December 2015, the Group had the following subsidiary undertakings: Company
Nature of Business
Group Share %
Registered Office & Country of Incorporation
Mincon International Limited
Manufacturer of rock drilling equipment 100% Smithstown, Shannon, Co. Clare, Ireland
Mincon Rockdrills USA Inc.
Manufacturer of rock drilling equipment 100%* 107 Industrial Park, Benton, IL 62812, USA
Mincon Rockdrills PTY Ltd
Manufacturer of rock drilling equipment 100% 8 Fargo Way, Welshpool, WA 6106, Australia
1676427 Ontario Inc. (Operating as Rotacan)
Manufacturer of rock drilling equipment 65%*(1) 400B Kirkpatrick Steet, North Bay, Ontario, P1B 8G5, Canada
Marshalls Carbide Ltd Manufacturer of tungsten carbide 100% Windsor St, Sheffield S4 7WB, United Kingdom
Mincon Inc.
Sales company
100% 603 Centre Avenue, N.W. Roanoke, VA 24016, USA
Mincon Sweden AB
Sales company
100% Industrivagen 2-4, 61202 Finspang, Sweden
DDS-SA (Proprietary) Ltd
Sales company 100% 1 Northlake, Jetpark 1469, Gauteng, South Africa
ABC Products (Rocky) Pty Ltd
Sales company
95% 2/57 Alexandra Street, North Rockhampton, Queensland, 4701 Australia
Mincon West Africa SARL
Sales company
80% Villa TF 4635 GRD, Almadies, Dakar B.P. 45534, Senegal
Mincon Poland
Sales company
100% ul.Mickiewicza 32, 32-050 Skawina, Poland
Mincon Rockdrills Ghana Limited
Sales company
80% P.O. Box CT5105, Accra, Ghana
Mincon S.A.C.
Sales company 100% Calle La Arboleda 151, Dpto 201, La Planicie, La Molina, Peru
Ozmine International Pty Limited
Sales company 100% Gidgegannup, WA 6083, Australia
Mincon Chile Sales company 100% Av. La Dehesa #1201, Torre Norte, Lo Barnechea, Santiago, Chile
Mincon Tanzania Sales company 70%(1) Plot 1/3 Nyakato Road, Mwanza, Tanzania
Mincon Namibia Pty Ltd
Sales company 60%(1) Ausspannplatz, Windhoek, Namibia
Mincon Mining Equipment Inc.
Sales company
100%* 19789-92a Avenue, Langley, British Columbia V1M3B3, Canada
Mincon Exports USA Inc.
Group finance company
100%
603 Centre Ave, Roanoke VA 24016, USA
Mincon International Shannon
Dormant company 100%* Smithstown, Shannon, Co. Clare, Ireland
Smithstown Holdings Holding company 100% Smithstown, Shannon, Co. Clare, Ireland Mincon Canada Drilling Products Inc. Lotusglade Limited
Holding company Holding company
100% 100%*
Suite 1800-355 Burrard Street, Vancouver, BC V6C 268, Canada Smithstown, Shannon, Co. Clare, Ireland
Floralglade Company
Holding company
100% Smithstown, Shannon, Co. Clare, Ireland
Mincon Microcare Limited
Holding company
100%* Smithstown, Shannon, Co. Clare, Ireland
Castle Heat Treatment Limited
Holding company
100%* Smithstown, Shannon, Co. Clare, Ireland
* Indirectly held shareholding (1) Non-controlling shareholder has a put option and consequently recorded as a liability rather than non-controlling interest.

Notes to the Consolidated Financial statements (continued)
54
22. Leases Operating Leases The Group leases certain of its facilities and equipment under non-cancellable operating lease agreements. However, annual obligations under these operating leases has not exceeded €100,000 in any of the periods presented, and is not expected to do so in the foreseeable future. Finance Leases At 31 December 2015, the net book value of assets acquired under finance leases was €0.8 million (€0.9 million), which included €0.2 million (2014: €0.1 million) of accumulated depreciation. The depreciation expense related to assets under finance leases for 2015 was €0.1 million (2014: €0.1 million). 23. Commitments The following capital commitments for the purchase of property, plant and equipment had been authorised by the directors at 31 December: 31 December 31 December 2015 2014 €’000 €’000 Contracted for .............................................................................................................. 2,110 740 Not-contracted for ........................................................................................................ - - Total ............................................................................................................................ 2,110 740 For information on lease commitments, refer to Note 22. 24. Litigation The Group is not involved in legal proceedings that could have a material adverse effect on its results or financial position. 25. Related Parties As at 31 December 2015, the share capital of Mincon Group plc was 56.84% (2014: 56.84%) owned by Kingbell Company which is ultimately controlled by Patrick Purcell and members of the Purcell family. Patrick Purcell is also a director of the Company. Ballybell Limited, a company controlled by Kevin Barry, holds 14.21% (2014: 14.21%) of the equity of the Company. In September 2015, the Group paid an interim dividend for 2015 of €0.01 to all shareholders. The total dividend paid to Kingbell Company and Ballybell Limited was €1,196,712 and €299,178, respectively. In June 2015, the Group paid a final dividend for 2014 of €0.01 to all shareholders. The total dividend paid to Kingbell Company and Ballybell Limited was €1,196,712 and €299,178, respectively. In September 2014, the Group paid an interim dividend for 2014 of €0.01 to all shareholders. The total dividend paid to Kingbell Company and Ballybell Limited was €1,196,712 and €299,178, respectively. The Group has a related party relationship with its subsidiary and its joint venture undertakings (see Note 21 for a list of these undertakings), directors and officers. All transactions with subsidiaries eliminate on consolidation and are not disclosed.

Notes to the Consolidated Financial statements (continued)
55
25. Related Parties (continued) Transactions with Directors The Group is owed €Nil from directors and shareholders at 31 December 2015 and 2014. The Group has amounts owing to directors of €Nil as at 31 December 2015 and 2014. Key management compensation The profit before tax from continuing operations has been arrived at after charging the following key management compensation: 2015 2014 €’000 €’000
Short term employee benefits ...................................................................................... 1,284 1,095 Bonus and other emoluments ....................................................................................... - 39 Post-employment contributions ................................................................................... 53 86 Total .............................................................................................................................. 1,337 1,220 The key management compensation amounts disclosed above represent compensation to those people having the authority and responsibility for planning, directing and controlling the activities of the Group, which comprises the Board of Directors and executive management (nine in total). 26. Events after the reporting date The Board of Mincon Group plc is recommending the payment of a final dividend for the year ended 31 December 2015 in the amount of €0.01 (1 cent) per ordinary share, which will be subject to approval at the Annual General Meeting of the Company in May 2016. This final dividend, when added to the interim dividend of 1 cent paid on 25 September 2015, makes a total distribution for the year of 2 cent per share. Subject to Shareholder approval at the Company’s annual general meeting, the final dividend will be paid on 24 June 2016 to Shareholders on the register at the close of business on 27 May 2016. 27. Approval of financial statements The Board of Directors approved the consolidated financial statements on 8 March 2016.

FOR THE YEAR ENDED 31 DECEMBER 2015
MINCONSEPARATEFINANCIALSTATEMENTS
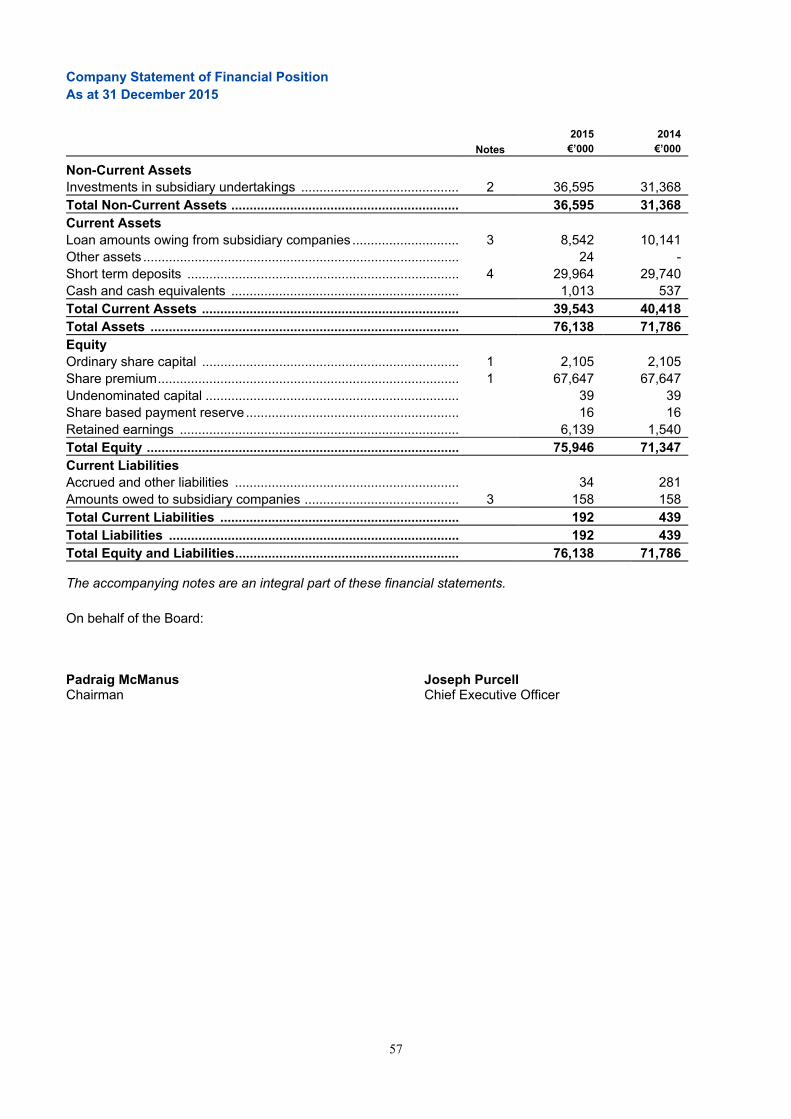
57
Company Statement of Financial Position As at 31 December 2015 2015 2014 Notes €’000 €’000
Non-Current Assets Investments in subsidiary undertakings ........................................... 2 36,595 31,368Total Non-Current Assets .............................................................. 36,595 31,368Current Assets Loan amounts owing from subsidiary companies ............................. 3 8,542 10,141Other assets ...................................................................................... 24 -Short term deposits .......................................................................... 4 29,964 29,740Cash and cash equivalents .............................................................. 1,013 537Total Current Assets ...................................................................... 39,543 40,418Total Assets .................................................................................... 76,138 71,786Equity Ordinary share capital ...................................................................... 1 2,105 2,105Share premium .................................................................................. 1 67,647 67,647Undenominated capital ..................................................................... 39 39Share based payment reserve .......................................................... 16 16Retained earnings ............................................................................ 6,139 1,540Total Equity ..................................................................................... 75,946 71,347Current Liabilities Accrued and other liabilities ............................................................. 34 281Amounts owed to subsidiary companies .......................................... 3 158 158Total Current Liabilities ................................................................. 192 439Total Liabilities ............................................................................... 192 439Total Equity and Liabilities ............................................................. 76,138 71,786
The accompanying notes are an integral part of these financial statements. On behalf of the Board: Padraig McManus Joseph Purcell Chairman Chief Executive Officer

58
Company Statement of Cash Flows For the year ended 31 December 2015
2015 2014 €’000 €’000 Operating activities: Profit for the period ................................................................................................ 8,809 2,772 Share based payments .......................................................................................... - 16 Loans to subsidiaries ............................................................................................. 1,599 (3,041) Movement in other current assets ......................................................................... - 4 Movement in accruals and intercompany creditors ............................................... (271) (379) Net cash provided/(used in) by operating activities ....................................... 10,137 (628) Investing activities Redemption of/(investment in) short term deposits .............................................. (224) 10,260 Investment in subsidiary undertakings ................................................................. (5,227) (8,726) Net cash provided by/(used in) investing activities ........................................ (5,451) 1,534 Financing activities Dividends ............................................................................................................... (4,210) (2,074) Receipt of capital contribution ............................................................................... - 953 Net cash provided by/(used in) financing activities ....................................... (4,210) (1,121) Effect of foreign exchange rate changes on cash ................................................ - - Net increase/(decrease) in cash and cash equivalents ................................... 476 (215) Cash and cash equivalents at the beginning of the period .................................. 537 752 Cash and cash equivalents at the end of the period...................................... 1,013 537 The accompanying notes are an integral part of these financial statements.

59
Company Statement of Changes in Equity for the year ended 31 December 2015
Sharecapital
Share premium
Other reserve
Undenominated
Capital
Share based payment reserve
Capital contribution
Retained earnings
Total equity
€’000 €’000 €’000 €’000 €’000 €’000 €’000 €’000Balance at 31 December 2013 ....................... 2,105 145,036 (79,300) - - 953 (72) 68,730Comprehensive income: Profit for the period ........................................... - - - - - - 2,772 2,772Total comprehensive income ........................ 2,772 2,772Transactions with Shareholders: Share based payments .................................... - - - - 16 - - 16Dividends ......................................................... - - - - - - (2,074) (2,074)Acquisition of non-controlling interests ............. 31 1,911 - - - - - 1,942Redemption of shares ...................................... (39) - 39 (39) (39)Reduction of share premium ........................... - (79,300) 79,300 - - - - -Recycle of capital contribution to retained earnings ........................................................... - - - - - (953) 953 -
Balances at 31 December 2014 ..................... 2,105 67,647 - 39 16 - 1,540 71,347Comprehensive income: Profit for the period ........................................... - - - - - - 8,809 8,809Total comprehensive income ........................ 10,349 80,156Transactions with Shareholders: Dividends ......................................................... - - - - - - (4,210) (4,210)Balances at 31 December 2015 ..................... 2,105 67,647 - 39 16 - 6,139 75,946
The accompanying notes are an integral part of these financial statements.

60
Notes to the Company Financial Statements 1. Share Capital
See note 17 of the Mincon Group plc consolidated financial statements for details of the authorised and issued share capital of the company.
2. Investments in subsidiary undertakings During the year ended 31 December 2015, Mincon Group plc made the following additional investments in subsidiaries: - €2.5 million investment in Marshalls Carbide - €1.0 million investment in Ozmine - €0.8 million investment in Rotacan Sudamericana - €0.4 million investment in ABC Products - €0.5 million capital injection in Mincon Peru
During the year ended 31 December 2014, Mincon Group plc made the following investments in subsidiaries: - €7.0 million loan to Mincon Canada Drilling Products Inc. for the purposes of acquiring a 65%
shareholding in Rotacan - €1.7 million investments in ABC Products and Omina Supplies - €1.9 million investment in Mincon Inc. for the purchase of the remaining 25% shareholding in Mincon
Rockdrills USA Inc., transacted by way of the issue of shares by Mincon Group plc.
3. Transactions with subsidiary companies
At 31 December 2015, the Company had advanced €6.7 million (2014: €10.1 million) to subsidiary companies by way of loan. These loans are interest free and repayable on demand. At 31 December 2015, the Company owed €158,000 (2014: €158,000) to subsidiary companies in relation to costs incurred on its behalf.
4. Short term deposits
At 31 December 2015, the Company had €29.9 million (2014: €29.7 million) on deposit with financial institutions in Ireland. These monies can be withdrawn at any time for corporate purposes, but have nominal maturity dates of June 2016 and December 2016. IAS 7 Statement of Cash Flows requires any investment with a nominal maturity date of greater than three months to be disclosed other than as cash or cash equivalents.
5. Approval of financial statements
The Board of Directors approved the financial statements on 8 March 2016.

Mincon.com
MINCON GROUP PLCShannon, IrelandTel: +353 (61) 361-099
USA, CENTRAL &SOUTH AMERICAMINCON INC.Virginia, USATel: +1 (540) 344-9939
MINCON ROCKDRILLS USA INC.ILLINOIS, USATel: +1 (618) 435-3404
ROTACANNorth Bay, CanadaTel: +1 (705) 474-5858
MINCON CHILE S.A.Santiago, ChileTel: +56 (2) 3223-9351
MINCON S.A.C.Lima, PeruTel: +51 949 753 224
EUROPE & THE MIDDLE EASTMINCON INTERNATIONAL LTD.Shannon, IrelandTel: +353 (61) 361-099
MINCON ABFinspang, SwedenTel: +46 1221-5480
MARSHALLS CARBIDE LTDSheffield, UKTel: +44 (0) 114 275-2282
MINCON POLAND SP. Z.O.O.Skawina, PolandTel: +48 6077-40888
AFRICAMINCON SOUTHERN AFRICAJohannesburg, South AfricaTel: +27 (11) 397-3630
MINCON ROCKDRILLS GHANA LTDAccra, GhanaTel: +233 (302) 331-855
MINCON WEST AFRICA SARLDakar, SenegalTel: +221 (338) 209-765
MINCON TANZANIAMwanza, TanznaiaTel: +255 282 571-186
MINCON NAMIBIA PTY LTDWindhoek, NamibiaTel: +264 61 230-320
AUSTRALASIAMINCON ROCKDRILLS PTY LTD.Perth, Western AustraliaTel: +61 (0) 8 9471-2700
OZMINE INTERNATIONAL PTY LTD.Perth, Western AustraliaTel: +61 (0) 1 3 0037-4552
ABC PRODUCTS (ROCKY) PTY LTD.Rockhampton, Eastern AustraliaTel: +61 (0) 7 4927-7276