millenium development goals analysis of … · millenium development goals analysis of peoples to...
TRANSCRIPT
MILLENIUM DEVELOPMENT GOALS ANALYSIS OF PEOPLES TO THE
CONCERN OF UNHCR
THE LIVING CONDITIONS OF REFUGEES, ASYLUM SEEKERS AND IDP’S IN ARMENIA, ECUADOR, SRI LANKA AND PAKISTAN
Bart de Bruijn
Comparative Summary Report October, 2006
Netherlands Interdisciplinary Demographic Institute Lange Houtstraat 19 2511 CV The Hague, The Netherlands http://www.nidi.knaw.nl/nl Tel: +31 70 3565200 Fax: +31 70 3647187 E-mail: [email protected],


i
Table of contents
List of tables............................................................................................................iii
List of figures ...........................................................................................................v
Acronyms...............................................................................................................vii
Acknowledgments ..................................................................................................ix
Executive summary ................................................................................................xi
1. Introduction........................................................................................................1
2. Country backgrounds and RAI population profiles.........................................5 2.1. The settings of RAIs and the survey contexts.........................................5 2.2. Population profiles ...................................................................................6
3. How do living conditions of RAIs compare across countries?.....................11 3.1. MDG 1: eradicate extreme poverty and hunger ...................................11 3.2. MDG 2: achieve universal primary education......................................15 3.3. MDG 3: promote gender equality and empower women ....................16 3.4. MDG 4: reduce child mortality .............................................................17 3.5. MDG 5: improve maternal health .........................................................18 3.6. MDG 6: combat HIV/AIDS malaria and other diseases......................18 3.7. MDG 7: ensure environmental sustainability .......................................20 3.8. MDG 8: develop a global partnership for development.......................21
4. How do differences in living conditions between RAIs and non-RAIs compare across countries? ..............................................................................23 4.1. MDG 1: eradicate extreme poverty and hunger ...................................23 4.2. MDG 2: achieve universal primary education......................................25 4.3. MDG 3: promote gender equality and empower women ....................26 4.4. MDG 4: reduce child mortality .............................................................28 4.5. MDG 5: improve maternal health .........................................................28 4.6. MDG 6: combat HIV/AIDS malaria and other diseases......................29 4.7. MDG 7: ensure environmental sustainability .......................................29

ii
4.8. MDG 8: develop a global partnership for development.......................32
5. Summary and recommendations ....................................................................35
References..............................................................................................................43

iii
List of tables
Table 1.1. Survey sample size, by country and by household RAI status .........2 Table 2.1. Sex ratio, by country and by RAI status.............................................8 Table 2.2. Percentage distribution of the female population 15 years and
older, by country, RAI status and by marital status...........................9 Table 2.3. Household characteristics, by country, household RAI status........10 Table 3.1. Selected MDG indicators for RAI populations in Armenia,
Ecuador, Sri Lanka and Pakistan......................................................12 Table 4.1. Selected indicators related to MDG 1, by population and
country ...............................................................................................24 Table 4.2. Selected indicators related to MDG 2, by population and
country ...............................................................................................26 Table 4.3. Selected indicators related to MDG 3, by population and
country1..............................................................................................27 Table 4.4. Selected indicators related to MDG 4, by population and
country ...............................................................................................28 Table 4.5 Selected indicators related to MDG 5, by population and
country ...............................................................................................29 Table 4.6. Selected indicators related to MDG 6, by population and
country ...............................................................................................30 Table 4.7. Selected indicators related to MDG 7, by population and
country ...............................................................................................31 Table 4.8. Selected indicators related to MDG 8, by population and
country ...............................................................................................33

v
List of figures
Figure 2.1. Surveyed countries ..............................................................................5 Figure 2.2. Age distribution of surveyed population, by country,
population type ....................................................................................7


vii
Acronyms
AIDS - Acquired Immuno-Deficiency Syndrome ACNUR - Alto Comisionado de las Naciones Unidas para los Refugiados CEPAR - Centro de Estudios de Poblacion y Desarrollo Social CPR - Contraceptive Prevalence Rate HIV - Human Immuno-deficiency Virus HPRA - Health Policy Research Associates MDG - Millennium Development Goal NIDI - Netherlands Interdisciplinary Demographic Institute RAI - Refugees, asylum seekers and Internally Displaced Persons UNHCR - United Nations High Commissioner for Refugees WHO - World Health Organisation

ix
Acknowledgments
Underlying this study are the concerted efforts of many institutions and individuals. The study on the living conditions of people to the concern of UNHCR in different countries was commissioned by this organisation to the Netherlands Interdisciplinary Demographic Institute (NIDI). In turn, NIDI engaged local research institutions to execute in-country surveys and analyses. We much appreciated the support and guidance from UNHCR staff in various locations. At UNHCR Headquarters, we would like to thank in particular Jean-Bosco Rushatsi, Khassoum Diallo, and —in the initial stage of the project— Bela Hovy. In the UNHCR country offices we want to extend our sincere thanks to Peter Nicolaus, Jean Yves Bouchardy, Tigran Kuchukyan Vahagn Sahakyan and Marine Shabazyan (Armenia), Jose Euceda and Durval Martinez (Ecuador), and Axel Bisschop and Drene Sariffodeen (Sri Lanka). In addition, we very much appreciated the feedback and facilitation of staff of the regional UNHCR offices in Vavuniya, Killinochchi, Mannar, Trincomalee and Jaffna. We want to express our gratitude to the staff of the organisations that were engaged in executing project activities, frequently under harsh or volatile conditions. We very much appreciated their dedication, constructive collaboration and sharp observations in various stages of the project. It was a pleasure working with Eduardo Argüello at the Centro de Estudios de Poblacion y Desarrollo Social (CEPAR) in Quito, Ecuador, and with Ravi Rannan-Eliya, Reggie Perera, Chamikara Perera, Ruwanthi Elwalagedara and Ananda Galappatti at Health Policy Research Associates (HPRA) in Colombo, Sri Lanka. In this last country we also want to acknowledge the work of Sri Lanka Business Development Center (SLBDC) that was realised in difficult situations. In Armenia, our thanks for the fieldwork operations and data processing go to the staff of the UNHCR office in Yerevan. Special appreciation goes to Dick Bilsborrow of the Carolina Population Center, University of North Carolina, for the fruitful and inspiring collaboration in the Ecuador sub-project. We also want to express our gratitude to various unnamed persons in these organisations who contributed to the project, and staff of various ministries, local organisations and international agencies that provided input and feedback.

x
A final word of thanks is directed to the people in Sri Lanka, Ecuador, Armenia and Pakistan who willingly spent time and efforts to provide the large amount of information collected in this study.
xi
Executive summary
The aim of this study is to assess the living conditions of peoples to the concern of UNHCR in four countries: refugees in Pakistan and Armenia1, asylum-seekers and refugees in Ecuador and Internally Displaced Persons (IDPs) in Sri Lanka. The generic acronym ‘RAI’ is used to the combined group of refugees, asylum seekers and IDPs. The Millennium Development Goals (MDGs) that presently guide the international development agenda are used for the methodological approach for this study. The internationally agreed MDG framework identifies key areas of development and a large number of quantitative indicators and sub-indicators to monitor progress in these areas. For the purpose of this study a specific survey instrument was developed, covering 29 MDG indicators and sub-indicators for which data collection at household level was relevant and feasible. Surveys covering RAIs and non-RAIs were conducted in the first half year of 2006 in Sri Lanka, Armenia and Ecuador. The survey information on RAIs is representative at the level of selected districts or provinces where the surveys were conducted. In addition, limited MDG information was drawn from a 2002 nationally representative survey in Pakistan that addressed issues relevant to the return of Afghan refugees. In the framework of this study four country reports have been produced that assess the country-specific living conditions of RAIs in terms of MDG indicators. They also include a large variety of other development- and displacement related information. The present summary report adopts a cross-country comparative perspective and compares the demographic profiles of the RAI populations, their position on MDG indicators and their MDG situation vis-á-vis the surveyed comparison population and national MDG indicator, i.e. the relative deprivation. In terms of the demographic structure of the populations under study, relatively old populations were found in Armenia and relatively young populations in Pakistan and Ecuador. Armenia and Pakistan also contrasted in terms of sex ratio: large over-representation of women was found in the former country and a
1 In this report, Armenian refugees include people with a refugee status and naturalised
former refugees.
xii
strong male bias in the latter. Widowed, separated and divorced women constitute one third of the adult female refugee population in Armenia and almost one-fifth in Ecuador. RAI households in Armenia average less than 2 persons and are usually female-headed, whereas those in Pakistan count nearly 10 persons on average and are almost exclusively male-headed. In Ecuador and Sri Lanka, mean household size is around four persons. The review of the living conditions of RAI populations in the countries covered by the surveys presents a varied picture. Relatively favourable conditions in one development domain are offset by disadvantages in others. It is apparent that sheer poverty occurs less among refugees in Armenia than among RAIs in Sri Lanka and Ecuador. Indicators on income, food security, employment and tenure, as well as answers to perception questions on the financial situation and food supply support this evaluation. Education, literacy and health indicators are generally satisfactory for RAIs in Sri Lanka, Ecuador and Armenia (with a notable exception of primary school enrolment of Colombian refugees in Ecuador), but not so for Afghan refugees in Pakistan. Indicators for gender equality based on education and literacy mirror this pattern, but economically, RAI women in Pakistan and to a lesser extent in Sri Lanka are much more disadvantaged than those in Armenia and Ecuador. With respect to health-related indicators, the three MDG survey countries have rather similar profiles. Levels of immunisation against measles and skilled birth attendance are consistently high, and the contraceptive prevalence rates are also in the same broad range between 56 percent in Ecuador and 43 percent in Armenia, with Sri Lanka in between. The low levels of correct and comprehensive knowledge about HIV/AIDS (ranging between 0 and 15%) are worrisome, even though HIV/AIDS is not a major health issue in any of the countries and many seem to have a fair understanding of ways of preventing the transmission of HIV. There is not much difference in the living conditions of RAIs across countries —either urban or rural— in terms of basic supply of water and sanitation. Solid fuels are used by 98, 64 and 8 percent of the RAI populations in Sri Lanka, Armenia and Ecuador respectively. The access to information and communication technologies is low, but relatively most widespread among refugees/asylum seekers in Ecuador.
xiii
With respect to the relative position of RAIs within their country of residence, the MDG indicators point out that RAIs are underprivileged compared to non-RAIs in terms of resources, access to services and support. This is according to expectation. Relative deprivation seems lowest in Armenia, where considerable time elapsed since arrival of the refugees and where government policy is directed at full integration of this population group. In Ecuador and Sri Lanka, RAIs face more obstacles for full integration in society. The legal situation of asylum seekers in Ecuador may hamper the employment of effective strategies for improvement of living conditions in certain areas and in Sri Lanka, many IDPs might be trapped in a blind-ally situation of an enduring conflict and few opportunities for economic improvement. The comparative approach allows the identification of specific areas that require attention from the government or aid agencies if equity is to be achieved between RAIs and the general population in the country. The MDG analysis indicates that for IDPs in Sri Lanka special attention is required for the food security situation (in particular that of children), employment and economic opportunities (in particular for women), secure tenancy and rural sanitation. For Ecuador, priority areas include access to education (especially for girls) and secure tenure (both possibly well served if asylum seekers are provided with access to legal documents), food security and information on and access to contraceptive methods. Finally, the disadvantaged position of refugees in Armenia is particularly evident for supply of safe drinking water, both in urban and rural areas, and information on and access to contraceptive methods. In all countries, RAIs are relatively underprivileged in terms of improved water supply in rural areas, telephone use and access to the internet. The MDG indicator assessment and the comparison of living conditions of RAIs and non-RAIs in and across countries may support decision making by governments, NGOs and international development agencies for priority and target setting support programmes. It is worth mentioning that the MDG surveys in Armenia, Ecuador and Sri Lanka produced a wealth of information that is only partly tapped by this report and the country reports. Additional, in-depth analysis may produce information of prime interest to governments and aid agencies. This relates, for example, to understanding better the problems faced by RAIs, coping behaviours, and analysis of specific vulnerable groups, such as children, adolescents, women and the elderly. In a broader context, the development of the MDG survey instruments may facilitate comparable studies in other settings. The experience gained in the surveyed countries allows the

xiv
further development of focused survey instruments that would permit rapid MDG assessments in targeted populations.

1. Introduction
In pursuit of its aim to safeguard the rights and well-being of refugees, UNHCR is in need of reliable information about the populations to its concern. Basic information consists of the whereabouts and the size of these populations, but to adequately address the needs of the people more in-depth information is required. This information relates to the populations’ profile in terms of age and sex, but also to their socio-economic and health conditions, the specific problems they encounter being refugees and the strategies they apply to cope with these. In the United Nations 2000 Millennium Declaration eight Millennium Development Goals (MDGs) and 18 time-bound targets were defined to guide countries and the international community on the road to development. The MDGs identified key areas of development, such as eradication of poverty and hunger, education, gender equality, various dimensions of health and environmental sustainability. In a follow-up to the Declaration, 48 quantitative indicators and several sub-indicators were defined to monitor countries’ progress toward the goals and targets. The nature of the MDG indicators allows cross-country comparisons, but also comparison between provinces or districts within countries or comparison between specific target groups. The internationally accepted MDG agenda provides an obvious framework to assess the living conditions of refugee populations in a comparative perspective. The present study describes the living situation of four populations that are under the mandate of UNHCR: refugees in Pakistan and Armenia2, asylum-seekers and refugees in Ecuador and Internally Displaced Persons (IDPs) in Sri Lanka. For the sake of conciseness, refugees, asylum-seekers and Internally Displaced Persons are indicated with the acronym ‘RAI’ in the text if the combined group is referred to. Information on MDG indicators at country level is usually derived from a large variety of data sources. For measurement of MDG indicators for RAI
2 In this report, Armenian refugees include people with a refugee status and naturalised
former refugees.

2 Chapter 1
populations a specific survey questionnaire3 was developed, covering as many indicators and additional relevant information as possible4. This comparative report combines and summarises the results of these household surveys conducted in Armenia, Ecuador and Sri Lanka in the first half of 2006. Country reports present detailed results of these studies (Bilsborrow and CEPAR, 2006; Groenewold and Schoorl, 2006 and HPRA, 2006). In addition, this summary report builds on a separate country report on the living conditions of Afghan refugees in Pakistan (Groenewold, 2006). This report is based on a survey that not specifically addressed MDGs, but instead focused on socio-economic and demographic information for the development of refugee return programs (Exterkate, 2002). All together, the study includes information about close to 3,500 households (nearly 2,500 in the MDG surveys and over 1,000 in Pakistan) and over 17 thousand household members. Table 1.1 provides the household sample sizes of the surveys in the four countries. The Sri Lanka and Armenia surveys allowed the addition of a reference group of non-RAIs. In Ecuador, the survey included Colombian refugees/asylum seekers and other Colombian immigrants for comparison.
Table 1.1. Survey sample size, by country and by household RAI status Country Household
RAI status Armenia Ecuador Sri Lanka Pakistan RAI households 552 222 873 1,044 Non-RAI households 312 277 191 Total 864 499 1,064 1,044
3 The questionnaires of the household surveys are included in the country reports. They
were designed as comparative survey instruments, with country-specific adaptations, where required. For the questionnaires, reference is made to the country reports.
4 Not all MDG indicators can be calculated on the basis of the survey instrument developed; other indicators are irrelevant in the context of this study.
Introduction 3
The RAI information is representative for the selected districts or provinces5. For Pakistan the sample is nationally representative, covering Afghan refugees in refugee camps and those living in urban areas. The MDG indicators take central stage in this paper and the MDG analysis is occasionally supplemented with other relevant information derived from the surveys. However, within the limited scope of this summary report it is not feasible to add detailed disaggregation or additional analysis on specific target groups and additional topics. For more detailed and comprehensive analysis can be referred to the country reports. These include perspectives on gender and specific target groups, migration and displacement histories, specific problems faced by RAIs, types and sources of assistance received, coping behaviour, and perceptions on health and the adequacy of household income and food, next to additional socio-economic and demographic data. It is, however, worth mentioning that the MDG survey provides much more information than could be included in the present reports. The analysis in this report provides two comparative views: (1) comparison of MDG indicators for the RAI populations across Armenia, Ecuador, Sri Lanka and Pakistan; and (2) comparison of the differences between MDG indicators for RAI and non-RAI populations in the MDG survey countries (Armenia, Ecuador and Sri Lanka only). The information on these comparative views are presented in Sections 3 and 4, respectively. Before that, Section 2 provides a brief description of country backgrounds and the characteristics of the surveyed populations and the households they live in.
5 Armenia: Syunik province; Ecuador: Esmeraldas, Carchi, Imbabura, Pichincha and
Sucumbios provinces; Sri Lanka: Mannar, Vavuniya, Anuradhapura and Polonnaruwa districts. In Trincomalee only a small sample was surveyed.


2. Country backgrounds and RAI population profiles
2.1. The settings of RAIs and the survey contexts
The comparative study on the MDG situation of RAIs purposively selected local settings of very diverse nature (see figure 2.1). The four countries included in the analysis vary widely geographically, socio-economically6 and culturally, as well as in terms of the historical background of refugee movements, the duration of displacement and, for instance, the legal and policy implications. The living situation of the RAIs, as captured by MDG indicators, importantly reflects these differences. A main difference between Armenia, Ecuador and Pakistan on the one hand and Sri Lanka on the other is the international dimension of displacement in the former countries. Refugees and asylum seekers in these three countries crossed
Figure 2.1. Surveyed countries
6 Ecuador, Armenia, Sri Lanka and Pakistan rank, respectively 82, 83, 93 and 135 on a
total of 177 countries on the Human Development Index (UNDP, 2005).
MDG SurveyReturn Programme Survey

6 Chapter 2
borders and were faced with additional issues of citizenship, legal rights and access to formal employment and public services. However, strong ethnic ties and traditional border-crossing as is the case for Afghan refugees in Pakistan may have facilitated integration in the new setting. The local policy on refugees or displaced persons may also have decisive influence on various life domains of these populations. Thus in Armenia government policy actively seeks integration and naturalisation of the ethnic Armenian refugees from Azerbaijan, whereas the Ecuador government is more reluctant to embrace the idea of massive naturalisation of Columbian asylum seekers. IDPs in Sri Lanka are not foreigners in a new country, but they too may encounter problems, such as legal access to land and voting in their new living environment during their displacement. Apart from the general socio-economic situation in the study countries, a second major differentiation consists of the ‘maturation’ of the RAI process. Beyond the phase of acute needs, RAIs may be able to find new ways of living, resulting in less vulnerability and improved living conditions. The waves of refugees from Azerbaijan to Armenia and Afghanistan to Pakistan occurred around 1990 and from the late 1970s to the 1990s, respectively. Large-scale displacement in Sri Lanka started in 1983 and only slowed down in the early years of this millennium. Many returned home after the 2002 Ceasefire Agreement, but renewed displacement occurred as the local conflict intensified in 2006. The refugee problems at a large-scale in Ecuador are of more recent nature. Besides people moving from Colombia to Ecuador for economic and personal reasons, Colombians fleeing the violence in their country is largely a phenomenon that started in the late 1990s and still continues. The Ecuador survey focused on Colombians arriving since 2000. Finally, the composition of the surveyed populations by age, sex and other demographic characteristics may bear impact on a variety of development indicators, such as sex ratios in employment and education or contraceptive prevalence rates. Section 2.2 addresses these issues in more detail.
2.2. Population profiles
The age distribution of RAI populations in the four study countries show large differences (see figure 2.2). The most striking feature is the absence of children under fifteen years of age among Armenian refugees. This artefact is observed

Country backgrounds and RAI population profiles 7
Figure 2.2. Age distribution of surveyed population, by country, population type
because no child refugees entered Armenia in recent years, and all children of refugee born in Armenia automatically obtain the country’s citizenship at birth and formally cannot be considered refugees. This under-fifteen group is, therefore, incorporated in the population of non-refugees, causing an overrepresentation of children there. For the MDG indicator analysis the formal status of children of refugees is disregarded and they are included in the refugee population, along with naturalised refugees. Another striking feature of the Armenian refugee population is the large emphasis established by the older generations: almost one third is 65 years of age or older and only one in four is below 35. In the other RAI populations, the share of the 65 and over is almost negligible. On the other hand, almost half (46%) of Afghan refugees in Pakistan are children under 15, and among the refugees/asylum seekers in Ecuador this share is only slightly smaller (44%). Apart from the artificial Armenian case, of all RAI populations the one in Sri Lanka has the smallest —though still considerable— proportion under fifteens (35%). When we compare the IDP with the non-IDP population in Sri Lanka, we see that the age composition is fairly alike, although the share of children among IDPs is somewhat larger, at the expense of that of older adults (35-64 years). In
3544 40 35 30
46
26
27
31 3935
35
33
44
26
25 2027 31
182911
1 2 3 3 2
0%10%20%30%40%50%60%70%80%90%
100%
ArmeniaRAI
Armenianon-RAI
EcuadorRAI
Ecuadornon-RAI
SriLankaRAI
SriLanka
non-RAI
PakistanRAI
0-14 15-34 35-64 65+

8 Chapter 2
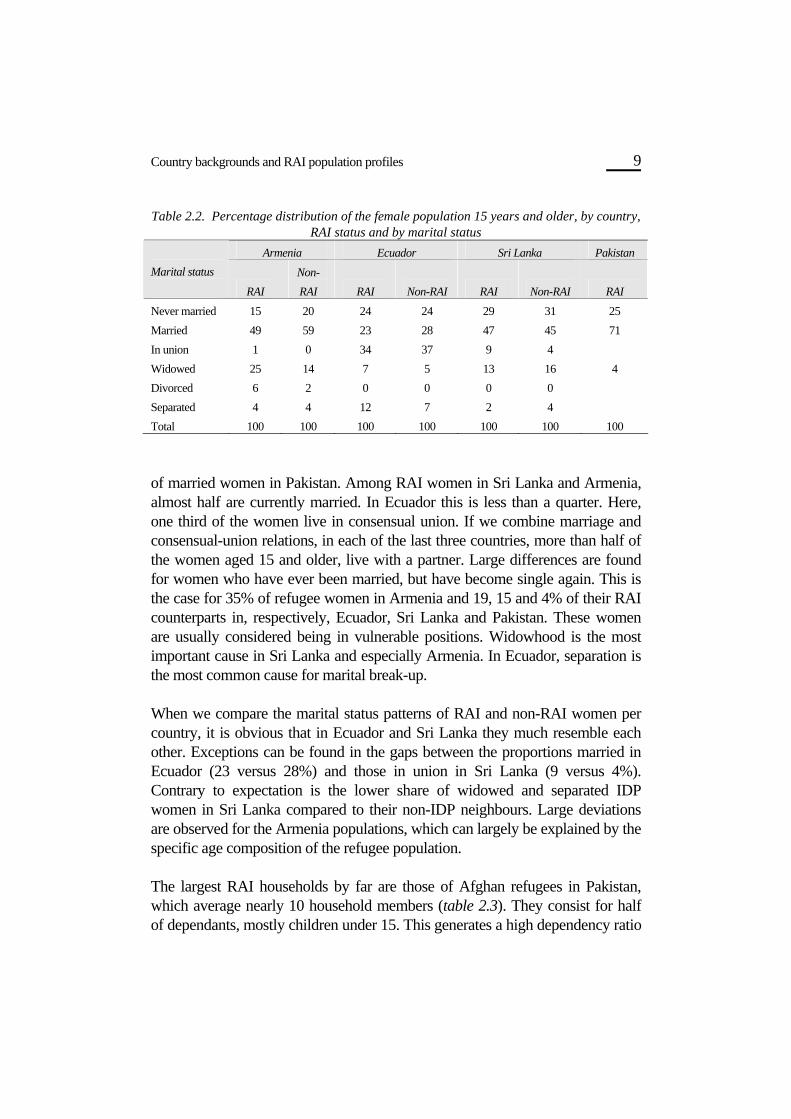
Ecuador a similar child bias shows for refugees/asylum seekers, but the shares of children in this population and the reference group of Colombian immigrants are even larger. In both countries, this would mean that the dependency ratio and the corresponding financial burden in the RAI population is larger than in the non-RAI population. In terms of sex composition the different populations under study present large differences (see table 2.1). Variations in sex ratios —the number of females per 100 males— are usually mainly caused by sex-selective immigration and out-migration, and to a lesser extent by selective mortality. However, in the case of conflict-affected populations, the mortality component may be more significant. It is beyond the scope of this paper to analyse the specific determinants of the sex ratio in the surveyed populations. It is common to find an overrepresentation of women in refugee populations, but this is not the case in Ecuador and Pakistan. The sex ratio’s are well below 100 here, in Pakistan even as low as 84 women per 100 men. The opposite is the case in Armenia and Sri Lanka, with an extremely high sex ratio of 141 women per 100 men for the former country. This can partly be explained by the old age composition of the Armenian refugee population, where women often outlived men. Additional explanations might be found in a male-biased out-migration or in past high male mortality due to the conflict with Azerbaijan. These might also help explaining the high sex ratio in the non-refugee population in Armenia, which is in line with the national figure. The sex ratio of 98 for the reference population in Sri Lanka does not correspond to the national figure, which is closer to the one found for the IDPs. As with the other demographic characteristics, the RAI populations studied widely differ with respect to their marital status distribution. For the sake of brevity, here only the figures for women are presented (table 2.2). The young age at marriage in Afghan and Pakistan societies is reflected in the large share
Table 2.1. Sex ratio, by country and by RAI status Population Armenia Ecuador Sri Lanka Pakistan RAI population 141 93 106 84 Non-RAI population 114 106 98 --
Country backgrounds and RAI population profiles 9
Table 2.2. Percentage distribution of the female population 15 years and older, by country, RAI status and by marital status
Armenia Ecuador Sri Lanka Pakistan Marital status RAI
Non-RAI RAI Non-RAI RAI Non-RAI RAI
Never married 15 20 24 24 29 31 25 Married 49 59 23 28 47 45 71 In union 1 0 34 37 9 4 Widowed 25 14 7 5 13 16 4 Divorced 6 2 0 0 0 0 Separated 4 4 12 7 2 4 Total 100 100 100 100 100 100 100 of married women in Pakistan. Among RAI women in Sri Lanka and Armenia, almost half are currently married. In Ecuador this is less than a quarter. Here, one third of the women live in consensual union. If we combine marriage and consensual-union relations, in each of the last three countries, more than half of the women aged 15 and older, live with a partner. Large differences are found for women who have ever been married, but have become single again. This is the case for 35% of refugee women in Armenia and 19, 15 and 4% of their RAI counterparts in, respectively, Ecuador, Sri Lanka and Pakistan. These women are usually considered being in vulnerable positions. Widowhood is the most important cause in Sri Lanka and especially Armenia. In Ecuador, separation is the most common cause for marital break-up. When we compare the marital status patterns of RAI and non-RAI women per country, it is obvious that in Ecuador and Sri Lanka they much resemble each other. Exceptions can be found in the gaps between the proportions married in Ecuador (23 versus 28%) and those in union in Sri Lanka (9 versus 4%). Contrary to expectation is the lower share of widowed and separated IDP women in Sri Lanka compared to their non-IDP neighbours. Large deviations are observed for the Armenia populations, which can largely be explained by the specific age composition of the refugee population. The largest RAI households by far are those of Afghan refugees in Pakistan, which average nearly 10 household members (table 2.3). They consist for half of dependants, mostly children under 15. This generates a high dependency ratio

10 Chapter 2
Table 2.3. Household characteristics, by country, household RAI status
1 Calculated as all persons in age categories 0-14 and 60+ per 100 persons in age category 15-59.
(126) and a high financial burden in these households. Armenian refugee households, on the other hand, comprise on average less than two persons. In view of the other information about the large prevalence of widowhood and female headed households, it is evident that a considerable number of households consist of older single women living alone. This very small average household size of 1.9 persons contrasts with the households size of non-refugees in Armenia (3.6). RAI households in Ecuador and Sri Lanka average around four members, but it should be noted that the Sri Lanka IDP households include mixed households (households with IDPs and non-IDPs). As expected and as can be observed in Fout! Verwijzingsbron niet gevonden., mixed households tend to be larger than households with only RAIs. In many cases, RAIs moved into existing households of non-RAIs, thereby increasing their size.
Armenia
Ecuador Sri Lanka Pakistan Household characteristics
RAI
Mixed Non-RAI
RAI
Mixed Non-RAI
RAI
Non-RAI
RAI
Average household size
1.9 4.6 3.6 3.9 5.0 3.9 4.3 3.9 9.7
Average no. of dependants
0.8 2.0 1.3 1.8 2.4 1.7 1.6 1.2 4.8
Dependency ratio1 74 76 56 -- -- -- -- -- 126 Percentage female-headed
53 29 33 29 26 18 -- -- 4
3. How do living conditions of RAIs compare across countries?
Table 3.1 presents the living conditions of RAI populations in the four survey countries in terms of selected MDG indicators. As could be expected on the basis of the countries’ position in the process of development, the different historical contexts and the diverse government responses to RAIs, MDG performance per country shows a large variety. Some general patterns can be deduced, but the picture is far from consistent. The comparison of living conditions of RAIs in different countries on the basis of objective and internationally accepted criteria covering different development themes, may help priority setting in support programmes of international aid agencies, such as UNHCR, as well as of local governments and NGOs.
3.1. MDG 1: eradicate extreme poverty and hunger
The MDG framework includes three indicators to measure poverty status and two for monitoring the nutritional status in a population. The MDG survey in Armenia, Ecuador and Sri Lanka allowed the calculation of two poverty indicators: the percentage of population living on less than USD 1 per day (indicator 1) and the poverty gap ratio (indicator 2) (the ‘depth of poverty’). It should be emphasised that these indicators need to be treated with extreme caution. Both are based on rough income measurements and can not be considered very reliable. However, the large difference between Armenia on the one hand and Sri Lanka and Ecuador on the other may well be taken as an indication of the higher levels of poverty under RAIs in the latter countries. A notable difference can furthermore be observed between refugee households and mixed households with both refugees and non-refugees in Armenia. Individual perceptions on the financial household situation provides a complementary and sometimes contrasting picture to the MDG indicators. Significantly more heads of households in Armenia than in Sri Lanka judge their situation as insufficient, although they have higher financial expectations for the future (see the country reports). In Ecuador the present financial situation is perceived the worst: over 80 percent of household heads judge their economic situation inadequate for meeting the households’ basic needs. But even more than in Armenia, their future outlook is optimistic.

12 Chapter 3
Table 3.1. Selected MDG indicators for RAI populations in Armenia, Ecuador, Sri Lanka and Pakistan Goal Targets Indicators Armenia1 Ecuador1 Sri Lanka Pakistan2 RAI Mixed RAI Mixed
1 Percentage of population below $1 (PPP) per day 3
1 Eradicate extreme poverty and hunger
1 Halve, between 1990 and 2015, the proportion of people whose income is less than one dollar per day 2 Poverty gap ratio3
4% 29% 50
--
58%
--
53%
18%
--
--
2 Halve, between 1990 and 2015, the proportion of people who suffer from hunger
4 Prevalence of underweight children under-five years of age
18% -- 41% --
2 Achieve universal primary education
3 Ensure that, by 2015, children everywhere, boys and girls alike, will be able to complete a full course of primary schooling
6 Net enrolment ratio in primary education
7 Proportion of pupils starting grade 1 who reach grade 55
8 Literacy rate of 15-24 year-olds
0.99
(86%)
96%
0.77
--
86%
0.96
92%
97%
0.11
41%
43% 3 Promote gender equality and
empower women 4 Eliminate gender disparity in
primary and secondary education, preferably by 2005 and in all levels of education no later than 2015
9 Ratios of girls to boys in primary, secondary and tertiary education6
10 Ratio of literate women to men, 15-24 years old
11 Share of women in wage employment in the non-agricultural sector
100 (p) 121 (s)
125
50%
89 (p)
106
43%
98 (p) 93 (s) 108
18%
84 (p) 78 (s)
44
8%
4 Reduce child mortality 5 Reduce by two-thirds, between 1990 and 2015, the under-five mortality rate
15 Proportion of 1 year-old children immunised against measles
(50%) 90% 80% --
5 Improve maternal health 6 Reduce by 3/4, between 1990 and 2015, the maternal mortality ratio
17 Proportion of births attended by skilled health personnel
100% 98% 96% --
6 Combat HIV/AIDS, malaria and other diseases
7 Halt by 2015 and begun to reverse the spread of HIV/AIDS
19a Condom use as share of contraceptive prevalence
19b Percentage of population aged 15-24 years with comprehensive correct knowledge of HIV/AIDS
19c Contraceptive prevalence rate
43%
8%
43%
4%
14%
56%
12%
0%
50%8
--
--
--
4 %

How
do living conditions of RAIs com
pare across countries? 13
Table 3.1. (continued) Goal Targets Indicators Armenia1 Ecuador1 Sri Lanka Pakistan2 RAI Mixed RAI Mixed 8 Halt by 2015 and begun to
reverse the the incidence of malaria and other major diseases
22 Proportion of population in malaria-risk areas using effective
- malaria prevention measures - malaria treatment measures
-- 0%
-- --
18% 0%
-- --
7 Ensure environmental sustainability
9 Integrate principles of sustainable development into country policies and programmes and reverse loss of environmental resources
29 Proportion of population using solid fueals
64% 8% 98% --
10 Halve, by 2015, the proportion of people without sustainable access to safe drinking water and basic sanitation
30 Proportion of population with sustainable access to an improved water source (urban and rural)
31 Proportion of population with access to improved sanitation (urban and rural)
86% (u) 72%(r)
89% (u) 70% (r)
97% (u) 53%(r)
91% (u) 66% (r)
96% (u) 78% (r)
95% (u) 66% (r)
-- --
-- --
11 By 2020, to achieve a significant improvement in the lives of at least 100 million slum dwellers
32 Proportion of households with access to secure tenure9
79% 2% 52% --
8 Develop a global partner- ship for development
16 Cooperation with developing countries, develop and implement strategies for decent and productive work for youth
45 Unemployment rate (%) of young people aged 15-24 years, each sex and total
80% (m) 91% (f) 83% (t)
25% (m) 33% (f) 29% (t)
29% (m) 65% (f) 43% (t)
46% (m) 92% (f) 66% (t)
18 Cooperation with the private sector, make available the benefits of new technologies, especially information and communications
47 Telephone lines and cellular subscribers per 100 population
48 Personal computers in use per 100 population
Internet users per 100 population
3 0 4
37 2
13
11 1 9
--
--
--
14 Chapter 3
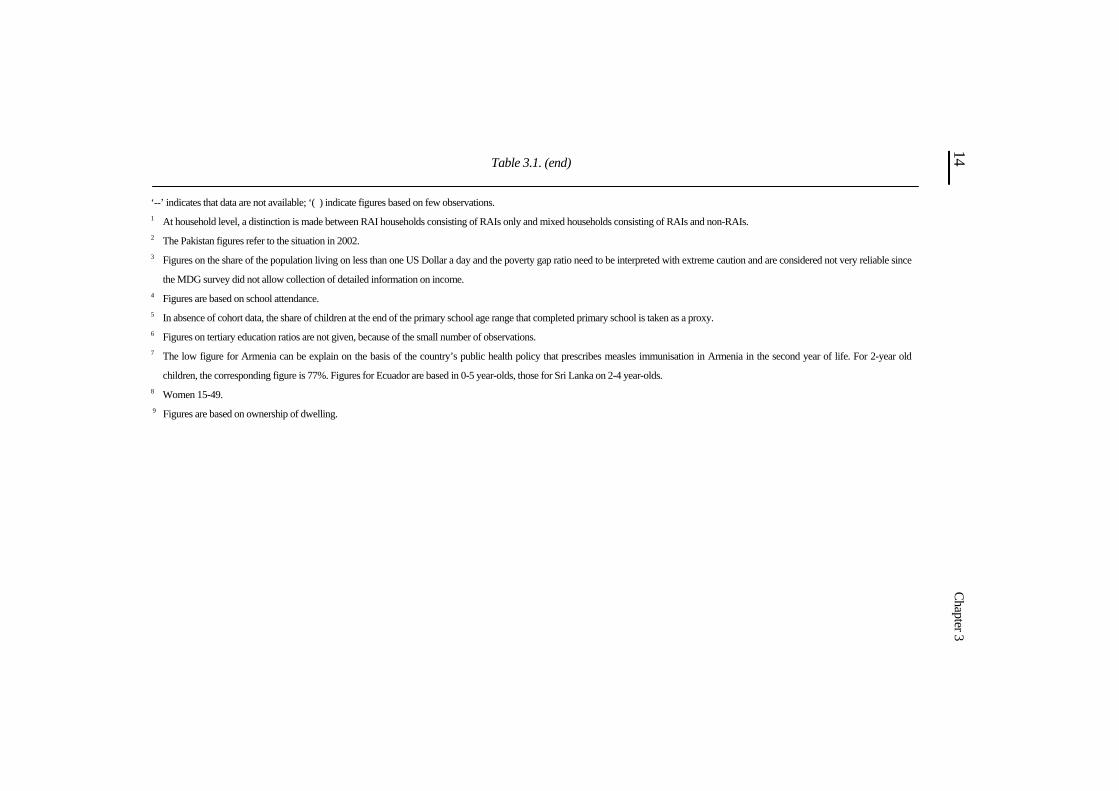
Table 3.1. (end)
‘--’ indicates that data are not available; ‘( ) indicate figures based on few observations. 1 At household level, a distinction is made between RAI households consisting of RAIs only and mixed households consisting of RAIs and non-RAIs. 2 The Pakistan figures refer to the situation in 2002. 3 Figures on the share of the population living on less than one US Dollar a day and the poverty gap ratio need to be interpreted with extreme caution and are considered not very reliable since
the MDG survey did not allow collection of detailed information on income. 4 Figures are based on school attendance.
5 In absence of cohort data, the share of children at the end of the primary school age range that completed primary school is taken as a proxy. 6 Figures on tertiary education ratios are not given, because of the small number of observations.
7 The low figure for Armenia can be explain on the basis of the country’s public health policy that prescribes measles immunisation in Armenia in the second year of life. For 2-year old
children, the corresponding figure is 77%. Figures for Ecuador are based in 0-5 year-olds, those for Sri Lanka on 2-4 year-olds. 8 Women 15-49.
9 Figures are based on ownership of dwelling.
How do living conditions of RAIs compare across countries? 15
In this study, the prevalence of underweight children aged 0-4 provides the MDG indicator related to hunger eradication (indicator 4). Anthropometric measurements for weight-for-age done in Sri Lanka and Armenia show that nearly one in five Armenian refugee children (18%), and no less than two in five Sri Lankan IDP children (41%) can be considered underweight. Weight-for-height and height-for-age measurements in Armenia furthermore reveal, respectively, lower levels of wasting and higher levels of stunting. This may reflect chronic under-nourishment during the first years of life rather than acute deprivation of food. In Sri Lanka both stunting and wasting levels are lower than levels of underweight (see country reports). In Ecuador, project resources were not sufficient to do anthropometric measurements, but information on food security was obtained through a limited number of other questions. Around one-third of Columbian refugees/asylum seekers had only one or two meals a day and only in one in five households there is usually sufficient food available. Two in five households even indicate that there is usually or always food shortage. In Armenia, around half the refugee households live on only one or two meals a day. Only 13 percent of these households state that food availability is usually sufficient, whereas over 60 percent mentions sufficient food is seldom or never available. For all three countries, this information indicates serious food security problems for the RAI populations.
3.2. MDG 2: achieve universal primary education
Several MDG indicators are devised to monitor progress towards the goal of achieving universal primary education. In this study, school attendance ratio’s in primary education are taken as a proxy for the MDG indicator of the net enrolment ratio in primary education (indicator 6). Policy priority setting on education in Sri Lanka, Ecuador and Armenia clearly shows off in high attendance ratio’s for Sri Lankan and Armenian RAIs (respectively 0.96 and 0.99). With a school attendance ratio of only 0.77, Colombian refugee/asylum-seeker children seem to be much less reached by basic education. This could be related to the legal status of asylum seekers and associated difficulties in access to public services. A very low primary school attendance ratio of only 0.11 is found for Afghan refugee children in Pakistan.
16 Chapter 3
In absence of cohort data, the share of children at the end of the primary school age range that completed primary school is taken as a proxy for the MDG indicator of the proportion of pupils starting grade 1 who reach grade 5 (indicator 7). Again relatively high performance levels can be observed for Sri Lanka and Armenia (92 and 86 percent respectively), whereas with a completion rate of only 41 percent the drop-out rate in Pakistan is much higher — around half of the boys complete primary education and only around one third of the girls. For Ecuador, sample size limitations do not warrant this kind of analysis. The pattern of literacy rates of the 15-24 year old RAIs (indicator 8) in the four countries very much resembles those of the other two education MDG indicators. There is almost universal literacy among Armenian refugees and Sri Lankan IDPs (96 and 97%, respectively), lower literacy levels among and Colombian RAIs (86%) and only 43 percent literacy among Afghan refugees in Pakistan. The overall picture for the four survey countries is that refugee children in Sri Lanka and Armenia are well-served by the (primary) education system, RAI children in Ecuador less but still fairly so, and Afghan refugee children in Pakistan apparently very under-served.
3.3. MDG 3: promote gender equality and empower women
MDG indicators on gender equality and women’s empowerment focus on disparities between women and men and are measured by two educational indicators and one employment-related indicator. The ratios of girls to boys in primary education (indicator 9) are close to unity in Armenia and Sri Lanka (respectively, 100 and 98 girls per 100 boys), reflecting fair gender equity. The ratio for secondary education is slightly lower than for primary education in Sri Lanka, but, surprisingly, higher in Armenia. There is no apparent explanation for this last observation apart from the slight overrepresentation of girls in the sample population. Afghan refugees in Pakistan have significantly lower sex ratios for primary and secondary education, respectively 84 and 78 girls per 100 boys. This reflects the disadvantaged position of women and girls in the Pakistan and Afghan societies. Insufficient observations were available to calculate reliable RAI sex ratios in tertiary education in these countries.
How do living conditions of RAIs compare across countries? 17
With respect to the ratio of literate women to men aged 15-24 (indicator 10), all RAI populations, except the Afghan refugees in Pakistan show higher female literacy levels. The ratio in Pakistan shows a very high male bias in literacy: only 44 women on every 100 men are literate. The third MDG gender indicator is the share of women in wage employment in the non-agricultural sector. According to this indicator, the position of RAI women is the best in Armenia (a women’s share of exactly 50%), followed by that in Ecuador (43%). However, it should be noted that the Armenia figure is much distorted by the large overrepresentation of women in the Armenia refugee population (see table 2.2). The contribution of refugee women in the non-agricultural sector in Ecuador, on the other hand, is surprisingly high given the low sex ratio in this population. The corresponding figures for women engaged in the non-agricultural sector in Sri Lanka and Pakistan are very low, with shares of 18 and around 8 percent only. The three measured indicators for the MDG on refugees’ gender equality and women’s empowerment allow the interpretation that in the field of education, gender equality is achieved for Armenian refugees, and fairly good performances are observed in Ecuador and Sri Lanka. The figures also suggest that economic equality and empowerment is realised to a great extent in Armenia and Ecuador, but not so in Sri Lanka. In Pakistan, the position of Afghan refugee women is consistently low across both education and economic domains.
3.4. MDG 4: reduce child mortality
The one MDG indicator that could be calculated on the basis of the survey data in Armenia, Ecuador and Sri Lanka was the proportion of 1 year-old children immunised against measles (indicator 15). The other two on infant and child mortality would have required much larger sample sizes. Immunisation against measles as an essential component against under-five mortality occurred among 80 percent of IDP children in Sri Lanka, indicating that the achievements of the health system are largely covering the IDP population. The corresponding figure for Armenia is significantly lower (50% only), but it should be mentioned that the local policy prescribes measles vaccination between 12 and 24 months old and not in the first year of life as recommended by WHO. Should the proportion immunised for the age group

18 Chapter 3
12-23 months be used, the indicator for Armenia would rise to 77 percent. In any case, the Armenia data should be treated with caution, since the number of children in the respective ages is quite small. For Ecuador, no reliable figures are available per single year of age due to the small sample size. However, in the age group 0-5, 90 percent received a vaccination against measles.
3.5. MDG 5: improve maternal health
Sample size limitations did not allow the calculation of the MDG indicator on maternal health. However, the survey did produce information on the proportion of births attended by skilled health personnel (indicator 17). Delivery with the assistance of a medically trained health-care provider is a crucial factor in the reduction of maternal mortality and improvement of maternal health. The survey results indicated universal birth attendance by skilled health personnel in Armenia and slightly lower levels of skilled attendance in Sri Lanka (96%). The skilled attendance level for refugee/asylum seeker women in Ecuador is likely to be above 90 percent, but cannot be established easily (see the Ecuador country report). The favourable maternal health conditions for IDP women in Sri Lanka are furthermore supported by additional information, indicating high levels of deliveries in health service centres (over 90%) and frequent contact with health personnel during pregnancy (see the Sri Lanka country report).
3.6. MDG 6: combat HIV/AIDS malaria and other diseases
For this MDG, 11 indicators and sub-indicators have been identified to measure the situation with regard to, in particular, HIV/AIDS and malaria. None of the survey countries is classified as a country with high HIV prevalence. In all three countries, malaria is prevalent. Calculation of five of these indicators was feasible and relevant in the framework of the MDG survey. Three primarily relate to reproductive health, in particular HIV/AIDS and the two others to malaria. The contraceptive prevalence rate (indicator 19c) is the percentage of women who are practising, or whose sexual partners are practising, any form of contraception. It is useful in tracking progress towards health, gender and poverty goals. It also serves as a proxy measure of access to reproductive health
How do living conditions of RAIs compare across countries? 19
services that are essential for meeting many of the goals, especially the child and maternity mortality and HIV/AIDS goals. The condom use rate of the contraceptive prevalence rate (indicator 19) refers to the number of women aged 15–49 years in marital or consensual unions who are practising contraception by using condoms as a proportion of all of women of the same age group in unions who are practising, or whose sexual partners are practising, any form of contraception. This indicator is used to monitor progress towards halting and reversing the spread of HIV/AIDS, as condoms are the only contraceptive method effective in reducing the spread of HIV. The contraceptive prevalence rates among RAI populations are fairly modest. In Ecuador, Sri Lanka and Armenia, it is, respectively 56, 50 and 43 percent. Whereas in the former two countries condom use is very low, in the latter it is the most common modern contraceptive method (NSS et al., 2001). This is reflected in the respective condom use rates of the contraceptive prevalence rates among the RAI populations: 43 percent in Armenia, 18 percent in Sri Lanka and only 4 percent in Ecuador. The percentage of population aged 15-24 years with comprehensive correct knowledge of HIV/AIDS (indicator 19b) is the share of the population aged 15-24 years who correctly identify the two major ways of preventing the sexual transmission of HIV (using condoms and limiting sex to one faithful, uninfected partner), who reject the two most common local misconceptions about HIV transmission and who know that a healthy-looking person can transmit HIV. This measure is an important indicator of people’s awareness how to avoid the infection with and the spread of HIV. While knowledge levels about HIV/AIDS tapped by a battery of questions are often fairly high on the individual items (see country reports), when we estimate levels of comprehensive knowledge based on the requirement that the respondent provide correct answers to five selected questions, we see that comprehensive knowledge levels among RAIs are low. This indicates that local IEC programmes on HIV/AIDS are not effective in adequately reaching these populations. In Ecuador, 14 percent of refugees/asylum seekers has comprehensive correct knowledge, in Sri Lanka virtually none of the IDPs has so and Armenian refugees take a middle position with 8 percent having comprehensive correct knowledge.
20 Chapter 3
Malaria is endemic in all three countries surveyed with the MDG survey instrument, although incidence within countries may vary by region and time of the year. The indicators on malaria prevention and treatment are not directly comparable, since they do not control for the risk of malaria infection in specific surveyed areas. It, therefore, suffices to mention that the proportion of under-fives who were ill with fever in the two weeks before the survey and who received appropriate anti-malaria drugs (MDG indicator 22 for malaria treatment) is negligible in Sri Lanka. Also in Armenia no malaria drugs were used for treatment of fevers, but in needs mentioning that during the survey period in the winter season, malaria incidence is very low. The proportion of under-fives using effective malaria prevention (i.e. sleeping under insecticide-treated bednets) (MDG indicator 22 for malaria prevention) is 13 percent in Sri Lanka. If we include untreated bednets, the proportion would rise to 35 percent. No questions on bednets were asked in Ecuador as apparently hardly any are used.
3.7. MDG 7: ensure environmental sustainability
Four out of eight indicators for the MDG on environmental sustainability are applicable at household level. The first refers to the proportion of population using solid fuels (wood, charcoal, crop residues and dung) as the primary source of domestic energy for cooking and heating (indicator 29). Burning of solid fuels usually results in the emission potentially health-damaging pollutants and indoor air pollution. There are also important linkages between solid fuel use, deforestation and soil erosion, and greenhouse gas emissions that contribute to global climate change. It can be concluded that use of solid fuels has important impact at the societal level through e.g. global warming and deforestation, but also direct individual impact through e.g. indoor air pollution. Survey data show a large difference across countries in the shares of RAI households that use solid fuels. Whereas in Sri Lanka virtually all IDP households use sold fuels (mainly wood and straw), only 8 percent of refugee/asylum-seeker households in Ecuador do so. In Armenia, the corresponding figure for refugee households is 64 percent. The next two MDG indicators related to environmental sustainability are the proportion of population with, respectively, sustainable access to an improved water source (indicator 30), and access to improved sanitation (indicator 31).
How do living conditions of RAIs compare across countries? 21
Both indicators have clear links to public health. Proportions of RAI populations with access to improved water and sanitation facilities in urban areas are fairly high in all countries and range from 86 to 97 percent and from 89 to 95 percent, respectively. For rural areas, these ranges are, respectively, 53-78 percent and 66-70 percent. Urban-rural differences are smallest in Armenia. The proportion of households with access to secure tenure (indicator 32) is intended to provide insight into the share of urban populations living in conditions of poverty and physical and environmental deprivation. Secure tenure refers to households that own their dwellings, are renting privately or are in social housing or sub-tenancy. Households without secure tenure are defined as squatters, homeless and households with no formal agreement. In absence of detailed tenure information, the data in table 3.1 refer to RAI households owning their dwelling. Large differences can be observed between the RAI households in the survey countries. A large majority of Armenian refugees (79%) own their homes, around half of Sri Lankan IDPs do so and almost no refugee/asylum-seeker household in Ecuador (2% only). This indicates great tenure insecurity among the RAI population in Sri Lanka and especially in Ecuador. The Armenian refugees seem much more settled, which can be explained by the long duration since their displacement and the relative stable and secure situation they experienced since then and overall government support. In rural areas, the situation is generally somewhat better in all three countries (see country reports).
3.8. MDG 8: develop a global partnership for development
There are 17 indicators and sub-indicators related to MDG 8, most of which address issues at international, country or policy levels, and have no direct bearing to households and individuals. The MDG survey provides information for four (sub-)indicators, measuring meaningful youth employment, and the availability of information and communication technologies. The unemployment rate of young people aged 15-24 years (indicator 45) assesses the degree to which the youth labour force is utilised in the economy and therefore serves as a measure of the success of strategies to create jobs for youth. Figures widely differ across the RAI populations in Pakistan and the three MDG survey countries, but comparability is limited since large parts of the differences can be explained by taking into account the varying levels of

22 Chapter 3
absorption in the economically inactive population. For example, the share of the 15-24 year old refugee population outside the labour force is 6 percent in Pakistan, compared to 64 percent for IDPs in Sri Lanka. Low unemployment rates may, therefore, be an indicator for good employment opportunities, but also for the possibility of a priori discouragement or disincentives for engagement in work (see the Sri Lanka country report). In addition, seasonal influences may have had impact on employment figures. This would especially apply to Armenia, where the survey was conducted mid-winter, with very few jobs available and where people may not be inclined to look for work. Bearing these reservations in mind, unemployment rates for RAI populations aged 15-24 are high to staggeringly high in all countries, ranging from 29 percent in Ecuador to 83 percent in Armenia. Female unemployment rates are consistently higher than male unemployment rates. In the cases of Sri Lanka and Pakistan, these are even twice as high. The figures reflect rather gloomy prospects for gainful employment for youth and especially women. The situation with regard to information and communication technologies is covered by the number of telephone lines and cellular subscribers per 100 population (indicator 47), and the number of personal computers in use per 100 population and internet users per 100 population (respectively indicators 48a and 48b). According to table 3.1, much can be gained for the RAI populations in the survey countries in terms of availability of information and communication means. However, in Ecuador a significant part of the refugees/asylum seekers (39%) has telephones to its disposal, mostly cell phones. In Sri Lanka the corresponding figure is 11 percent (again mostly mobile phones), but only 3 percent of the refugee population in Armenia possesses a telephone. With regard to internet access, Ecuador refugees/asylum seekers are again relative advantaged (12 users per 100 population). In Armenia and Sri Lanka hardly anyone uses the internet. Even lower levels are found in all countries for the possession of personal computers.

4. How do differences in living conditions between RAIs and non-RAIs compare across countries?
A second approach for a comparative perspective on the living conditions of RAI populations is the comparison of the differences and similarities between RAI and non-RAI populations within the respective countries. The principal question asked here is not about the relative performance of RAIs in different development themes across countries, but the relative divergence in indicator performance between RAI and non-RAI populations across these countries. This analysis reflects the extent to which RAI populations are locally disadvantaged in terms of resources, access to services and support. It may support decision making by governments and development agencies for priority and target setting. Comparisons of MDG indicators, where possible, are made between RAI and non-RAI populations covered by the surveys7 and national figures8. The country reports provide technical backgrounds and references to national data sources. For some household-level comparisons, also mixed RAI/non-RAI households are included as a category. The present analysis limits itself to the three countries that were covered by the MDG survey (Armenia, Ecuador and Sri Lanka), given the lack of comparable data for non-refugees in the Pakistan survey.
4.1. MDG 1: eradicate extreme poverty and hunger
As can be observed in table 4.1, in general the position of RAI populations is worse compared to the reference populations in the survey and national MDG indicators. This applies to the income-related indicators, as well as the nutrition indicator.
7 In the case of Ecuador, the non-RAI population refers to other Colombian immigrants. 8 National figures are derived from a variety of sources (for references, see the country
reports) that usually refer to years before 2006.
24 Chapter 4
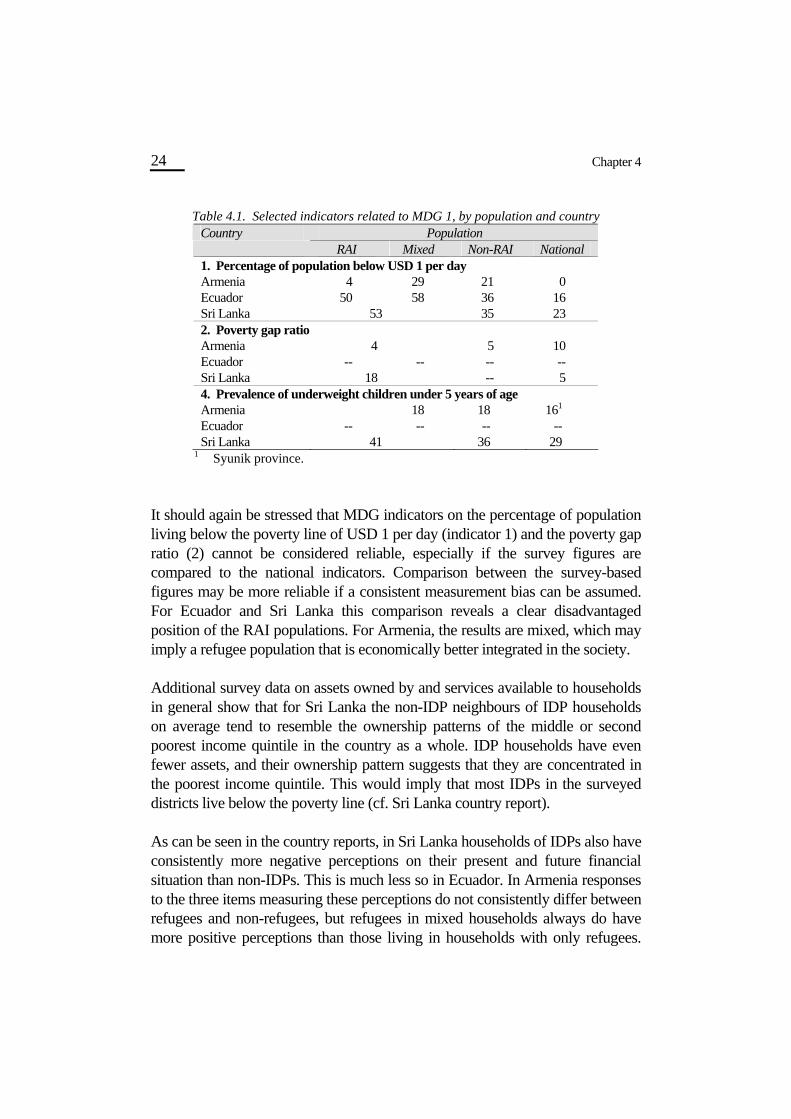
Table 4.1. Selected indicators related to MDG 1, by population and country Country Population RAI Mixed Non-RAI National 1. Percentage of population below USD 1 per day Armenia 4 29 21 0 Ecuador 50 58 36 16 Sri Lanka 53 35 23 2. Poverty gap ratio Armenia 4 5 10 Ecuador -- -- -- -- Sri Lanka 18 -- 5 4. Prevalence of underweight children under 5 years of age Armenia 18 18 161 Ecuador -- -- -- -- Sri Lanka 41 36 29
1 Syunik province. It should again be stressed that MDG indicators on the percentage of population living below the poverty line of USD 1 per day (indicator 1) and the poverty gap ratio (2) cannot be considered reliable, especially if the survey figures are compared to the national indicators. Comparison between the survey-based figures may be more reliable if a consistent measurement bias can be assumed. For Ecuador and Sri Lanka this comparison reveals a clear disadvantaged position of the RAI populations. For Armenia, the results are mixed, which may imply a refugee population that is economically better integrated in the society. Additional survey data on assets owned by and services available to households in general show that for Sri Lanka the non-IDP neighbours of IDP households on average tend to resemble the ownership patterns of the middle or second poorest income quintile in the country as a whole. IDP households have even fewer assets, and their ownership pattern suggests that they are concentrated in the poorest income quintile. This would imply that most IDPs in the surveyed districts live below the poverty line (cf. Sri Lanka country report). As can be seen in the country reports, in Sri Lanka households of IDPs also have consistently more negative perceptions on their present and future financial situation than non-IDPs. This is much less so in Ecuador. In Armenia responses to the three items measuring these perceptions do not consistently differ between refugees and non-refugees, but refugees in mixed households always do have more positive perceptions than those living in households with only refugees.

How do differences in living conditions compare across countries? 25
This could be interpreted in the sense that integration with local people provides avenues for economic improvement. With regard to underweight children, there is hardly any variation between the different populations in the Syunik province of Armenia. However, other survey questions on the food situation in households consistently reveal a pattern of declining food security for non-refugees, refugees in mixed households and those in purely refugee households, respectively. Among the surveyed populations in Ecuador a similar pattern can be observed. For Sri Lanka, the figures in table 4.1 may indicate that the food situation in the surveyed districts is poorer than in the country as a whole, likely as an effect of the presence of the conflict in these areas. Corresponding figures for the most comparable districts in the most recent DHS (ranging from 33-37) support this picture. The food situation of IDPs is even more insecure than that of non-IDPs..
4.2. MDG 2: achieve universal primary education
In terms of educational performance and literacy, MDG indicators for Armenia show hardly any difference between refugees, non-refugees in the survey area and the total population (see table 4.2). The exception is the proportion pupils starting grade 1 who reach grade 5, but this is likely due to the small sample size. With almost universal primary education and literacy, and high school completion rates, the emerging picture shows that educational programmes in Armenia effectively covered the refugee population. In Ecuador net enrolment in primary school is comparably low for Colombian refugees/asylum seekers and other Colombian immigrants (with percentages enrolled of, respectively, 77 and 79). The reason for non-attendance are, however, different for both groups. Data available from the survey indicate that the overwhelming reason for refugee households is lack of money to attend school. In addition, lack of documents was also mentioned as a reason for non-attendance by children of refugees. For non-refugees, lack of money was also the main reason, but not nearly so overwhelmingly. Refugees as well as non-refugees in Ecuador are disadvantaged compared to the total population in the country, which has a net enrolment ratio in primary education of 0.89. In terms of youth literacy, no relative deprivation can be observed for refugees/asylum seekers. Here, other non-refugee Colombian youth demonstrate a somewhat lower literacy level.

26 Chapter 4
Table 4.2. Selected indicators related to MDG 2, by population and country Country Population RAI Non-RAI National 6. Net enrolment ratio in primary education1 Armenia 0.99 1.00 -- Ecuador 0.77 0.79 0.89 Sri Lanka 0.96 0.90 0.96 7. Proportion of pupils starting grade 1 who reach grade 52 Armenia 86 100 -- Ecuador -- -- 78 Sri Lanka 92 83 98 8. Literacy rate of 15-24 year-olds Armenia 96% 98% 100% Ecuador 86% 78% 87% Sri Lanka 97% 97% 96%
1 Figures are based on school attendance. 2 In absence of cohort data, the share of children at the end of the primary school age range that completed primary school is taken as a proxy.
For Sri Lanka, a surprising finding is that net enrolment for IDP children is higher than for non-IDP children (96 versus 90%). This is possibly because many IDP communities have schools specifically provided for their use, and so access may in fact be better in some respects for IDPs than for non-IDPs, especially when the IDPs are located in long-established IDP communities. This picture does not emerge when we look at youth literacy. Here, levels of IDPs, non-IDPs and the national population are consequently high.
4.3. MDG 3: promote gender equality and empower women
Given the fact that primary school enrolment and literacy in the Armenian population aged 15-24 is almost universal, sex ratios close to 100 could be expected for the education and literacy indicators in this country. The significant deviations from this expectation in the refugee population —shown in table 4.3— are probably related to the overrepresentation of women in the survey sample (see table 2.2). This effect could also contribute to the explanation of the very high ratio of literate women to men in the non-refugee population (185). However, no explanation can be offered for the low education-related indicators for this group, except that of relatively small sample size.
How do differences in living conditions compare across countries? 27
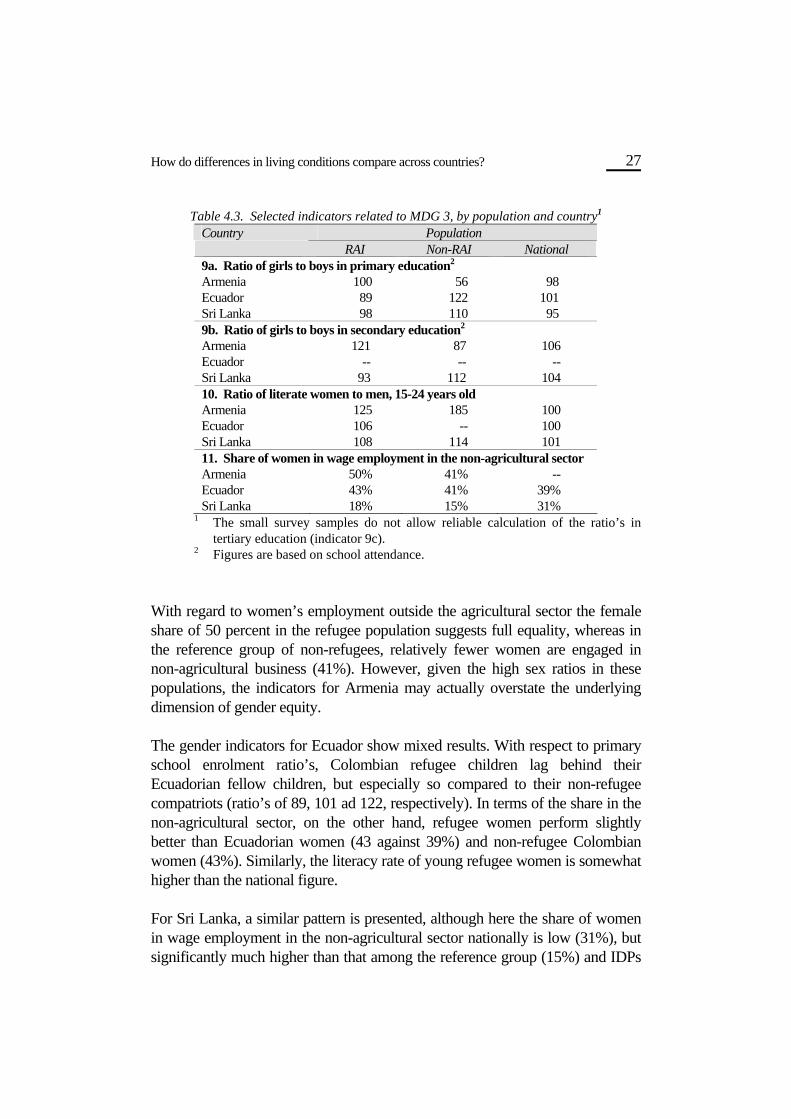
Table 4.3. Selected indicators related to MDG 3, by population and country1 Country Population RAI Non-RAI National 9a. Ratio of girls to boys in primary education2 Armenia 100 56 98 Ecuador 89 122 101 Sri Lanka 98 110 95 9b. Ratio of girls to boys in secondary education2 Armenia 121 87 106 Ecuador -- -- -- Sri Lanka 93 112 104 10. Ratio of literate women to men, 15-24 years old Armenia 125 185 100 Ecuador 106 -- 100 Sri Lanka 108 114 101 11. Share of women in wage employment in the non-agricultural sector Armenia 50% 41% -- Ecuador 43% 41% 39% Sri Lanka 18% 15% 31%
1 The small survey samples do not allow reliable calculation of the ratio’s in tertiary education (indicator 9c).
2 Figures are based on school attendance. With regard to women’s employment outside the agricultural sector the female share of 50 percent in the refugee population suggests full equality, whereas in the reference group of non-refugees, relatively fewer women are engaged in non-agricultural business (41%). However, given the high sex ratios in these populations, the indicators for Armenia may actually overstate the underlying dimension of gender equity.
The gender indicators for Ecuador show mixed results. With respect to primary school enrolment ratio’s, Colombian refugee children lag behind their Ecuadorian fellow children, but especially so compared to their non-refugee compatriots (ratio’s of 89, 101 ad 122, respectively). In terms of the share in the non-agricultural sector, on the other hand, refugee women perform slightly better than Ecuadorian women (43 against 39%) and non-refugee Colombian women (43%). Similarly, the literacy rate of young refugee women is somewhat higher than the national figure. For Sri Lanka, a similar pattern is presented, although here the share of women in wage employment in the non-agricultural sector nationally is low (31%), but significantly much higher than that among the reference group (15%) and IDPs

28 Chapter 4
(18%). This indicated the relatively poor position of IDP and non-IDP women on the labour market in the surveyed districts. In primary as well as secondary education girls outnumber boys in the reference group of non-IDPs (ratios of 110 and 112, respectively), which is higher than the national figures. IDP girls seem more disadvantaged compared to their immediate neighbouring non-IDP sisters (ratios of 98 and 93, respectively).
4.4. MDG 4: reduce child mortality
Small numbers of observations hamper a reliable assessment of the effectiveness of measles immunisation, but as far as the data in table 4.4 can be interpreted, it does appear that RAI children in Ecuador and Sri Lanka are disadvantaged in terms of vaccination rates compared to the comparison groups in these countries, but not so much compared to the total population. Fore Armenia, no conclusions should be drawn due to the small number of observations.
4.5. MDG 5: improve maternal health
Equity for RAI populations in terms of proportions of births attended by skilled health personnel seems to be achieved are nearly achieved in all three survey countries (table 4.5). The indicators for Colombian women in Ecuador (98 and 93%) even suggest better delivery conditions than those for Ecuador women generally (74%). It is outside the scope of this report to assess whether this reflects the delivery history before or after arrival in Ecuador. In Sri Lanka, IDP women appeared to depend somewhat less on doctors than on nurses during delivery and pregnancy (see the country report).
Table 4.4. Selected indicators related to MDG 4, by population and country Country Population RAI Non-RAI National 15. Proportion of 1 year-old children immunised against measles Armenia (50%/77%)1 (67%) 94% Ecuador 90%2 95%2 75% Sri Lanka 85% 95% 88%
1 Immunisation rates for children aged 0-11 and 12-23 months, respectively. 2 Based on 1-5 year-old children.
How do differences in living conditions compare across countries? 29
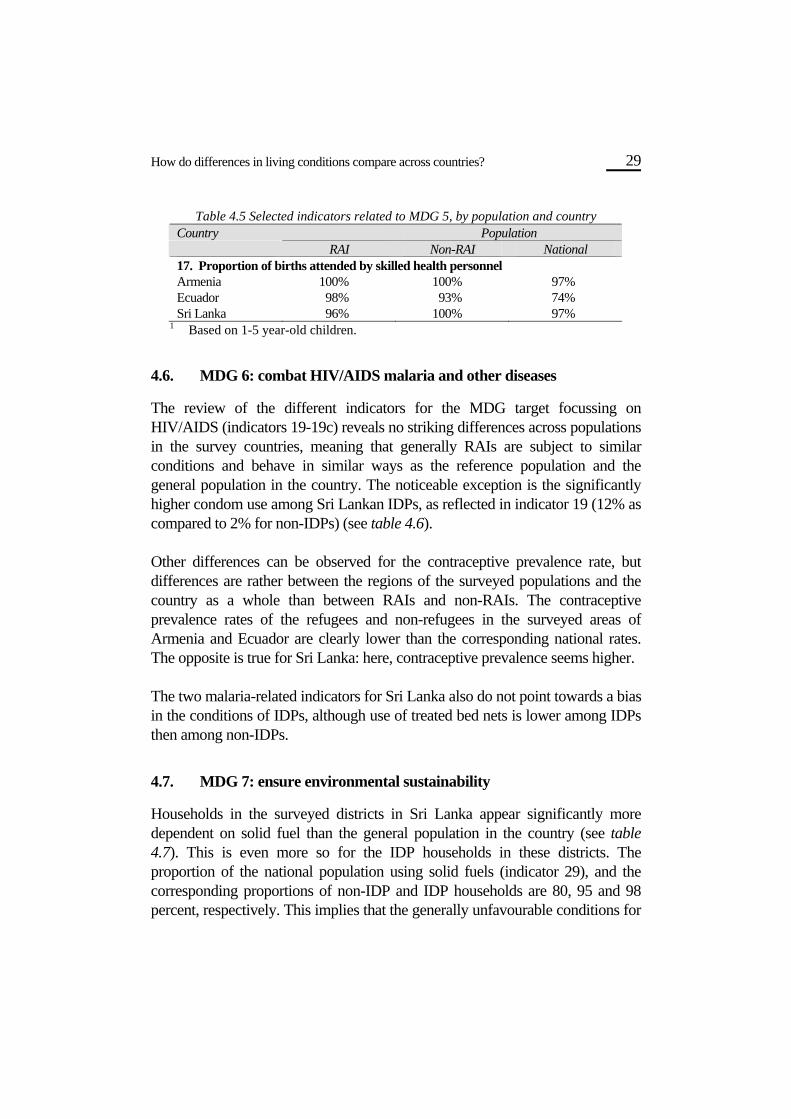
Table 4.5 Selected indicators related to MDG 5, by population and country Country Population RAI Non-RAI National 17. Proportion of births attended by skilled health personnel Armenia 100% 100% 97% Ecuador 98% 93% 74% Sri Lanka 96% 100% 97%
1 Based on 1-5 year-old children.
4.6. MDG 6: combat HIV/AIDS malaria and other diseases
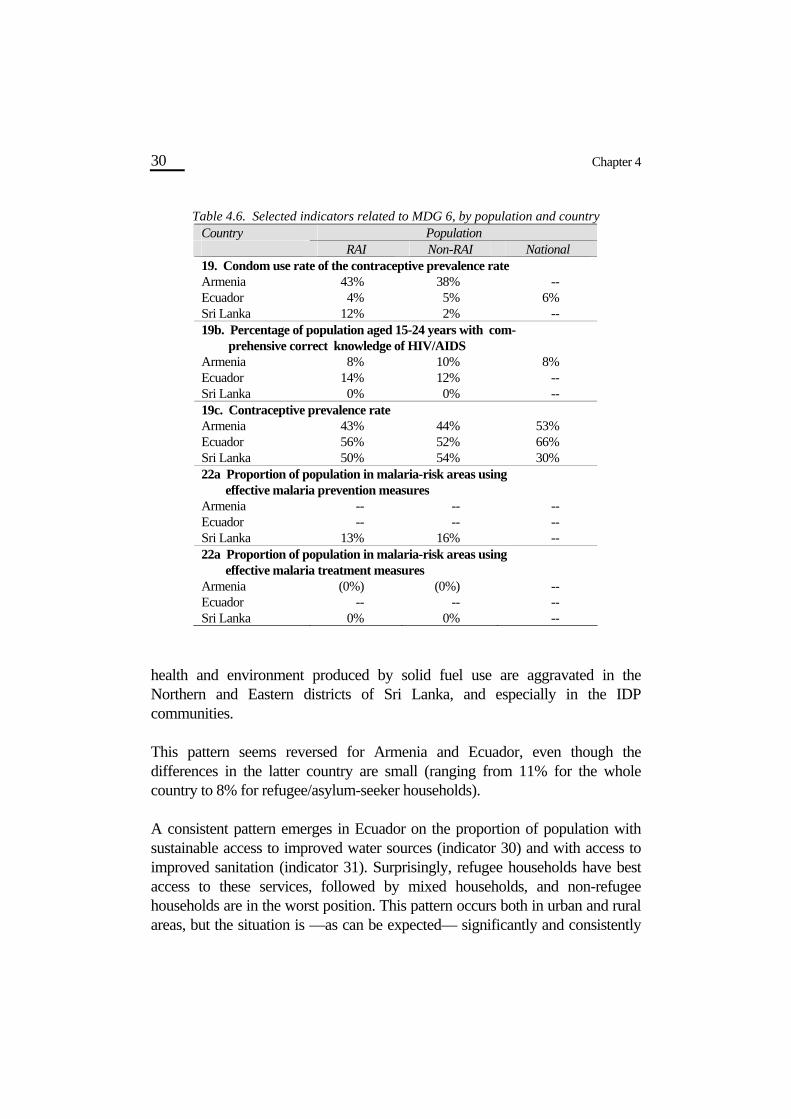
The review of the different indicators for the MDG target focussing on HIV/AIDS (indicators 19-19c) reveals no striking differences across populations in the survey countries, meaning that generally RAIs are subject to similar conditions and behave in similar ways as the reference population and the general population in the country. The noticeable exception is the significantly higher condom use among Sri Lankan IDPs, as reflected in indicator 19 (12% as compared to 2% for non-IDPs) (see table 4.6). Other differences can be observed for the contraceptive prevalence rate, but differences are rather between the regions of the surveyed populations and the country as a whole than between RAIs and non-RAIs. The contraceptive prevalence rates of the refugees and non-refugees in the surveyed areas of Armenia and Ecuador are clearly lower than the corresponding national rates. The opposite is true for Sri Lanka: here, contraceptive prevalence seems higher. The two malaria-related indicators for Sri Lanka also do not point towards a bias in the conditions of IDPs, although use of treated bed nets is lower among IDPs then among non-IDPs.
4.7. MDG 7: ensure environmental sustainability
Households in the surveyed districts in Sri Lanka appear significantly more dependent on solid fuel than the general population in the country (see table 4.7). This is even more so for the IDP households in these districts. The proportion of the national population using solid fuels (indicator 29), and the corresponding proportions of non-IDP and IDP households are 80, 95 and 98 percent, respectively. This implies that the generally unfavourable conditions for
30 Chapter 4
Table 4.6. Selected indicators related to MDG 6, by population and country Country Population RAI Non-RAI National 19. Condom use rate of the contraceptive prevalence rate Armenia 43% 38% -- Ecuador 4% 5% 6% Sri Lanka 12% 2% -- 19b. Percentage of population aged 15-24 years with com- prehensive correct knowledge of HIV/AIDS Armenia 8% 10% 8% Ecuador 14% 12% -- Sri Lanka 0% 0% -- 19c. Contraceptive prevalence rate Armenia 43% 44% 53% Ecuador 56% 52% 66% Sri Lanka 50% 54% 30% 22a Proportion of population in malaria-risk areas using effective malaria prevention measures Armenia -- -- -- Ecuador -- -- -- Sri Lanka 13% 16% -- 22a Proportion of population in malaria-risk areas using effective malaria treatment measures Armenia (0%) (0%) -- Ecuador -- -- -- Sri Lanka 0% 0% --
health and environment produced by solid fuel use are aggravated in the Northern and Eastern districts of Sri Lanka, and especially in the IDP communities. This pattern seems reversed for Armenia and Ecuador, even though the differences in the latter country are small (ranging from 11% for the whole country to 8% for refugee/asylum-seeker households). A consistent pattern emerges in Ecuador on the proportion of population with sustainable access to improved water sources (indicator 30) and with access to improved sanitation (indicator 31). Surprisingly, refugee households have best access to these services, followed by mixed households, and non-refugee households are in the worst position. This pattern occurs both in urban and rural areas, but the situation is —as can be expected— significantly and consistently

How do differences in living conditions compare across countries? 31
Table 4.7. Selected indicators related to MDG 7, by population and country Country Population RAI Mixed Non-RAI National 29 Proportion of population using solid fuels Armenia 60% 67% 74% -- Ecuador 8% 9% 10% 11% Sri Lanka 98% 95% 80% 30a Proportion of population with sustainable access to an improved water source (urban) Armenia 82% 90% 94% 99% Ecuador 98% 96% 82% 92% Sri Lanka 96% 97% 75% 30b Proportion of population with sustainable access to an improved water source (rural) Armenia 72% 72% 71% 99% Ecuador 56% 50% 33% 77% Sri Lanka 78% 87% >92% 31a Proportion of population with access to improved sanitation (urban) Armenia 89% 90% 64% 96% Ecuador 94% 88% 64% 80% Sri Lanka 94% 93% 98% 31b Proportion of population with access to improved sanitation (rural) Armenia 70% 70% 76% 61% Ecuador 66% 65% 61% 59% Sri Lanka 66% 95% 89% 32 Proportion of households with access to secure tenure1 Armenia 78% 76% 77% -- Ecuador 2% 4% 18% -- Sri Lanka 52% 85% 95%
1 Figures are based on ownership of dwelling. better in the urban areas. The presented figures for urban households with refugees favourably compare to the national coverage levels for adequate water supply and sanitation (98/96 and 94/88% against 92 and 80%, respectively). In rural areas no consisted differences emerge. The living conditions measured by these two indicators hardly differentiate between IDPs and non-IDPs in surveyed urban areas of Sri Lanka. The proportions with adequate access to water and sanitation are high, respectively 96 and 97 percent for the water-related indicator and 93 to 94 percent for the sanitation-related indicator. However, in rural areas, the situation is significantly worse for IDP households, especially with regard to sanitation (95 against 66%

32 Chapter 4
with appropriate access). The national figures indicate higher access rates than the district rates measured in the MDG survey. With respect to the last indicator for this MDG —the proportion of urban households with access to secure tenure (indicator 32)— large differences occur between the populations in Ecuador. Whereas 18 percent of urban non-refugee households own their house, this is only 4 percent for mixed households and just 2 percent for refugee households. Corresponding figures for rural areas are 12, 26 and 28 percent, respectively (figures not shown). Thus, secure tenancy depends powerfully on both whether one lives in a refugee household or not and whether one lives in rural or urban areas. This is not surprising as one would expect refugees to live in less secure housing conditions than non-refugees. Similarly, in Sri Lanka, IDPs are much less likely to own their homes than the reference group of non-IDPs (52 against 85%). This is not surprising as the former have been forcibly relocated from their original homes. Nationally, the tenancy situation is even better (95%). Additional survey data reveal that non-IDP housing quality is also better in almost all respects compared with their IDP neighbours. IDP dwellings are more likely to have earth or sand as the floor material and less likely to use cement or ceramic tiles (see the Sri Lanka country report). The inferior housing stock of IDPs may indicate the extent to which displacement probably means a considerable downward shift in physical circumstances for most IDPs. The water- and sanitation related indicators do not reveal structural patterns for the different populations in Armenia, except that by and large refugee- and non-refugee access measurements fairly resemble each other, and that national figures tend to be higher than the ones for the surveyed Syunik province. Possible outliers are the relatively poor position on sanitation of non-refugee households in urban areas and the relatively poor situation on access to water by urban refugee households.
4.8. MDG 8: develop a global partnership for development
Of the three surveyed countries, only in Ecuador unemployment rates for youth (those aged 15-24) are higher for RAIs than for non-RAIs. National data show that rates for the total population in the country are similar to those of non-RAIs. In Armenia, on the other hand, unemployment rates are more favourable for refugees than for non-refugees (83 and 88%, respectively for men and women combined — indicator 45c). In Sri

How do differences in living conditions compare across countries? 33
Lanka, the difference between IDPs and non-IDPs is most marked: the unemployment rate for the former is 43 percent, compared to 73 percent for the latter. The explanation for this largely sought in the fact that a much smaller percentage of the IDP population is economically active and many are not seeking work. Male and female youth patterns for unemployment rates compare to the combined population. Table 4.8. Selected indicators related to MDG 8, by population and country
Country Population RAI Mixed Non-RAI National 45a Unemployment rate of young males aged 15-24 years Armenia 80% 82% -- Ecuador 25% 14% 13% Sri Lanka 29% 57% -- 45b Unemployment rate of young females aged 15-24 years Armenia 91% 94% -- Ecuador 33% 23% 21% Sri Lanka 65% 95% -- 45c Unemployment rate of young people aged 15-24 years, total Armenia 83% 88% -- Ecuador 29% 19% 16% Sri Lanka 43% 73% -- 47 Telephone lines and cellular subscribers per 100 population Armenia 3% 5% 16% 16% Ecuador >40% >37% >36% 23% Sri Lanka 11% 47% 10% 48a Personal computers in use per 100 population Armenia 0% 1% 1% 2% Ecuador 1% 3% 7% 3% Sri Lanka 1% 2% 1% 48b Internet users per 100 population Armenia 4% 4% 10% 2% Ecuador 12% 12% 4% Sri Lanka 9% 13% 1%
With respect to MDG indicators for information and communication technology, for most indicators and in most countries, RAI populations are in disadvantaged positions compared to non-RAI populations (indicators 47, 48a and 48b). Rapid advancements in the spread of new technologies may explain that the recent survey data mostly find higher figures than the national indicators.


5. Summary and recommendations
The aim of this study is to assess the living conditions of peoples to the concern of UNHCR in four countries: refugees in Pakistan and Armenia9, asylum-seekers and refugees in Ecuador and Internally Displaced Persons (IDPs) in Sri Lanka. The generic acronym ‘RAI’ is used to the combined group of refugees, asylum seekers and IDPs. The Millennium Development Goals (MDG) that presently guide the international development agenda are used for the methodological approach for this study. The internationally agreed MDG framework identifies key areas of development and a large number of quantitative indicators and sub-indicators to monitor progress in these areas. The nature of the MDG indicators allows the comparative analysis of RAI populations. For the purpose of this study a specific survey instrument was developed, covering 29 MDG indicators and sub-indicators for which data collection at household level was relevant and feasible. Surveys were conducted in the first half year of 2006 in Sri Lanka, Armenia and Ecuador, including 1,064, 864 and 499 households respectively. The survey samples comprised RAIs and a reference group for comparison purposes. The survey information on RAIs is representative at the level of selected districts or provinces where the surveys were conducted. In addition, limited MDG information was drawn from a 2002 nationally representative survey in Pakistan that addressed issues relevant to the return of Afghan refugees. In the framework of this study, four country reports have been produced that assess the country-specific living conditions of RAIs in terms of MDG indicators. They also include information about additional socio-economic and demographic characteristics, gender perspectives, migration and displacement histories, specific problems faced by RAIs, coping behaviour and assistance received. The present summary report adopts a cross-country comparative perspective and compares the demographic profiles of the RAI populations, their position on MDG indicators and their MDG situation vis-á-vis the surveyed comparison population and national MDG indicators, i.e. the relative deprivation.
9 In this report, Armenian refugees include people with a refugee status and naturalised
former refugees.
36 Chapter 5
In terms of the demographic structure of the populations under study, the Armenian refugee population10, and to a lesser extent the control group in Armenia, distinguishes itself by having a relatively old population. On the other hand, the RAI populations in Pakistan and Ecuador are characterised by large shares of under-fifteens (around 45%). The 0-15 age group among IDPs in Sri Lanka is considerably smaller (35%). The differences in age distribution partly explain the differences in the populations’ sex ratio and marital status distribution. Striking differences are found with respect to the distribution by sex. For Armenian and Sri Lankan RAIs, respectively a large and a modest over-representation of women is found (141 and 106 women per 100 men); refugees in Pakistan and Ecuador have, respectively a strong and a moderate male bias (84 and 93 women per 100 men). The sex ratio’s in the benchmark populations considerably deviate from these figures. In terms of marital status, more than one in three adult refugee women in Armenia is single after a marital break-up due to widowhood, separation or divorce. A considerable share (19%) of refugee women in Ecuador live in the same situation, whereas this proportion is almost negligible in Pakistan (4%). With regard to household characteristics, average RAI households in Armenia are small (less than 2 persons) and usually female-headed, whereas those in Pakistan count nearly 10 persons on average and are almost exclusively male-headed. In Ecuador and Sri Lanka, mean household size is around four persons. As could be expected, households accommodating RAIs and non-RAIs are larger than households with only RAIs. It can generally be observed that RAI households include more dependants than non RAI households. In Pakistan, Ecuador and Sri Lanka, this is almost exclusively due to children under 15, in Armenia there is a considerable share of 65+ persons. The review of the living conditions of RAI populations in the countries covered by the surveys presents a varied picture. Relatively favourable conditions in one development domain are offset by disadvantages in others. Nevertheless, certain patterns emerge upon closer examination of the MDG indicators and sub-indicators.
10 Including naturalised refugees and children of refugees that obtained Armenian
citizenship at birth.
Summary and recommendations 37
It is apparent that sheer poverty occurs less among refugees in Armenia than among RAIs in Sri Lanka and Ecuador. Despite due caution in the interpretation of income-related indicators, the large differences found between the countries may present evidence for this. For example, survey figures suggest that more than half the RAI population in Ecuador and Sri Lanka live on less than one US$ 1 a day, whereas this is less than one in five persons in Armenia. The extremely poor tenancy conditions for Colombian refugees/asylum seekers in Ecuador, and the better, but still weak position of IDPs in Sri Lanka in this respect may support the idea that many live in conditions of poverty and physical and environmental deprivation. RAI households own their homes in only 2 percent of the cases in Ecuador, in around half of the cases in Sri Lanka and in 78 percent of the cases in Armenia. Certainly, the poor nutritional status of children flags the poverty situation of IDP households in the Northern and Eastern districts of Sri Lanka. According to anthropometric measures, no less than 41 percent of under-five children can be considered underweight and malnourished. In Armenia, the corresponding figure is 18 percent. Survey information also indicates serious food security problems for the refugee/asylum seeker population in Ecuador. Combined with employment indicators and perception questions on future economic prospects, careful interpretation might suggest that IDPs in Sri Lanka, more than their RAI counterparts in Ecuador and Armenia, feel being caught in a poverty trap and see less opportunity for economic improvement. Education is an area where government programmes in Sri Lanka affected the situation of IDPs quite well. Indicators on primary school enrolment (96%), primary school drop out (8%) and youth literacy (97%) are satisfactory, even though further improvements are possible. The favourable educational climate in Sri Lanka has also positive impact on gender equality: female school attendance and literacy of IDP girls are comparable or even higher than that of their male counterparts. This situation is completely different in Pakistan, where educational performance indicators are very poor (11% enrolment in primary school, 59% primary school drop outs, 57% illiterate youth), and girls and women in the refugee population are clearly disadvantaged compared to boys and men. In terms of education and gender, however, Armenian refugees have the best position with almost universal primary school attendance and literacy among 15-24 year olds, as well as sex ratios in schools and for literacy that are in balance or even favour women and girls. Education programmes in Ecuador seem less effective than those in Armenia and Sri Lanka in reaching the refugee population, especially with respect to girls. Only 77 percent of primary school
38 Chapter 5
age children attend school, and there is a deficit of 11 girls for every 100 boys attending school. On the other hand, youth literacy (86%) and the sex ratio of youth literacy (106 females for 100 males) are comparable to the levels in Sri Lanka. Also in terms of engagement in the non-agricultural sector, with a share of 50 percent refugee women do as good as men in Armenia, although the large female surplus in the refugee population should put this in a proper perspective. With 43 percent refugee women employed in industry and service sectors the economic gender dimension in Ecuador should be more or less on par with Armenia. This relative equality is far from being realised in Pakistan and Sri Lanka (8 and 18% women in the non-agricultural sector only), which indicates a poor female integration in the monetary economy. With respect to health-related indicators, the three MDG survey countries have rather similar profiles. Levels of immunisation against measles and skilled birth attendance are consistently high, and the contraceptive prevalence rates are also comparable, although somewhat higher in Ecuador than in Ecuador and Sri Lanka. The low levels of correct and comprehensive knowledge about HIV/AIDS (all below 15%) are worrisome, even though HIV/AIDS is not a major health issue in any of the countries and many seem to have a fair understanding of ways of preventing the transmission of HIV. Other health-related indicators on condom use rates and measures for malaria prevention and treatment are less relevant for cross-country comparison, given the low HIV prevalence and different malaria conditions in the countries. There is not much difference in the living conditions of RAIs across countries —either urban or rural— in terms of basic supply of water and sanitation. If any, the situation in Sri Lanka might be slightly better. The only outlier seems to be the provision of safe drinking water to refugees/asylum seekers in rural Ecuador (53%, compared to around 75% in the other countries). Solid fuel use, on the other hand, differentiates significantly across the countries. Related negative effects of are probably much more experienced by RAIs in Sri Lanka than in Armenia, and probably hardly in Ecuador: the proportions using solid fuels among these populations are, respectively, 98, 64 and 8 percent. The access to information and communication technologies is relatively most widespread among Ecuador refugees/asylum seekers. A rapid increase in cellular phones is observed and the survey indicated that 37 percent of the
Summary and recommendations 39
households used this means of communication. In Sri Lanka and Armenia, corresponding figures are 11 and 3 percent only. Similarly, internet use is more common for RAIs in Ecuador than for those in the other two countries. Possession of personal computers is almost non-existent in any refugee situation. With respect to the relative position of RAIs within their country of residence, the MDG indicators indicate that RAIs are underprivileged compared to non-RAIs. This is according to expectation. Relative deprivation seems lowest in Armenia, where considerable time elapsed since arrival of the refugees and where government policy is directed at full integration of this population group. In Ecuador and Sri Lanka, RAIs face more obstacles for full integration in society. The legal situation of asylum seekers in Ecuador may hamper the employment of effective strategies for improvement of living conditions in certain areas and in Sri Lanka, many IDPs might be trapped in a blind-ally situation of an enduring conflict and few opportunities for improvement. Comparison of the percentage of the population living on less that US$ 1 a day is unreliable, especially if figures based on the MDG survey are compared with national figures based on other data sources. However, the emerging picture is in the expected direction of relative deprivation of RAIs compared to non-RAIs nationally and the control group. The more reliable figures on the nutritional status of children indicate the same. Both show larger poverty and malnutrition gaps in Sri Lanka than in Armenia. The same picture emerges if the proportion of households with secure tenure is taken into account, but here the relative situation for RAIs in Ecuador is even worse than in Sri Lanka. Similarly, the largest gaps for youth unemployment are observed in Ecuador and Sri Lanka. In terms of primary school enrolment, IDP children in Sri Lanka do surprisingly well, possibly because specially provided schools in IDP communities. Their school attendance is comparable to the national level and even higher than that of their neighbouring non-IDPs. The difference between school attendance of refugee/asylum seeking children and that of children in the total Ecuador population is significant (77 and 89%, respectively). With regard to youth literacy in these countries the situation for RAIs is similar to the national population. The gender equality indicators based on literacy and education do not reveal a consistent pattern of relative deprivation in any of the three countries. With
40 Chapter 5
regard to integration in employment in the non-agricultural sector, IDP women in Sri Lanka are clearly more subordinated than men nationally (shares of women and men working in this sector are 18 and 31%, respectively). This is not the case for Ecuador and Armenia. However, a similar subordinate position is found for non-IDP women in the surveyed districts of Sri Lanka, which might indicate that the employment bias is rather related to regional differences than to the position of IDPs. As far as health-related indicators are concerned, IDPs in Sri Lanka seem not disadvantaged compared to the total population, but they are less served than their fellow district residents. This applies to measles immunisation, skilled birth attendance and contraceptive use. Colombian refugee women are more likely to have had skilled birth personnel attending deliveries than Ecuador women in general, but it is not clear whether this reflects the situation prior to or after arrival in Ecuador. On the other hand, their contraceptive prevalence rate is below the national figure, a pattern also found in Armenia. Hardly any disparities between IDPs and non-IDPs are found with respect to HIV/AIDS knowledge in the respective countries. The situation with regard to water and sanitation facilities does not produce a consistent pattern across counties. If we combine urban and rural areas, RAIs in Armenia and Ecuador seem relatively more deprived of access to improved water supply compared to the total population. For sanitation in general Sri Lankan IDPs are more disadvantaged, whereas RAIs in Armenia and Ecuador have better sanitation conditions than the respective populations as a whole. However, if we differentiate by urban-rural residence, the in-country relative position of RAI groups is diverse. With regard to use of modern information and communication technology, the difference between RAIs and non-RAIs is generally the largest in Sri Lanka and the smallest in Ecuador, but always in favour of non-RAIs. The MDG indicator assessment and the comparison of living conditions of RAIs and non-RAIs in and across countries on the basis of these objective and internationally accepted development criteria, reflect the extent to which RAI populations are disadvantaged in terms of resources, access to services and support. This analysis may support decision making by governments, NGOs and international development agencies for priority and target setting support programmes. The MDG analysis clearly indicates that the different countries proceed at different speeds towards the realisation of the MDGs. An evaluation
Summary and recommendations 41
of their progress on the various MDG indicators and identification of priority areas is beyond the scope of the present study. However, the comparative approach does allow the identification of specific areas that require attention from the government or aid agencies if equity is to be achieved between RAIs and the general population in the country. The MDG analysis indicates that for IDPs in Sri Lanka special attention is required for the food security situation (in particular that of children), employment and economic opportunities (in particular for women), secure tenancy and rural sanitation. For Ecuador, priority areas include access to education (especially for girls) and secure tenure (both possibly well served if asylum seekers are provided with access to legal documents), food security and information on and access to contraceptive methods. Finally, the disadvantaged position of refugees in Armenia is particularly evident for supply of safe drinking water, both in urban and rural areas, and information on and access to contraceptive methods. In all countries, RAIs are relatively underprivileged in terms of improved water supply in rural areas, telephone use and access to the internet. It is worth mentioning that the MDG surveys in Armenia, Ecuador and Sri Lanka produced a wealth of information that is only partly tapped by this report and the country reports. Additional, in-depth analysis may produce information of prime interest to governments and aid agencies. This relates, for example, to understanding better the problems faced by RAIs, coping behaviours, and analysis of specific vulnerable groups, such as children, adolescents, women and the elderly. In a broader context, the development of the MDG survey instruments may facilitate comparable studies in other settings. The experience gained in the surveyed countries allows the further development of focused survey instruments that would permit rapid MDG assessments in targeted populations.

References
Exterkate, M. (2002), A profile of Afghan refugees in Pakistan and their intentions to return. Research report on results of a rapid survey conducted between February and May 2002 for the United Nations High Commissioner for Refugees. The Hague, NIDI.
Groenewold, G. and J. Schoorl (2006), The living conditions of refugees in Armenia: millennium Development Indicators and coping behaviour. Country report. The Hague, NIDI.
Groenewold, G. (2006), Living conditions of Afghan refugees in Pakistan: millennium Development Indicators and coping behaviour. Country report. The Hague, NIDI.
HPRA (2006), The living situation of refugees, asylum-seekers and IDP’s in Armenia, Ecuador and Sri Lanka: millennium development indicators and coping strategies. Sri Lanka country report. Colombo, HPRA.
Bilsborrow, R.E. and CEPAR (2006), The living conditions of refugees, asylum-seekers and other Colombian migrants in Ecuador: millennium Development Indicators and coping behaviour. Ecuador country report. Chapel Hill, Carolina Population Centre, University of North Carolina.
UNDP (2005), Human Development Report 2005. New York, UNDP. NSS, Ministry of Health and ORC Macro (2006), Armenia Demographic and Health Survey
2005. Preliminary report. Calverton, Maryland, USA.