mill operators’ conference 2018 - panaust.com.au mill optimisation and... · in 2012, a second...
TRANSCRIPT

1
Mill Operators’ Conference 2018
Paper Number: 13
SAG Mill Optimisation and Increasing Throughput at
the Phu Kham Copper-Gold Operation – A Success
Story
Rajiv Chandramohan1, Robert Braun2, Greg Lane3, Kirsty Hollis4, Johnson Le5, Dirk Baas6 1. MAusIMM, Principal Consultant, Ausenco, [email protected] 2. MAusIMM, Principal Process Engineer, Ausenco, [email protected] 3. FAusIMM, Chief Technical Officer, Ausenco, [email protected] 4. FAusIMM, Process Manager, Phu Bia Mining Limited, [email protected] 5. MAusIMM, Metallurgical Superintendent, Phu Bia Mining Limited, [email protected] 6. MAusIMM, Senior Process Control Specialist, PanAust Limited, [email protected]

2
ABSTRACT
The Phu Kham Copper-Gold Operation (Phu Kham) is located in northern Laos, approximately 140 kilometres from the capital, Vientiane. The Operation is a producing asset for Australian-based copper and gold producer, PanAust Limited (PanAust) and is operated by Lao-registered company, Phu Bia Mining Limited (Phu Bia Mining). PanAust hold a 90 % interest in Phu Bia Mining. The Government of Laos own the remaining 10 %.
The Phu Kham Operation has recently undergone a series of process improvements to treat the anticipated competent ores scheduled for 2017 and 2018. The Operation’s comminution circuit, which comprises of a semi-autogenous (SAG) mill and two ball mills, each with 13 megawatts (MW) of installed power, was expected to be SAG mill limited when treating competent basement rock.
Ausenco Services Pty Ltd (Ausenco), was engaged to help optimise and enhance the productivity of the Phu Kham comminution circuit over an eight-month period. The work involved participating in and overseeing the redesign of the SAG mill liner systems and developing operational strategies for maximising throughput through to the end of mine life.
Ausenco’s comminution optimisation tool, Ausgrind, was used to benchmark and analyse plant data with empirical models, predict circuit performance for varying ore characteristics and evaluate liner wear and predict the life of varying operating parameters. Variances between the actual and the predicted values were assessed in detail to identify missed opportunities, and guiding operating parameters were redefined to maximise throughput and productivity.
In combination with the redesigned liner system, optimised process controls for varying ore competencies, and improved operational practices and troubleshooting strategies, increased Phu Kham overall production, exceeding the milling capacity when treating competent ores.
INTRODUCTION
The Phu Kham Copper-Gold Operation (Phu Kham) is owned and operated by Phu Bia Mining Limited (PBM). PanAust Limited, based in Brisbane Australia, holds a 90 % interest in PBM. The Government of Laos hold the remaining 10 %. Phu Kham concentrator is considered to the have the lowest capital cost per tonne of copper produced (Lane & Dickie 2009), is located in mountainous terrain in central Laos, approximately 140 kilometres northeast of the capital, Vientiane. The original Phu Kham concentrator was commissioned in 2008 with a nameplate production capacity of 12 million tonnes per annum (Mtpa). At the time of construction, Phu Kham was considered a very cost-effective design (Lane & Dickie, 2009).
The geology of the Phu Kham deposit is highly variable due to weathering, alteration, faulting and folding. The deposit is classified into three main ore types: skarn, diorite and tuff. Classifications are based on mineralisation, lithology, alteration and coarse-ore competencies which consists of variable densities that can range between 2.6 t/m3 for the quartz-rich mineralisation to 4.0 t/m3 for magnetite-rich mineralisation. In combination with variable densities and coarse-ore-competencies, the SAG mill feed rates vary significantly due to operating conditions and metallurgical parameters.
The original Phu Kham grinding circuit comprised of a SAG and a ball mill in SAB flowsheet arrangement, each with 13 MW of installed motor power. The circuit targeted a cyclone overflow grind size of 106 um and an average flotation recovery of 85 %. In 2012, a second ball mill and additional flotation capacity were commissioned, increasing the Phu Kham milling capacity to 18Mtpa and later to 19Mtpa with further upgrades to cleaner flotation and regrind circuits for the treatment of friable and softer ores, (Bennett et al. 2012). Phu Kham’s historical throughput and copper recovery performances are highlighted in FIG 1

3
FIG 1 – Phu Kham’s historical throughput and copper recovery performance
In late 2016, the Operation experienced considerable throughput constraints due to the treatment of competent ores (higher proportion of skarn and diorite in feed). Review of the geology and the life of mine ore sources indicated that the overall feed competency will increase with significant proportions of the skarn and diorites from 2017 to 2019. An earlier analysis of the Operation indicated that grinding circuit throughput was limited by the SAG mill – the main constraint attributable to the operable speed ranges post reline, that reduced the maximum power draw well below the installed power. Typically, at startup post SAG mill reline, the maximum operable speed ranges are reduced to minimise direct shell impacts due to the steeper face angle of the lifters. This operational approach severely limits available power draw by the mill to maintain higher throughputs for competent ores. This was seen by PBM as lost opportunity maintaining annual production targets. An operational strategy was undertaken by PBM to de-risk the throughput constraint by redesigning the SAG mill liner system to optimise the Phu Kham comminution circuit for the competent future ores.
PROJECT SCOPE AND OBJECTIVE
Ausenco Services Pty Ltd (Ausenco) was engaged from late-November 2016 to provide comminution consulting and optimisation services, specifically to:
• review six vendor-supplied SAG mill liner designs with an objective to maximise instantaneous feed rates and maximise liner life
• provide comminution optimisation strategies to reconfigure the circuit operations for competent feed.
Ausenco’s optimisation strategy (shown in FIG 2) focuses on the key objectives of mining production by providing bespoke solutions to suit the specific requirements and problems or issues at the site. At Phu Kham, the main objective of the optimisation exercise was to increase production through improvements to SAG mill liner design and operations. The production value-opportunity can be defined by four key elements that increase the net-present revenue (minimise the dollar per tonne of metal produced):
• Resource definition
• Productivity
• Operational cost
• Constraints
Phu Kham’s optimisation scope excluded the resource definition and the operation cost; PBM operations defined the project NPV based on the mine plan and operational costs. Ausenco’s optimisation service scope was limited to the productivity improvement and de-constraining the Phu Kham circuit.
0
10
20
30
40
50
60
70
80
90
0
500
1000
1500
2000
2500
3000
Ave
rage
Co
pp
er R
eco
very
(%)
Ave
rage
SA
G F
ee
d R
ate
(dt/
h)
Average SAG Feed Rate (dtph) Average Copper Recovery (%)
Commissioning April 2008
Conversion of rougher conditioning
cells to flotation
Jameson cell installation
Installation of 10th rougher flotation cell
Commissioning of Ball mill 2 circuit
and installation of 5 additional rougher
flotation cells
Commissioning of IRP project
Completion of increased crusher
throughput project
Start of process optimisation
projects – flotation automation,
reagent scheme, cleaner circuit
debottlenecking
12Mtpa annualised feed rate
18Mtpa annualised feed rate
19Mtpa annualised feed rate
4
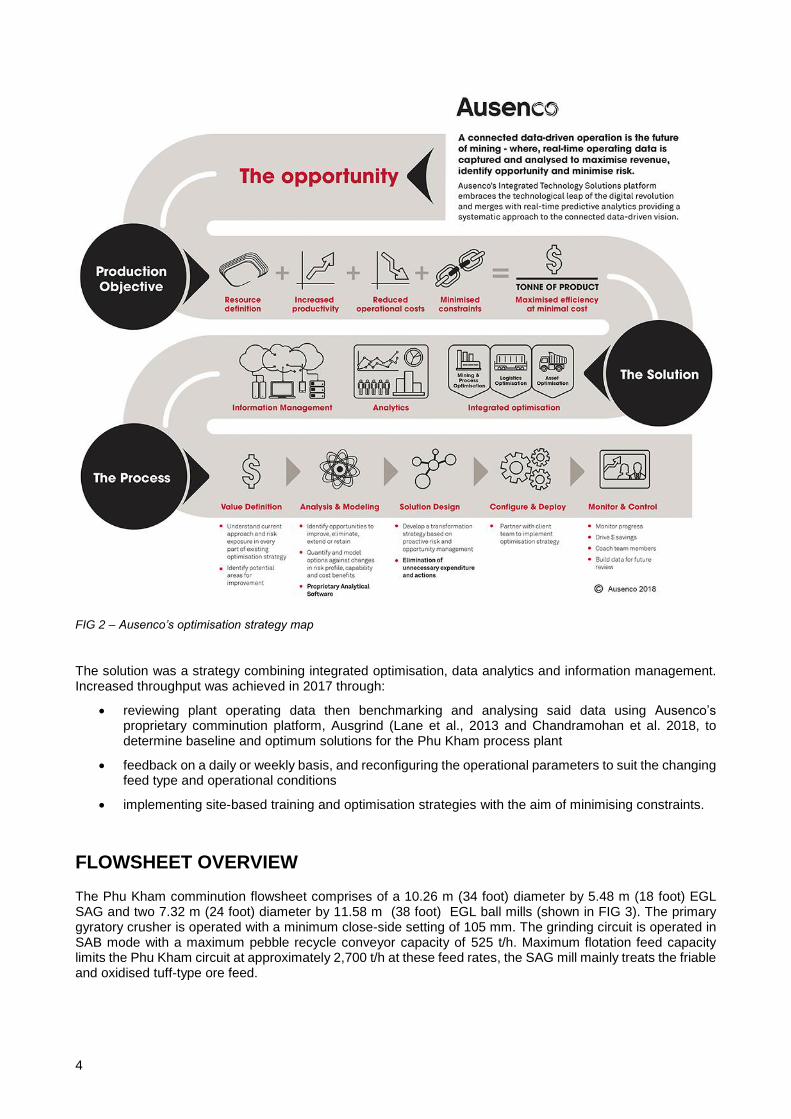
FIG 2 – Ausenco’s optimisation strategy map
The solution was a strategy combining integrated optimisation, data analytics and information management. Increased throughput was achieved in 2017 through:
• reviewing plant operating data then benchmarking and analysing said data using Ausenco’s proprietary comminution platform, Ausgrind (Lane et al., 2013 and Chandramohan et al. 2018, to determine baseline and optimum solutions for the Phu Kham process plant
• feedback on a daily or weekly basis, and reconfiguring the operational parameters to suit the changing feed type and operational conditions
• implementing site-based training and optimisation strategies with the aim of minimising constraints.
FLOWSHEET OVERVIEW
The Phu Kham comminution flowsheet comprises of a 10.26 m (34 foot) diameter by 5.48 m (18 foot) EGL SAG and two 7.32 m (24 foot) diameter by 11.58 m (38 foot) EGL ball mills (shown in FIG 3). The primary gyratory crusher is operated with a minimum close-side setting of 105 mm. The grinding circuit is operated in SAB mode with a maximum pebble recycle conveyor capacity of 525 t/h. Maximum flotation feed capacity limits the Phu Kham circuit at approximately 2,700 t/h at these feed rates, the SAG mill mainly treats the friable and oxidised tuff-type ore feed.

5
FIG 3- Phu Kham flowsheet
BASELINE CONDITIONS
Phu Kham’s historical data was evaluated to define the baseline operating conditions. Given the circuit throughput was limited by a higher proportion of competent skarn and diorite in the mill feed, the lower throughput scenarios were recorded as the baseline maximum. Additionally, recent ore characterisation test work data was also used to validate the low historical throughputs using, Ausenco’s comminution benchmarking tool, Ausgrind. Ausgrind was developed in-house by Ausenco and incorporate over 30 years of comminution data. Model outputs from this tool have been validated, benchmarked and refined over the years using actual plant data.
The baseline operating conditions and focusing areas of work for the optimisation strategy were defined as follows:
• Historical process instrumentation (PI) plant data was downloaded from the site for evaluation. Detailed annualised data was sought for evaluation using Ausenco’s benchmarking tool.
• The data were ranked from low to high throughput rates and the corresponding response from the circuit was evaluated. The SAG mill controller precursors were assessed for low and high feed rates.
• The Phu Kham SAG mill control philosophy was referred to during the PI data evaluation.
• The baseline operating conditions were then ranked based on low (<2000 t/h), medium (2000 – 2500 t/h) and high (>2500 t/h) feed rates.
FIG 4 provides an example of filtered and sorted Phu Kham SAG mill PI data. The response of the controllers was assessed based on the performance feed rate range. PI data was then benchmarked using Ausgrind calculations to verify the actual throughput performance against the theory. Variances between actual and theory were then evaluated in detail, and strategies developed to rectify the issues.

6
FIG 4 – Filtered and ranked data
The original (base case) SAG mill liners comprised of 48 rows of shell liners and radial discharge type with 25 mm grate apertures. This liner system was suitable for the low competent-friable feed but did not perform well on the harder skarn and diorite ores, particularly when the power drawn was limited by increasing mill noise at higher mill speeds, and with the onset of slurry pooling at higher flow rates. To address these issues, the following criteria was followed to select suitable SAG mill liner package:
• Maximise power drawn by increasing mill speed while minimising direct shell impacts
• Increase SAG mill availability by increasing liner life
• Reduce onset of slurry pooling at increased feed rates
As part of the liner evaluation, six vendor designs were compared, and their performances benchmarked against the base case liner system. For the SAG mill throughput performance evaluation, only shell liners and lifter profiles were used in the trajectory analysis to define the maximum operable speed ranges for the relative

7
load fillings to minimise direct shell impacts. For SAG mill flow constraints, the discharge system design was evaluated to check for the onset of slurry pooling caused by effective grate open area and discharge capacity of the pulp chamber.
Table 1 presents a summary of the liner designs compared to base case liners with six vendors designs. The new shell profile dimensions were used to predict worn profiles using Ausenco’s liner wear forecasting calculations. Maximum SAG mill operational performances were determined using new and worn liner profiles.
Table 1 – Comparing base case liner design with supplied vendor designs
New Profile Shell liners
Base case Design one
Design two
Design three
Design four
Design five
Design six
Face angle, degree 22 25 30-30 25 30 16 35
Rear angle, degree 22 9 10-10 5 23 4 10
Lifter width millimetres
354 276 380-340 278 430 380 372
Lifter height
millimetres 300 310 330-220 321 320 325 340
Liner thickness, millimetres
90 120 110 102 90 100 130
No. of lifters 48 48 24-24 48 48 48 48
Discharge system type
Radial Radial Twin-
chamber Radial Radial Radial Curved
The worn shell profiles were calculated using the wear model logic presented in FIG 5. As validation for the Phu Kham study, data from Hart et al., (2006) was used to test the wear model predictability. Newcrest Mining Limited’s Cadia SAG mill shell liner had 113 days of operation, and Ausenco’s wear model predicted 119 days using the same information presented in the paper.
The base case worn liner performance data was used as benchmark and model calibration for the wear model. The predicted worn profiles of the six liner designs were determined using the following assumptions:
• Similar volumetric loss as the base case design
• Feed rates and total tonnes milled were similar as the baseline
• All shell lifters and liners had uniform wear
• All designs were treated with ore of similar hardness, abrasion index, and feed composition
• The SAG mill drew similar power
• The SAG mill was rotating in one direction only
• Minimal changes to dimensions were applied to the lifter width and rear face angle
• All liners and lifters were made from similar steel composition
• Wear mainly affected the:
o Face angle
o Lifter height
o Liner thickness

8
FIG 5 – Liner wear model logic
Table 2 highlights the calculated worn liner plate thickness and lifter face angles using the Ausenco’s liner wear model. The model predicted worn values which were then used in Ausgrind’s trajectory calculations to determine the safest operating conditions required to maximise the power draw.
Table 2 – Estimated worn shell liner values
Worn Profile Shell liners
Base case Design one
Design two
Design three
Design four
Design five
Design six
Face angle, degree 60 54 46-60 55 58 41 57
Rear angle, degree 22 9 10-10 5 23 4 10
Lifter width, millimetres
354 276 380-340 278 430 380 372
Lifter height millimetres
130 134 143-95 139 139 141 147
Liner thickness millimetres
40 56 54 45 46 78 76
No. of lifters 48 48 24-24 48 48 48 48
LINER SELECTION METHODOLOGY
Five key criteria were applied to select the most suitable liner package for the Phu Kham SAG mill. Ausgrind’s trajectory and relative charge profiles were used to estimate the achievable maximum power draw for the corresponding toe-impact and total filling conditions (FIG 6). The Ausgrind calculation adapted MolyCop Tool’s trajectory calculations (MolyCop) - which was based on Powell’s trajectory model (Powell 1991); Morrell’s SAG mill power draw calculations (Morrell 1993 2016) and SAG mill discharge system models (Latchireddi, 2002).

9
Ausgrind’s trajectory profiles were benchmarked and validated using Miltraj (Powell 1991 and Powel et al. 2006) and discrete elements simulation software (Rocky DEM) to test the validity and accuracy of the trajectory profiles.
FIG 6 – Determining the suitable operating conditions using the Ausgrind trajectory and filling model
Ranking scores were used to categorise the six designs based on the required operating conditions and the predicted power draws. A higher weighting was applied for the instantaneous SAG mill feed rates for new liners due to the process-driven objective of maximising power draw to achieve throughput at startup. The following criteria were compared:
1. Performance at design operating conditions for new profiles: The SAG mill operated at 75 % critical speed; 15 % v/v ball charge and 28 % v/v total charge. The trajectory and relative charge profiles were used to determine the direct shell impact conditions.
2. Maximum operating conditions for new liner profiles: The SAG mill power draw was maximised by adjusting the mill speed, ball load, and rock filling such that the impact region was at the toe of the charge and the mill is drawing maximum power. The SAG mill was limited to a maximum mill speed of 80 % critical; maximum total charge filling of 28 % v/v; maximum ball load of 18 % v/v; and maximum motor utilization of 95 %
3. Maximum operating conditions for worn liner profiles: the SAG mill power draw was maximised by adjusting the mill speed, ball load, and rock filling such that the impact region is at the toe of the charge and the mill is drawing maximum power. The SAG mill was limited to a maximum mill speed of 80 % critical; maximum total charge filling of 28 % v/v; maximum ball load of 18 % v/v; and maximum motor utilization of 95 %
4. Instantaneous maximum SAG mill throughput rates based on the new and worn liner profiles: The circuit throughputs were estimated using Ausgrind’s in throughput model. The 75th percentile ore competencies and hardness values were sourced from the mine plan.
5. Circuit availability: Based on the worn life and circuit throughput rates.
PULP SYSTEM SELECTION METHODOLOGY
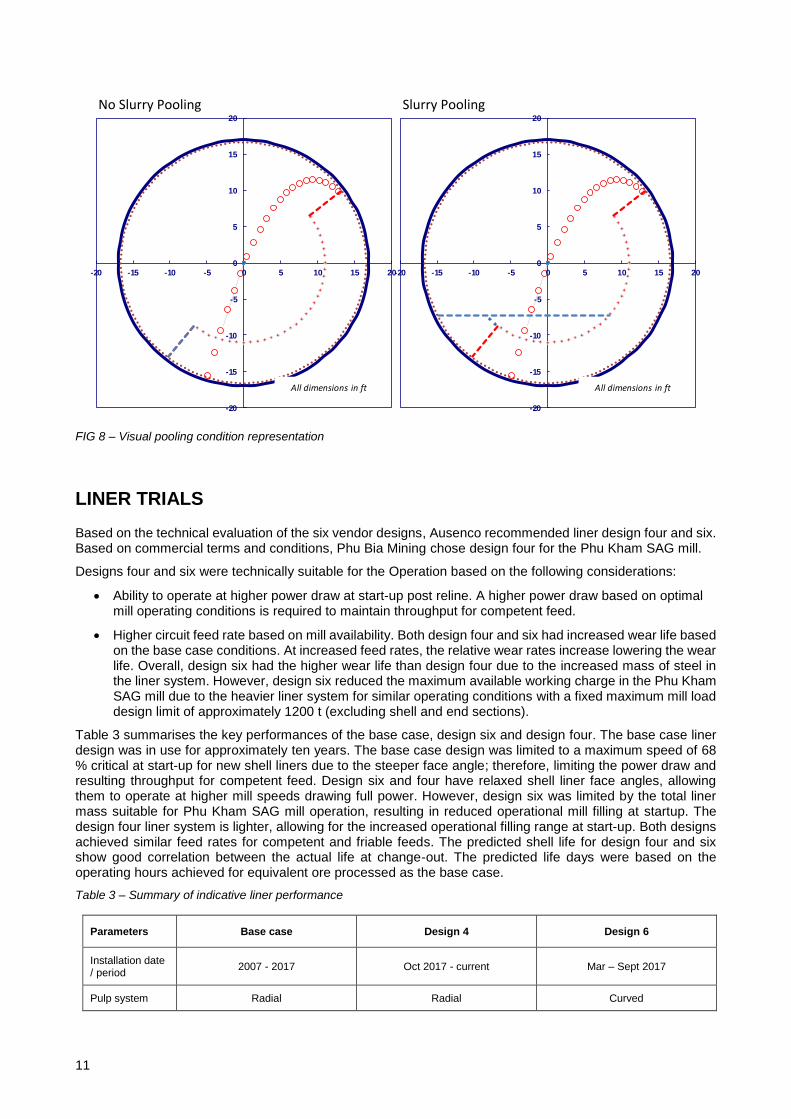
The SAG mill slurry pooling conditions were tested using Ausgrind’s flow capacity calculations. FIG 7 shows an example of the slurry flow capacity chart developed specifically for the Phu Kham SAG mill. The chart aims

10
to determine a suitable operating envelope at higher throughput rates. FIG 8 shows a visual representation generated by Ausgrind for the SAG mill slurry pooling conditions based on operating parameters.
The onset of slurry pooling in the SAG mill was mainly due to insufficient pumping capacity through the grates and discharge through the pulp chamber. The following conditions need to be met to prevent the onset of pooling in the SAG mill which results in low power draws and throughput rates (Powell and Valery, 2006).
• No slurry pooling = inflow flow rate < grate flow capacity < mill pumping capacity
• Slurry pool = inflow flow rate > grate flow capacity > mill pumping capacity
To achieve a throughput rate of 2,000 t/h and resolve issues leading to the onset of slurry pooling, the following logic (illustrated in FIG 7) was applied:
A. For a nominal pebble production rate of 15 % (dashed red line), the estimated mill inflow flow rate is approximately 1,800 m3/h for a target mill pulp density of 70 % w/w.
B. To minimise the onset of slurry pooling, the SAG mill needs run below ~74 % critical speed for the grates with 25 mm aperture. As the mill runs faster, the effective open grate area reduces and limits the slurry flow through the grates. For mill speeds, lower than 74 % critical, the grate flow capacity is greater than the mill inflow of 1,800 m3/h.
C. The mill pumping capacity at speeds lower than 74 % critical will be approximately 3,700 m3/h; which is higher than the grate flow capacity and meeting condition one (no slurry pooling = inflow flow rate < grate flow capacity < mill pumping capacity).
D. If the pebble production rates increase to 30 % (solid red line), the mill inflow flow rate will increase to compensate for the higher total SAG mill feed. The calculated inflow rate is approximately 2,100 m3/h for a target mill pulp density of 70 % w/w.
E. For the higher mill inflow flow rate, the mill speed needs to be reduced lower than 66 % critical to maintaining grate flow capacity greater than 2,100 m3/h. If the mill speed is maintained at 75 % critical, then the onset of slurry pooling will increase per condition two (slurry pool = inflow flow rate > grate flow capacity > mill pumping capacity).
F. At lower mill speeds, the mill pumping capacity reduces to approximately 3,300 m3/h.
FIG 7 – Example of flow capacity operating envelope chart
40
50
60
70
80
90
100
0
500
1000
1500
2000
2500
3000
0 500 1000 1500 2000 2500 3000 3500 4000 4500
Mill
sp
eed
(%
cri
tica
l)
SAG
mill
fre
sh f
eed
(t/
h)
Volumeteric slurry flowrate (m3/h)
Mill inflow @15% pebble Mill inflow @30% pebble mill pumping capacity @ 400mm pulp depth
Radial Grate flow @ 25mm aperture Radial Grate flow @ 45mm aperture
A D
B
E
F C
11
FIG 8 – Visual pooling condition representation
LINER TRIALS
Based on the technical evaluation of the six vendor designs, Ausenco recommended liner design four and six. Based on commercial terms and conditions, Phu Bia Mining chose design four for the Phu Kham SAG mill.
Designs four and six were technically suitable for the Operation based on the following considerations:
• Ability to operate at higher power draw at start-up post reline. A higher power draw based on optimal mill operating conditions is required to maintain throughput for competent feed.
• Higher circuit feed rate based on mill availability. Both design four and six had increased wear life based on the base case conditions. At increased feed rates, the relative wear rates increase lowering the wear life. Overall, design six had the higher wear life than design four due to the increased mass of steel in the liner system. However, design six reduced the maximum available working charge in the Phu Kham SAG mill due to the heavier liner system for similar operating conditions with a fixed maximum mill load design limit of approximately 1200 t (excluding shell and end sections).
Table 3 summarises the key performances of the base case, design six and design four. The base case liner design was in use for approximately ten years. The base case design was limited to a maximum speed of 68 % critical at start-up for new shell liners due to the steeper face angle; therefore, limiting the power draw and resulting throughput for competent feed. Design six and four have relaxed shell liner face angles, allowing them to operate at higher mill speeds drawing full power. However, design six was limited by the total liner mass suitable for Phu Kham SAG mill operation, resulting in reduced operational mill filling at startup. The design four liner system is lighter, allowing for the increased operational filling range at start-up. Both designs achieved similar feed rates for competent and friable feeds. The predicted shell life for design four and six show good correlation between the actual life at change-out. The predicted life days were based on the operating hours achieved for equivalent ore processed as the base case.
Table 3 – Summary of indicative liner performance
Parameters Base case Design 4 Design 6
Installation date / period
2007 - 2017 Oct 2017 - current Mar – Sept 2017
Pulp system Radial Radial Curved
-20
-15
-10
-5
0
5
10
15
20
-20 -15 -10 -5 0 5 10 15 20
All dimensions in ft
-20
-15
-10
-5
0
5
10
15
20
-20 -15 -10 -5 0 5 10 15 20
All dimensions in ft
No Slurry Pooling Slurry Pooling

12
Total liner package mas, t
543 460 610
Operational limit High lifter face angle = shell impact High lifter face angle = shell impact
High lifter mass = limited mill load and operational speed
Power draw at design operating conditions, MW
11.8 11.9 11.9
Optimised power draw, MW
10.6 12.4 12.0
Optimised mill speed, % Nc
68 71 77
Optimised ball charge / filling, %v/v
15 / 28 17 / 32 14 / 28
Instantaneous feed rate for competent feed, t/h
1770 2100 2000
Instantaneous feed rate for friable feed, t/h
2650 3100 3000
Predicted shell liner life, days
161
155 173
Actual shell liner life, days
158 177
SAG MILL OPTIMISATION
In March 2017, the recommended design six was trialled as the initial phase of the Phu Kham optimisation project. Design six was in operation through to September 2017 and was an interim design. Design four was installed in October 2017, with relines scheduled for March and September 2018.
As part of the solution process and support, Ausenco initially provided remote technical assistance and was engaged with the site team on a daily basis. Site visits were organised post-SAG mill relines to configure the operational parameters for the new liner system. The following is the implementation strategy for both liner packages.
Design six implementation strategy Reduction of SAG mill ball charge levels

13
A month before the SAG mill reline, Phu Kham operational teams were instructed to reduce the ball charge from 17 % v/v to 14 % v/v.
Ball charge levels in SAG mills with worn liners are often increased to maintain optimum load levels. A higher ball charge in SAG mills with worn liners is not detrimental to operations as the lack of lift does not cause direct shell impacts. However, for mills with new liners, ball charge levels should be reduced to increase the rock load, and cushion and protect the shell from direct shell impacts. It is not uncommon for SAG mills with new liner systems to operate with slower mill speeds to protect the shell for few weeks – the consequence of this is the potential loss of grinding power drawn and lower throughput.
Mill load setpoint was increased to match new liner package
The design six trial liner package was significantly heavier than the base case design. An increased liner steel mass reduces the working charge mass based on a fixed total SAG mill mass. The Phu Kham SAG mill’s total mass limit was 1,200t (excluding the shell and end sections). The design six liner package weighed approximately 610t, leaving approximately 590t of working charge mass. Ausgrind calculations was used to estimate the suitable and safe operating speed ranges and rock load based on the 14 % v/v ball charge load. The distributed control system (DCS) upper load limit was fixed at 590t at startup for design six.
Upper noise level and mill speed setpoints limit were increased to draw higher power
One of the key instrumentation controllers for the Phu Kham SAG mill is the noise level meter which is used as a proxy measurement for direct shell impacts. The optimum noise limit set by the Phu Kham operational team was 54 decibels (dB) (assuming impacts at the toe of the charge). Table 4 presents the recommended operating strategy to minimise direct shell impacts (high noise events) for varying ore competency and specific gravity (SG). Phu Kham’s ore change in competency and SG results in the changing charge volume, causing a false response by the noise meter controller. As measuring the ore SG dynamically is challenging, the SAG mill noise-controller response range was increased to target a more aggressive toe impact point and allow a higher operating speed and power for a given load.
As shown in Table 4, for variable ore competency and specific gravity the strategy should be:
• Friable ores with lower ore specific gravities, high noise level and lower mill load = increase the charge level by lowering the mill speed while maintaining power draw and throughput
• Friable ores with higher ore specific gravities, with high noise level and higher mill load = reduce the charge level by the increasing the mill speed while maintaining power draw and throughput
• Competent ores with lower ore specific gravities, with high noise level and lower mill load = increase the charge levels by lowering the mill speed maintaining power draw and throughput
• Competent ores with higher ore specific gravities, with high noise level and higher mill load = reduce the charge level by increasing the mill speed while maintaining power draw and throughput.
Table 4 – Proposed operating strategy for variable ore type and SG
Feed Type Ore SG Current Status Proposed Strategy

14
Friable Low
High
Competent Low

15
High
Design four implementation strategy Reducing high motor temperatures for lower speeds
The Phu Kham SAG mill induction drive uses Slip-Energy-Recovery (SER) drive systems to control the mill speed. The SER system uses a combination of mill load and speed to generate or regenerate electrical power for variable operating conditions. The SER systems require additional cooling, particularly in high-temperature regions to dissipate the heat during the generative stage. Although much lighter than the previous liner package, one of the drawbacks of the design four liner system is that the mill cannot operate at higher mill speeds (for new liners) due to the marginally steeper face angle. Therefore, the charge mass was increased (ball and rock load), achieving the desired power draw and resulting throughput rates at startup. At lower mill speeds (below synchronous) and higher mill loads, higher motor winding temperatures are induced to maintain higher power draws – operating the SAG mill at continuous lower speeds is not desirable for the motor drive health. The Phu KhamSAG mill SER drive was protected from overheating and consequential electrical damage by operating the mill at higher speeds (close to synchronous speed ~ 75 % critical). The resulting speed increase led to increased shell impacts which were cushioned by increasing the rock load and slurry density. Subsequently, version three of the design four lifter face angle has been adjusted to resolve the upper limit on the operating speed for new install.
Performance comparison between the base case, designs four and six Performance data for the base case and two liner designs (four and six) are shown in Table 5. The PI data was filtered by the SAG specific energy ranging from seven to five-kilowatt hour per tonne (kWh/t) which is a typical representation of the competent feed range for Phu Kham. The power draw, feed rates and mill speeds are similar for the two designs both in the 25th and 80th percentile range. The main differences were the mill load, mill noise and pebble recycle rates. At the time of the design four reline, the mill weight reading (as shown in the DCS) was not recalibrated for the new liner package installed in October 2017. Therefore a DCS mill weight reading of 590t (or 74 bar) corresponds to the maximum upper limit for the working charge in the SAG mill for both liner packages.
As indicated in Table 3, design six is a heavier liner package than design four, therefore, the charge volume will be different if the ball load was kept the same for the same mill load reading. The target ball load for design six was 14 % v/v, and design four was 17 % v/v at startup (post reline).
Based on the Ausgrind load calculations, the theoretical total mill volume will be approximately the same; however, the pebble recycle rates were different due to the difference in rock to steel volume in the total charge and different grate apertures. The base case data had the lowest performance after post SAG mill reline; which indicates the limited operating range for competent feed. Overall, the base case’s power draw was not maximised due to lower operating speed range and load.

16
Table 5 – Filtered data comparison between design 6 and 4 liner packages
Parameter Base case 25th percentile
Design 6 25th percentile
Design 4 25th percentile
Base case 80th percentile
Design 6 80th percentile
Design 4 80th percentile
SAG specific energy, kWh/t
5.3 6.7
Feed rate, t/h 1648 1748 1835 1800 2240 2175
Pinion power draw, MW
10.3 10.9 10.9 11.0 12.5 12.0
Mill speed, % Nc 68 71 70 70 78 78
DCS mill weight, t 474 498 541 510 585 582
Bearing pressure, bar
62 69 71 65 73 73
Mill noise, dB 49 50 51 51 60 57
Pebble recycle, t/h 129 113 232 156 291 349
Future Optimisation Strategy In combination with the improved liner packages, design six and the current design four, and the implemented SAG mill optimisation strategies, Phu Kham’s throughput has increased significantly for the competent feed over a period of 12 months in 2017. As part of the ongoing technical support, Phu Bia Mining, in conjunction with Ausenco and the design four vendor, is currently revising the next iteration of the liner design to improve the operational performance of the SAG mill for future ores – (the LOM assessment indicate that the competent feed deplete end of 2019 and friable feed is expected to be the primary ore type through to end of mine life). . It is expected through combined technical excellence that the Phu Kham Operation will achieve forecast mill throughput rates and its budgeted production liner profile design, comprising of:
• Shallower face angle for optimum operating speed
• Optimised liner weight based on wear and life
• Larger grate apertures and increased grate open area to minimise the onset of slurry pooling
.
CONCLUSIONS
A rigorous liner selection methodology and SAG mill optimisation strategy were addressed in this paper. FIG 9 presents the workflow outline of the liner review and optimisation work conducted at Phu Kham. The Phu Kham SAG mill optimisation started with a review of six liner designs and packages, which were evaluated using Ausenco’s in-house Ausgrind liner wear model to determine the life and profile shape of the worn liners. Instantaneous throughput rates were determined using the trajectory models to define the safe operating parameters required to maximise power draw (by changing the mill load and speed). Based on the technical evaluation, design four and six were selected for the Phu Kham SAG mill. Design six was a heavier package than design four due to the installation of the curved discharge system. Design four comprised a radial discharge system of composite materials rather than steel. The discharge capacities of the two liner package were checked using Ausgrind’s slurry flow and discharge model and confirmed to be operationally sound for varying slurry densities, feed rates and operating speed ranges.
As part of the trial phase, design six was in use from March to September 2017 and design four from October 2017 to present. Operationally, both liner packages require different configurations to achieve optimum operating conditions to maximise feed rates. The analysis of the PI data and review of the control philosophy indicated that the feed variability caused by changing ore competencies and densities affected the response of the controller. The Ausgrind calculations were used to define the optimum and safe operating conditions by changing the speed and mill volume for variable ores.

17
The Ausgrind modelled outputs were benchmarked with actual PI measurements to define the operational variances using Ausenco’s optimisation methodology. The defined operational variances were addressed as the focusing question during the implementation phase. Overall, the improved liner designs (design six and four) have significantly improved the performance of the Phu Kham SAG mill when compared to the base case design. Given the treatment of aggressive ores in the next four years of the scheduled mine plan, setting up the Phu Kham SAG mill for optimum operating conditions has been a successful exercise. Based on the current design four liner performance and optimum SAG mill operations, Phu Kham is expected to achieve the target feed rates per the mine plan
FIG 9 – Workflow for Liner and Process Optimisation
ACKNOWLEDGEMENTS The authors wish to acknowledge Ausenco, the Phu Kham operational team and Phu Bia Mining management for their support to publish the recent successful collaboration.
REFERENCES Chandramohan, R, Braun, R, Lane, G, Foggiatto, B, Wang, E & Bueno, M, (2018), Using Ausgrind calculations for comminution and operational optimisation, Minerals Engineering, Comminution Conference 2018, Cape Town
Bennett, D, Crnkovic, I and Walker, P, (2012), Recent process development at the Phu Kham copper-gold concentrator, Laos, in Proceedings 11th AUSIMM Mill Operators’ Conference 2012, pp 257 – 272 (Australian Institute of Mining and Metallurgy: Melbourne)
Hart, S, Nordell, L, Faulkner, C, (2006) Development of a SAG mill shell liner design at Cadia using DEM modelling, in Proceedings Autogenous and Semi-Autogenous Grinding Conference, (CIM, ICM, Vancouver)
Lane, G, and Dickie, M, (2009), What is required for a low-cost project, in Proceedings AUSIMM Project Evaluation Conference April 2009, pp 199 – 204 (Australian Institute of Mining and Metallurgy: Melbourne)
Lane, G, Foggiatto, B and Beuno, M, (2013), Power-based comminution calculations using Ausgrind, in Proceedings 10th International Mineral Processing Conference, Procemin 2013, (Procemin, Santiago)
Latchireddi, S R, (2002), Modelling the performance of grates and pulp lifters in autogenous and semi-autogenous mills, PhD Thesis, The University of Queensland
MolyCop Tools (MolyCop), https://molycop.com/supporting-customers/moly-cop-tools/
Morrell, S (1993), The prediction of power draw in wet tumbling mills, PhD Thesis, The University of Queensland

18
Morrell, S, (2016), Modelling the influence on power draw of the slurry phase in autogenous (AG), semi-autogenous (SAG) and ball mills, International Journal of Mineral Processing, 89, pp 148 – 156, (Elsevier Science Publishers, Amsterdam)
Powell, M (1991), The effect of liner design on the motion of the outer grinding elements in a rotary mill, International Journal of Mineral Processing, 31, pp 163 – 193, (Elsevier Science Publishers, Amsterdam)
Powell, M, Smit, I, Radziszewski, P, Cleary, P, Rattray, B, Eriksson, K-G, Schaeffer, L, (2006), The selection and design of mill liners, In Advances in Comminution, (ed: S K Kawatra), pp 331 – 376, (Society for Mining, metallurgy and exploration, Colorado)
Powell, M and Valery, W, (2006) Slurry pooling and transport issues in SAG mills, in Proceedings Autogenous and Semi-Autogenous Grinding Conference, (CIM, ICM, Vancouver)
Rocky DEM, (Rocky DEM), http://www.rocky-dem.com/