military expenditures - state · pdf filehighlights and trends wmeat 2005 - 1 - military...
TRANSCRIPT

Highlights and Trends WMEAT 2005
- 1 -
Military Expenditures
World
In constant-2005-dollar real-exchange-rate terms,1 world military expenditures appear to
have risen about 30% from 1995 to 2005, reaching nearly $1.2 trillion in 2005. The increase
accelerated during the second half of the decade, from less than 6% between 1995 and 2000 to
almost 24% between 2000 and 2005. This acceleration appears due chiefly to rising military
expenditures by the United States after the September 2001 attacks on New York and
Washington, including expenditures for military operations in Afghanistan and Iraq.
World military spending per capita appears to have risen by about 15% during the
decade, first falling from about $157 in 1995 to about $150 in 1998, then rising to about $180 in
2005.
Relative to the global sum of national GDPs, world military spending declined during the
first half of the decade, from about 2.7% to about 2.4%, rising back to about 2.6% during the
second half of the decade. The post-Cold-War decline in world military spending as a share of
measured global economic output during the last decade of the 20th
century was reversed during
the first half-decade of the 21st. Nevertheless, in 2005, military spending still accounted for a far
lower share of measured global economic output than during 1989, the last year of the Cold War,
when it appears to have been about 4.7%.
Regions2
North America‟s military spending appears to have risen about 46% in absolute terms
and about 32% in per capita terms from 1995 to 2005, despite falling in both terms from 1995
through 1998. North America‟s share of global military expenditures appears to have risen from
less than 40% in 1995 to more than 44% in 2005, despite falling almost to 37% in 1999-2001.
North America‟s military spending per capita appears to have risen by about 32%, from about
1 Throughout these “Highlights and Trends,” all discussion of military expenditures or GDP, either alone or relative
to either population or armed forces, is in terms of constant 2005 U.S. dollar values calculated using real exchange
rates with a base year of 2005, unless otherwise specified; for further detail and discussion, see the “Statistical
Notes” section of WMEAT 2005, particularly the subsection titled “Use of inflation-differential-offsetting (or „real‟)
conversion rates.” Ratios of military spending to GDP are unaffected by choices either between current- and
constant-dollar expression or among commonly-used currency conversion methods.
2 Main Statistical Table III lists all countries in each region.

Highlights and Trends WMEAT 2005
- 2 -
$1,200 in 1995 to about $1,580 in 2005, despite falling from 1995 through 1999. The ratio of
North America‟s military spending to its summed GDPs appears to have risen from 3.6% in 1995
to 3.8% in 2005, despite falling to 2.9% in 1999-2001.
The military spending of Central America and the Caribbean remained less than 1% of
the world total. The proportion of the region‟s summed GDPs to which it was equivalent
appears to have fallen from 0.8% in 1995 to 0.6% in 2005.
During the decade, South America‟s share of world military spending appears to have
varied between 2.3% and 3.0%, and the share of the region‟s summed GDPs to which its military
spending was equivalent appears to have ranged from 1.7% to 2.0%.
From 1995 to 2005, the military expenditures of the member states of the European
Union (as of the end of 2005) rose slightly, in both absolute and per capita terms. However, the
E.U.‟s share of world military spending appears to have declined from about 26% to about 21%,
and the share of E.U. GDP to which E.U. military spending was equivalent appears to have
declined from 2.1% to 1.8%.
The military expenditures of the states of Non-E.U. Europe (as of the end of 2005),
including Russia, rose in both absolute and per capita terms. However, they declined as a share
of the global total, from about 4.7% in 1995 to about 4.1% in 2005, despite spiking to above
5.5% in 1996-97. The share of summed Non-E.U. European GDPs to which Non-E.U. European
military spending was equivalent appears to have fallen from about 3.2% in 1995 to 2.7% in
2005, despite spiking to above 3.7% in 1996-97.
From 1995 to 2005, the military expenditures of the states of East Asia appear to have
risen about 45% in absolute terms and about 34% in per capita terms. East Asia‟s share of world
military spending appears to have risen from about 14.1% in 1995 to about 15.6% in 2005, rising
to and falling back from a decade high of about 2.1% in 2001. Throughout the decade, the share
of the sum of East Asia‟s GDPs to which its military spending was equivalent appears to have
remained about 2.0% or 2.1%.
From 1995 to 2005, the military expenditures of the states of South Asia appear to have
risen about 50% in absolute terms and about 23% per capita terms. South Asia‟s share of world
military spending appears to have risen from about 1.8% in 1995 to about 2.1% in 2005. During
the decade, the share of the sum of South Asia‟s GDPs to which its military expenditures were
equivalent appears to have fallen from 2.7% in 1995 to 2.4% in 2005.
Military spending by the states of the Middle East appears to have risen slightly in
absolute terms but to have fallen slightly in per capita terms during the decade. The Middle
East‟s share of world military spending appears to have ranged between 6.5% and 8.2% with no
definite trend. The share of the region‟s summed GDPs to which its military spending was

Highlights and Trends WMEAT 2005
- 3 -
equivalent appears to have fallen from about 6.4% to about 4.5%, but remained the higher than
that of any other region.
The military spending of the states of Central Asia remained far less than 1% of the
world total. The proportion of the region‟s summed GDPs to which it was equivalent appears to
have fallen from 2.0% in 1995 to 1.4% in 2005.
Military spending by the states of Africa appears to have increased in absolute terms but
to have declined slightly in per capita terms from 1995 to 2005 despite a spike in 1999. Africa‟s
share of world military spending appears to have ranged from 2.1% in 1999 to 1.6% in 2005.
The share of Africa‟s summed GDPs to which its military spending was equivalent appears to
have fallen steadily from a decade-high of 2.9% in 1999 to a decade-low of 2.0% in 2005.
Over the decade, the military expenditures of the states of Oceania appear to have risen
in absolute terms but exhibited no clear trend in per capita terms. The region‟s share of world
military spending appears to have ranged from 1.2% to 1.4%. The share of the region‟s summed
GDPs to which its states‟ military expenditures were equivalent appears to have fallen from
about 2.2% to about 1.8%.
Figure 1: Percentage change in military spending by region,
in absolute and per capita terms, 1995-2005
-20% 0% 20% 40% 60%
World
North America
Central America & Caribbean
South America
European Union
Non-EU Europe
East Asia
South Asia
Middle East
Central Asia
Africa
Oceania
Percentage change in military spending by region,
in absolute and per capita terms, 1995-2005
absolute
per capita

Highlights and Trends WMEAT 2005
- 4 -
Figure 2: Regional shares of world military expenditure, 1995 and 2005
Figure 3: GDP-share equivalent of military expenditure by region, 1995 and 2005
National per-capita-income groups
From 1995 to 2005, military spending by states categorized by the World Bank as high-
income OECD-member states in 2005 (0.92 billion people, including the U.S., most E.U.
member states, and Japan) appears to have risen about 28% in absolute terms and about 21% in
0.0% 10.0% 20.0% 30.0% 40.0% 50.0%
North America
Central America & …
South America
European Union
Non-EU Europe
East Asia
South Asia
Middle East
Central Asia
Africa
Oceania
Regional shares of world military expenditure, 1995 and 2005
1995
2005
0.0% 2.0% 4.0% 6.0% 8.0%
World
North America
Central America & …
South America
European Union
Non-EU Europe
East Asia
South Asia
Middle East
Central Asia
Africa
Oceania
GDP-share equivalent of military expenditure by region, 1995 and 2005
1995
2005

Highlights and Trends WMEAT 2005
- 5 -
per capita terms. The share of world military spending accounted for by this group of states
appears to have ranged between 69% and 73%, falling before 2001 and rising after 2001. The
share of the group‟s summed GDPs to which its military expenditures were equivalent appears to
have fallen from 2.5% in 1995 to 2.2% in 1998-2001, then to have risen back to 2.5% in 2004-
05.
During the decade, the military expenditures of states categorized by the World Bank as
high-income non-OECD-member states in 2005 (0.08 billion people, chiefly states with
economies based largely on petroleum exports) appear to have risen about 9% in absolute terms
but to have fallen about 10% in per capita terms. This group‟s share of world military spending
appears to have ranged from 5.2% to 6.9% and to have trended unsteadily downward. The share
of the group‟s summed GDPs to which its military spending was equivalent appears to have
fallen from 6.2% to 4.1%. Nevertheless, this group consistently had a higher ratio of military
spending to GDP than any other World Bank per-capita-income group of states.
The military expenditures of states categorized by the World Bank as upper-middle-
income states in 2005 (0.60 billion people) appear to have risen about 23% in absolute terms
and about 15% in per capita terms. This group‟s share of world military spending appears to
have ranged between 6.9% and 8.2% with no sustained trend. The share of the group‟s summed
GDPs to which its military spending was equivalent appears to have trended downward, from a
high of about 2.7% in 1996 to a low of 2.1% in 2005.
The military spending of states categorized by the World Bank as lower-middle-income
states in 2005 (2.48 billion people, including China) appears to have risen about 66% in absolute
terms and about 51% in per capita terms from 1995 to 2005. This group‟s share of world
military spending appears to have risen from about 9.9% to about 12.6% during the decade.
However, the share of the group‟s summed GDPs to which its military spending was equivalent
remained in the range of 2.9% to 3.1%. Although this group‟s military spending grew at a much
faster rate, in either absolute or per capita terms, than that of any other World Bank per-capita-
income group, it did so without increasing the group‟s military spending relative to its summed
GDPs.
From 1995 to 2005, the military spending of states categorized by the World Bank as
low-income states in 2005 (1.94 billion people, including India) appears to have risen about
38% in absolute terms and about 13% in per capita terms. This group‟s share of world military
spending appears to have ranged between 3.3% and 3.6% with no evident trend. The share of the
group‟s summed GDPs to which its military spending was equivalent fell from 3.4% in 1995 to
2.7% in 2005.

Highlights and Trends WMEAT 2005
- 6 -
Figure 4: Percentage change in military spending by income group,
in absolute and per capita terms, 1995-2005
Figure 5: Income-group shares of world military expenditure, 1995 and 2005
Figure 6: GDP-share equivalent of military expenditure by income group, 1995 and 2005
-20.0% 0.0% 20.0% 40.0% 60.0% 80.0%
World
High-income OECD-member states
High-income non-OECD-member states
Upper-middle-income states
Lower-middle-income states
Low-income states
Percentage change in military spending by income group,
in absolute and per capita terms, 1995-2005
absolute
per capita
0.0% 20.0% 40.0% 60.0% 80.0%
High-income OECD-member states
High-income non-OECD-member states
Upper-middle-income states
Lower-middle-income states
Low-income states
Income-group shares of world military expenditure, 1995 and 2005
1995
2005
0.0% 2.0% 4.0% 6.0% 8.0%
World
High-income OECD-member states
High-income non-OECD-member states
Upper-middle-income states
Lower-middle-income states
Low-income states
GDP-share equivalent of military expenditure by income group 1995 and 2005
1995
2005
Highlights and Trends WMEAT 2005
- 7 -
Armed Forces
World
The number of people serving in the world‟s armed forces appears to have fallen steadily
from 22.8 million in 1995 to 19.2 million in 2005, a drop of about 16% in absolute terms. It
appears to have fallen about 26% in per capita terms, from about 0.40% to about 0.30% of total
population. The global total of armed forces personnel appears to have fallen in both absolute
and per capita terms almost every year during the decade, although its decline slowed after 2001
as the rise world military spending accelerated. Over the decade, the number of armed forces
members appears to have fallen relative to total population in every region except Central Asia,
Central Africa and East Africa, and to have fallen in both absolute and per capita terms for all
World Bank per-capita-income groups of states.
Military expenditures per armed forces member appear to have risen about 56%
worldwide, from $38.9 thousand in 1995 to $60.6 thousand in 2005. Military spending per
armed forces member appears to have risen in every region except Central Asia and East Africa,
and to have risen for all World Bank per-capita-income groups of states. The world average
ratio of military spending per armed forces member to GDP per capita appears to have risen
about 31%, from about 6.7 in 1995 to about 8.7 in 2005; this ratio trended upward in all regions
but Central America and the Caribbean, the Middle East, Central Asia, and Africa, and in all but
the high-income non-OECD member and low-income per-capita-income groups. These results
seem to suggest (although they by no means establish) a marked increase in the capital-
intensively of armed forces worldwide, encompassing most regions and per-capita-income
groups, both in absolute terms and relative to that of the measured world economy.3
These trends may in part have responded to the effectiveness of new, high-tech and
relatively costly military equipment, demonstrated by U.S. and other forces during the Gulf War
of 1991 and subsequent conflicts in the Balkans, Afghanistan and Iraq.
3 Comparison of the non-personnel and personnel price deflators for the U.S. defense sector, published annually in
the National Defense Budget Estimates (aka “the Green Book”) by the Office of the Comptroller of the U.S.
Department of Defense suggests that the price of military capital (of constant capability) did not rise substantially
relative to military labor (of constant quality) during the decade. Although no comparable data for the world in
general are known, this suggests that, at least in the U.S., the substantial increase in military spending per arm forces
member during the decade resulted from a substantial real increase in the capital-intensivity of the armed forces. An
increase in military capital-intensivity may take the form of more capable and hence costlier equipment rather than
more equipment of constant capability.

Highlights and Trends WMEAT 2005
- 8 -
Regions
From 1995 to 2005, the number of armed forces personnel in North America appears to
have fallen about 15% in absolute terms, from about 1.69 to about 1.44 million, and about 23%
in per capita terms, from about 0.57% to about 0.44% of total population. North America‟s share
of world armed forces personnel appears to have ranged from about 7.3% to about 7.8%, with no
evident trend. Throughout the decade, North America‟s military spending per armed forces
member greatly exceeded that of any other region. North American military spending per armed
forces member appears to have risen about 71%, from about $210 thousand in 1995 to about
$359 thousand in 2005. Also, military spending per armed forces member rose appears to have
risen by a larger proportion in North America than in the world; the ratio of North American
military spending per armed forces member to world military spending per armed forces member
appears to have risen from about 5.4 in 1995 to about 5.9 in 2005, after falling to a decade low of
about 5.0 in 2001. However, North America‟s ratio of military spending per armed forces
member to GDP per capita appears to have been no greater than that of the world as a whole,
rising from about 6.3 in 1995 to about 8.7 in 2005, despite falling to 5.8 in 1999.
During the decade, the number of armed forces personnel in Central America and the
Caribbean appears to have ranged between 0.36 and 0.44 million, with no sustained trend. The
proportion of the total population in the armed forces appears to have ranged from about 0.27%
to about 0.23%, consistently below the global average and trending downward. The region‟s
share of world armed forces personnel appears to have ranged from about 1.7% to 2.2%, trending
upward. Annual military spending per armed forces member in the region appears to have
ranged from about $12.6 to about $13.9 thousand, with no clear trend. The region‟s ratio of
military spending per armed forces member to GDP per capita appears to have ranged from
about 3.1 to about 2.4, trending downward, and was consistently lower than that of any other
region.
South America‟s armed forces personnel appear to have increased about 6%, from about
0.93 million in 1995 to about 0.99 million in 2005, despite falling to about 0.90 million in 2002.
However, the proportion of the total population in the armed forces appears to have decline from
about 0.29% in 1995 to about 0.26% in 2005. South America‟s share of world armed forces
personnel appears to have risen from about 4.1% in 1995 to about 5.2% in 2005. The region‟s
annual military spending per armed forces member appears to have ranged from about $23.1 to
about $31.6 thousand, trending upward. South America‟s ratio of military spending per armed
forces member to GDP per capita was appears to have been slightly below the world average,
ranging from about 5.9 to about 8.1, trending unsteadily upward.
From 1995 to 2005, the number of personnel in the armed forces of the states of the
European Union (as of the end of 2005) appears to have fallen about 32%, from about 2.80 to
1.89 million. The proportion of total E.U. population in the armed forces appears to have fallen

Highlights and Trends WMEAT 2005
- 9 -
about 34%, from about 0.62% to about 0.41%. The E.U.‟s share of world armed forces
personnel appears to have fallen from about 12.3% to about 9.8%. However, E.U. states‟ annual
military spending per armed forces member appears to have risen about 57%, from about $82
thousand in 1995 to about $129 thousand in 2005. The E.U.‟s ratio of military spending per
armed forces member to GDP per capita was consistently lower than for any other region except
Central America and the Caribbean, although it appears to have risen from about 3.4 in 1995 to
about 4.4 in 2005.
The number of personnel in the armed forces of non-E.U. Europe (as of the end of 2005)
including Russia, appears to have fallen about 49%, from about 2.64 million in 1995 to about
1.35 million in 2005. The proportion of the non-E.U. European state‟s populations in their
armed forces appears to have fallen about 46%, from about 0.91% in 1995 to about 0.49% in
2005. Non-E.U. Europe‟s share of world armed forces personnel appears to have fallen from by
about 39%, from about 11.6% in 1995 to about 7.0% in 2005; no other region‟s share of world
armed forces personnel appears to have fallen by so large a proportion during the decade.
Military spending per armed forces member in non-E.U. European states appears to have risen
about 123%, from about $15.8 thousand in 1995 to about $35.2 thousand in 2005; in no other
region does military spending per armed forces member appear to have risen by so large a
proportion during the decade. The ratio of military spending per armed forces member to GDP
per capita in non-E.U. European states appears to have ranged from about 3.4 to about 6.0,
trending upward.
From 1995 to 2005, the number of armed forces personnel in East Asia appears to have
fallen about 16%, from about 7.5 to about 6.3 million. The proportion of the region‟s population
in its armed forces appears to have fallen about 23%, from 0.39% to 0.30%. The region‟s share
of armed forces personnel appears to have ranged from about 31.0% to about 32.8%, with no
evident trend. East Asia‟s annual military spending per member of its armed forces appears to
have risen about 71%, from $16.8 to $28.8 thousand. The region‟s ratio of military spending per
armed forces member to GDP per capita appears to have risen from about 5.0 to about 6.8.
During the decade, the number of personnel in South Asia‟s armed forces appears to
have remained in the range of about 2.2 to about 2.3 million. The proportion of the region‟s
population in its armed forces appears to have fallen about 18%, from about 0.18% to about
0.15%, and to have been consistently lower than for any other region except West Africa. The
region‟s share of world armed forces personnel appears to have risen from about 9.8% to about
11.5%. South Asian military spending per armed forces member appears to have risen about
59%, from about $6.9 to about $11.0 thousand a year. The region‟s ratio of military spending
per armed forces member to GDP per capita appears to have ranged from about 14.6 to about
17.0, trending slightly upward, and to have been consistently higher than for any other region.
From 1995 to 2005, the number of personnel in the armed forces of the Middle East
appears to have fallen from about 3.0 to about 2.5 million. The proportion of the region‟s
Highlights and Trends WMEAT 2005
- 10 -
population in its armed forces appears to have fallen about 30%, from about 1.08% to about
0.76%, but remained higher than for any other region. The Middle East‟s share of world armed
forces personnel appears to have ranged from about 12.7% to about 14.2%, with no apparent
trend. Annual military spending per armed forces member in the region appears to have risen
about 38%, from about $22.5 to $31.1 thousand. The region‟s ratio of military spending per
armed forces member to GDP per capita appears to have ranged from about 5.9 to about 7.2,
with no apparent trend.
During the decade, the number of armed forces personnel in Central Asia appears to
have ranged from about 0.15 to about 0.23 million, trending upward. The proportion of Central
Asia‟s population in its armed forces appears to have ranged from 0.25% to 0.36%, trending
upward. Annual military spending per armed forces member in the region appears to have
ranged from about $4.4 to about $6.8 thousand, with no apparent trend. The region‟s ratio of
military spending per armed forces member to GDP per capita appears to have fallen from about
8.0 to about 4.4. In all these parameters, trends in the region differed markedly from global
trends. The region‟s share of world armed forces personnel appears to have risen from about
0.7% to about 1.1%, peaking at about 1.2% in 2002-04.
From 1995 to 2005, the number of armed forces personnel of Africa‟s states appears to
have ranged from about 1.4 to about 1.9 million, peaking in 2001. The proportion of Africa‟s
population in the armed forces of its states appears to have ranged from about 0.21% to about
0.26%, peaking in 1999-2001. Africa‟s share of world armed forces personnel appears to have
risen from about 6.5% to about 9.3%, ranging as high as 9.4% in 2001-02 and 2004. Annual
military spending per armed forces member appears to have ranged from about $8.5 to about
$10.8 thousand, with no evident trend. The continent‟s ratio of military spending per armed
forces member to GDP per capita appears to have ranged from about 12.1 to 9.2, trending
downward.
The number of personnel in the armed forces of the states of Oceania appears to have
fallen by about 23%, from about 0.085 million in 1995 to about 0.065 million in 2005. The
proportion of the region‟s population in the armed forces of its states appears to have fallen about
33%, from about 0.31% in 1995 to about 0.21% in 2005. Oceania‟s share of world armed forces
personnel appears to have fallen from about 0.4% to about 0.3% during the decade. The region‟s
military spending per armed forces member appears to have risen from about $147 thousand in
1995 to about $219 thousand in 2005, despite having fallen to about $136 thousand in 1997. The
region‟s ratio of military spending per armed forces member to GDP per capita appears to have
risen from about 7.0 in 1995 to about 8.4 in 2005, despite falling to about 6.2 in 1997.

Highlights and Trends WMEAT 2005
- 11 -
Figure 7: Percentage change in armed forces personnel by region,
in absolute and per capita terms, 1995-2005
Figure 8: Regional shares of world armed forces personnel, 1995 and 2005
-60.0% -40.0% -20.0% 0.0% 20.0% 40.0% 60.0%
World
North America
Central America & Caribbean
South America
European Union
Non-EU Europe
East Asia
South Asia
Middle East
Central Asia
Africa
Oceania
Percentage change in armed forces personnel by region,
in absolute and per capita terms, 1995-2005
absolute
per capita
0.0% 5.0% 10.0% 15.0% 20.0% 25.0% 30.0% 35.0%
North America
Central America & Caribbean
South America
European Union
Non-EU Europe
East Asia
South Asia
Middle East
Central Asia
Africa
Oceania
Regional shares of world armed forces personnel, 1995 and 2005
1995
2005

Highlights and Trends WMEAT 2005
- 12 -
Figure 9: Percentage change in military spending per armed forces personnel by region, 1995-2005
Figure 10: Regions‟ military spending per armed forces member as multiple of GDP per capita,
eleven-year period average and trend, 1995-2005
-20.0% 0.0% 20.0% 40.0% 60.0% 80.0% 100.0% 120.0% 140.0%
World
North America
Central America & Caribbean
South America
European Union
Non-EU Europe
East Asia
South Asia
Middle East
Central Asia
Africa
Oceania
Percentage change in military spending per armed forces personnel by region, 1995-2005
0.0 5.0 10.0 15.0 20.0
World
North America
Central America & Caribbean
South America
European Union
Non-EU Europe
East Asia
South Asia
Middle East
Central Asia
Africa
Oceania
Regions' military spending per armed forces as multiple of GDP per capita,
eleven-year period average and trend, 1995-2005
rising
falling
unclear

Highlights and Trends WMEAT 2005
- 13 -
National per-capita-income groups
From 1995 to 2005, the number of personnel in the armed forces of states categorized by
the World Bank as high-income OECD-member states in 2005 (0.92 billion people, including
the U.S., most E.U. member states, and Japan) appears to have fallen about 20%, from about 5.1
to about 4.1 million. The proportion of the population of these states in their armed forces
appears to have fallen about 24%, from about 0.59% to about 0.45%. These states‟ share of
world armed forces personnel appears to have fallen from about 22.5% to about 21.5%. The
annual military spending of these states per armed forces member appears to have risen about
50%, from about $126 to about $202 thousand. These states‟ ratio of military spending per
armed forces member to GDP per capita appears to have ranged from about risen from about 4.3
in 1995 to about 5.6 in 2005, despite falling to about 4.2 in 1996-99.
During the decade, the number of personnel in the armed forces of states categorized by
the World Bank as high-income non-OECD-member states in 2005 (0.08 billion people,
chiefly states with economies based largely on petroleum exports) appears to have ranged from
about 0.99 to about 0.85 million, trending downward. The proportion of these states‟ population
in their armed forces appears to have fallen about 27%, from about 1.59% in 1995 to about
1.16% in 2005, but remained higher than that of any other World Bank per-capita-income group.
These states‟ share of world armed forces personnel appears to have ranged from about 4.3% to
about 4.6%, trending upward. These states‟ annual military expenditures per armed forces
member appear to have ranged from about $56.5 to about $75.4 thousand, trending upward.
Their ratio of military spending per armed forces member to GDP per capita appears to have
been lower than that of any other World Bank per-capita-income group, ranging from about 3.5
to about 4.3, with no apparent trend.
The number of personnel in the armed forces of states categorized by the World Bank as
upper-middle-income states in 2005 (0.60 billion people) appears to have fallen about 31%,
from 3.57 in 1995 to 2.45 million in 2005. Meanwhile, the proportion of these states‟ population
in their armed forces appears to have fallen by about 36%, from about 0.64% to about 0.41%.
These states‟ share of world armed forces personnel appears to have fallen from about 15.7% to
about 12.8% during the decade. These states‟ annual military spending per armed forces
member appears to have risen about 80%, from about $18.2 thousand in 1995 to about $32.7
thousand in 2005. Their ratio of military spending per armed forces member to GDP per capita
appears to have ranged from about 3.9 in 1995 to about 5.9 in 2002, falling after 2002 to about
5.2 in 2005.
From 1995 to 2005, the number of personnel in the armed forces of states categorized by
the World Bank as lower-middle-income states in 2005 (2.48 billion people, including China)
appears to have fallen about 18%, from about 7.70 to about 6.31 million. The proportion of
these states‟ population in their armed forces appears to have fallen about 26%, from about

Highlights and Trends WMEAT 2005
- 14 -
0.34% to about 0.25%. These states‟ share of world armed forces personnel remained in the
range of about 33.1% to about 33.9%. These states‟ annual military spending per armed forces
member appears to have risen about 103%, more than doubling, from about $11.4 to $23.1
thousand; no other World Bank per-capita-income group had so large a proportional increase in
military spending per armed forces member. These states‟ ratio of military spending per armed
forces member to GDP per capita appears to have risen from about 8.5 in 1995 to 11.7 in 2003,
falling back to about 11.3 in 2005.
During the decade, the number of personnel in the armed forces of states categorized by
the World Bank as low-income states in 2005 (1.94 billion people, including India) appears to
have been relatively stable, ranging from about 5.31 to about 5.56 million. The proportion of
these states‟ population in their armed forces appears to have fallen about 18%, from about
0.27% to about 0.22%. These states‟ share of world armed forces personnel appears to have
risen from about 23.2% to about 27.8%. These states‟ annual military spending per armed forces
member appears to have risen about 36%, from about $5.4 thousand in 1995 to about $7.4
thousand in 2005, despite falling to about $5.3 in 1997. These state‟s ration of military spending
per armed forces member to GDP per capita appears to have been relatively stable, ranging from
about 11.6 to 12.6 with no apparent trend.
Across World Bank per-capita-income groups of states, the ratio of military spending per
armed forces member to GDP per capita appears to have varied inversely with per capita income;
this ratio was highest for the low-income groups and lowest for the high-income group. Military
spending per armed forces member varied with but proportionally less than GDP per capita
across these groups.
Figure 11: Percentage change in armed forces personnel by income group,
in absolute and per capita terms, 1995-2005
-40.0% -30.0% -20.0% -10.0% 0.0% 10.0%
World
High-income OECD-member states
High-income non-OECD-member states
Upper-middle-income states
Lower-middle-income states
Low-income states
Percentage change in armed forces personnel by imcome group,
in crude and per capita terms, 1995-2005
absolute per capita

Highlights and Trends WMEAT 2005
- 15 -
Figure 12: Income-group shares of world armed forces personnel, 1995 and 2005
Figure 13: Percentage change in military spending per armed forces personnel by income group, 1995-2005
Figure 14: Income groups‟ military spending per armed forces member as multiple of GDP per capita,
eleven-year period average and trend, 1995-2005
0.0% 10.0% 20.0% 30.0% 40.0%
High-income OECD-member states
High-income non-OECD-member states
Upper-middle-income states
Lower-middle-income states
Low-income states
Income-group shares of world armed forces personnel, 1995 and 2005
1995
2005
0.0% 20.0% 40.0% 60.0% 80.0% 100.0% 120.0%
World
High-income OECD-member states
High-income non-OECD-member states
Upper-middle-income states
Lower-middle-income states
Low-income states
Percentage change in military spending armed forces personnel by income group, 1995-2005
0.0 2.0 4.0 6.0 8.0 10.0 12.0 14.0
World
High-income OECD-member states
High-income non-OECD-member states
Upper-middle-income states
Lower-middle-income states
Low-income states
Income groups' military spending per armed forces member as multiple of GDP per capita,
eleven-year period average and trend, 1995-2005
rising
unclear

Highlights and Trends WMEAT 2005
- 16 -
Arms Transfers
World
From 1995 to 2005, the global annual value of international arms transfer deliveries
appears to have risen about 18%, from about $80 billion to about $95 billion, despite falling to
about $70 billion in 1998. The arms trade‟s share of world trade in goods and services appears
to have ranged from about 0.7% to about 1.0%, with no evident trend.4
During the decade, about 71% of the world arms trade, by value,5 appears to have been
supplied by the United States, about 17% by the European Union. The U.S. share of the world
arms market appears to have risen from about 69% in 1995 to about 80% in 2005, despite falling
to about 62% in 1997. The E.U. share of the world arms market appears to have fallen from
about 19% in 1995 to about 11% in 2005, despite rising to about 26% in 1997.
During the decade, about 50% of world arms transfers appears to have been received by
high-income OECD member states, a group composed entirely of countries that not only are
relatively rich but also have market-oriented economies and democratic governments. The share
of world arms transfers received by high-income OECD member states appears to have increased
from about 40% in 1995 to about 59% in 2005; arms imports by states other than the U.S.
accounted for nearly all of both the size and the growth of the high-income OECD member
states‟ share of world arms imports, U.S. arms imports having constituted only about 2% of the
world total for the decade. High-income OECD member states appear to have received about
60% of U.S. arms exports during 2000-2002 and about 62% of U.S. arms exports during 2004-
2005. High-income OECD member state imports of arms exported by the U.S. appear to have
accounted for about 46% of the world arms trade in 2000-2002, and for about 47% of it in 2003-
2005.
Both the growth in the world arms trade and the increase in the U.S. share of world arms
exports during the decade appear due largely to increasing reliance on the U.S. as a source of
arms by other rich, democratically-governed countries with market-oriented economies. In
context of the sharp increases both in military spending per armed forces both in absolute terms
4 Throughout this “Highlights and Trends” section of WMEAT 2005, the terms “arms trade” and “arms transfer
deliveries” are used synonymously, and include services as well as goods, unless otherwise specified; for more
information about scope of coverage, see the “Statistical Notes” section of WMEAT 2005.
5 Throughout these “Highlights and Trends,” all discussion of shares of trade or arms transfers is by value unless
otherwise specified.

Highlights and Trends WMEAT 2005
- 17 -
and relative to GDP per capita observed among high-income OECD member states during the
decade, this seems to suggest that rich, democratic countries with market-oriented economies
may increasingly have obtained their increasingly costly and high-tech arms from the U.S.
Regions6
During the decade, the annual value of North America‟s arms exports appears to have
ranged from about $44 billion (1996) to about $77 billion (2005), trending sharply upward and
rising steadily after 1998. The region‟s share of world arms exports appears to have ranged from
about 63% (1997) to about 81% (2005), trending upward. The annual value of North America‟s
arms imports appears to have risen from about $2 billion in 1995 to about $6 billion in 2005.
The region‟s share of world arms imports appears to have ranged from about 2% to about 6%,
trending upward. Although the annual value of North America‟s arms export surplus appears to
have risen steadily from about $42 billion in 1996 to about $71 billion in 2005, its ratio of arms
exports to arms imports fell from about 33 in 1995 to about 13 in 2005. For the whole 1995-
2005 period, the value of North America‟s arms exports appears to have exceeded the value of
its arms imports by a factor of about 15. North America appears to have been the only region
other than non-E.U. Europe (including Russia) that was a net arms exporter during the period,
and its arms export/import ratio exceeded non-E.U. Europe‟s by a factor of about ten. During
1995 through 2005, North America‟s arms trade surplus of about $580 billion appears to have
been equivalent to almost 16% of its recorded trade deficit in all goods and services – a deficit
equivalent to about 19% of its recorded imports.
Throughout the decade, Central America‟s arms exports appear to have been negligible.
The annual value of the region‟s arms imports appears to have ranged from about $0.3 billion
(1998) to about $1.2 billion (2004), trending upward after 1998. During 1995 through 2005, the
region‟s imports appear to have been equivalent to only about 0.3% of its recorded imports of all
goods and services, and its arms trade deficit appears to have been equivalent to only about 3%
of its recorded trade deficit in all goods and services.
6 In WMEAT 2005, as in previous editions of WMEAT, regional exports and imports, both of arms and of all goods
(and, in WMEAT 2005, of all services), includes trade between states within a region; i.e., regional trade values are
“gross” rather than net of intra-regional trade. For example, an export from France to Belgium is counted both as
an E.U. export and as an E.U. import. For most regions, goods and services trade net of intra-regional trade cannot
readily be evaluated, because no adequate worldwide data for trade in all goods and services, disaggregated by
country of destination and well as country of origin, are readily available; WMEAT presents regional arms trade data
in “gross” form in order to render it comparable with regional total trade data. The proportion by which a region‟s
“gross” trade exceeds its trade net of intra-regional trade tends to increase with the number of states in the region;
e.g., it is likely to be greater for the E.U. than for North America. It also tends to be greater for richer regions than
for poorer regions, i.e., it is likely to be greater for Europe than for Africa. However, a region‟s trade balance
(surplus or deficit), either for the arms trade or for trade in all goods and services, is the same whether calculated
“gross” or net of intra-regional trade.

Highlights and Trends WMEAT 2005
- 18 -
During 1995 through 2005, South America‟s arms exports appear to have been
equivalent to less that 0.2% of world arms exports and to only 0.1% of the region‟s recorded
exports of all goods and services. Its arms imports appear to have been equivalent to about 2.2%
of world arms imports and to about 0.8% of its imports of all goods and services. However, from
1995 through 2005, the region‟s arms trade deficit appears to have been equivalent to about 13%
of its recorded trade surplus in all goods and services.
From 1995 through 2005, the annual value of the arms exports of the European Union
(as of the end of 2005) appears to have ranged from about $20 billion (1997) to about $10 billion
(2001-02), trending unsteadily downward. The E.U.‟s share of world arms exports appears to
have ranged from about 26% (1997) to about 11%, trending downward. The annual value of
E.U. arms imports appears to have ranged from about $15 billion (1996-98) to about $30 billion
(2005), trending upward. The E.U.‟s share of world arms imports appears to have ranged from
about 20% (1997) to about 31% (2005), trending upward. For 1995 through 2005, the E.U.‟s
arms exports appear to have been equivalent to about 0.4% of all recorded E.U. exports of goods
and services; its arms imports appear to have been equivalent to about 0.6% of all E.U. imports
of goods and services; and its arms trade deficit appears to have been about $74 billion,
equivalent to about 5% of its recorded trade surplus in all goods and services. During the
decade, the E.U. was a large net exporter of arms to the Middle East but a much larger net
importer of arms from the U.S.
During the decade, the annual value of the arms exports of non-E.U. Europe (as of the
end of 2005) including Russia, appears to have ranged trendlessly from about $4 billion to about
$7 billion. The region‟s share of world arms exports appears to have ranged trendlessly from
about 5% and 8%. The annual value of the region‟s arms imports appears to have ranged
trendlessly from about $2 billion to about $6 billion. Non-E.U. Europe‟s share of world arms
imports appears to have ranged from 2.5% to 5.7%, trending slightly upward. For 1995 through
2005, the region‟s arms exports appear to have been equivalent to about 1.1% of its recorded
exports of all goods and services; its arms imports appear to have been equivalent to about 0.9%
of its recorded imports of all goods and services; and its arms trade surplus appears to have been
about $21 billion, equivalent to about 3% of its recorded trade surplus in all goods and services.
East Asia remained a large net importer of arms, chiefly from the U.S. From 1995 to
2005, the annual value of East Asia‟s arms exports appears to have ranged trendlessly from about
$1 billion to about $2 billion. The region‟s share of world arms exports appears to have ranged
trendlessly from about 1% to about 2%. The annual value of East Asia‟s arms imports ranged
from about $15 billion (1995) to about $21 billion (2004), trending upward. The region‟s share
of world arms imports appears to have ranged trendlessly from about 15% to about 19%. For
1995 through 2005, East Asia‟s arms exports appear to have been equivalent to about 0.1% of its
recorded exports of all goods and services; its arms imports appear to have been equivalent to
about 1.1% of its recorded imports of all goods and services; and its arms trade deficit appears to

Highlights and Trends WMEAT 2005
- 19 -
have been about $186 billion, equivalent to about 10% of its recorded trade surplus in all goods
and services – a surplus equivalent to about 11% of its recorded imports.
During 1995 through 2005, South Asia‟s arms exports appear to have been negligible,
while the annual value of its arms imports appears to have ranged from about $1 billion to about
$4 billion, trending upward. The region‟s share of world arms imports appears to have been
about 3%, trending upward and exceeding 4% in 2004-05. South Asia‟s arms imports appear to
have been equivalent to about 1.6% of its recorded imports of all goods and services, and its
arms trade deficit appears to have been about $26 billion, equivalent to about 5% of its recorded
trade deficit in all goods and services.
The Middle East remained the region with the largest arms trade deficit both in absolute
terms and relative to its total trade; about 60% of its arms were imported from the U.S., about
30% from the E.U. During 1995 through 2005, the annual value of the region‟s arms exports
appears to have ranged trendlessly from about $1 billion to about $2 billion. The region‟s share
of world arms exports appears to have ranged trendlessly from about 1% to about 2%. However,
the annual value of the Middle East‟s arms imports appears to have ranged from about $29
billion to about $19 billion, trending downward. The region‟s share of world arms imports fell
from about 37% in 1995 to about 22% in 2005. For the eleven-year period, the Middle East‟s
arms exports appear to have been equivalent to about 0.4% of its recorded exports of all goods
and services; its arms import appear to have been equivalent to about 4% of its recorded imports
of all goods and services; and its arms trade deficit appears to have been about $238 billion,
equivalent to about 9% of its trade deficit in all goods and services as recorded by the World
Bank.
For 1995 through 2005, the value of Central Asia‟s arms exports appears to have been
about $1.3 billion, with no apparent trend. The value of its arms imports appears to have been
about $2.6 billion, trending downward. The region‟s share of world arms exports appears to
have been about 0.1%, while its share of world arms imports appears to have been about 0.3%.
Central Asia‟s arms trade deficit appears to have been equivalent to about 5% of its recorded
trade surplus in all goods and services.
For the eleven-year period, the value of Africa‟s arms exports appears to have been about
$3 billion, while the value of its arms imports appears to have been about $20 billion; no trend in
the annual value of either arms exports or arms imports is evident. The continent‟s share of
world arms exports appears to have been about 0.3%; its share of world arms imports appears to
have been about 2%; and its arms trade deficit appears to have been equivalent to less than 3% of
its recorded trade deficit in all goods and services.
For 1995 through 2005, the value of Oceania‟s arms exports appears to have been less
than $2 billion, while the value of its arms imports, supplied chiefly by the U.S., appears to have
been about $32 billion. No trend in the annual value of either arms exports or arms imports is

Highlights and Trends WMEAT 2005
- 20 -
apparent. The region‟s share of world arms exports appears to have been about 0.2%, its share of
world arms imports appears to have been less than 4%. However, the region‟s arms trade deficit
appears to have been equivalent to about 44% of its recorded trade deficit in all goods and
services – a deficit equivalent to nearly 5% of the value of its recorded imports. Oceania had a
higher arms trade deficit than any other region relative to its recorded trade balance in all goods
and services, and that balance was a deficit that was not negligible relative to the region‟s total
trade.
Figure 15: Regions‟ shares of world arms exports,
eleven-year period average and trend, 1995-2005
0.0% 20.0% 40.0% 60.0% 80.0%
North America
Central America & Caribbean
South America
European Union
Non-EU Europe
East Asia
South Asia
Middle East
Central Asia
Africa
Oceania
Not distributed by region
Regions' shares of world arms exports,
eleven-year period average and trend, 1995-2005
rising unclear falling constant

Highlights and Trends WMEAT 2005
- 21 -
Figure 16: Regions‟ shares of world arms imports,
eleven-year period average and trend, 1995-2005
Figure 17: Regions‟ arms trade balance as proportion of total trade balance,
eleven-year period average and trend, 1995-2005
North America
(rising), 4.6% Central America
& Caribbean
(rising), 0.8%
South America
(falling), 2.2%
European Union
(rising), 25.4%
Non-EU Europe
(rising), 4.4%
East Asia
(unclear), 22.3%
South Asia
(rising), 3.0%
Middle East
(falling), 27.9%
Central Asia
(falling), 0.3%
Africa (unclear),
2.2%
Oceania (unclear),
3.5%
Not distributed by
region (unclear),
3.5%
Regions' shares of world arms imports, eleven-year period
average and trend, 1995-2005
-50.0% -40.0% -30.0% -20.0% -10.0% 0.0% 10.0% 20.0%
North America (falling)
Central America & Caribbean (unclear)
South America (unclear)
European Union (unclear)
Non-EU Europe (falling)
East Asia (falling)
South Asia (unclear)
Middle East (falling)
Central Asia (unclear)
Africa (unclear)
Oceania (unclear)
Regions' armd trade (AT) balance as proportion of total trade (TT) balance,
evelen year period average and trend, 1995-2005
Total Trade Surplus Total Trade Deficit
Notes: 1. Positive numbers indicate Arms Trade surplus, negative numbers indicate Arms Trade deficit.
2. Globally, regional arms trade (AT) balances compare all known AT exports with only 96.5% of AT imports.

Highlights and Trends WMEAT 2005
- 22 -
National per-capita-income groups7
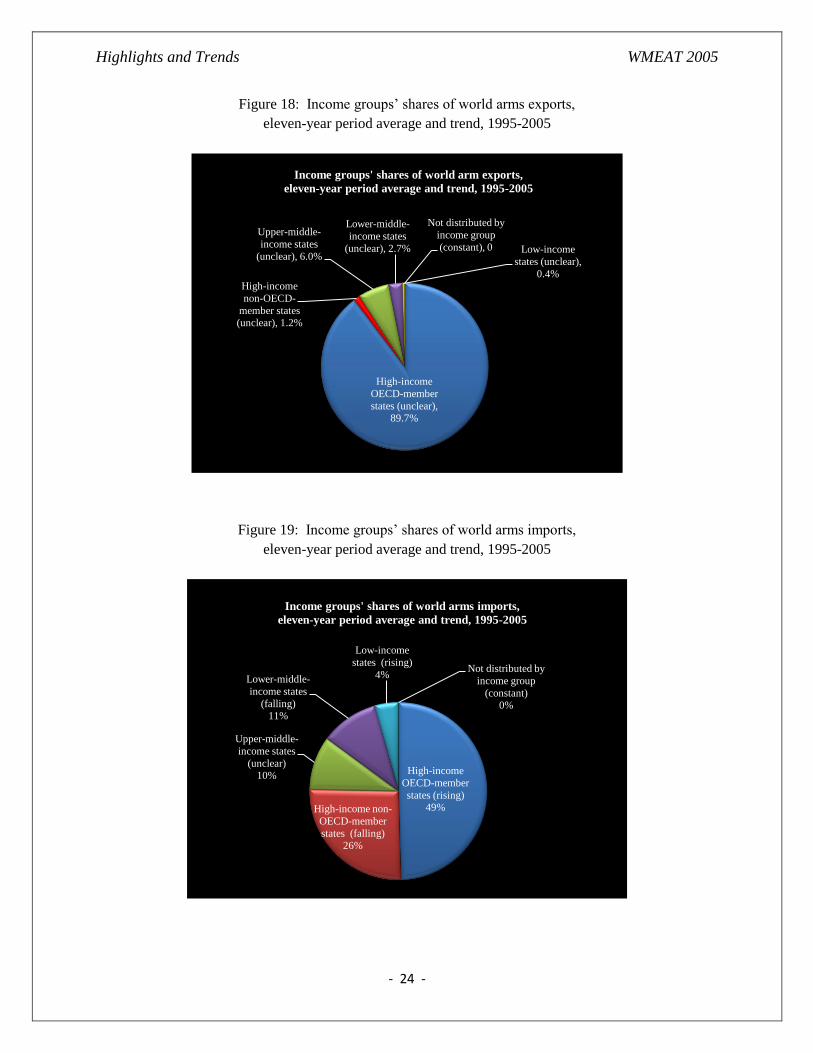
From 1995 to 2005, the annual value of the arms exports of states categorized by the
World Bank as high-income OECD-member states in 2005 (0.92 billion people, including the
U.S., most E.U. member states, and Japan) appears to have ranged from about $60 billion (1996)
to about $88 billion (2005), trending upward. These states‟ share of world arms exports appears
to have ranged from about 88% (1996) to about 93% (2005), trending slightly upward. The
annual value of these states‟ arms imports appears to have range from about $27 billion (1996) to
about $56 billion (2005), trending upward. These states‟ share of world arms imports appears to
have ranged from about 38% (1997) to about 59% (2005), trending upward. For the eleven-year
period, these states‟ arms exports appear to have been equivalent to about 181% of their arms
imports. These states‟ arms exports appear to have been equivalent to about 1.2% of their
recorded exports of all goods and services; their arms import appear to have been equivalent to
about 0.6% of their recorded imports of all goods and services; and their arms trade surplus
appears to have been about $360 billion, equivalent to about 50% of their recorded trade deficit
in all goods and services. No other per-capita-income group appears to have had an arms trade
surplus for the period.
During the decade, the annual value of the arms exports of states categorized by the
World Bank as high-income non-OECD-member states in 2005 (0.08 billion people, chiefly
states with economies based largely on petroleum exports) appears to have remained about $1
billion. The annual value of the arms imports of these states appears to have ranged from about
$30 billion (1997) to about $16 billion (2002), trending downward. These states‟ share of world
arms exports appears to have remained about 1%, while their share of world arms imports
appears to have ranged from about 39% (1997) to about 20% (2002), trending downward. For
the eleven-year period, these states‟ arms exports appear to have been equivalent to only 5% of
their arms imports. These states‟ arms exports appear to have been equivalent to about 0.2% of
their recorded exports of all goods and services; their arms import appear to have been
equivalent to about 3.4% of their recorded imports of all goods and services; and their arms trade
deficit appears to have been about $220 billion, equivalent to about 10% of their World-Bank-
recorded trade deficit in all goods and services.
7 In WMEAT 2005, each national per-capita-income group‟s exports and imports, both of arms and of all goods and
services, includes trade between states within the group; i.e., group trade values are “gross” rather than net of intra-
group trade. For example, an export from the U.S. to the U.K. is counted both as an export and as an import of the
high-income OECD-member states‟ group. Goods and services trade net of intra-group trade cannot readily be
evaluated, because no adequate worldwide data for trade in all goods and services, disaggregated by country of
destination and well as country of origin, are readily available; WMEAT presents per-capita-income groups‟ arms
trade data in “gross” form in order to render it comparable with the total trade data available for such groups. The
proportion by which a group‟s “gross” trade exceeds its trade net of intra-group trade tends to be greater for richer
groups than for poorer groups. However, a group‟s trade balance (surplus or deficit), either for the arms trade or for
trade in all goods and services, is the same whether calculated “gross” or net of intra-group trade.

Highlights and Trends WMEAT 2005
- 23 -
The annual value of the arms exports of states categorized by the World Bank as upper-
middle-income states in 2005 (0.60 billion people) appears to have ranged trendlessly from
about $3.2 billion (1998) to about $6.5 billion (2004). The annual value of these states‟ arms
imports appears to have ranged trendlessly from about $5.2 billion (1998) to about $12.0 billion
(1995). These states‟ share of world arms exports appears to have ranged trendlessly from about
4% to about 7%, while their share of world arms imports appears to have ranged trendlessly from
about 7% to about 15%. For 1995 through 2005, these states‟ arms exports appear to have been
equivalent to 61% of their arms imports. These states‟ arms exports appear to have been
equivalent to about 0.5% of their recorded exports of all goods and services; their arms import
appear to have been equivalent to about 0.9% of their recorded imports of all goods and services;
and their arms trade deficit appears to have been about $34 billion, equivalent to about 7% of
their recorded trade surplus in all goods and services.
The annual value of the arms exports of states categorized by the World Bank as lower-
middle-income states in 2005 (2.48 billion people, including China) appears to have ranged
trendlessly from about $2 billion to $3 billion, while the annual value of their arms imports
appears to have ranged trendlessly from about $7 billion to about $11 billion. These states‟ share
of world arms exports appears to have ranged from about 2% to about 4%, trending slightly
downward. Their share of world arms exports appears to have ranged from about 15% (1996) to
about 8% (2003), trending slightly downward. For 1995 through 2005, these states‟ arms
exports appear to have been equivalent to 26% of their arms imports. These states‟ arms exports
appear to have been equivalent to about 0.2% of their recorded exports of all goods and services;
their arms import appear to have been equivalent to about 0.9% of their recorded imports of all
goods and services; and their arms trade deficit appears to have been about $71 billion,
equivalent to about 15% of their recorded trade deficit in all goods and services.
From 1995 to 2005, the annual value of the arms exports of states categorized by the
World Bank as low-income states in 2005 (1.94 billion people, including India) appears to have
ranged trendlessly from about $0.2 to about 0.4 billion, while the annual value of these states‟
arms imports appears to have ranged from about $2 billion (1996, 2000) to about $5 billion
(2004, 2005), trending upward. For the eleven-year period, these states‟ arms exports appear to
have been equivalent to 9% of their arms imports. These states‟ share of world arms exports
appears to have been about 0.4%, with no apparent trend, while their share of world arms
imports appears to have been about 4%, trending upward. For 1995 through 2005, these states‟
arms exports appear to have been equivalent to about 0.1% of their recorded exports of all goods
and services; their arms import appear to have been equivalent to about 1.3% of their recorded
imports of all goods and services; and their arms trade deficit appears to have been about $35
billion, equivalent to about 6% of their recorded trade deficit in all goods and services.
Highlights and Trends WMEAT 2005
- 24 -
Figure 18: Income groups‟ shares of world arms exports,
eleven-year period average and trend, 1995-2005
Figure 19: Income groups‟ shares of world arms imports,
eleven-year period average and trend, 1995-2005
High-income
OECD-member
states (unclear), 89.7%
High-income
non-OECD-
member states
(unclear), 1.2%
Upper-middle-
income states
(unclear), 6.0%
Lower-middle-
income states
(unclear), 2.7% Low-income
states (unclear),
0.4%
Not distributed by
income group
(constant), 0
Income groups' shares of world arm exports,
eleven-year period average and trend, 1995-2005
High-income
OECD-member
states (rising) 49% High-income non-
OECD-member
states (falling) 26%
Upper-middle-
income states
(unclear) 10%
Lower-middle-
income states
(falling) 11%
Low-income
states (rising)
4% Not distributed by
income group
(constant) 0%
Income groups' shares of world arms imports,
eleven-year period average and trend, 1995-2005

Highlights and Trends WMEAT 2005
- 25 -
Figure 20: Income groups‟ arms trade balance as proportion of total trade balance,
eleven-year period average and trend, 1995-2005
Major arms suppliers
For the eleven-year period from 1995 through 2005:
The share of world arms imports supplied by the United States appears to have been
about 72%, rising from an annual low of about 62% in 1997 to an annual high of about 80% in
2005. The ratio of the value of U.S. arms exports to the value of U.S. arms imports appears to
have been about 34, apparently exceeded only by that of Ukraine (about 36); that ratio appears to
have fallen during the period as U.S. arms imports grew proportionally faster than U.S. arms
exports. The United States‟ arms trade surplus appears to have been about $623 billion,
equivalent to almost 15% of its recorded trade deficit in all goods and services. However, the
share of the United States‟ total trade deficit to which its arms trade surplus was equivalent
appears to have fallen from about 44% in 1995 to about 12% in 2005 because its total trade
deficit grew proportionally faster than its arms trade surplus.
The U.S. share of continental arms markets appears to have been:
about 57% (trending upward) for the Americas;
about 88% (no trend) for Europe;
about 64% (trending upward) for Asia;
about 27% (trending downward before 1998 and upward thereafter) for Africa; and
about 71% (trending upward) for Oceania.
The U.S. share of national per-capita-income group arms markets appears to have been:
about 87% (trending upward) for high-income OECD-member states;
-0.2 0 0.2 0.4 0.6
High-income OECD-member states (unclear)
High-income non-OECD-member states (falling)
Upper-middle-income states (unclear)
Lower-middle-income states (unclear)
Low-income states (unclear)
Income groups' arms trade (AT) balance as proportion of total trade (TT) balance,
eleven-year period average and trend, 1995-2005
Total Trade Surplus Total Trade Deficit

Highlights and Trends WMEAT 2005
- 26 -
about 59% (trending upward) for high-income non-OECD-member states;
about 68% (no trend) for upper-middle-income states;
about 48% (trending slightly upward) for lower-middle-income states; and
about 14% (trending sharply downward before 2001 and sharply upward thereafter)
for low-income states.
The share of world arms imports supplied by member states of the European Union (as
of the end of 2005) appears to have been about 17%, falling from an annual high of about 26% in
1997 to an annual low of about 11% in 2005. France appears to have supplied about 5% of
world arms imports, Germany about 2%, Italy less than 1%, the United Kingdom about 7%, and
other E.U. member states about 2%. The ratio of the value of E.U. arms exports to the value of
E.U. arms imports appears to have been about 0.67, the E.U. having been a net importer of arms,
chiefly from the U.S. Among E.U. member states, only France, with an arms export/import ratio
of about 2.5, appears to have been a net arms exporter. The E.U.‟s arms trade deficit appears to
have been about $74 billion, equivalent to about 5% of its recorded trade surplus in all goods and
services.
The E.U. share of continental arms markets appears to have been:
about 24% (trending downward) for the Americas;
about 7% (no trend) for Europe;
about 22% (trending downward) for Asia;
about 15% (trending downward before 2001 and upward thereafter) for Africa; and
about 23% (trending downward) for Oceania.
The E.U. share of national per-capita-income group arms markets appears to have been:
about 9% (trending downward) for high-income OECD-member states;
about 38% (trending downward) for high-income non-OECD-member states;
about 17% (no trend) for upper-middle-income states;
about 12% (trending downward) for lower-middle-income states; and
about 14% (trending downward) for low-income states.
The share of world arms imports supplied by Russia appears to have been about 5%,
ranging from an annual high of about 6% in 2001 to an annual low of about 3% in 2005 with no
clear trend. The ratio of the value of Russia‟s arms exports to the value of its arms imports
appears to have been about 3.4, apparently falling from an annual high of over 500 in 1995 to an
average of less than 2 for 2002-05. Russia‟s arms trade surplus appears to have been about $33
billion, equivalent to about 7% of its recorded trade surplus in all goods and services.
Russia‟s share of continental arms markets appears to have been:
about 1% (trending downward) for the Americas;
about 2% (trending downward) for Europe;
about 8% (no trend) for Asia;

Highlights and Trends WMEAT 2005
- 27 -
about 17% (no trend) for Africa; and
about 0% (no trend) for Oceania.
Russia‟s share of national per-capita-income group arms markets appears to have been:
about 1% (no trend) for high-income OECD-member states;
about 1% (trending downward) for high-income non-OECD-member states;
about 4% (trending downward) for upper-middle-income states;
about 26% (no trend) for lower-middle-income states; and
about 32% (trending upward) for low-income states.
The share of world arms imports supplied by non-E.U. European states other than Russia
appears to have been less than 2%, ranging from an annual high of over 2% in 2003 to an annual
low of less than 1% in 2005 and trending downward. The non-E.U. European states other than
Russia with the largest arms exports appear to have been Ukraine, with arms exports of about $7
billion and an arms export/import ratio of about 36 (the world‟s highest), and Belarus, with arms
exports of under $3 billion and an arms export/import ratio of about 13 (the world‟s third-
highest). However, the group of all non-E.U. European states other than Russia, collectively,
appears to have been a net arms importer. These states‟ arms trade deficit appears to have been
about $12 billion, equivalent to about 5% of their recorded trade surplus in all goods and
services.
These states‟ share of continental arms markets appears to have been:
about 3% (trending downward) for the Americas;
about 1% (no trend) for Europe;
about 1% (no trend) for Asia;
about 18% (trending downward) for Africa; and
about 0% (no trend) for Oceania.
These states‟ share of national per-capita-income group arms markets appears to have
been:
about 1% (no trend) for high-income OECD-member states;
about 1% (trending downward) for high-income non-OECD-member states;
about 4% (no trend) for upper-middle-income states;
about 5% (trending downward) for lower-middle-income states; and
about 9% (trending downward after 1998) for low-income states.
The share of world arms imports supplied by China (mainland) appears to have been
about 1%, with a slight downward trend. China‟s arms export/import ratio appears to have been
about 0.5, the country having remained a net arms importer. China‟s arms trade deficit appears
to have been about $10 billion, equivalent to about 2% of its recorded trade surplus in all goods
and services.
Highlights and Trends WMEAT 2005
- 28 -
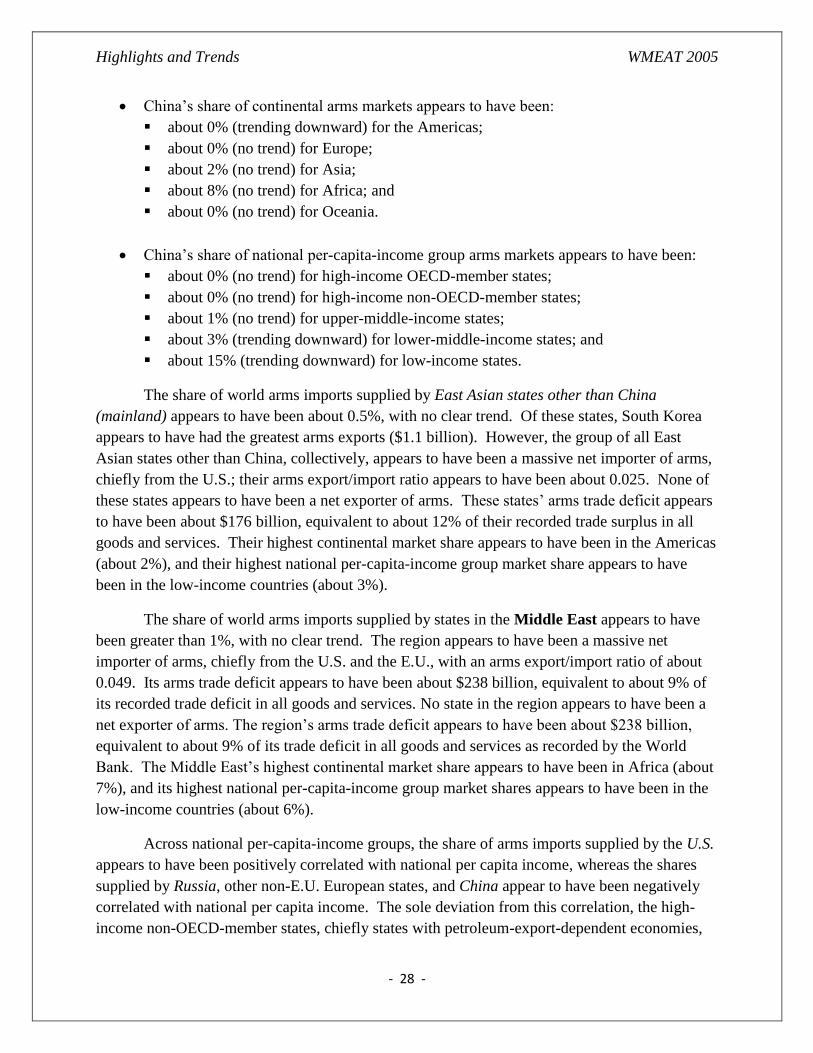
China‟s share of continental arms markets appears to have been:
about 0% (trending downward) for the Americas;
about 0% (no trend) for Europe;
about 2% (no trend) for Asia;
about 8% (no trend) for Africa; and
about 0% (no trend) for Oceania.
China‟s share of national per-capita-income group arms markets appears to have been:
about 0% (no trend) for high-income OECD-member states;
about 0% (no trend) for high-income non-OECD-member states;
about 1% (no trend) for upper-middle-income states;
about 3% (trending downward) for lower-middle-income states; and
about 15% (trending downward) for low-income states.
The share of world arms imports supplied by East Asian states other than China
(mainland) appears to have been about 0.5%, with no clear trend. Of these states, South Korea
appears to have had the greatest arms exports ($1.1 billion). However, the group of all East
Asian states other than China, collectively, appears to have been a massive net importer of arms,
chiefly from the U.S.; their arms export/import ratio appears to have been about 0.025. None of
these states appears to have been a net exporter of arms. These states‟ arms trade deficit appears
to have been about $176 billion, equivalent to about 12% of their recorded trade surplus in all
goods and services. Their highest continental market share appears to have been in the Americas
(about 2%), and their highest national per-capita-income group market share appears to have
been in the low-income countries (about 3%).
The share of world arms imports supplied by states in the Middle East appears to have
been greater than 1%, with no clear trend. The region appears to have been a massive net
importer of arms, chiefly from the U.S. and the E.U., with an arms export/import ratio of about
0.049. Its arms trade deficit appears to have been about $238 billion, equivalent to about 9% of
its recorded trade deficit in all goods and services. No state in the region appears to have been a
net exporter of arms. The region‟s arms trade deficit appears to have been about $238 billion,
equivalent to about 9% of its trade deficit in all goods and services as recorded by the World
Bank. The Middle East‟s highest continental market share appears to have been in Africa (about
7%), and its highest national per-capita-income group market shares appears to have been in the
low-income countries (about 6%).
Across national per-capita-income groups, the share of arms imports supplied by the U.S.
appears to have been positively correlated with national per capita income, whereas the shares
supplied by Russia, other non-E.U. European states, and China appear to have been negatively
correlated with national per capita income. The sole deviation from this correlation, the high-
income non-OECD-member states, chiefly states with petroleum-export-dependent economies,

Highlights and Trends WMEAT 2005
- 29 -
appears due to the exceptionally large E.U. share of this market. Across national per-capita
income groups, the summed shares of arms imports supplied by the U.S. and the E.U. is
positively correlated with national per capita income even more strongly.
The sum of the U.S. and E.U. shares of national per-capita-income group arms markets
appears to have been:
about 96% (no trend) for high-income OECD-member states;
about 97% (no trend) for high-income non-OECD-member states;
about 85% (no trend) for upper-middle-income states;
about 60% (falling before 2000-2001 and rising thereafter) for lower-middle-income
states; and
about 28% (falling sharply before 2001 and rising sharply thereafter) for low-income
states.
High-income states appear to have dominated the large higher-income markets, while
middle-income states (including Russia, Ukraine, Belarus, and China) tended to have large
shares only of the relatively small lower-income markets.
By continental markets
For the eleven-year period from 1995 through 2005:
The Americas‟ share of world arms imports appears to have been about 8%, trending
upward. About 57% of the arms imports of the Americas appears to have been supplied by the
United States, about 24% by member states of the European Union (as of the end of 2005),
chiefly the United Kingdom. about 1% by Russia, about 3% by other non-E.U. European states,
less than one-half of one percent by China, about 2% by other East Asian states, and about 4%
by states in the Middle East. The share of American arms imports supplied by the U.S. appears
to have ranged from about 40% (1997) to about 72% (2004), trending upward. The share of the
region‟s arms imports supplied by member states of the E.U. appears to have ranged from about
30% (1998) to about 13% (2004), trending downward.
Europe‟s share of world arms imports appears to have been about 30%, trending upward.
About 88% of the arms imports of Europe appears to have been supplied by the United States,
about 7% by member states of the European Union, about 2% by Russia, and about 1% or less
by other non-E.U. European states, by China, by other East Asian states, or by states in the
Middle East. The share of European arms imports supplied by the U.S. appears to have ranged
trendlessly from about 82% (1996) to about 93% (2002). The share of the continent‟s imports
supplied by member states of the E.U. appears to have ranged trendlessly from about 11% (1998)
to about 3% (2002).

Highlights and Trends WMEAT 2005
- 30 -
Asia‟s share of world arms imports appears to have been about 54%, trending downward.
About 64% of the arms imports of Asia appears to have been supplied by the United States,
about 22% by member states of the European Union, chiefly the United Kingdom and France,
about 8% by Russia, about 2% by China, and about 1% or less by non-E.U. European states
other than Russia, by East Asian states other than China, or by states in the Middle East. The
share of Asian arms imports supplied by the U.S. appears to have ranged from about 56% (1996,
1997) to about 76% (2005), trending upward. The share of Asian arms imports supplied by
member states of the E.U. appears to have ranged from about 33% (1997) to about 12% (2005),
trending downward. The share of the continent‟s arms imports supplied by Russia appears to
have ranged trendlessly from about 5% (1997, 1998) to about 11% (2001).
Africa‟s share of world arms imports appears to have been about 2%, with no apparent
trend. About 27% of the arms imports of Africa appears to have been supplied by the United
States, about 15% by member states of the European Union, about 17% by Russia, about 18% by
other non-E.U. European states including Ukraine, about 8% by China, about 1% by East Asian
states other than China, and about 7% by states in the Middle East. The share of African arms
imports supplied by the U.S. appears to have ranged from about 15% (1998) to 41% (2005),
falling before 1998 and rising thereafter. The share of African arms imports supplied by member
states of the E.U. appears to have ranged trendlessly from about 6% (2001) to about 28% (2004).
The share of the continent‟s arms imports supplied by Russia appears to have ranged trendlessly
from about 25% (1999) to about 12% (2002). The share of Africa‟s arms imports supplied by
other non-E.U. European states including Ukraine appears to have ranged from about 32%
(1999) to about 6% (2005), trending downward. The share of the continent‟s arms imports
supplied by China appears to have ranged trendlessly from about 3% (1995) to about 14%
(1998). The share of African arms imports supplied by states in the Middle East appears to have
ranged trendlessly from about 20% (1995) to about 1% (2004).
Oceania‟s share of world arms imports appears to have been about 4%, with no apparent
trend. About 71% of the arms imports of Oceania appears to have been supplied by the United
States, about 23% by member states of the European Union, chiefly Germany, and less than one-
half of one percent by Russia, by other non-E.U. European states, by China, by other East Asian
states, or by states in the Middle East. The share of Oceania‟s arms imports supplied by the U.S.
appears to have ranged from about 52% (1997) to about 95% (2005), trending upward. The
share of Oceania‟s arms import supplied by member states of the E.U. appears to have ranged
from about 37% (1998) to about 3% (2004, 2005), trending downward.
By per-capita-income-group markets
For the eleven-year period from 1995 through 2005:
Highlights and Trends WMEAT 2005
- 31 -
High-income OECD-member states‟ share of world arms imports appears to have been
about 50%, trending slightly upward. About 87% of the arms imports of high-income OECD-
member states appears to have been supplied by the United States, about 9% by member states of
the European Union (as of the end of 2005). The share of these states‟ arms imports supplied by
the U.S. appears to have ranged from about 81% (1997) to about 92% (2004), trending upward.
The share of their arms imports supplied by member states of the E.U. appears to have ranged
from about 14% (1998) to about 5% (2004), trending downward.
High-income non-OECD-member states‟ share of world arms imports appears to have
been about 26%, trending downward. About 59% of the arms imports of high-income non-
OECD-member states appears to have been supplied by the United States, about 38% by member
states of the European Union, chiefly the United Kingdom and France. The share of these
states‟ arms imports supplied by the U.S. appears to have ranged from about 50% (1997) to
about 73% (2005), trending upward. The share of their arms imports supplied by member states
of the E.U. appears to have ranged from about 46% (1997) to about 26% (2005), trending
downward.
Upper-middle-income states‟ share of world arms imports appears to have been about
10%, with no evident trend. About 68% of the arms imports of upper-middle-income states
appears to have been supplied by the United States, about 17% by member states of the
European Union, and about 4% each by Russia, other non-E.U. European states, including
Ukraine, and states in the Middle East. The share of their arms imports supplied by the U.S.
appears to have ranged trendlessly from about 58% (1999) to about 76% (2001, 2002). The share
supplied by member states of the E.U. appears to have ranged trendlessly from about 29% (1999)
to about 8% (2002), trending downward. The Russian share appears to have ranged from about
11% (1995) to about 1% (2002, 2004), trending downward.
Lower-middle-income states‟ share of world arms imports appears to have been about
11%, trending slightly downward. About 48% of the arms imports of lower-middle-income
states appears to have been supplied by the United States, about 12% by member states of the
European Union, about 26% by Russia, about 5% by other non-E.U. European states, including
Ukraine, and about 3% each by China and by states in the Middle East. The share of these
states‟ arms imports supplied by the U.S. appears to have ranged from about 38% (1997) to
about 66% (2005), trending slightly upward. The share of their arms imports supplied by E.U.
member states appears to have ranged from about 23% (1997) to about 5% (2004), trending
downward. The Russian share appears to have ranged from about 17% (1995, 1997) to about
40% (2001), trending upward before 2001 and downward thereafter. China‟s share appears to
have ranged from about 6% (1997) to about 2% (1999-2002, 2004), trending downward. The
share supplied by states in the Middle East appears to have ranged from about 5% (1995) to
about 1% (2004), trending downward.

Highlights and Trends WMEAT 2005
- 32 -
Low-income states‟ share of world arms imports appears to have been about 4%,
trending upward. Only about 14% of the arms imports of low-income states appears to have
been supplied by the United States, and only about 14% by member states of the European
Union, while about 32% appears to have been supplied by Russia, about 9% by other non-E.U.
European states including Ukraine, about 15% by China, and about 6% by states in the Middle
East. The share of these states‟ arms imports supplied by the U.S. appears to have ranged from
about 4% (2001) to 32% (2005), falling sharply before 2001 and rising sharply thereafter. The
share of their arms imports supplied by member states of the E.U. appears to have ranged from
about 31% (1999) to about 6% (2003), trending unsteadily downward. Russia‟s share appears to
have ranged from about 17% (1996) to about 55% (2003), trending slightly upward. The share
supplied by other non-E.U. European states appears to have ranged from about 5% (1995, 2004,
2005) to about 18% (1998), cresting during 1997-2000. China‟s share appears to have ranged
from about 22% (1997) to about 8% (2003), trending downward. The share supplied by states in
the Middle East appears to have ranged from about 2% to about 9%, trending upward.
Figure 21: Major arms suppliers‟ shares of world arms exports,
eleven-year period average and trend, 1995-2005
United States
(rising)
72%
European Union
(falling)
17%
Russia (unclear)
5%
Non-EU Europe
excl. Russia
(unclear) 2%
China (falling)
1%
East Asia excl.
China (unclear)
0%
Middle East
(unclear)
1%
Other (unclear)
2%
Major arms suppliers' shares of world arms exports,
eleven year-period average and trend, 1995-2005

Highlights and Trends WMEAT 2005
- 33 -
Figure 22: Major arms suppliers‟ arms export/import ratios,
eleven-year period average and trend, 1995-2005
Figure 23: Major arms suppliers‟ arms trade balance as proportion of their total trade balance,
eleven-year period average and trend, 1995-2005
0.010 0.100 1.000 10.000 100.000
United States
European Union
Russia
Non-EU Europe excl. Russia
China
East Asia excl. China
Middle East
Major arms suppliers' arms export/import ratios,
eleven-year period average and trend, 1995-2005 (logarithmic scale)
unclear
falling
-20.0% -10.0% 0.0% 10.0% 20.0%
United States (falling)
European Union (unclear)
Russia (falling)
Non-EU Europe excl. Russia (unclear)
China (unclear)
East Asia excl. China (unclear)
Middle East (falling)
Major arms suppliers' arms trade balance as proportion of their total trade balance,
eleven-year period average and trend, 1995-2005
Total Trade Surplus Total Trade Deficit
Notes:1.Positive number indicates Arms Trade surplus, negative number incdicate Arms Trade defict..
2. Globally, country arms trade (AT) blalnces compare all known AT exports with only 96.5% of known AT imports.

Highlights and Trends WMEAT 2005
- 34 -
Figure 24: Major arms suppliers‟ shares of continental markets,
eleven-year period average and trend, 1995-2005
Figure 24.A.: Americas Figure 24.B.: Europe
Figure 24.C.: Asia Figure 24.D.: Africa
Figure 24.E.: Oceania
United
States
(rising) 56%
European
Union
(falling) 24%
Russia
(falling)
1%
Non-EU
Europe
excl. Russia
(falling)
3%
East Asia
excl. China
(falling) 2%
Middle
East
(falling) 4%
Other
(falling)
10%
The Americas
United
States
(rising)
88%
European
Union
(unclear) 7%
Russia
(falling)
2%
Non-EU
Europe
excl. Russia
(unclear)
1%
Middle
East
(unclear)
1% Other
(unclear)
1%
Europe
United
States
(rising) 64%
European
Union
(falling) 22%
Russia
(rising)
8%
Non-EU
Europe
excl. Russia
(unclear)
1%
China
(unclear)
2%
East Asia
excl. China
(unclear) 1%
Middle
East
(unclear) 1%
Other
(unclear)
1%
Asia
United
States
(rising) 27%
European
Union
(unclear) 15%
Russia
(unclear)
17%
Non-EU
Europe
excl. Russia
(unclear)
18%
China
(unclear)
8%
East Asia
excl. China
(unclear) 1%
Middle
East
(unclear) 7%
Other
(falling)
7%
Africa
United
States
(rising) 72%
European
Union
(falling) 23%
Other
(unclear)
5%
Oceania
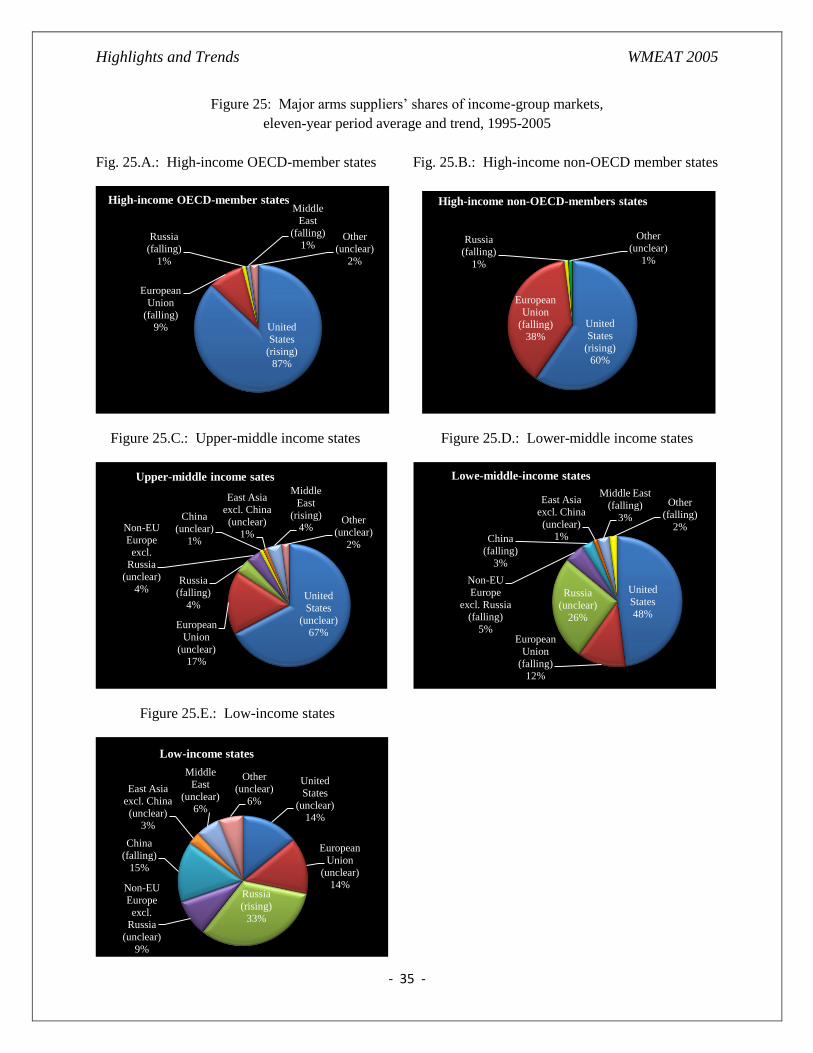
Highlights and Trends WMEAT 2005
- 35 -
Figure 25: Major arms suppliers‟ shares of income-group markets,
eleven-year period average and trend, 1995-2005
Fig. 25.A.: High-income OECD-member states Fig. 25.B.: High-income non-OECD member states
Figure 25.C.: Upper-middle income states Figure 25.D.: Lower-middle income states
Figure 25.E.: Low-income states
United
States
(rising) 87%
European
Union
(falling) 9%
Russia
(falling)
1%
Middle
East
(falling) 1%
Other
(unclear)
2%
High-income OECD-member states
United
States
(rising) 60%
European
Union
(falling) 38%
Russia
(falling)
1%
Other
(unclear)
1%
High-income non-OECD-members states
United
States
(unclear) 67%
European
Union
(unclear) 17%
Russia
(falling)
4%
Non-EU
Europe
excl. Russia
(unclear)
4%
China
(unclear)
1%
East Asia
excl. China
(unclear) 1%
Middle
East
(rising) 4%
Other
(unclear)
2%
Upper-middle income sates
United
States
48%
European
Union
(falling) 12%
Russia
(unclear)
26%
Non-EU
Europe
excl. Russia (falling)
5%
China
(falling)
3%
East Asia
excl. China
(unclear) 1%
Middle East
(falling)
3%
Other
(falling)
2%
Lowe-middle-income states
United
States
(unclear) 14%
European
Union
(unclear) 14%
Russia
(rising)
33%
Non-EU
Europe
excl. Russia
(unclear)
9%
China
(falling)
15%
East Asia
excl. China
(unclear) 3%
Middle
East
(unclear) 6%
Other
(unclear)
6%
Low-income states