milestone contractors, l .p. - purdue engineering · prepared in cooperation with the heritage...
TRANSCRIPT

Milestone Contractors, L.P.
FIELD EVALUATION OF POROUS ASPHALT PAVEMENT
Final Report SQDH 2004 – 3
HL 2004 - 6
By:
Rebecca S. McDaniel, Principal Investigator North Central Superpave Center
William D. Thornton, Research Assistant School of Mechanical Engineering
Jorge Gomez Dominguez, Visiting Professor School of Civil Engineering
Purdue University
Sponsored by: The Institute for Safe, Quiet and Durable Highways,
Heritage Research Group, and Milestone Contractors, L.P.
In Cooperation With: University Transportation Program U.S. Department of Transportation Approved by: Robert J. Bernhard, Director Vincent P. Drnevich, Co-Director The Institute for Safe, Quiet and Durable Highways
DISCLAIMER The contents of this report reflect the views of the authors, who are responsible for the facts and the accuracy of the information presented herein. This document is disseminated under the sponsorship of the U. S. Department of Transportation, University Transportation Centers Program in the interest of information exchange. The U. S. Government assumes no liability for the contents or use thereof.
May 2004
Technical Report Documentation Page 1. Report No.
SQDH 2004-3 2. Government Accession No.
3. Recipient's Catalog No.
5. Report Date May 2004
4. Title and Subtitle Field Evaluation of Porous Asphalt Pavement
6. Performing Organization Code
7. Author(s) Rebecca S. McDaniel, William D. Thornton, and Jorge Gomez Dominguez
8. Performing Organization Report No. HL 2004-6 10. Work Unit No. (TRAIS)
9. Performing Organization Name and Address North Central Superpave Center Purdue University 1205 Montgomery Street West Lafayette, IN 47906
11. Contract or Grant No. 13. Type of Report and Period Covered
Final Report
12. Sponsoring Agency Name and Address The Institute for Safe, Quiet, and Durable Highways Purdue University 140 S. Intramural Drive West Lafayette, IN 47907 – 2031 14. Sponsoring Agency Code
15. Supplementary Notes: Prepared in Cooperation with the Heritage Research Group and Milestone Contractors, L.P.
16. Abstract This report summarizes the construction and early performance of a field trial of a Porous Friction Course (PFC) in Indiana. The PFC is compared to an adjacent section of Stone Matrix Asphalt (SMA) constructed at the same time using the same binder, coarse aggregate and fiber. Those mixes are also compared to a similar conventional Hot Mix Asphalt (HMA) surface constructed one to two months earlier. This evaluation shows that the PFC produces significantly lower noise levels than the HMA and SMA as measured by both the pass-by and close-proximity methods. The SMA produces higher noise levels than the HMA. The PFC also had the highest surface texture, as measured by the Circular Texture Meter; the HMA had the lowest texture. Data from the Circular Texture Meter and Dynamic Friction Tester were combined to determine the International Friction Index (FN60). The PFC provided the highest friction value, followed by the SMA. Both the PFC and SMA had substantially higher friction values than the HMA even though they were tested before opening the road to traffic. The friction values for the PFC and SMA are expected to increase after traffic wears away the binder film coating the protruding aggregate particles. The PFC also reduced splash and spray and improved visibility during rain events, as observed qualitatively. Long term performance of the PFC should be monitored to determine how long these benefits last, but initially the PFC appears to offer an efficient and economical way to reduce noise and maintain or even improve friction and visibility.
17. Key Word flexible pavements, traffic noise, pavement friction, hot mix asphalt, pavement design, pavement performance, stone matrix asphalt (SMA), pavement texture, porous asphalt
18. Distribution Statement No restrictions. This document is available to the public through the National Technical Information Service, Springfield, VA 22161
19. Security Classif. (of this report) Unclassified
20. Security Classif. (of this page) Unclassified
21. No. of Pages
22. Price
Form DOT F 1700.7 (8-72) Reproduction of completed page authorized

Table of Contents
CHAPTER 1. INTRODUCTION ............................................................................................... 1
1.1 Problem Statement .......................................................................................................... 1
1.2 Objectives........................................................................................................................ 1
1.3 Scope ............................................................................................................................... 1
CHAPTER 2. LITERATURE REVIEW.................................................................................... 2
CHAPTER 3. MATERIALS AND MIXTURES......................................................................... 4
3.1 Aggregates and Binder..................................................................................................... 4
3.2 Mix Designs ..................................................................................................................... 4
3.2.1 Mixture Testing ............................................................................................................... 6
CHAPTER 4. FIELD EVALUATION........................................................................................ 8
4.1 Construction of Experimental Field Sections ................................................................... 8
4.2 Field Testing of Experimental Sections .......................................................................... 11
4.2.1 Noise Measurements ...................................................................................................... 12
4.2.2 Surface Texture Evaluation........................................................................................... 16
4.2.3 Dynamic Friction Measurements................................................................................... 17
4.2.4 Splash and Spray ........................................................................................................... 18
4.3 Future Considerations ................................................................................................... 21
CHAPTER 5. CONCLUSIONS................................................................................................ 22
Appendix A: Pass-By Data ..........................................................................................................................................................25

List of Tables
Table 1. Mix Design Parameters.........................................................................................................5 Table 2. Frequency Sweep Results on PFC Mix at 40C........................................................................7 Table 3. Averaged CPX Sound Pressure Levels .................................................................................14 Table 4. Averaged Pass-By Sound Pressure Levels ............................................................................15 Table 5. Circular Texture Meter Results ............................................................................................16 Table 6. Average DFT Number vs. Speed..........................................................................................17 Table 7. International Friction Index (F60) versus Pavement Type .......................................................18
List of Figures
Figure 1. Gradations of the Experimental Mixtures ..............................................................................6 Figure 2. Material Transfer Device Used on I74...................................................................................8 Figure 3. Paver Laying PFC on I74 .....................................................................................................9 Figure 4. Roller Train Used on I74......................................................................................................9 Figure 5. PFC Surface Texture..........................................................................................................10 Figure 6. SMA on Left Adjoining PFC on Right ................................................................................10 Figure 7. Conventional Pavement Surface Texture.............................................................................11 Figure 8. Pass-By Measurement Site (I74) and Microphone Setup ......................................................13 Figure 9. 1/3 Octave CPX Frequency Spectra for Goodyear Aquatread Tire at 72 kph..........................14 Figure 10. 1/3 Octave CPX Frequency Spectra for Goodyear Aquatread Tire at 97 kph ........................15 Figure 11. PFC (Left Foreground) vs. SMA (Right Background) after Rain .........................................19 Figure 12. PFC Surface after a Rain Event.........................................................................................20 Figure 13. SMA Surface after a Rain Event .......................................................................................20

ACKNOWLEDGEMENTS
Heritage Research Group and Milestone Contractors, LLC, initiated and partially funded this research. The Indiana Department of Transportation approved and participated in the project. The National Center for Asphalt Technology brought their trailer to Indiana from Alabama to perform close-proximity testing as well as Circular Texture Meter and Dynamic Friction Testing on the field test sections. The excellent cooperation and assistance of all of these groups are greatly appreciated.

ABSTRACT
This report summarizes the construction and early performance of a field trial of a Porous Friction Course (PFC) in Indiana. The PFC is compared to an adjacent section of Stone Matrix Asphalt (SMA) constructed at the same time using the same binder, coarse aggregate and fiber. Those mixes are also compared to a similar conventional Hot Mix Asphalt (HMA) surface constructed about one month earlier. This evaluation shows that the PFC produces significantly lower noise levels than the HMA and SMA as measured by both the pass-by and close-proximity methods. The SMA produces higher noise levels than the HMA. The PFC also had the highest surface texture, as measured by the Circular Texture Meter; the HMA had the lowest texture. Data from the Circular Texture Meter and Dynamic Friction Tester were combined to determine the International Friction Index (FN60). The PFC provided the highest friction value, followed by the SMA. Both the PFC and SMA had substantially higher friction values than the HMA even though they were tested before opening the road to traffic. The friction values for the PFC and SMA are expected to increase after traffic wears away the binder film coating the protruding aggregate particles. The PFC also reduced splash and spray and improved visibility during rain events, as observed qualitatively. Long term performance of the PFC should be monitored to determine how long these benefits last, but initially the PFC appears to offer an efficient and economical way to reduce noise and maintain or even improve friction and visibility.
1
CHAPTER 1. INTRODUCTION
Tire/pavement noise is a growing concern in urban areas and even suburban or rural areas near housing developments. Noise barrier walls can cost over one million dollars per mile and have limited effectiveness. Quieter pavement surfaces would be less expensive than barrier walls and could offer benefits over a larger area by reducing tire/pavement noise at its source.
European experience with porous asphalt pavements and stone matrix asphalts (SMAs) indicates that these pavement surfaces can reduce noise generation. In addition, these asphalt surfaces can offer benefits in terms of improved rut resistance, better wet weather traction and reduced splash and spray.
1.1 Problem Statement
The problem statement as written in the proposal for this project reads:
The Indiana Department of Transportation has limited experience with SMAs and virtually no experience with porous asphalt surfaces. There is a need to evaluate the performance of these types of surfaces, especially in terms of their effects on tire/pavement noise generation.
Since the time of the proposal, INDOT has gained experience with SMAs, but not with porous surfaces.
1.2 Objectives
The main objective of this research project was to evaluate the performance of porous asphalt and SMA surfaces compared to conventional asphalt surfaces. Performance was assessed in terms of tire/pavement noise generation as well as other performance measures. Acoustical properties of the pavements were measured, using both sideline noise measurements and the close-proximity trailer method for comparison purposes. The results of these tests allowed comparison of the noise generation and attenuation properties of the various surfaces. Ultimately, these results should be useful for development and verification of models to predict noise attenuation. Splash and spray were assessed qualitatively in the field.
A second objective of this research was to examine the relationship between noise measurements made in the field using the pass-by and close-proximity methods.
1.3 Scope
The performance evaluation included three field test sections. The porous friction course (PFC) and stone matrix asphalt (SMA) sections were constructed on Interstate Highway 74 east of Indianapolis. These adjacent sections were constructed by Milestone Contractors, LLC, in August 2003. The third section consisted of a conventional hot mix asphalt section located on US52 in West Lafayette that was paved in July 2003.
The evaluation of the experimental sections was conducted cooperatively by the North Central Superpave Center (NCSC) and the Institute for Safe, Quiet and Durable Highways (SQDH) with the cooperation of Heritage Research Group (HRG), the National Center for Asphalt Technology (NCAT), Milestone Contractors, LLC, and the Indiana Department of Transportation.

2
CHAPTER 2. LITERATURE REVIEW
Traditionally, roadway design has focused on providing a strong, durable and safe pavement for the motoring public. Increasingly, however, traffic noise is becoming an important factor. Tire pavement noise has been shown to be a major contributor to the overall noise level. (1) Noise barrier walls can be erected in an attempt to mitigate the noise, but experience and evidence is mounting to show that noise can be better and more economically controlled at the source by designing quieter pavement surfaces.
Traffic noise comes from two major sources, the power train and the tires. (2) Power train noise is generated by the engine, exhaust and cooling system. It can be mitigated by design features of the vehicle itself, but is unaffected by pavement design issues. Tire/pavement noise, however, can be reduced by designing the pavement surface so as to reduce the generation or propagation of noise. The design of the tire can also affect tire/pavement noise. The tire/pavement interaction is not simple; the noise generated at the interface depends on environmental conditions, the speed of the vehicle, type of tire, type of pavement surface and the dynamics of the rolling process.
Some European countries have successfully reduced tire noise on highways through the use of porous road surfaces. (2, 3, 4, 5) Porous asphalt mixes made with hard aggregates, a modified asphalt binder and stabilizing fibers are widely used. The structure of a porous asphalt surface contains interconnected voids, which can drain away rainwater during wet weather. The porous structure can also reduce tire/pavement noise by interfering with some noise generation mechanisms. Porous pavements have also proven to be durable, to possess good surface friction and to decrease splash and spray during rain events. (6)
Open graded friction courses (OGFCs) used in Indiana and other states in the past differ from porous asphalt. In general, OGFCs have had lower void percentages (10-15%); usually used unmodified binders, at least in Indiana; and were less durable than porous asphalt mixes. (7)
Porous asphalt mixes generally have strongly gap-graded aggregate gradations to yield higher air voids (18-22 percent). (7) High quality aggregates are needed to provide good aggregate interlock and long-lasting frictional properties. In Europe, the aggregate sizes used have changed from 14 mm to a range of 6 to 10 mm, resulting in higher air voids and reduced noise while maintaining good frictional properties. (8)
Aggregate quality and gradation affect friction by providing pavement surface texture, which is a combination of microtexture and macrotexture. The microtexture is the fine scale texture of the aggregates themselves and influences low speed frictional properties. The macrotexture is the overall pavement surface texture that provides drainage for water and affects the rate of decrease in frictional properties with increasing speed. (9)
Noise generated by the tire/pavement interaction dominates the noise produced by the power train at speeds over about 30-50 km/h for cars and 40-70 km/h for trucks. The noise-generating mechanisms include radial and tangential vibrations, air resonance and other mechanisms. (1, 2)
Some of the most common methods used to measure noise generated by tire/pavement interaction in the field are (1):
• Controlled pass-by method (CPB) • Statistical pass-by method (SPB) • Close-proximity method (CPX)

3
In the controlled pass-by method (CPB), a set of vehicle -tire combinations is chosen from a reference set. The vehicles then drive past a microphone placed 7.5 meters from the centerline of the measured lane and 1.2 meters above the roadway surface. The microphone measures the peak noise level as the vehicles pass by at specific speeds. (1)
In the statistical pass-by method (SPB), the noise measurements are made on the existing stream of traffic. The recorded noise is expressed in terms of A-weighted noise level (LAeq) defined over one hour or during peak traffic hours. The method uses the same microphone set up as the CPB. The speeds of vehicles in the traffic stream are measured by a radar tachometer. A regression analysis is usually performed on the average noise level versus the logarithm of speed for each vehicle; this analysis can be used to evaluate the noise level differences that may occur. (1)
The close-proximity method (CPX) uses a microphone or microphones mounted near a vehicle tire to measure noise. The number and location of microphones may vary, depending upon the amount of information needed. (1)

4
CHAPTER 3. MATERIALS AND MIXTURES
Three different mixtures were included in this research effort. The primary focus was on the PFC and SMA mixes constructed on the same experimental project on I-74. These two mixes are very similar in terms of the component materials used since both were used on the same project and were designed to reduce the variables between them. The conventional mixture was not designed as part of this experiment, but was instead selected from recently constructed projects to represent typical INDOT mixes. A recently completed project on US52 near West Lafayette was used as the field test site for the conventional HMA noise testing. Conventional mixtures in Indiana are designed according to Superpave specifications.
3.1 Aggregates and Binder
All of the mixtures evaluated used steel slag aggregate from the same source, though in different proportions and combined with various other aggregates and additives. (Details on the gradations and mix designs are provided in the next section.) The SMA and PFC mixes have the most in common, as noted above. The PFC was composed of 90% steel slag with 10% sand. The SMA consisted of 80% steel slag, 10% stone sand (from a different source than the PFC sand) and 10% mineral filler. The same binder, an SBS-modified PG76-22, was also used in these two mixes. The PFC included 0.3% cellulose fiber, and the SMA included 0.1% of the same fiber.
The conventional HMA consisted of steel slag coarse aggregate, from the same source as the PFC and SMA, blended 50-50 with coarse dolomite. The mix also contained dolomitic manufactured sand. A PG76-22 was included, but it was from a different source than that used in the PFC and SMA.
3.2 Mix Designs
The porous friction course was designed by Milestone Contractors with assistance from Heritage Research Group. Trial mixes were prepared and compacted to 20 gyrations in a Superpave Gyratory Compactor. The air void content was then measured. The target air void content was 18-22%. Table 1 shows the final mix design for the PFC in the second column. The gradations of all three mixes used in this research are shown graphically in Figure 1.
Following design of the PFC mixture, the Cantabro test was used to assess the durability of the mixture. This test consists of placing Marshall compacted specimens in an LA abrasion machine and revolving for 300 revolutions without the steel balls that are typically used in the LA abrasion test. The mass lost during this process, expressed as a percent of the original mass of the specimens, is the Cantabro mass loss. European specifications call for the mass loss to be less than 25% for unaged specimens and less than 30% for aged specimens. The maximum mass losses for specimens of this mix were 24.9% for the aged specimens and 15.0% for the unaged specimens.
The SMA was also designed by Milestone using the same steel slag, same fiber and same binder. The details are shown in the third column of Table 1. This mix was designed at an Ndesign level of 100 gyrations for a traffic category of 10 to 30 million ESALs. The SMA gradation was similar to the PFC in the larger sizes, but had much higher amounts passing the smaller sieve sizes, as shown in Figure 1. This is typical since the SMA was designed for 4% air voids versus 18-22% for the PFC. SMAs generally consist of a somewhat gap-graded aggregate structure with a high VMA to ensure good stone on stone contact. The space between the aggregate particles is then mostly filled with a mastic of binder (often polymer-modified, as in this case), fibers (cellulose) and mineral filler.
The fibers in both the PFC and the SMA help to keep the binder from flowing off the coarse aggregate particles, a phenomenon known as draindown. Modified binders and fibers are used to keep the binder in
5
the mix. Fibers also reinforce the mixes somewhat, which may help control rutting and cracking in the future.
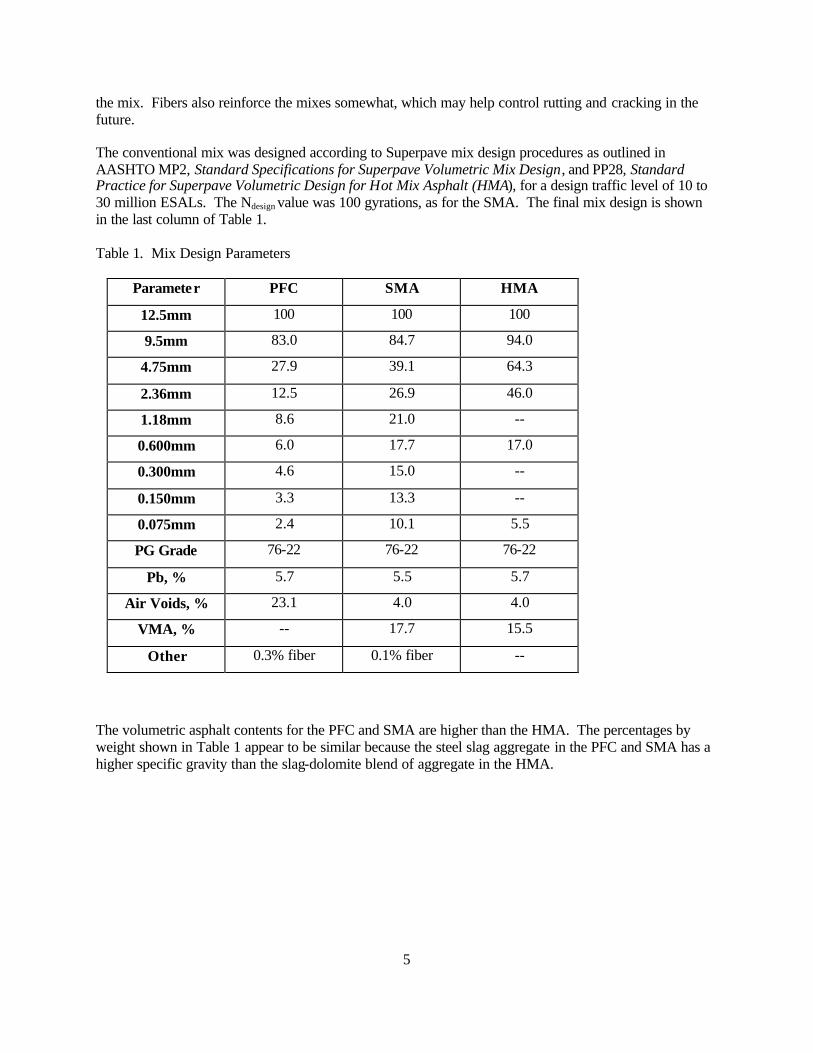
The conventional mix was designed according to Superpave mix design procedures as outlined in AASHTO MP2, Standard Specifications for Superpave Volumetric Mix Design, and PP28, Standard Practice for Superpave Volumetric Design for Hot Mix Asphalt (HMA), for a design traffic level of 10 to 30 million ESALs. The Ndesign value was 100 gyrations, as for the SMA. The final mix design is shown in the last column of Table 1.
Table 1. Mix Design Parameters
Parameter PFC SMA HMA
12.5mm 100 100 100
9.5mm 83.0 84.7 94.0
4.75mm 27.9 39.1 64.3
2.36mm 12.5 26.9 46.0
1.18mm 8.6 21.0 --
0.600mm 6.0 17.7 17.0
0.300mm 4.6 15.0 --
0.150mm 3.3 13.3 --
0.075mm 2.4 10.1 5.5
PG Grade 76-22 76-22 76-22
Pb, % 5.7 5.5 5.7
Air Voids, % 23.1 4.0 4.0
VMA, % -- 17.7 15.5
Other 0.3% fiber 0.1% fiber --
The volumetric asphalt contents for the PFC and SMA are higher than the HMA. The percentages by weight shown in Table 1 appear to be similar because the steel slag aggregate in the PFC and SMA has a higher specific gravity than the slag-dolomite blend of aggregate in the HMA.

6
Figure 1. Gradations of the Experimental Mixtures
3.2.1 Mixture Testing
During construction of the PFC and SMA mixtures, mixture production proceeded smoothly. No
significant mixture problems were observed, and no mixture quality penalties were assessed.
Samples of the PFC were collected by Heritage Research Group for shear testing for informational
purposes. Six cores were taken from the road and tested for density. Air voids ranged from 22.0% to
24.9% with an average of 22.5%. Air voids were measured using ASTM D3203-94, Standard Test
Method for Percent Air Voids in Compacted Dense and Open Bituminous Paving Mixtures, which
measures the dimensions of the specimen to calculate volume. Pairs of cores were glued together to get
sufficient height for testing, and three test specimens were tested using the Frequency Sweep (FS) test in
the Superpave Shear Tester (SST). This test applies a repeated sinusoidal shear load to produce a shear
strain of 0.005 percent at ten frequencies from 10 to 0.01 Hz. An axial load is applied during shearing to
keep the specimen height constant. This test is used to assess the shear modulus of the mixture.
The results of FS testing on three specimens of the PFC at 40°C are shown in Table 2 below. The results
are more variable than expected when testing more conventional mixtures. This may be due to the gap-
graded nature of the mixture.
0
20
40
60
80
100
Sieve
Cum
ulat
ive
% P
assi
ng
PFC SMA HMA
control points
0.075 0.15 0.6 1.18 2.36 4.75 9.5 12.5
7
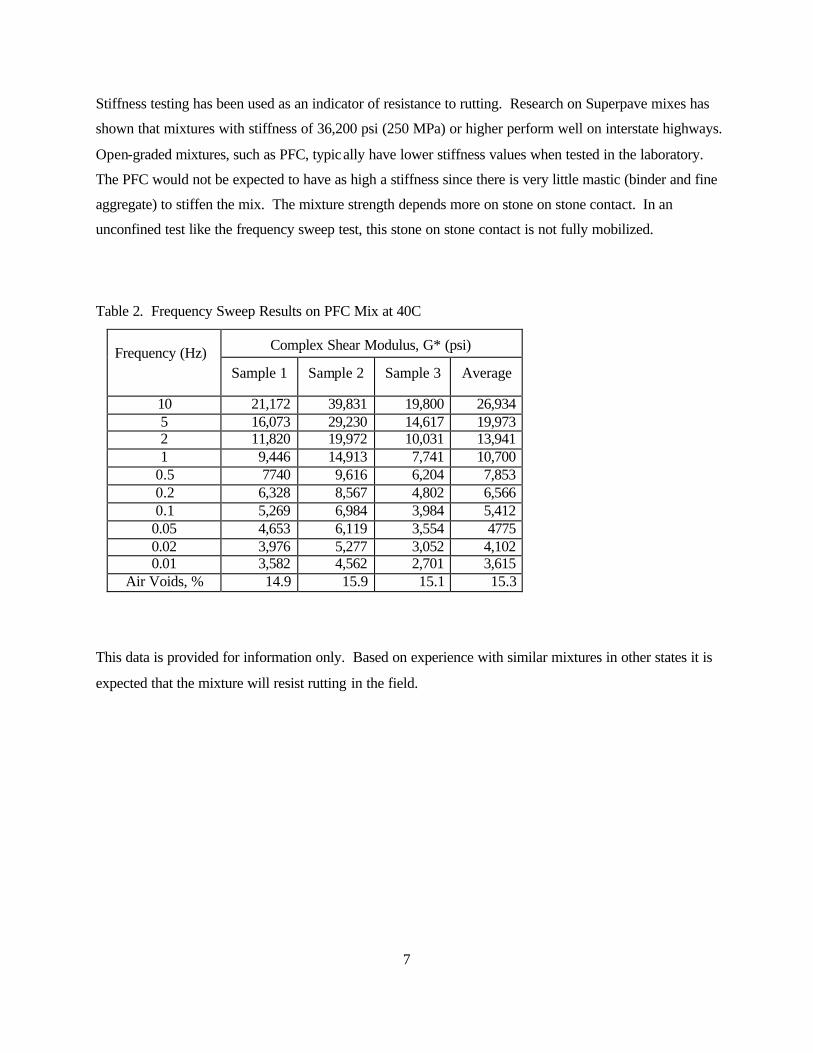
Stiffness testing has been used as an indicator of resistance to rutting. Research on Superpave mixes has
shown that mixtures with stiffness of 36,200 psi (250 MPa) or higher perform well on interstate highways.
Open-graded mixtures, such as PFC, typically have lower stiffness values when tested in the laboratory.
The PFC would not be expected to have as high a stiffness since there is very little mastic (binder and fine
aggregate) to stiffen the mix. The mixture strength depends more on stone on stone contact. In an
unconfined test like the frequency sweep test, this stone on stone contact is not fully mobilized.
Table 2. Frequency Sweep Results on PFC Mix at 40C
Complex Shear Modulus, G* (psi) Frequency (Hz) Sample 1 Sample 2 Sample 3 Average
10 21,172 39,831 19,800 26,934 5 16,073 29,230 14,617 19,973 2 11,820 19,972 10,031 13,941 1 9,446 14,913 7,741 10,700
0.5 7740 9,616 6,204 7,853 0.2 6,328 8,567 4,802 6,566 0.1 5,269 6,984 3,984 5,412
0.05 4,653 6,119 3,554 4775 0.02 3,976 5,277 3,052 4,102 0.01 3,582 4,562 2,701 3,615
Air Voids, % 14.9 15.9 15.1 15.3
This data is provided for information only. Based on experience with similar mixtures in other states it is
expected that the mixture will resist rutting in the field.

8
CHAPTER 4. FIELD EVALUATION
This chapter describes the construction and field testing of the three pavement sections. The field testing includes evaluation of tire/pavement noise, surface texture and friction. A qualitative assessment of splash and spray (water drainage) is also provided.
4.1 Construction of Experimental Field Sections
The PFC and SMA surfaces were constructed in August 2003 in the eastbound lanes of I74 between Post Road and Acton Road. Specific stations where field testing was conducted are detailed below.
Both mixes were placed using a material transfer device (MTD) to improve ride quality and reduce segregation, as shown in Figure 2. (Use of a material transfer device is quite common in Indiana.) The MTD transferred mix from the trucks into the hopper of a conventional paver, shown in Figure 3.
Figure 2. Material Transfer Device Used on I74
Compaction was accomplished with two steel wheeled rollers, shown in Figure 4. Only one pass with each roller was needed to seat the PFC. Due to the gap-graded nature of the PFC, there is extensive stone to stone contact between the coarse aggregate particles with very little mastic or fine material to “cushion” the coarse aggregates. Relatively little compactive effort is needed to get the coarse aggregates in contact. Over-rolling can lead to aggregate breakdown. Similar rollers and roller patterns were also used with the SMA.

9
Figure 3. Paver Laying PFC on I74
Figure 4. Roller Train Used on I74

10
The resulting surface texture of the PFC was quite porous and open, as expected. This is illustrated in Figure 5. The SMA, which is also a gap-graded mix, appears much denser, as shown in Figure 6. In the SMA, the void space between the coarse aggregate particles, which is left quite open in the PFC, is filled with a mastic of fine aggregates, mineral filler and binder.
Figure 5. PFC Surface Texture
Figure 6. SMA on Left Adjoining PFC on Right

11
The conventional HMA was placed on US52 in July 2003. This was a short section placed to correct surface deficiencies. Construction of this section was not observed. The surface texture of this pavement is shown in Figure 7 and is obviously much denser than the PFC.
Figure 7. Conventional Pavement Surface Texture
4.2 Field Testing of Experimental Sections
Field testing was conducted on the three experimental sections (PFC, SMA and HMA) to evaluate noise, surface texture and surface friction. Differences in the amount of splash and spray between the PFC and SMA were observed, but not quantified. These observations and the results of field testing are presented here.
It is important to remember that, for most of the testing reported here, the PFC and SMA were tested prior to opening the road to traffic. Traffic tends to wear away the binder coating on the asperities of the surface, exposing the aggregates to the tires. This generally results in an initial increase in friction. The conventional surface had been exposed to traffic for approximately three months prior to testing, so the binder film on the surface asperities had already been worn away. The influence of the binder film on noise properties is unknown, but is not expected to be significant. Its effect on friction is significant; friction levels will likely be several points higher after traffic has been on the pavement for two to three months.
Noise measurements were conducted in the field using the pass-by and close-proximity methods. The controlled pass-by testing was conducted August 28, 2003. The close-proximity measurements were taken on September 3, 2003.
12
4.2.1 Noise Measurements
To rank order the tire/pavement noise levels produced by the three types of hot mix asphalt surfaces, two complementary measurement procedures were performed. Measurements of tire/pavement noise were taken according to the close-proximity method in which microphones travel in close proximity to the tire and with a controlled pass-by method in which sideline noise measurements were taken. The same highway test sections were used in both cases.
It is important to note that the decibel scale used for noise data as presented in this report is a logarithmic scale rather than a linear scale. This difference is particularly important when comparing relative levels. Doubling the sound energy (source strength) increases the sound pressure level by 3 dB. (1)
4.2.1.1 Close-Proximity Noise Measurements
A series of measurements were performed by the National Center for Asphalt Technology (NCAT) using their close-proximity method (CPX) trailer to gather noise data for the HMA, SMA and PFC pavements. The trailer is instrumented and designed according to Draft Standard ISO/CD 11819-2: Acoustics - Measurement of the Influence of Road Surfaces on Traffic Noise—Part 2: The Close-Proximity Method. (10 ) The data produced during these measurements were reduced at Purdue University’s Institute for Safe, Quiet and Durable Highways to produce equivalent A-weighted sound pressure levels and 1/3 octave frequency spectra for the three asphalt pavements.
One measurement site was chosen for each type of surface. The SMA test section was centered on I74 East reference post 99 and the PFC test section was centered on reference post 97.3. This testing was conducted prior to opening the road to traffic. The site chosen for the conventional HMA testing was US 52 East, beginning at mile marker 45. This surface had been placed approximately three months prior to testing, during which time it was open to traffic. The noise testing was conducted under traffic.
Noise measurements were taken at two microphone locations on the NCAT CPX trailer, one on the leading edge of the tire and on the trailing edge of the tire during separate runs, as specified in the CPX draft standard. The data shown here was collected using a Uniroyal tire similar to that used in the pass-by testing and using a Goodyear Aquatread tire. Testing was conducted at speeds of 72 and 97 kph (45 and 60 mph).
4.2.1.2 Pass-By Noise Measurements
A series of measurements were conducted in order to rank order levels and to measure relative level differences of vehicle pass-by noise generated by vehicles on the three surfaces. Measurements were conducted using three vehicles, two passenger cars and one light truck. Measurement locations, procedures and vehicle speeds, though not the number and types of vehicles, were controlled according to ISO 11819-1: Acoustics - Measurement of the Influence of Road Surfaces on Traffic Noise - Part 1: Statistical Pass-By Method, making this a controlled pass-by adaptation. (11)
One measurement site was chosen for each type of surface such that the site met the criteria laid out in ISO 11819-1. The test sites used for the close-proximity noise measurements were also used for the pass-by measurements. This testing was conducted on the SMA and PFC prior to opening the road to traffic. The conventional HMA had been open to traffic for about three months prior to and during the pass-by testing.
A type-1 sound level meter was placed 7.5 meters perpendicularly from the center of the traffic lane being measured and 1.2 meters above the plane of the traffic lane as prescribed in the ISO standard. (See Figure

13
8.) During each vehicle pass-by the maximum A-weighted sound pressure level was measured using Fast time weighting (LAFmax). Measurements were conducted at 80 and 110 kph (50 and 68 mph).
Figure 8. Pass-By Measurement Site (I74) and Microphone Setup
Three vehicles, a 2003 Chevrolet Impala, a 1996 Volvo 850 station wagon and a 2000 Chevrolet Silverado 1500 truck were used for the testing. These vehicles drove past the measurement sites at designated speeds. A sufficient number of pass-bys were conducted by each vehicle at each speed such that three measurements were obtained for which there was high confidence that the vehicle was the dominant and only significant source of the measured noise and that these measured levels were within approximately 1 decibel of each other for a given vehicle and speed. Measurement was not possible on the conventional HMA at 110 kph due to speed limits.
These vehicles were all equipped with passenger vehicle tires in good condition such that the majority of the tread depth remained. The Impala was equipped with Uniroyal Tigerpaw P225/60R16, the Volvo with Pirelli Sport Veloce P205/55 R16 and the Silverado with Goodyear Wrangler ST P235/75R16 tires.
14
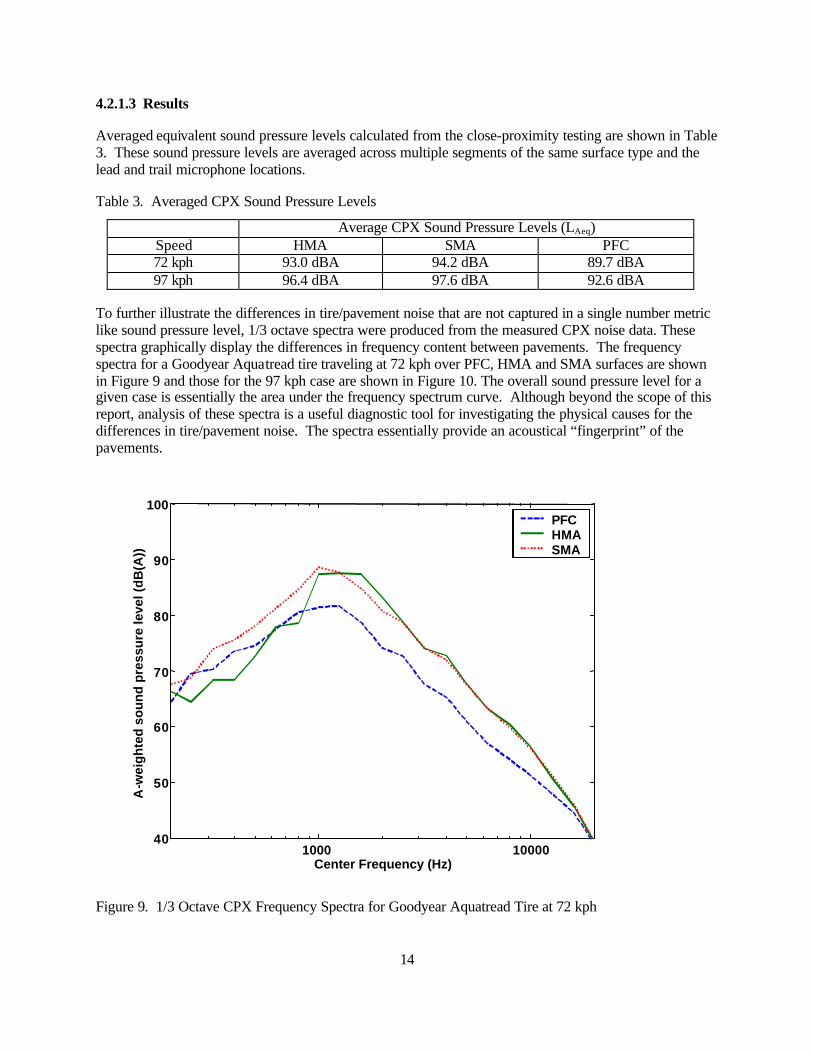
4.2.1.3 Results
Averaged equivalent sound pressure levels calculated from the close-proximity testing are shown in Table 3. These sound pressure levels are averaged across multiple segments of the same surface type and the lead and trail microphone locations.
Table 3. Averaged CPX Sound Pressure Levels
Average CPX Sound Pressure Levels (LAeq) Speed HMA SMA PFC 72 kph 93.0 dBA 94.2 dBA 89.7 dBA 97 kph 96.4 dBA 97.6 dBA 92.6 dBA
To further illustrate the differences in tire/pavement noise that are not captured in a single number metric like sound pressure level, 1/3 octave spectra were produced from the measured CPX noise data. These spectra graphically display the differences in frequency content between pavements. The frequency spectra for a Goodyear Aquatread tire traveling at 72 kph over PFC, HMA and SMA surfaces are shown in Figure 9 and those for the 97 kph case are shown in Figure 10. The overall sound pressure level for a given case is essentially the area under the frequency spectrum curve. Although beyond the scope of this report, analysis of these spectra is a useful diagnostic tool for investigating the physical causes for the differences in tire/pavement noise. The spectra essentially provide an acoustical “fingerprint” of the pavements.
1000 10000 40
50
60
70
80
90
100
Center Frequency (Hz)
A-w
eig
hte
d s
ou
nd
pre
ssu
re le
vel (
dB
(A))
PFC HMA SMA
Figure 9. 1/3 Octave CPX Frequency Spectra for Goodyear Aquatread Tire at 72 kph

15
1000 10000 40
50
60
70
80
90
100
Center Frequency (Hz)
A-w
eig
hte
d s
ou
nd
pre
ssu
re le
vel (
dB
(A))
PFC HMA SMA
Figure 10. 1/3 Octave CPX Frequency Spectra for Goodyear Aquatread Tire at 97 kph
Averaged measured sound pressure levels for the pass-by measurements for each vehicle, speed and mix type are shown in Table 4. (The full data set is shown in Appendix A.) These levels are the average of three measured vehicle pass-bys meeting the criteria stated in the previous section.
Table 4. Averaged Pass-By Sound Pressure Levels
Average Pass-By Sound Pressure Level (LAfmax) Speed Vehicle HMA SMA PFC
Impala 72.6 dBA 74.8 dBA 68.1 dBA Volvo 75.2 dBA 75.5 dBA 70.1 dBA
80 kph
Silverado 74.5 dBA 77.0 dBA 71.6 dBA Impala NA 78.5 dBA 71.7 dBA Volvo NA 80.5 dBA 74.3 dBA
110 kph
Silverado NA 79.4 dBA 74.4 dBA

16
4.2.1.4 Summary
Based upon the measured vehicles and speeds, the Porous Friction Course produced the lowest measured tire/pavement noise levels, the Conventional Hot Mix Asphalt surface produced the next lowest noise levels, and the Stone Matrix Asphalt produced the highest noise levels. The rank ordering of the tire/pavement noise produced by the three asphalt types was the same for both the CPX and Pass-By testing.
When the pass-by noise levels were averaged across the vehicles and the Porous Friction Course Asphalt surface used as the reference level and thus 0 dB, the SMA produced pass-by noise levels at 80 kph (50 mph) that were 5.9 dB higher than the PFC and the HMA produced pass-by noise levels at the same speed that were 4.2 dB higher than the PFC. At 110 kph (68 mph), the SMA produced pass-by noise levels that were 5.0 dB higher than the PFC; the HMA could not be tested at 110 kph.
When the close-proximity noise levels were averaged across the speeds and the Porous Friction Course Asphalt surface used as the reference level and thus 0 dB, the SMA produced noise levels that were 4.8 dB higher than the PFC and the HMA produced pass-by noise levels that were 3.6 dB higher than the PFC. The relative differences in sound pressure level were similar at the two different speeds.
As expected, the CPX measurements show higher noise levels than the pass-by measurements at similar speeds. The CPX method measures sound very close to the tire or source of the noise, before it can be attenuated over distance.
4.2.2 Surface Texture Evaluation
The surface texture of the three pavements was measured by NCAT using the Circular Texture Meter (CTM) as described in ASTM E 2157-01. The CTM uses a charge coupled device (CCD) laser displacement sensor to measure the surface profile. The laser sensor is mounted on an arm that rotates around a central point at a fixed distance above the pavement and measures the change in elevation of points on the surface. The laser spot size is 70 µm (2.76 × 10⁻³ in) and the vertical resolution is 3 µm (0.12 × 10⁻³ in). The CTM collects data around the circumference of a circle 284 mm (11.2 in) in diameter.
The results of the texture measurements on the three pavements evaluated in this project are summarized in Table 5. Five tests were taken in the PFC section and five in the SMA section in the areas where the noise measurements were taken. Only three measurements could be taken in the conventional HMA section due to traffic control and timing considerations.
Table 5. Circular Texture Meter Results
Pavement Type Mean Profile Depth, mm (Standard Deviation)
PFC 1.37 (0.13)
SMA 1.17 (0.14)
Conventional 0.30 (0.05)

17
This data shows that the PFC and SMA both have significantly more texture depth than the conventional surface, with the PFC having the highest depth. The PFC and SMA also have more variability, as indicated by the higher standard deviations. This seems reasonable; the conventional surface has a more uniform gradation, which would produce a more uniform surface texture. The PFC and SMA have gap-graded aggregate structures, so there could be more variability from one location to another. The coefficients of variation are still less than 12%. For the SMA, the texture is somewhat lower than that of the PFC due to the presence of the mastic of asphalt binder and fibers.
4.2.3 Dynamic Friction Measurements
The Dynamic Friction Tester (DFT) is a portable device that allows direct measurement of the surface friction of a variety of surfaces, including pavements. The testing and data analysis are standardized under ASTM E 1911-98. The DFT consists of a horizontal spinning disk fitted with three spring-loaded rubber sliders that contact the surface. The standard sliders are made of the same type of rubber used in friction test tires, though other materials are available for other applications. The disk rotates at tangential velocities up to 80 kph (55 mph). Water flows over the surface being tested, so wet friction is measured as done with the towed friction trailer. The rotating disk is then dropped onto the wet surface and the friction is continuously measured as the disk slows. This continuous measurement allows determination of the speed dependency of the surface friction. The DFT is affected by both the microtexture and macrotexture of the surface.
NCAT also measured the pavement friction with the DFT in September 2003. The results are shown in Table 6. DFT measurements were made in the same locations as the CTM measurements; that is, at five locations in the PFC section, five in the SMA and three in the HMA, in the areas where the noise measurements were made. The DFT and CTM were designed to work together, each measuring the same footprint on the pavement.
Table 6. Average DFT Number vs. Speed
Average DFT Number (Standard Deviation) Pavement Type
20 kph (12 mph) 40 kph (24 mph) 60 kph (36 mph)
PFC 0.51 (0.03) 0.45 (0.03) 0.42 (0.03)
SMA 0.37 (0.01) 0.31 (0.01) 0.29 (0.01)
Conventional HMA 0.52 (0.01) 0.47 (0.01) 0.44 (0.01)
This data shows that, initially, the SMA has a lower DFT value than the PFC or the conventional surfaces, which are fairly comparable, at all speeds. Since the SMA consists of a “bony” aggregate skeleton filled with a mastic of asphalt binder and fibers, the lower friction values are not unexpected when compared to mixtures with less binder and a more open texture. It is expected, however, that the friction of both the SMA and the PFC will increase when traffic wears away the asphalt coating and exposes the steel slag aggregate at the surface. The PFC would be expected to have a higher friction value due to its higher macrotexture unless or until the surface texture is lost or clogged with fines. The friction values do decrease as the speed increases, as expected. The rate of decrease appears to be fairly constant among the mixture types at this time. The data also seems to show that the PFC is more variable than the other two surfaces, since it has a higher standard deviation. The variability is still quite low, however; this standard deviation yields a coefficient of variation of about 5%, which is quite good. Coefficients of variation as high as 15-20% are

18
not uncommon for typical construction materials testing. Follow-up testing will be performed after traffic has had a chance to wear away the film coating to see if the PFC increases in friction and, possibly, decreases in variability.
When used with the Mean Profile Depth from the CTM, the DFT can be used to determine the International Friction Index, as summarized in Table 7. The IFI is calculated as follows:
F60 = 0.081 + 0.732 * DFT20 * e[-40/(108.1 * MPD-1.3)] where MPD = texture depth from CT Meter and DFT20 = the value at 20 kph from the DF Tester
Table 7. International Friction Index (F60) versus Pavement Type
Surface CTM DFT at 20 F 60
PFC 1.37 0.51 0.36
SMA 1.17 0.37 0.28
Conventional 0.30 0.52 0.19
This data shows the strong influence of the pavement macrotexture on frictional resistance. Although the PFC and conventional surfaces had similar DFT readings, the texture depth was much greater for the PFC. This resulted in a much higher value for the F60 value. The SMA had an F60 value between those of the PFC and conventional surfaces, as expected.
4.2.4 Splash and Spray
No quantified measurements of splash and spray have yet been conducted, though attempts may be made in the future. Visual observations of splash and spray were made, however. During one rainstorm event, the observed splash and spray in the PFC section was considerably less than in the adjoining SMA section. Sight conditions for the driver were significantly improved, even when passing or passed by semi-trailer trucks, which typically produce large amounts of splash and spray. A video showing the difference in splash and spray between the PFC and SMA, can be viewed on the NCSC website at http://bridge.ecn.purdue.edu/~spave/Steering%2 0Committee/Meeting%20Minutes%20NCSC.htm. This video was shot by Wayne Jones of the Asphalt Institute.

19
Figure 11. PFC (Left Foreground) vs. SMA (Right Background) during Light Rain
Figure 11 shows a car sitting at the junction between the PFC, shown in the left foreground, and the SMA, in the right background, during a light rain event. The PFC obviously has less standing water at the surface. This photograph was taken before the road was opened to traffic. Traffic would likely blow water off the SMA, so standing water is not expected.
Figures 12 and 13 show close up photographs of the PFC and the HMA shoulder surfaces respectively during the same rain event. Again, the PFC is obviously draining the water from the surface, while the HMA is not. This is not the same HMA surface used for noise and friction testing, but is the shoulder on I74.

20
Figure 12. PFC Surface during a Rain Event
Figure 13. HMA Surface during the Same Rain Event

21
4.3 Future Considerations
When INDOT used OGFC surfaces many years ago, they experienced problems with the surface voids clogging, especially when abrasives were used for snow and ice control. There is, therefore, a concern over how long the benefits of the PFC will be maintained. If the surface texture becomes clogged or decreased, will the PFC lose its frictional, noise control and splash and spray properties?
Today’s PFC mixes are designed with higher air voids than the OGFCs on the theory that traffic will expel fine material from the pores, preventing this loss of texture. European experience suggests that this theory holds true for properly designed and constructed porous mixtures. Nonetheless, it would be useful to continue monitoring of these test sections to determine if and when the PFC begins to lose its surface texture and other properties. A follow-up monitoring project has been proposed to INDOT and istentatively programmed for FY 2005. That study will continue monitoring the test sites for four years. Surface texture will be measured with the CTM, friction will be measured with both the DFT and towed friction trailer, and sideline noise measurements will be made using the statistical pass-by method. CPX measurements may be made as well, if the opportunity arises to have NCAT return to Indiana. Overall pavement performance will be determined through visual inspection. Brief annual reports will be submitted with a detailed report at the conclusion of the monitoring period. This longer-term evaluation will assist INDOT in determining if porous friction courses can perform as well under Indiana conditions as the initial performance suggests.

22
CHAPTER 5. CONCLUSIONS
Based upon this field evaluation of an experimental porous friction course (PFC) surface to a Stone Matrix Asphalt (SMA) and a conventional Superpave hot mix asphalt (HMA), the following conclusions can be drawn:
• Acceptable PFC mixtures can be designed using Indiana materia ls. Mixture volumetric and Cantabro mass loss requirements were met using steel slag aggregate, polymer modified binder and a fiber.
• The PFC had a more open gradation than the SMA. Both mixes were significantly more gap-graded than conventional Superpave HMA mixtures.
• The PFC did exhibit fairly low complex shear moduli when tested in the Frequency Sweep test in the Superpave Shear Tester at 40°C. Due to the reliance of this type of mixture on stone on stone contact, rather than a close packing of aggregates held together by a mastic of binder and fines, a high modulus would not be expected in an unconfined test. Without confining pressure, the stone on stone contact is not fully mobilized.
• Construction of the PFC and SMA mixtures proceeded smoothly with no major problems noted. Conventional equipment was used to produce, place and compact the mixes. Two steel wheeled rollers each applied one pass to seat the PFC; over-rolling should be avoided.
• The surface texture of the PFC is visually more open than the SMA. The HMA exhibited an even more uniform, dense surface by comparison.
• The noise, friction and surface texture measurements reported here for the PFC and SMA mixes were made before the road was opened to traffic. Traffic action would be expected to wear away the binder film coating on the protruding aggregates, increasing the surface friction. The effects of the binder film on noise properties are not expected to be significant.
• Both close-proximity and pass-by noise testing showed that the PFC produced the lowest measured tire/pavement noise levels, the conventional HMA produced the next lowest noise levels and the SMA produced the highest noise levels.
• Close-proximity testing at two different speeds showed the HMA to produce noise levels that were 3.6 dB higher than the PFC, and the SMA produced noise levels that were 4.8 dB higher than the PFC.
• Pass-by noise measurements at 80 kph (50 mph) showed that the HMA produced noise levels that were 4.2 dB higher than the PFC, and the SMA produced noise levels that were 5.0 dB higher than the PFC.
• Since the decibel scale is logarithmic, not linear, these differences in noise level are significant.
• Surface texture measurements using the Circular Texture Meter confirmed that the PFC had a much higher surface texture than the conventional HMA. The SMA also had a higher surface texture than the HMA, but not as high as the PFC.
• The PFC also provided higher friction than the HMA and SMA in terms of International Friction Index. The PFC and SMA friction values are expected to increase after traffic wears away the binder film coating.
• Visual observations of splash and spray show that the PFC does significantly reduce water on the pavement surface, resulting in better visibility for drivers.

23
• Long term performance of the PFC section should be monitored to determine how long the improved performance will last. A follow-up monitoring project has been proposed to INDOT and tentatively programmed.
In summary, the PFC section placed here did exhibit lower noise levels, improved friction and reduced splash and spray compared to an SMA and a conventional HMA surface. PFC may offer an effective and economical way to reduce noise while maintaining, or even improving, friction and visibility. The long term performance of PFC under Indiana conditions should be determined before extensive use is made of this type of mixture, but at this point it appears very promising.
24
References
1. Synthesis of Highway Practice 268. Relationship Between Pavement Surface and Highway Traffic Noise. Roger L. Wayson. National Cooperative Highway Research Program. National Academy Press. Washington, D.C. 1998.
2. “Influence of Road Surface Roughness on Tire Noise Generation in the Federal Republic of Germany.” Siegfried Huschek. Surface Characteristics of Roadways: International Research and Technologies, ASTM STP 1031, W.E. Meyer and J. Reichert, Eds. American Society for Testing and Materials, Philadelphia, 1990.
3. “Designing Porous Road Surfaces to Reduce Traffic Noise.” P.M. Nelson. TRL Annual Review. Crowthorne, Berkshire, RG45 GAU, United Kingdom. 1994.
4. “Low-Noise Road Surface Techniques and Materials.” G. Descornet. The 29th International Congress and Exhibition on Noise Control Engineering. Nice, France. 2000.
5. “Analysis and Evaluation of the Performance of Porous Asphalt: The Spanish Experience.” Felix E. Perez Jimenez and Miguel A. Calzada Perez. Surface Characteristics of Roadways: International Research and Technologies, ASTM STP 1031, W.E. Meyer and J. Reichert, Eds. American Society for Testing and Materials, Philadelphia, 1990.
6. “Thinking Green with Porous Asphalt.” Dan Brown. Hot Mix Asphalt Technology. May/June 2003.
7. Synthesis of Highway Practice 284. Performance Survey on Open-Graded Friction Course Mixes. Gerald Huber. National Cooperative Highway Research Program. National Academy Press. Washington, DC. 2000.
8. “Asphalt Paves a Quieter Street.” Asphalt Contractor. http://www.asphalt.com. March 2000.
9. Identification of Laboratory Techniques to Optimize Superpave HMA Surface Friction Characteristics. Rebecca McDaniel and Brian J. Coree. Institute for Safe, Quiet and Durable Highways. Report No. SQDH 2003-6. http://widget.ecn.purdue.edu/~sqdh/. 2003.
10. International Organization for Standardization, Acoustics - Measurement of the Influence of Road Surfaces on Traffic Noise - Part 2: The Close-Proximity Method, Draft Standard ISO/CD 11819-2, Geneva, Switzerland: ISO/TC 43/SC 1/WG 33, December 2000.
11. International Organization for Standardization, Acoustics - Measurement of the Influence of Road Surfaces on Traffic Noise - Part 1: Statistical Pass-By Method, ISO 11819-1, Geneva, Switzerland: ISO/TC 43/SC 1, September 1997.

25
Appendix A: Pass-By Data
Pass-By Data for Five Passes
LAFmax LAFmax
Porous Friction Course (PFC) 80 kmh 110 kmh
Chevrolet Impala 68.2 67.3 69.0 68.0 68.1 71.4 72.4 71.0 72.0 71.6
Chevrolet Silverado 1500 71.7 72.1 70.3 71.2 72.6 73.9 75.2 74.2 74.5 74.1
Volvo 850 70.6 70.4 69.3 69.4 70.9 74.4 74.1 73.7 75.6 73.7
Stone Matrix Asphalt (SMA) 80 kmh 110 kmh
Chevrolet Impala NA 74.8 74.8 74.9 NA 77.8 79.2 78.9 77.9 78.5
Chevrolet Silverado 1500 77.0 77.0 76.8 77.2 NA NA 79.3 79.7 79.0 79.7
Volvo 850 NA 75.6 75.6 75.3 NA 80.2 80.4 80.7 80.3 80.8
Conventional (HMA) 80 kmh 110 kmh
Chevrolet Impala 72.9 72.5 72.4 72.8 72.4 NA NA NA NA NA
Chevrolet Silverado 1500 74.0 74.4 75.0 74.5 74.6 NA NA NA NA NA
Volvo 850 75.2 74.8 75.4 75.4 75.2 NA NA NA NA NA