milang/clayton bay/ message from mayor and chief executive ... fold out... · c o n n e c t i n g c...
TRANSCRIPT

C o n n e C t i n g C o m m u n i t i e s
At the conclusion of the Alexandrina Council Community strategic
Plan 2009-13, Council has successfully met its objectives and achieved strong results for our community including a salinity target for Lake Alexandrina in the murray-Darling Basin Plan, a redeveloped Council, community centre and swimming pool in strathalbyn, enhanced streetscape and wetlands in mount Compass and strengthening water management in goolwa-Hindmarsh island. many other exciting projects and works can be seen in middleton, Port elliot, Langhorne Creek and milang – improving the amenity of all our townships.
Alexandrina: Connecting Communities – 2014-23 Community strategic Plan (our Community Plan) is part of a statutory process under Local government Act 1999, section 122 – strategic management Plans.
Alexandrina Council acknowledges the ngarrindjeri People’s ongoing connection to the land and waters within its area and is extremely proud to mark ten years as a signatory to the Kungun ngarrindjeri Yunnan Agreement, signed on 8 october 2002.
our community has an optimistic future. Population growth will buoy our vibrant community over coming decades while demographic and climate change act as a platform for us to strive to care for our unique environs on behalf of future generations.
Alexandrina: Connecting Communities is backed by shared passion to act now not later, to lead locally and regionally; to pursue national opportunities and adapt to global trends. our Community Plan is our guide to reflect these – the interests of our community – and seek to progress them over the coming ten years.
Activate our spaces
innovate throughout our Region
Participate in Wellbeing
thrive in Clean green
Futures
ALEXANDRINA CONNECTING
COMMUNITIES
RESILIENT Economy
PROTECTION of Water Resources
PRODUCTIVE Community Assets
PROGRESSIVE Approaches to Climate Change
PROACTIVE Leadership &
Accountability
ENHANCED Biodiversity
VIBRANT Communities
SELF-SUSTAINING Communities
ACCESSIBLE Services & Opportunities
COLLABORATIVE Community Ventures
LIVEABILITY Of Townships & Rural Areas
MEMORABLE Experiences
our Vision: Alexandrina Connecting Communitiesmodel of Alexandrina Connecting Communities – Vision; Aspirations and outcomes
message from mayor and Chief executive
Alexandrina’s small Area ProfilesHow many people are likely to be part of our communities in coming years and how old will they be?
We are also honoured to mark the ten year anniversary of the Kungun Ngarrindjeri Yunnan Agreement and a strong relationship with the traditional owners of the lands and waters in our district, the Ngarrindjeri people.
It is now time to establish community aspirations and priorities from 2014 – 23 and strive to meet a new vision ‘Alexandrina Connecting Communities.’
We commend the Alexandrina Connecting Communities 2014-23 Community Strategic Plan to all interested stakeholders, and look forward to walking the pathway to satisfying and rewarding results with you – our community and partners.
With our best wishes
Kym McHugh mayor
Peter Dinning Chief executive
milang/Clayton Bay/ Langhorne Creek
POPULATION2006 – 2,940 (base)2011 – 2,799 (recent)2031 – 3,124 (forecast)
gRoWtH 2006-11: -0.98% avg annual
tRenD: Small growth with forecast average annual growth to 2031 of 0.24%.
strathalbyn
POPULATION2006 – 5,702 (base)2011 – 6,718 (recent)2031 – 8,377 (forecast)
GROwTH 2006-11: 3.33% avg annual
TREND: Slowing with forecast average annual growth to 2031 of 1.55%.
mount Compass / Ashbourne
POPULATION2006 – 2,608 (base)2011 – 3,158 (recent)2031 – 3,234 (forecast)
GROwTH 2006-11: 2.68% avg annual
TREND: Slowing with forecast average annual growth to 2031 of 0.86%.
Port elliot/middleton
POPULATION2006 – 2,992 (base)2011 – 3,303 (recent)2031 – 4,106 (forecast)
GROwTH 2006-11: 2% avg annual
TREND: Steady to slowing with forecast average annual growth to 2031 of 1.27%.
Source: ABS Regional Population Growth Cat 3218.0, released 22 July 2012. (http://www.abs.gov.au/ausstats/[email protected]/mf/3218.0 and as depicted in Alexandrina Profile ID by Informed Decisions at http://profile.id.com.au/alexandrina/ )
Alexandrina Community Population ProfileHow many people are likely to be part of our broader Alexandrina community in coming years?
Alexandrina Local government AreaPOPULATION2006 – 21,496 (base)2011 – 24,055 (recent)2031 – 33,132 (forecast)
ReCent gRoWtH: 1.3%
tRenD: Slowing from 2006 levels of over 3.0%. Continuing growth is forecast with average annual population growth from 2006 to 2031 of 1.75% (an additional 11,636 persons).
our strategic Priorities (including links to sA strategic Plan targets):
Alexandrina Connecting Communities strategic Priorities
sA strategic Plan (2011) Linkages as an Alliance member
SA Seven Key Priority Areas (2012)
RDA Roadmap (2012) Adelaide Hills, Fleurieu and Kangaroo island
Inspiring Regional Excellence T38 – Business investment
T35 – Economic growth
T37 – Total exports
T46 – Regional Population Levels
Growing Advanced Manufacturing
Goal Area 2: Partnerships in Policy, Planning, Projects and Programs
Goal Area 4: Business and Industry Growth
Alexandrina Experiences ‘Just Add…’
T1 – Urban spaces
T3 – Cultural vibrancy; arts
T4 – Tourism industry
T99 – Cultural engagement; institutions
Creating a vibrant city
Goal Area 1: Knowledge, Understanding and Promotion
Something For Every Age, At Every Stage
T7 – Affordable housing
T12 – Early childhood
T23 – Social participation
T24 – Volunteering
T83 – Sport and recreation
An affordable place to live and Every chance for every child
Goal Area 3: Community Building
Climate-ready Communities T59 – Greenhouse gas emissions
T62 – Climate change adaptation
T64 – Renewable energy
T67 – Zero waste
T70 – Sustainable land management
T72 – Nature conservation
T75 – Sustainable water use
T76 – River Murray: Flows
T77 – River Murray: Salinity
Safe communities, healthy neighbourhoods
Goal Area 3: Community Building
Grow, Eat, Share T40 – Food industry
T76 – Healthy South Australians
Premium food and wine from our clean environment
Goal Area 4: Business and Industry Growth
Fleurieu Transport and Trails Network
T56 – Strategic infrastructure
T63 – Use of public transport
Realising the benefits of the mining boom for all
Goal Area 5: Infrastructure Provision and Maintenance
our mission: Be involvedLiving an inspiring vision Inspired employees go the extra mile
Communicating our strategies and goals A clear strategy points employees in the right direction
Developing our people High performing people drive organisational results
Recognising our people Saying thanks makes a big difference
Caring for our people Demonstrating that we care
Listening and adapting to our customers’ needs Creating long term customer relationships
Continually improving our systems Appropriate systems support performance
effective management of
Council’s assets at an agreed standard
of service
ensure that
we understand the impact of
decisions made today on our
future
targets to achieve a
break even position in the
long term
Financial sustainability
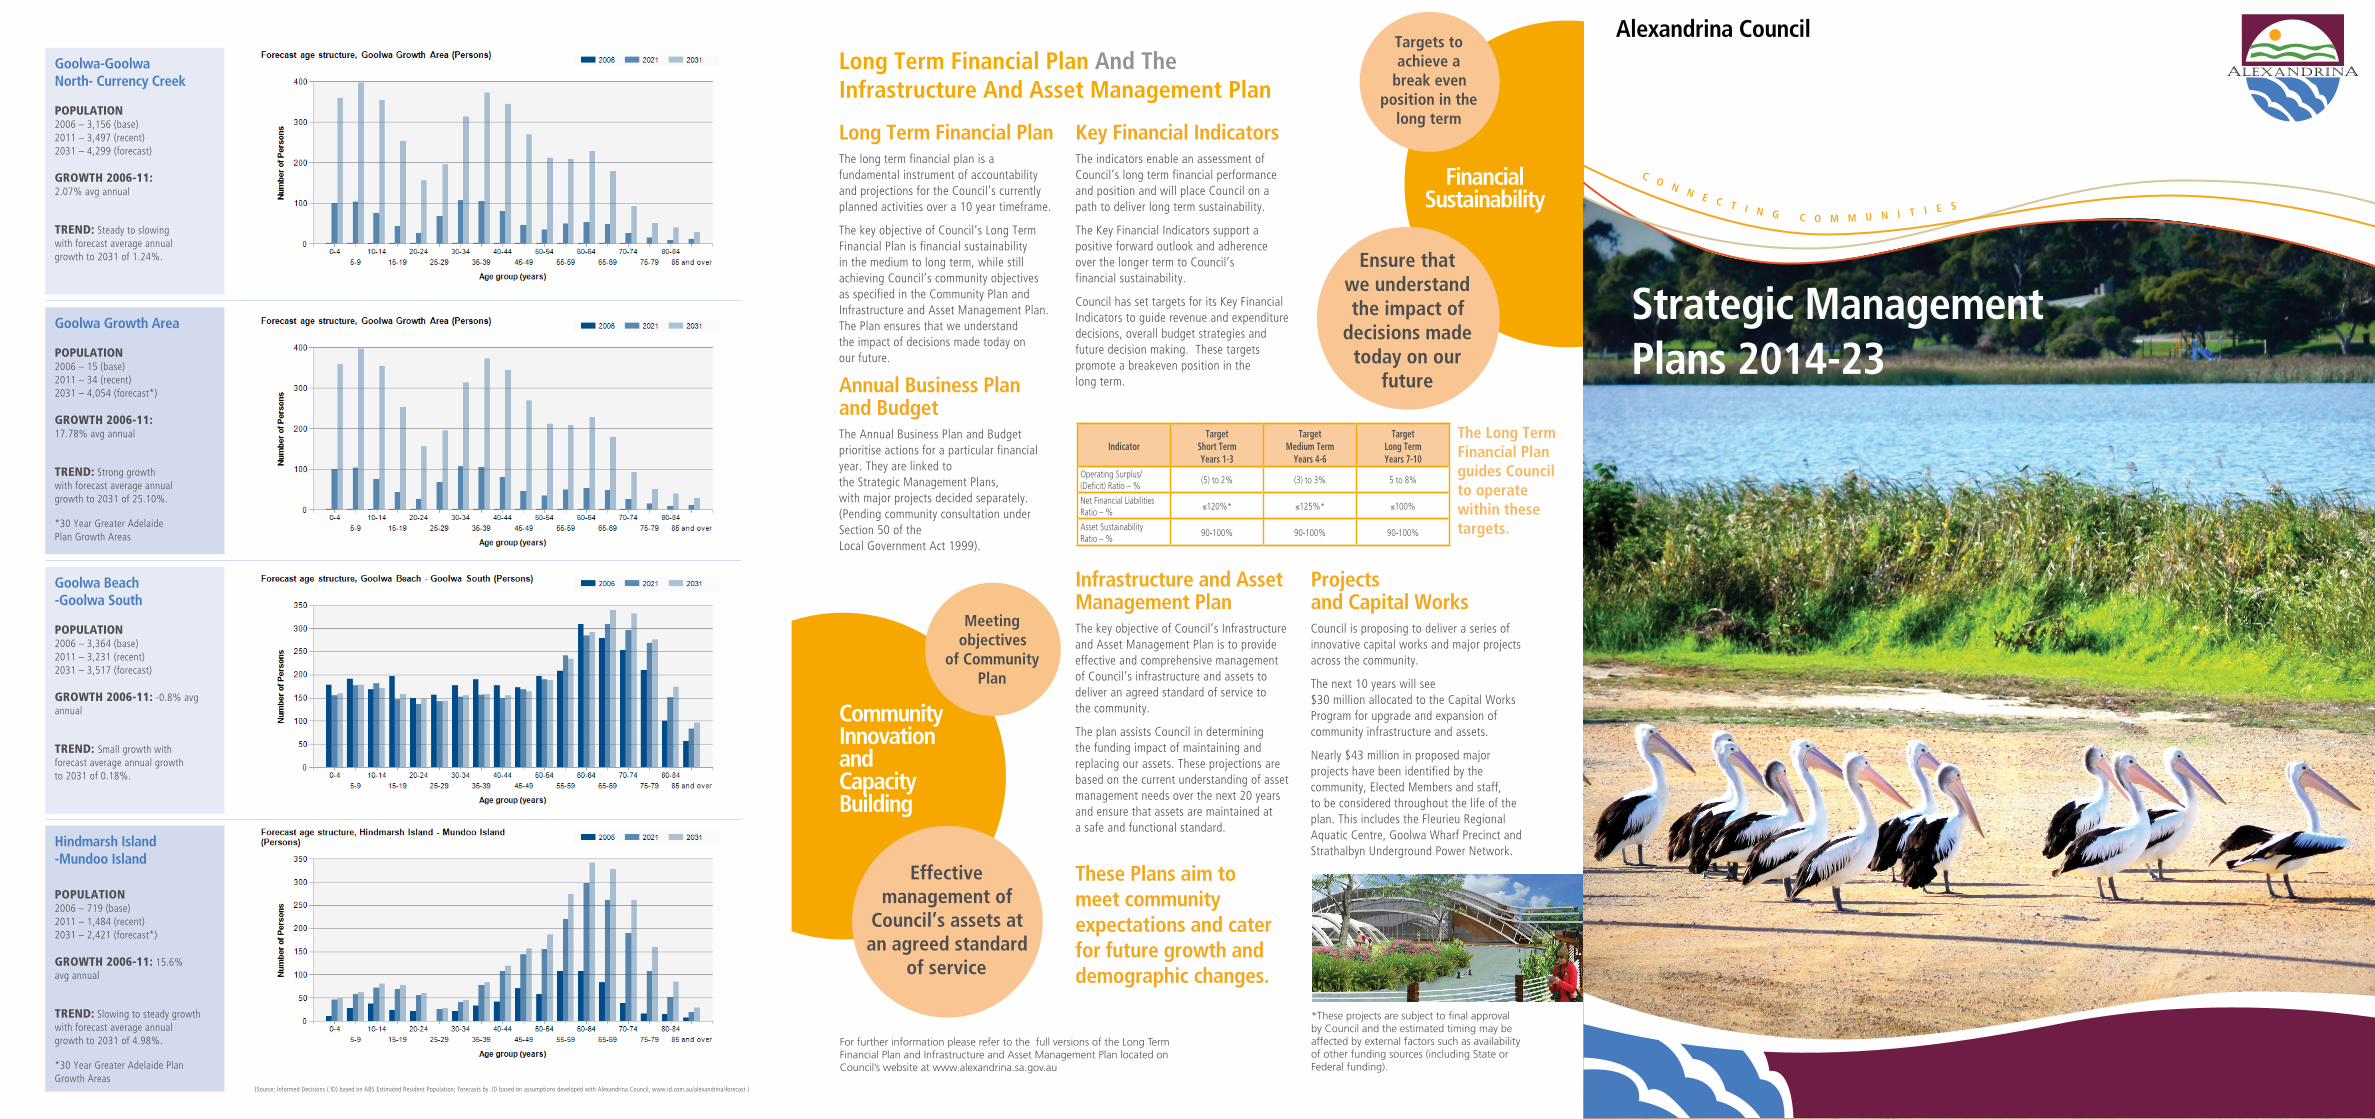
Long term Financial Plan And the infrastructure And Asset management Plan
Long term Financial PlanThe long term financial plan is a fundamental instrument of accountability and projections for the Council’s currently planned activities over a 10 year timeframe.
The key objective of Council’s Long Term Financial Plan is financial sustainability in the medium to long term, while still achieving Council’s community objectives as specified in the Community Plan and Infrastructure and Asset Management Plan. The Plan ensures that we understand the impact of decisions made today on our future.
Annual Business Plan and BudgetThe Annual Business Plan and Budget prioritise actions for a particular financial year. They are linked to the Strategic Management Plans, with major projects decided separately. (Pending community consultation under Section 50 of the Local Government Act 1999).
Key Financial indicatorsThe indicators enable an assessment of Council’s long term financial performance and position and will place Council on a path to deliver long term sustainability.
The Key Financial Indicators support a positive forward outlook and adherence over the longer term to Council’s financial sustainability.
Council has set targets for its Key Financial Indicators to guide revenue and expenditure decisions, overall budget strategies and future decision making. These targets promote a breakeven position in the long term.
infrastructure and Asset management PlanThe key objective of Council’s Infrastructure and Asset Management Plan is to provide effective and comprehensive management of Council’s infrastructure and assets to deliver an agreed standard of service to the community.
The plan assists Council in determining the funding impact of maintaining and replacing our assets. These projections are based on the current understanding of asset management needs over the next 20 years and ensure that assets are maintained at a safe and functional standard.
these Plans aim to meet community expectations and cater for future growth and demographic changes.
Projects and Capital Works Council is proposing to deliver a series of innovative capital works and major projects across the community.
The next 10 years will see $30 million allocated to the Capital Works Program for upgrade and expansion of community infrastructure and assets.
Nearly $43 million in proposed major projects have been identified by the community, Elected Members and staff, to be considered throughout the life of the plan. This includes the Fleurieu Regional Aquatic Centre, Goolwa Wharf Precinct and Strathalbyn Underground Power Network.
indicatortarget
short termYears 1-3
target medium term
Years 4-6
target Long termYears 7-10
Operating Surplus/ (Deficit) Ratio – %
(5) to 2% (3) to 3% 5 to 8%
Net Financial Liabilities Ratio – %
≤120%* ≤125%* ≤100%
Asset Sustainability Ratio – %
90-100% 90-100% 90-100%
Community innovation and Capacity Building
meeting objectives
of Community Plan
the Long term Financial Plan guides Council to operate within these targets.
For further information please refer to the full versions of the Long Term Financial Plan and Infrastructure and Asset Management Plan located on Council’s website at www.alexandrina.sa.gov.au
C o n n e C t i n g C o m m u n i t i e s
Alexandrina Council goolwa-goolwa north- Currency Creek
POPULATION2006 – 3,156 (base)2011 – 3,497 (recent)2031 – 4,299 (forecast)
GROwTH 2006-11: 2.07% avg annual
TREND: Steady to slowing with forecast average annual growth to 2031 of 1.24%.
goolwa growth Area
POPULATION2006 – 15 (base)2011 – 34 (recent)2031 – 4,054 (forecast*)
GROwTH 2006-11: 17.78% avg annual
TREND: Strong growth with forecast average annual growth to 2031 of 25.10%.
*30 Year Greater Adelaide Plan Growth Areas
goolwa Beach -goolwa south
POPULATION2006 – 3,364 (base)2011 – 3,231 (recent)2031 – 3,517 (forecast)
GROwTH 2006-11: -0.8% avg annual
TREND: Small growth with forecast average annual growth to 2031 of 0.18%.
Hindmarsh island -mundoo island
POPULATION2006 – 719 (base)2011 – 1,484 (recent)2031 – 2,421 (forecast*)
GROwTH 2006-11: 15.6% avg annual
TREND: Slowing to steady growth with forecast average annual growth to 2031 of 4.98%.
*30 Year Greater Adelaide Plan Growth Areas
(Source: Informed Decisions (.ID) based on ABS Estimated Resident Population; Forecasts by .ID based on assumptions developed with Alexandrina Council, www.id.com.au/alexandrina/forecast )
strategic management Plans 2014-23
*These projects are subject to final approval by Council and the estimated timing may be affected by external factors such as availability of other funding sources (including State or Federal funding).