migration strategies of the crisis-stricken youth in an enlarged european union
DESCRIPTION
MIGRATION STRATEGIES OFTHE CRISIS-STRICKENYOUTH IN AN ENLARGEDEUROPEAN UNIONTRANSCRIPT

CELSI Discussion Paper No.
Central European Labour Studies Institute
6
MIGRATION STRATEGIES OF THE CRISIS-STRICKEN YOUTH IN AN ENLARGED EUROPEAN UNION
MARCH 2013
MARTIN KAHANEC
BRIAN FABO

CELSI Discussion Paper No.
Migration strategies of the crisis-stricken youth in an enlarged European Union
6
March 2013
Martin KahanecCentral European University, IZA and CELSI
Brian FaboCELSI
The Central European Labour Studies Institute (CELSI) takes no institutional policy positions. Any opinions or policy positions contained in this Discussion Paper are those of the author(s), and not those of the Institute. The Central European Labour Studies Institute (CELSI) is a non-profit research institute based in Bratislava, Slovakia. It fosters multidisciplinary research about the functioning of labour markets and institutions, work and organizations, business and society, and ethnicity and migration in the economic, social, and political life of modern societies. CELSI Discussion Paper series is a flagship of CELSI's academic endeavors. Its objective is the dissemination of fresh state-of-the-art knowledge, cross- fertilization of knowledge and ideas, and promotion of interdisciplinary dialogue about labour markets or broader labour issues in Central and Eastern Europe. Contributions from all social science disciplines, including but not limited to economics, sociology, political science, public polic social anthropology, human geography, demography, law and social psychology, are welcome. The papers are downloadable from http://www.celsi.sk. The copyright stays with the authors.
Central European Labour Studies Institute (CELSI)
Zvolenská 29 Tel/Fax: +421-2-207 357 67 821 09 Bratislava E-mail: [email protected]
Slovak Republic Web: www.celsi.sk

CELSI Discussion Paper No. 6
March 2013
ABSTRACT
Migration strategies of the crisis-stricken youth in an enlarged European Union
This paper studies the migration response of the youth from new EU member states to disparate conditions in an enlarged European Union at the onset of the Great Recession. We use the Eurobarometer data and probabilistic econometric models to identify the key drivers of the intention to work in another member state of European Economic Area (EEA) and their expected duration. We find that migration intentions are high among those not married and among males with children, but both categories are also overrepresented among people with only temporary as opposed to long-term or permanent migration plans. Whereas age affects migration intentions negatively, education has no effect on whether working abroad is envisaged. However, conditional on envisaging to work abroad, completion of education (if after 16th birthday) is associated with long-term (at least five years), but not permanent, migration plans. Finally, we find that socio-demographic variables explain about as much variation of migration intentions as self-reported push and pull factors and migration constraints.
Keywords: EU labor markets, migration, youth, EU enlargement, labor mobility, free movement of workers, transitional arrangements, new member states, European Union
JEL Classification: F22, J61
Corresponding Author:
Martin Kahanec
Department of Public Policy, Central European University
Nádor u. 11, H-1051 Budapest, Hungary
E-mail: [email protected]

Migration strategies of the crisis-stricken youth
in an enlarged European Union
Martin Kahanec Central European University, IZA and CELSI
Brian Fabo
CELSI
March 1, 2013 Abstract: This paper studies the migration response of the youth from new EU member states to disparate conditions in an enlarged European Union at the onset of the Great Recession. We use the Eurobarometer data and probabilistic econometric models to identify the key drivers of the intention to work in another member state of European Economic Area (EEA) and their expected duration. We find that migration intentions are high among those not married and among males with children, but both categories are also overrepresented among people with only temporary as opposed to long-term or permanent migration plans. Whereas age affects migration intentions negatively, education has no effect on whether working abroad is envisaged. However, conditional on envisaging to work abroad, completion of education (if after 16th birthday) is associated with long-term (at least five years), but not permanent, migration plans. Finally, we find that socio-demographic variables explain about as much variation of migration intentions as self-reported push and pull factors and migration constraints. Keywords: EU labor markets, migration, youth, EU enlargement, labor mobility, free movement of workers, transitional arrangements, new member states, European Union JEL: F22, J61 Corresponding author: Martin Kahanec Department of Public Policy Central European University Nádor u. 11, H-1051 Budapest, Hungary T: +36-1-3273097 F: +36-1-3283450 E: [email protected]

2
1. Introduction
The 2004 and 2007 enlargements of the EU extended the freedom of movement to
workers from twelve new member states mainly from Central and Eastern Europe.1 The
ensuing migration generally proved to be a positive experience for European Union and
the pre-enlargement fears from free labor mobility of new EU citizens turned out
unjustified. No economically significant detrimental effects on the receiving countries’
labor markets have been documented, nor has there been any evidence for statistically
significant welfare shopping.2 Rather, there appear to have been positive effects on EU’s
productivity.3 The sending countries face some risks of losing their young and skilled
labor force, but free labor mobility has relieved them of some redundant labor and the
associated fiscal burden during the recession of the late 2000s and early 2010s. They
have also profited from remittances, and the experience gained abroad proves useful upon
return.4
The severe economic slowdown of the late 2000s and early 2010s, also dubbed the Great
Recession, abruptly changed the migration landscape in Europe. The youth has
disproportionally borne the economic adversities caused by the economic shocks that
1 Including Cyprus, the Czech Republic, Estonia, Hungary, Latvia, Lithuania, Malta, Poland, Slovakia and Slovenia in 2004 (EU10) and Bulgaria and Romania in 2007 (EU2). We denote the union of the two groups EU12, and EU8+2 whenever Cyprus and Malta are omitted. 2 Kahanec and Zimmermann (2010). 3 Kahanec and Pytlikova (2013). 4 For a general account see Kahanec (2013b), Kahanec and Zimmermann (2010) and Kureková (2011) and the literature cited in these works. Concerning the possible negative effects see e.g. Kahancová and Kaminska (2010) on the effect of out-migration on wages, Anderson et al. (2006) and Blanchflower and Lawton (2010) on migrants’ life satisfaction, and Meardi (2011) and Galgóczi et al. (2012) on how enlargement interacted with the social fabric of Europe. For a general review of European migration see Zaiceva and Zimmermann (2008) and Zimmermann (2005).

3
asymmetrically affected countries and sectors in the European Union, struggling with
exceptionally high unemployment rates in many EU member states. Whereas before the
Great Recession many young workers from the new member states could have afforded
ignoring the option of seeking employment abroad, or perceived it just as a luring option,
during the crisis for many of them this option turned to be the only possibility of finding
a job.
The migration response of the youth from the new member states to the changing
economic conditions has not yet been well documented. And yet their response critically
conditions the capacity of the European Union, and the European Monetary Union in
particular, to absorb asymmetric economic shocks and thus the European integration
project itself. Indeed, the long-run capacity of the European Union to deal with global
economic challenges crucially depends on the degree of mobility of its labor force. In this
regard, permanent moves help to absorb current economic disparities, but do not provide
for increased capacity to absorb ensuing economic shocks. Temporary migration
trajectories, on the other hand, provide for a labor force that is more responsive to
economic fluctuations. On the background of aging populations, the temporal nature of
youth mobility is of key importance from the perspective of the economic potential and
welfare sustainability in the sending countries.
In the spirit of Hirschman (1970), from the perspective of the sending countries,
permanent out-migration of young people can be interpreted as an exit strategy driven by
their frustration with the adverse labor market situation in the home country. On the other
4
hand, temporary out-migration rather implicitly represents voice as an artifact of
changing economic opportunities across the European Union. Loyalty and other
interfering variables, including push and pull factors, determine whether exit or voice
prevails.5
This paper explores the preferences of the youth in the new member states over migration
strategies in wake of the Great Recession of the late 2000s and early 2010s. We
specifically distinguish mobility plans of short and long duration, and study the factors
that determine the decision to move and—conditional on that decision— to stay in the
destination country temporarily or permanently. For this purpose we utilize the
Eurobarometer dataset 337, wave 72.5, from 2009—the year when the Great Recession
started to fully affect EU labor markets. This dataset provides individual-level socio-
economic data including variables on migration intentions and their time frame. Binomial
and ordered logistic regression models enable us to disentangle the main factors affecting
migration intentions, including standard socio-economic variables as well as individual
perceptions about key pull and push factors affecting their migration intentions.
We proceed as follows: Section 2 introduces the context of post-enlargement migration in
the EU and briefly reviews the literature. Section 3 outlines the data and empirical
strategy. Section 4 reports and interprets the result, and section 5 concludes.

5
2. The scale and composition of migration in the EU following its eastern
enlargement
The gradual extension of the right of free movement to new EU citizens brought about by
the 2004 and 2007 enlargements enabled them to seek employment in the fifteen “old”
EU member states (EU15).6 The higher standard of living in the old member states lured
many EU12 citizens to pursue their careers in the EU15. According to Holland et al.
(2011), there were about one million citizens from the EU8 and almost another million
from the EU2 in EU15 in 2004.7 Only five years after the first enlargement, in 2009, the
combined number of citizens from the new member states in the EU15 reached almost
five million, about equally split between the 2004 and 2007 entrants. This corresponds to
1.22 percent of the total EU15 population and 4.75 percent of the combined populations
of new member states. 8
Figure 1 depicts some of the main migration trends in an enlarged EU from sending
countries’ perspective. We observe a much increased dynamics of migration after the
2004 enlargement, and relatively abrupt slow-down, but not cessation, during the Great
Recession. Relative to their population, the lowest senders were the Czech Republic,
6 The so called transitional arrangements allowed old member states to impose restrictions on the access of new EU citizens to their labor markets based on a 2+3+2 formula, with restrictions reviewed after two and three years, but lifted after seven years. Whereas some countries opened up their labor markets immediately upon enlargement (e.g. the UK, Ireland and Sweden for the 2004 entrants) others kept the restrictions until the last moment (e.g. Austria and Germany for 2004 entrants). Kahanec (2013b) provides an up-to-date summary of the gradual liberalization. EU15 denotes Austria, Belgium, Denmark, Finland, France, Germany, Greece, Ireland, Italy, Luxembourg, the Netherlands, Portugal, Spain, Sweden, and the United Kingdom. 7 See Kahanec (2013b) on the limitations of the data. 8 Kahanec, (2013b).

6
Hungary and Slovenia; whereas the highest senders were Romania, Bulgaria and
Lithuania. Most migrants came from Romania and Poland. As for the receiving countries,
in 2009 Germany and the UK hosted about two thirds of all citizens of the new member
states in the EU15, but the primary destinations for EU2 migrants were Spain and Italy.9
A major trend was that the traditional destinations for migrants from the new member
states such as Germany or Austria lost their relative significance whereas an increasing
share of these migrants targeted new destination countries, such as Ireland, the United
Kingdom, or Spain.
Many of these movers were young workers and students, who generally only had limited
labor market experience, were singles and had no children. 10 As Figure 2 indicates,
among migrants from the EU12 in the EU15 young people, aged 15 to 34, were
overrepresented in most countries. As can be expected, the share of young people among
migrants is significantly higher after 2004 when EU10 countries joined the EU in all the
EU15 countries represented in Figure 2. The largest increase in youth mobility was
observed in the Netherlands, Austria, but also Greece, Denmark, and France.
[Figure 1 around here]
[Figure 2 around here]
Generally speaking these young cohorts of migrants were gender-balanced although
female-bias emerged in some countries. Among young migrants after 2004 the highest
9 Kahanec, (2013b). 10 Kahanec and Zimmermann, (2010).

7
proportion of females were observed in Austria, France, Greece, and the Netherlands
(See Figure 2). On average post-enlargement migrants were well educated compared to
the populations in the source but also destination countries (Kahanec and Zimmermann,
2010; Kahanec, 2013b).
[Figure 3 around here]
3. The data and analytical framework
The analysis in this paper is based on data from Special Eurobarometer 337, wave 72.5,
conducted between 13th November and 9th December 2009. 26,761 inhabitants of the
European Union member states were surveyed resulting in sample size of around 1000
observations per country.11 Probabilistic random sampling was employed to select
surveyed households to ensure representativeness for the population of the EU member
states aged 15 years or above.
A subset of the data has been selected for the purpose of this paper consisting of the
residents of EU8+2 countries aged 15 to 35, broadly representing the youth in the new
member states. From this subset we kept only those respondents that expressed desire to
work in a European country, either their own or in another member state of the European
Economic Area (EEA), but not elsewhere. Through these procedures, a sample of 2,240
young residents of EU8+2 was gained and used as a basis for statistical inference.
11 In the countries with smaller populations (e.g. Luxembourg, Malta and Cyprus) only about 500 observations were gathered.

8
The key dependent variables were constructed using three questions from the
Eurobarometer dataset about respondents’ expectations regarding their migration. The
first question asked whether the respondent envisages to work in a country outside his or
her own country at some time in the future (question QC10). Based on this question we
constructed variable Move that is 1 if the answer is positive and zero otherwise. We then
used question QC15: “If you do have an intention to work outside (own country), how
long do you think you will be working there?” to measure the intended duration of stay
abroad. The range of responses included the following options: a few weeks or less, a few
months to less than 1 year, 1 year to less than 2 years, 2 years to less than 5 years, 5 years
to less than 10 years, 10 years or more, as long as possible, until you retire, for the rest of
your life. Based on this variable we constructed variable Duration5 with 1 for those
intending to work abroad at least five years, and 0 otherwise. Finally, we constructed
variable Permanent based once again on the variable QC15, valued 1 if the respondent
indicated desire to move “until you retired” or “for the rest of your life”, and 0 otherwise.
[Figure 4 around here]
A number of socio-demographic characteristics were scrutinized in relation to the
intentions of the surveyed individuals to work in another European country vis-à-vis
staying in their own country, and the intended duration of working abroad. As evident
from Figure 4, men are more likely to look for work beyond the borders of their own
country. While approximately 70 per cent of young females in the EU8+2 signaled no
desire for move, only a little more than a half of their male counterparts expressed similar

9
intentions. Among Eastern Europeans who expressed intentions to work abroad in the
future a majority also expressed preference for seeking a longer-term arrangement
abroad, lasting for at least one year.
Table 1 shows that the family situation strongly correlates with migration intentions.
Only about 22 per cent of married respondents with children reported intentions to move,
while more than a half of singles12 with no children foresaw themselves working in
another EU member state. Married couples, regardless of whether with children or not,
are less migration-prone than cohabiting couples, which were in turn less interested in
migration than singles. Across these three categories, respondents with children were
more likely to stay at home than childless members of their respective group. As far as
the expected duration of migration experience is concerned, respondents with children are
clustered in both “up to 1 year” and more than “5 years”, while childless respondents
seemed to be more open to medium-term migration.
[Table 1 around here]
As concerns age, the younger the people are (within the 15-35 cohort) the more likely
they are to expect moving abroad to work (See Figure 5). Only slightly more than 40 per
cent of people under 18 signal no intentions to seek work abroad, while the
corresponding figure for those aged between 30-35 is about 75 per cent. A similar pattern
12 This category includes all respondents without a partner.

10
emerges for the prevalence of expectations about stays abroad of long duration (more
than 5 years), which also declines with age.
[Figure 5 around here] Table 2 reveals that no straightforward patterns of relationship between education and
migration expectations emerge, although students and those completing their education
before their 16th birthday appear to be more mobile.
[Table 2 around here]
Finally, it is possible to identify three levels of migration propensity in relation with
professional affiliation. At the top, the unemployed, just like students, are very prone to
looking for work abroad, as about half of them intend to work abroad. In contrast, the
self-employed individuals, non-managerial white collar workers and especially
housepersons do not seem to be very mobile. Managers and manual workers are
somewhere in between with about a third of them expecting working in another European
country. These patterns are also visible for the expected duration of stay abroad, with
students, the unemployed, and managers expecting longer-term commitments; whereas
housepersons and the self-employed appear to have more temporary plans.
[Table 3 around here]

11
These descriptive statistics reveal a number of interesting patterns. Young male singles
without children, still studying or with little education, or unemployed, appear to be most
likely to expect future mobility. However, there may be more complex interactions
among these variables, which may confound some of this descriptive inference. For
example, age and student status are correlated, and simple statistics do not disentangle
their independent effects on migration expectations. Other variables, such as having
children, may have different effects for males and females.
To pinpoint and measure robust determinants of youth’s migration intentions, we use
binomial and ordered Logit models predicting the probability of expectations to move,
and to move for longer durations. Among the key explanatory variables we include
gender, age, professional and marital status, having children or not and educational
attainment. These models disentangle conditional correlations among the studied
variables and also enable us to look also at the interaction effects of gender and having
children. The inclusion of country fixed effects controls for cross-sectional variation that
invariably characterizes each country, including country-specific push factors.
Additionally, the dataset permits looking at the effects of a set of variables measuring
subjective stance of respondents on various factors enhancing or limiting their propensity
to migrate. These variables are listed in Table 4. Including these variables in the analysis
enables us to disentangle the effects of socio-demographic variables from perceived push
and pull factors and constraints relevant for migration intentions of the youth in new
member states.

12
[Table 4 around here]
4. The results
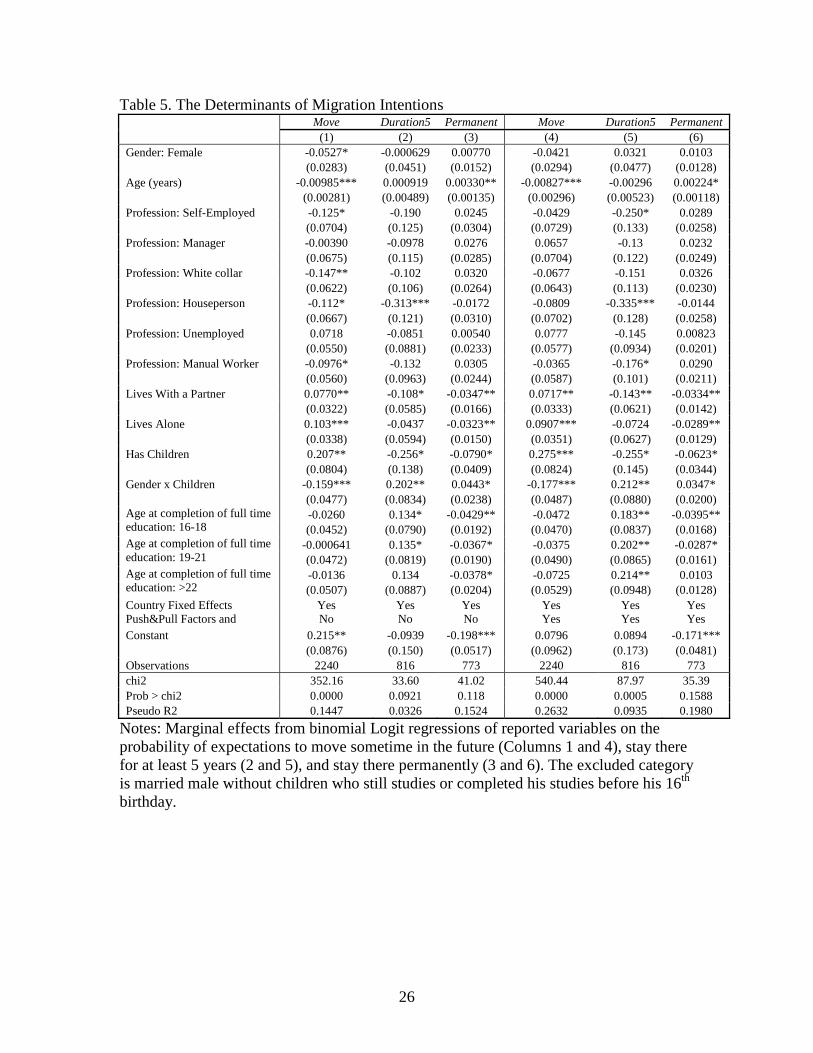
The results from binomial Logit regressions are reported in Table 5. Among the positive
factors for the intentions to move to another EEA country we identify not being married
(whether single or cohabiting with a partner) and being a male with children. This finding
and the insignificance of the coefficient with gender indicates that the correlation of
gender and migration intentions arises through gendered response of households to the
presence of children, and not as a direct effect of gender. The negative factors include age
and working in a white-collar job. While upon inclusion of self-reported push and pull
factors and constraints the latter effect disappears, the inclusion of push and pull factors
and constraints does not qualitatively alter the results for the socio-demographic
variables. Interestingly, education has essentially no effects on the intentions to work
abroad.
A somewhat different picture emerges when it comes to expected duration of stay abroad
for people intending to work abroad in the future. 13 Being a houseperson reduces the
chance of expecting to stay abroad for at least five years; this effect is not present if we
look at the intentions to stay permanently. Living with a partner as opposed to being
married appears to reduce the probability of expecting duration of staying abroad of at
least five years as well as, although to as smaller degree, to stay abroad permanently.

13
There is an indication of a similar negative effect on the intention to move permanently
of being single. Remarkably, conditional on expecting to move, men with children expect
shorter duration of stay, below five years. This may signify circular or seasonal migratory
trajectories of male bread winners and, as mentioned above, a gendered response to the
presence of children in the household. Interestingly, education gains importance, with
more educated migrants (completing their education after their sixteenth birthday, i.e. not
students or low educated) exhibiting a higher probability of expecting stays lasting for at
least five years. This effect is not present, and perhaps even reverses, when it comes to
intentions to move permanently. Generally, the inclusion of self-reported push and pull
factors and constraints increases the precision and explanatory power of our regression
models.14
[Table 5 around here]
It is interesting to observe that the effects of socio-demographic characteristics on
migration expectations are rather independent of the considered self-reported pull and
push factors and migration constraints. We report in Table 6 the coefficients for these
factors corresponding to columns 4-6 in Table 5. We observe that most of these factors
are significant predictors (of expected sign) of the intentions to move. Better labor market
opportunities, political or economic climate, but also social networks abroad are
important push and pull factors. Interestingly, consistent with the findings of Giulietti et
al. (2013) social and health care factors are not strongly related to the decision to move,
14 Importantly, all respondents were asked the questions about push and pull factors and constraints regarding their actual or hypothetical migration plans.

14
although there appears to a small statistically significant positive effect, along with life
quality, on the interest to move permanently. Conditional on intending to move, those
who want to discover something new or improve their qualification, or have concerns
about the migration-related costs to their family, children or friends, or own house or
other property in their home country, tend to prefer migratory moves of shorter duration.
Those who perceive the efforts needed to migrate as high, already have a good job, find it
difficult to learn a new language, do not feel sufficiently qualified, perceive the cost of
living abroad as high, or have strong emotional relationship to their home country tend to
have a lower propensity to migrate.
[Table 6 around here]
As the threshold of 5 years in the definition of Duration5 indicating long-term migratory
intentions is arbitrary, we also considered an alternative measure with the duration
threshold of 1 year. The results were essentially the same as reported in columns 2 and 5
of Table 5.15 We also test the robustness of our predictions using the ordered Logit
model. The results reported in Table 7 are fully in line with those obtained from binomial
Logit models above.
[Table 7 around here]
Not reported, available upon request.

15
5. Conclusions and implications
In this paper we address the question of how did the youth in new EU member states
respond to their newly acquired right to freely move for work within the European Union
on the background of economic developments at the onset of the Great Recession. We
review the literature and descriptively analyze the EU LFS data from 2010 to find that the
youth in the new member states has vigorously reacted to the (perspective of) accession
of their countries to the European Union. Can these significant migration flows be
considered as permanent, signifying exit from sending countries, or did the youth have
just temporary migration plans, thus with their mobility decisions rather implicitly
voicing their discontent with the socio-economic situation in their home countries?
To answer this question we studied migration intentions of the youth in new member
states using the Eurobarometer 337, wave 72.5, database. We distinguished temporary
and permanent migration intentions by looking at the expected duration of working
abroad. Disentangling a number of interacting factors using a binomial Logit model, we
find that the only variables that matter significantly in the statistical sense and thus have
an independent effect on the probability of intentions to work abroad are age (negative),
not being married, and having children if male (positive).
We further looked at the determinants of the expected duration of the intended working
abroad. The analysis has shown that among the most loyal young people – i.e. not
intending to stay abroad for more than 5 years – are housepersons, men with children,

16
and those living with a partner (but not married). Those with completed education (if
after their 16th birthday) are more likely to report intentions to stay abroad more than five
years, but less likely to report permanent migration intentions. Beyond the completion
threshold the level of education however does not seem to matter much, indicating that, at
least measured by intentions, there is little selection on formal education of migrants into
temporary and longer or permanent migration plans.
The analysis of push and pull factors and migration constraints indicates that social,
economic and political conditions abroad, as well as existing social networks abroad, all
increase the propensity to indicate migratory intentions. Interestingly, the effect of the
perception of better social and health care system abroad ends up only marginally
significant, although there appears to be a small positive and statistically significant
effect on permanent migratory intentions. On the other hand various constraints related to
perceived costs of migration are very relevant factors that limit migration intentions.
Interestingly, when it comes to the desired duration of intended working abroad, among
the youth most loyal to their home country, i.e. intending to return within five years after
departure, are those who only want to discover something new or improve their
qualifications, and who do not want to impose big changes on their family or children, or
do not want to leave property behind. Those discontented with the political situation at
home are considerably less loyal, however.
17
These findings indicate that post-enlargement migration of young workers from new
member states to more advanced European economies can be seen as a signal of socio-
economic disparities in an enlarged European Union. A non-negligible fraction of the
youth report intentions of long-term work abroad, indicating some preference for long-
term or permanent exit from their home countries. A much larger share, however, appear
to be attached to their home countries, reporting preference for stays abroad of shorter
duration, and thus with their migration plans signaling their discontent with their present
situation. Having completed education and the family status appear to be the key socio-
demographic drivers of the choice between the two strategies.
In relation to the debate about circular migration and brain circulation, our findings
indicate that there is little evidence of a significant educational gradient, or brain drain, in
selection to permanent migration intentions. On the other hand, improvement in the
political situation, quality of social and health care system, and quality of life are
desirable on the assumption that temporary migration trajectories are preferred to long-
term or permanent exits.
Socio-demographic variables and perceived pull and push factors and constraints on
peoples’ migration decisions independently explain similar fraction of the variation in
migration intentions. The significance of education and family status implies that at
certain stage of people’s life cycle migration is more likely to be perceived as a viable
alternative. In addition, a number of push and pull factors indicate that discovering
something new, improving one’s qualifications, or simply career opportunities are

18
important determinants of the migration decision among the young workers from new EU
member states. Fresh and recent graduates planning their future career and making family
choices is thus the social group that appears to be more responsive to policy intervention
regarding their mobility choices and temporal nature of their migration plans.
References
Anderson, B., Ruhs, M., Rogaly, B., and Spencer, S. (2006). Fair Enough? Central and
East European Migrants in Low-Wage Employment in the UK. Oxford: COMPAS.
Blanchflower, D. G. and H. Lawton (2010). “The Impact of the Recent Expansion of the
EU on the UK Labour Market,” in M. Kahanec and K. F. Zimmermann (eds.), EU
Labor Markets After Post-Enlargement Migration. Berlin et al.: Springer, 181-215.
Hirschman, A.O. (1970). Exit, Voice, and Loyalty: Responses to Decline in Firms,
Organizations, and States. Cambridge, MA: Harvard University Press.
Galgóczi B., Leschke J, and A. Watt (eds.) (2012). EU Labour Migration in Troubled
Times: Skills Mismatch, Return and Policy Responses, Aldershot: Ashgate
Giulietti, C., M. Guzi, M. Kahanec, and K. F. Zimmermann (2013). “Unemployment
Benefits and Immigration: Evidence from the EU”, International Journal of
Manpower, Vol. 34, No.1/2, forthcoming.
Holland, D., T. Fic, P. Paluchowski, A. Rincon-Aznar and L. Stokes (2011). Labour
Mobility within the EU: The impact of Enlargement and Transitional Arrangements,
NIESR Discussion Paper No. 379, National Institute of Economic and Social
Research, London.

19
Kaminska M. E. and M. Kahancová (2011). “Emigration and labour shortages: An
opportunity for trade unions in the New Member States?”, European Journal of
Industrial Relations, 17 (2) 189-203.
Kahanec, M. (2013a). “Skilled Labor Flows: Lessons from the European Union”, Social
Protection and labor discussion paper no. SP 1301. Washington DC: The Worldbank.
Kahanec, M. (2013b). Labor Mobility in an Enlarged European Union”, forthcoming in
A.F. Constant and K.F. Zimmermann (eds.), International Handbook on the
Economics of Migration, Cheltenham: Edward Elgar
Kahanec, M. And M. Pytlikova, (2013). The Economic Impact of East-West Migration
on the European Union, mimeo.
Kahanec, M. and K.F. Zimmermann (eds.) (2010) EU Labor Markets after Post-
enlargement Migration. Berlin: Springer.
Kureková, L. (2011). From job search to skill search. Political economy of labor
migration in Central and Eastern Europe. PhD dissertation, Central European
University (CEU), Budapest.
Meardi, G. (2011). Social Failures of EU Enlargement: A Case of Workers Voting with
their Feet. Routledge.
Zaiceva, A. and K. F. Zimmermann (2008). “Scale, Diversity, and Determinants of
Labour Migration in Europe”, Oxford Review of Economic Policy 24 (3), 427-451.
Zimmermann, K.F. (2005). European Migration: What do we know? Oxford/New York:
Oxford University Press.

20
Figures Figure 1. Migration in an enlarged European Union (1997-2009) a. High senders
b. Low senders
Source: Own calculations based on the data provided in Holland et al. (2011) and Eurostat Populations Statistics. In per cent, left axis: bars. Total stock, right axis: triangles. Adapted from Kahanec (2013a).

21
Figure 2. The share of youth (15-34) among all EU12 migrants in the EU15, by arrival
Notes: In per cent. Source: Own calculations based on the EU Labor Force Survey, 2010. Migration status defined by place of birth, except for Germany for which due to data constraints nationality is used.
0
10
20
30
40
50
60
70
80
90
AT DE FR DK GR BE IT NL ES PT UK IE
before 2004
2004‐2010

22
Figure 3. Percent females among EU10+2 migrants in the EU15
Notes: In per cent. Source: Own calculations based on the EU Labor Force Survey, 2010. Migration status defined by place of birth, except for Germany for which due to data constraints nationality is used. 15-35 2004+ denotes migrants aged 15-35 and arriving after 2004.
0%
10%
20%
30%
40%
50%
60%
70%
80%
IE PT ES UK BE DE IT FR AT GR DK NL
15‐64
15‐35
15‐35 2004+

23
Figure 4. Intentions to work abroad and expected duration of stay abroad, by gender.
Notes: In per cent. Source: Own calculation based on Eurobarometer data 337, 72.5. Figure 5. Intentions to work abroad, by age
Notes: In per cent. Source: Own calculation based on Eurobarometer data 337, 72.5.
0
10
20
30
40
50
60
70
80
90
100
Male Female
More than 5 years
1 year to 5 years
Up to 1 year
No move
0%
10%
20%
30%
40%
50%
60%
70%
80%
90%
100%
Under18 18‐23 24‐29 30‐35
More than 5 years
1 year to 5 years
Up to 1 year
No move

24
Tables Table 1. Intentions to work abroad, household type
Family status No move Up to 1
year 1 year to 5
years More than 5
years Married, no children 71.26 5.39 7.78 15.57 Living with partner, no children 57.19 7.49 18.86 16.47 Single, no children 49.66 7.91 20.05 22.37 Married, with children 78.12 5.26 5.4 11.22 Living with partner, with children 67.39 6.52 12.5 13.59 Single, with children 62.00 9.00 9.00 20.00 Notes: In per cent. Source: Own calculation based on Eurobarometer data 337, 72.5.
Table 2. Intentions to work abroad, by education Age at completion of full time education No move Up to 1 year 1 year to 5 years
More than 5 years
<16 62.86 10.29 13.71 13.14 16-18 72.09 4.6 10.12 13.19 19-21 69.34 6.61 9.42 14.63 22+ 69.29 4.82 10.15 15.74 Still studying 63.57 6.74 13.13 16.56 Notes: In per cent. Source: Own calculation based on Eurobarometer data 337, 72.5. Table 3: Intentions to work abroad, by professional status
Professional status No move Up to 1 year 1 year to 5 years More than 5
years Self-employed 77.36 6.29 6.92 9.43 Managers 64.32 6.1 10.33 19.25 Other white collar 78.38 3.3 8.11 10.21 Manual workers 69.07 5.45 11.09 14.4 House person 80.09 4.42 7.96 7.52 Unemployed 51.64 10.18 15.27 22.91 Students 43.27 9.81 22.5 24.42 Notes: In per cent. Source: Own calculation based on Eurobarometer data 337, 72.5.

25
Table 4. Push and pull factors and constraints of migration propensity Push and Pull Factors Constraints Better quality of life abroad Your home is here Better working conditions
abroad You would not want to impose
big changes on your family and/or children
Better career or business opportunities abroad
You do not want to leave your friends behind
Better chances of finding employment abroad
It is difficult to learn a new language
To discover something new and meet new people
You do not want to give up your house or other property
To improve your qualifications (e.g. learn a new language)
You already have a good job here
Better economic climate abroad It is too much of an effort to go and work abroad
To be closer to relatives or friends who live abroad
The cost of living is too high abroad
Better social and health care system abroad
The quality of life abroad is worse
Better political situation abroad The attitude towards foreigners abroad is hostile
The political situation abroad is worse
You don't feel qualified enough to work abroad
The economic climate abroad Is worse
Yourself of your friends/relatives have made bad experiences abroad
26
Table 5. The Determinants of Migration Intentions
Move Duration5 Permanent Move Duration5 Permanent (1) (2) (3) (4) (5) (6)
Gender: Female -0.0527* -0.000629 0.00770 -0.0421 0.0321 0.0103 (0.0283) (0.0451) (0.0152) (0.0294) (0.0477) (0.0128) Age (years) -0.00985*** 0.000919 0.00330** -0.00827*** -0.00296 0.00224* (0.00281) (0.00489) (0.00135) (0.00296) (0.00523) (0.00118) Profession: Self-Employed -0.125* -0.190 0.0245 -0.0429 -0.250* 0.0289 (0.0704) (0.125) (0.0304) (0.0729) (0.133) (0.0258) Profession: Manager -0.00390 -0.0978 0.0276 0.0657 -0.13 0.0232 (0.0675) (0.115) (0.0285) (0.0704) (0.122) (0.0249) Profession: White collar -0.147** -0.102 0.0320 -0.0677 -0.151 0.0326 (0.0622) (0.106) (0.0264) (0.0643) (0.113) (0.0230) Profession: Houseperson -0.112* -0.313*** -0.0172 -0.0809 -0.335*** -0.0144 (0.0667) (0.121) (0.0310) (0.0702) (0.128) (0.0258) Profession: Unemployed 0.0718 -0.0851 0.00540 0.0777 -0.145 0.00823 (0.0550) (0.0881) (0.0233) (0.0577) (0.0934) (0.0201) Profession: Manual Worker -0.0976* -0.132 0.0305 -0.0365 -0.176* 0.0290 (0.0560) (0.0963) (0.0244) (0.0587) (0.101) (0.0211) Lives With a Partner 0.0770** -0.108* -0.0347** 0.0717** -0.143** -0.0334** (0.0322) (0.0585) (0.0166) (0.0333) (0.0621) (0.0142) Lives Alone 0.103*** -0.0437 -0.0323** 0.0907*** -0.0724 -0.0289** (0.0338) (0.0594) (0.0150) (0.0351) (0.0627) (0.0129) Has Children 0.207** -0.256* -0.0790* 0.275*** -0.255* -0.0623* (0.0804) (0.138) (0.0409) (0.0824) (0.145) (0.0344) Gender x Children -0.159*** 0.202** 0.0443* -0.177*** 0.212** 0.0347* (0.0477) (0.0834) (0.0238) (0.0487) (0.0880) (0.0200) Age at completion of full time education: 16-18
-0.0260 0.134* -0.0429** -0.0472 0.183** -0.0395** (0.0452) (0.0790) (0.0192) (0.0470) (0.0837) (0.0168)
Age at completion of full time education: 19-21
-0.000641 0.135* -0.0367* -0.0375 0.202** -0.0287* (0.0472) (0.0819) (0.0190) (0.0490) (0.0865) (0.0161)
Age at completion of full time education: >22
-0.0136 0.134 -0.0378* -0.0725 0.214** 0.0103 (0.0507) (0.0887) (0.0204) (0.0529) (0.0948) (0.0128)
Country Fixed Effects Yes Yes Yes Yes Yes Yes Push&Pull Factors and No No No Yes Yes Yes Constant 0.215** -0.0939 -0.198*** 0.0796 0.0894 -0.171*** (0.0876) (0.150) (0.0517) (0.0962) (0.173) (0.0481) Observations 2240 816 773 2240 816 773 chi2 352.16 33.60 41.02 540.44 87.97 35.39 Prob > chi2 0.0000 0.0921 0.118 0.0000 0.0005 0.1588 Pseudo R2 0.1447 0.0326 0.1524 0.2632 0.0935 0.1980
Notes: Marginal effects from binomial Logit regressions of reported variables on the probability of expectations to move sometime in the future (Columns 1 and 4), stay there for at least 5 years (2 and 5), and stay there permanently (3 and 6). The excluded category is married male without children who still studies or completed his studies before his 16th birthday.

Table 6: Impact of Push and Pull Factors and Constraints Push and Pull Factors Constraints
(4) (5) (6) (4 cont‘d) (5 cont‘d) (6 cont‘d) Better chances of finding employment abroad
0.204*** -0.0762* -0.00924 Your home is here -0.288*** -0.0558 N/A (0.0258) (0.0456) (0.0101) (0.0249) (0.0429)
Better working conditions abroad
0.186*** 0.027 0.00286 You would not impose big changes on family/children
-0.107*** -0.111** N/A (0.0251) (0.0427) (0.00946) (0.0280) (0.0499)
Better career opportunities abroad
0.128*** 0.0924* N/A You do not want to leave your friends behind
-0.100*** -0.0619 N/A (0.0277) (0.0483) (0.0273) (0.0456)
To be closer to relatives or friends who live b d
0.0961** -0.084 N/A You do not want to give up -0.148*** -0.160** N/A (0.0457) (0.0835) (0.0337) (0.0625)
To discover soemthing new and meet new
l
0.232*** -0.118** N/A You already have a good job here
-0.238*** -0.0864 N/A (0.0323) (0.0531) (0.0339) (0.0611)
To improve qualifications (e.g. learn l )
0.159*** -0.107** N/A It is too much effort to go and work abroad
-0.172*** -0.126* N/A (0.0289) (0.0499) (0.0374) (0.0695)
Better quality of life 0.165*** 0.066 0.0228** It is difficult to learn a new language
-0.191*** 0.00953 N/A (0.0243) (0.0434) (0.00929) (0.0336) (0.0587) Better political situation abroad
0.121** 0.187** N/A The cost of living is too high abroad
-0.0964*** 0.0548 N/A (0.0517) (0.0849) (0.0341) (0.0594)
Better economic climate abroad
0.219*** -0.0677 0.00523 Yourself or your friends/relatives have made b d i b d
-0.0382 -0.150* N/A (0.0316) (0.0521) (0.0105) (0.0526) (0.0869)
Better social and health care system abroad
0.0567* 0.102* 0.0267** You do not feel qulified enough to work abroad
-0.171*** -0.105 N/A (0.0323) (0.0574) (0.0108) (0.0465) (0.0873)
Other reasons 0.183* 0.111 N/A The quality of life abroad is worse
-0.0998* -0.0864 N/A (0.0952) (0.175) (0.0561) (0.0943)
The political situation abroad is worse
0.0172 0.144 N/A (0.0725) (0.109) The economic climate
abroad is worse -0.107 -0.0429 N/A
(0.0702) (0.105) The attitude towards
foreigners abroad is hostile -0.0321 -0.0224 N/A
(0.0344) (0.0567)
Notes: Marginal effects from binomial Logit regression models of reported variables on the probability of expectations to move sometime in the future (Column 4), stay there for at least 5 years (5), and stay there permanently (6) corresponding to the respective columns of Table 5. N/A represents variables excluded due to less than 10 observations identifying the coefficient (the results in Table 5 are robust to exclusion or inclusion of such variables).

Table 7. Ordered Logit models Stayers and movers Movers only (3) (4) (3) (4) Gender: Female -0.202* -0.134 0.0208 0.112 (0.122) (0.129) (0.165) (0.172) Age (years) -0.0376*** -0.0296** -0.00417 -0.0194 (0.0124) (0.0133) (0.0184) (0.0191) Profession: Self-Employed -0.322 -0.0577 -0.798* -0.977** (0.308) (0.327) (0.463) (0.480) Profession: Manager 0.0859 0.322 -0.327 -0.459 (0.296) (0.315) (0.427) (0.442) Profession: White collar -0.590** -0.351 -0.311 -0.51 (0.276) (0.292) (0.391) (0.404) Profession: Houseperson -0.563* -0.564* -1.111** -1.229*** (0.300) (0.320) (0.436) (0.450) Profession: Unemployed 0.366 0.34 -0.335 -0.587* (0.233) (0.249) (0.316) (0.330) Profession: Manual Worker -0.341 -0.182 -0.451 -0.635* (0.243) (0.260) (0.349) (0.360) Lives With Partner 0.318** 0.251 -0.297 -0.402* (0.145) (0.154) (0.219) (0.228) Lives Alone 0.515*** 0.432*** -0.0762 -0.138 (0.152) (0.161) (0.227) (0.235) Has Children 0.770** 1.066*** -1.315** -1.262** (0.357) (0.376) (0.524) (0.539) Gender x Child -0.595*** -0.652*** 0.916*** 0.964*** (0.212) (0.223) (0.318) (0.326) 16-18 years of education -0.113 -0.202 0.565** 0.797*** (0.197) (0.208) (0.285) (0.297) 18-21 years of education -0.00672 -0.0918 0.514* 0.713** (0.207) (0.219) (0.300) (0.309) 22+ years of education -0.0641 -0.278 0.596* 0.920*** (0.225) (0.239) (0.328) (0.342) Country Fixed Effects Yes Yes Yes Yes Push&Pull Factors and Constraints No Yes No Yes Cut 1 Constant -0.774** 0.266 -1.489*** -2.105*** (0.366) (0.434) (0.563) (0.644) Cut 2 Constant 0.603* 1.830*** 0.237 -0.26 (0.366) (0.436) (0.560) (0.639) Observations 2157 2157 816 816 chi2 379.53 691.15 40.92 111.56 Prob > chi2 0.0000 0.0000 0.0169 0.0000 Pseudo R2 0.1013 0.1844 0.0242 0.0658
Notes: Coefficients from ordered Logit regressions of reported variables on the probability of expectations to move and stay for less than a year, at least a year but less than five years, and more than five years (Columns 1 and 3). Columns 2 and 4 report the coefficient from a regression model excluding the category of stayers. The excluded category is married male without children who still studies or completed his studies before his 16th birthday.
