migration of saline solutions in variably saturated porous media
TRANSCRIPT
www.elsevier.com/locate/jconhyd
Journal of Contaminant Hydrology 72 (2004) 109–133
Migration of saline solutions in variably saturated
porous media
Noam Weisbroda,*, Michael R. Niemetb, Mark L. Rockholdc,Thomas McGinnisd, John S. Selkerd
aDepartment of Environmental Hydrology and Microbiology, Institute for Water Sciences and Technologies,
Jacob Blaustein Institutes for Desert Research, Ben-Gurion University of the Negev,
Sede Boquer Campus 84990, IsraelbCH2M HILL, Corvallis, OR 97330, USA
cPacific Northwest National Laboratory, Richland, WA 99352, USAdDepartment of Bioengineering, Oregon State University, Corvallis, OR 97331, USA
Received 12 November 2002; received in revised form 1 October 2003; accepted 31 October 2003
Abstract
Migration of concentrated NaNO3 solutions in homogeneous packs of pre-wetted silica sands was
investigated using a light transmission system. Solutions of 5 molal NaNO3 were found to migrate
downward 24–62% faster than pure water, in an unstable, fingered manner. This behavior was
attributed primarily to a surface tension induced, non-zero apparent contact angle between the
imbibing and the resident fluids. For saline solutions of similar surface tension to that of pure water
(achieved by the addition of 2% methanol), the migration rates and plume shapes were comparable to
that of water, demonstrating that density was not the primary source of the observed differences in
migration patterns. At depths where resident saturation increased above residual, the migration
process appeared to occur via film flow with slight changes in saturation ( < 4%), rather than in a
series of abrupt jumps, as observed at shallower depths. A method for contact angle scaling was used
to illustrate the effects of non-zero contact angles on capillary pressure–saturation curves.
D 2003 Elsevier B.V. All rights reserved.
Keywords: Interfacial tension; Contact angle; Saltwater; Moisture content; Film flow; Capillary forces
1. Introduction
Highly concentrated solutions of electrolytes are rare in natural environments; it is
uncommon for concentrations resulting from agrochemicals and other contaminants to
0169-7722/$ - see front matter D 2003 Elsevier B.V. All rights reserved.
doi:10.1016/j.jconhyd.2003.10.013
* Corresponding author. Tel.: +972-8-6596903; fax: +972-8-6596909.
E-mail address: [email protected] (N. Weisbrod).

N. Weisbrod et al. / Journal of Contaminant Hydrology 72 (2004) 109–133110
exceed 0.5 mol/l. An extreme case exists at the Hanford Nuclear Reservation, in southeast
Washington State, where more than 4 million liters of highly saline solutions have leaked
from radioactive waste storage tanks over the last 50 years. These caustic solutions are
typically extremely saline (>5 mol/l) and have migrated into the underlying vadose zone.
They have been identified in the local groundwater system, at a depth of roughly 60 m
below the ground surface in some areas (GJPO, 1996). Although this represents an
extreme case, migration of highly saline solutions is also likely to be of concern at selected
landfills, industrial complexes and other waste facilities. This paper explores experimen-
tally and conceptually the processes that control the initial disposition of such highly
concentrated solutions as they penetrate unsaturated porous media.
Several factors should be taken into account when considering migration of highly
saline solutions in the vadose zone: (1) the density, viscosity and surface tension of the
infiltrating solution; (2) the effective contact angle between the advancing saline solution
and the interface with which it is wetting; (3) gradients in vapor pressure between the salty
plume and the surrounding pore-water (Weisbrod et al., 2003); (4) dispersion and
diffusion; and (5) the potential release of colloidal particles from the solid surfaces due
to the rise and fall of the local ionic strength (e.g., Blume et al., 2002).
Surface tension is an important parameter affecting flow in unsaturated porous media.
Past studies have focused on compounds that tend to reduce surface tension. For example,
dissolved organic compounds reduce the surface tension at gas–liquid interfaces and have
a significant affect on unsaturated flow (Dicarlo et al., 2000; Smith and Gillham, 1994,
1999). Selker and Schroth (1998) found that the effective contact angle of liquid entering
dry sand was far from zero and that hydrodynamic scaling based on fluid viscosity, surface
tension and density are not sufficient to account for the effect of liquid–air interfacial
tension. Very little work has been devoted to the study of the mechanisms that control
migration of high surface tension (saline) solutions. Ouyang and Zheng (1999) considered
saline solutions in model systems; however, surface tension and contact angle were
neglected. Only the impact of solution density was investigated and was found to have a
negligible effect on transport of aldicarb (relatively low solubility), but a significant effect
on transport of acephate (relatively high solubility).
This paper focuses on the relative rates of migration of highly saline solutions as
influenced primarily by factors (1) and (2) above, which are the most immediate, short
time processes. Some very interesting longer time frame issues are explored in Weisbrod et
al. (2003). In this paper, the migration patterns of various infiltrating solutions are
compared for four sand textures. Hypotheses and mechanisms for the observed phenom-
ena are then discussed.
2. Capillary pressure in unsaturated porous media
For primary wetting into previously dry porous media, the interface between liquid and
a pore, in a pore of mean radius r, requires that at equilibrium:
pc ¼ pg � pl ¼2ðrsg � rlsÞ
rð1Þ
N. Weisbrod et al. / Journal of Contaminant Hydrology 72 (2004) 109–133 111
where pc is the change in pressure across the gas–liquid interface, pg is the pressure in
the gas phase, pl is the pressure in the liquid phase, rsg is the interfacial tension of the
solid–gas interface and rls is the interfacial tension of the liquid–solid interface. For
most systems, the interfacial tensions, rsg and rls, cannot be measured accurately.
Therefore, it is typically sought to express Eq. (1) in terms of readily available
parameters. In most gas– liquid–solid capillary systems, these parameters are the
liquid–gas interfacial tension and the contact angle between the liquid–gas interface
and the solid.
Young’s equation states that for contact between a liquid–gas interface and rigid solid
at equilibrium
rsg ¼ rls þ rlgcosc ð2Þ
where rlg is the interfacial tension between the liquid and the gas phases and c is the
contact angle of the liquid–gas interface with the solid. Combining Eqs. (1) and (2)
yields:
pc ¼ pg � pl ¼2rlgcosc
rð3Þ
For a given pore size, the capillary pressure depends on the interfacial tension between
the liquid–gas interface, the density of the fluid and the contact angle. If rlg and c are
known, rsg and rlg can be evaluated numerically using an equation of state approach
(Spelt et al., 1992).
The interfacial tension between the liquid and the gas phases, rlg, increases with
electrolyte concentration. The magnitude of this change depends on the type and
concentration of salt (Lide, 1991). Increases in the ionic strength of an imbibing
solution may also increase the contact angle. The magnitude of such changes depends
on the liquid properties and the wettability of the solid surface (e.g., Butkus and Grasso,
1998). Selker and Schroth (1998) found that the apparent contact angle also might vary
as a function of migration rate and can be non-zero even for pure water. Recent work by
Hassanizadeh et al. (2002) indicates that dynamic effects in capillary pressure–
saturation relationships may also have a significant impact on unsaturated flow. Such
dynamic effects could be accentuated for saline solutions infiltrating into water-wet
porous media. These dynamic effects may be due, in part, to dynamic changes in the
effective contact angle during the migration process. Although both liquid–gas
interfacial tension and contact angle generally increase with the electrolyte concentra-
tion, the relationships between these changes are largely unknown. The determination of
contact angles on soil surfaces is known to be problematic (Drelich et al., 1996;
Morrow, 1975). Furthermore, the relationship between apparent contact angle and
capillary pressure (interfacial curvature) at pore walls has been shown to be non-
constant or hysteretic (Philip, 1971).
N. Weisbrod et al. / Journal of Contaminant Hydrology 72 (2004) 109–133112
3. Materials and methods
3.1. Experimental setup
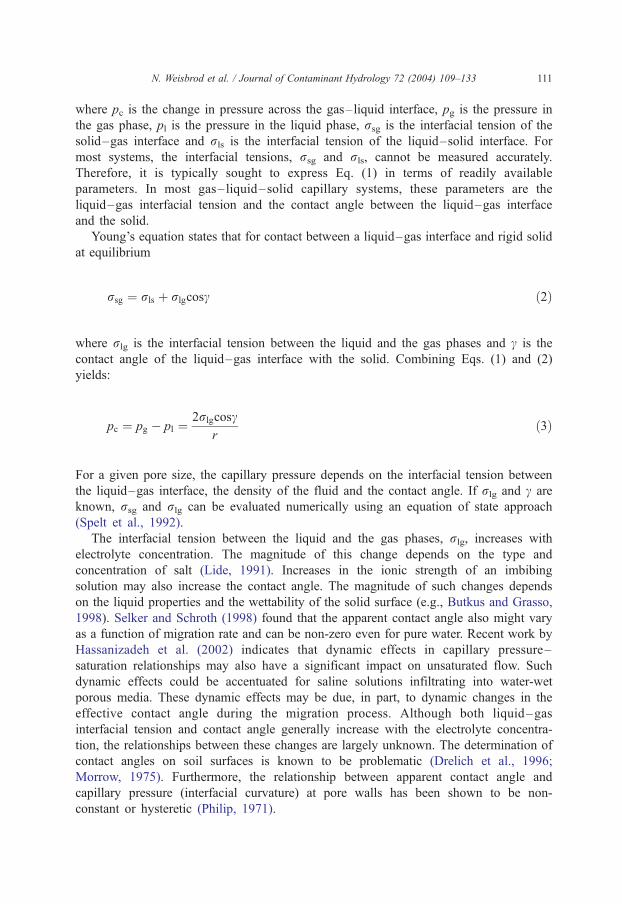
A light transmission system was used to quantify liquid content within 2D flow cells in
space and time. The light transmission system consisted of three primary components:
chamber, light source and detector (Fig. 1a). The media-containing portion of the light
transmission system, referred to as the chamber, consisted of two 1.27-cm-thick� 50.0-
Fig. 1. (a) Major optical components of the light transmission system and (b) exploded and assembled views of
the light transmission chamber.
N. Weisbrod et al. / Journal of Contaminant Hydrology 72 (2004) 109–133 113
cm-wide� 65.0-cm-high glass panels separated by a 1.0-cm-thick U-shaped aluminum
spacer. The glass sheets were sealed to the spacer by 4.8-mm diameter rubber O-ring stock
contained within continuous channels machined on both faces of the spacer. A drain-port
through the bottom of the spacer allowed exchange of fluid within the system. A 1.0-cm-
thick acrylic manifold topped with 200-mesh stainless steel wire screen provided the lower
media boundary. The chamber components were compressed together within a rubber-
lined aluminum frame. The resulting inner chamber thickness was 1.0 cm (Fig. 1b). All
aluminum parts were anodized black to avoid reflections.
The light source, to which the chamber was mounted, consisted of eight fluorescent
tubes (Philips F17T8/TL835, 61 cm) within a black sheet metal enclosure. The detection
system utilized a thermoelectrically cooled 14-bit gray-scale digital CCD camera (ISI
Systems, Santa Barbara, CA) with a Kodak KAF0400 (768� 512 pixel) scientific grade
CCD array. The distance from the chamber to the camera lens (Nikon, 50 mm, F1.4-16)
was 4 m. All images were obtained through a 620-nm center-wavelength, 10-nm band-
pass, filter (OrielR 53930, Stratford, CT) installed in the camera’s internal filter wheel. In
all cases, the lens aperture setting was F4 and exposure times varied from 0.8 to 1.8 s
depending on media type. With this system geometry, each pixel on an image represented
1 mm2 of chamber surface area.
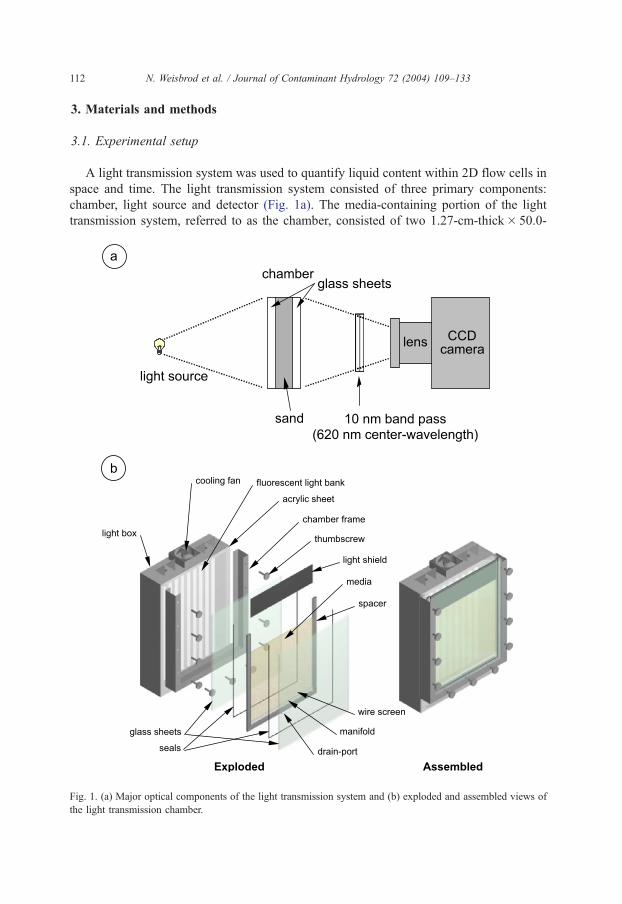
The media used was AccusandR (Unimin, Le Sueur, MN); well-defined, homogenous,
translucent silica sands in 12/20, 20/30, 30/40 and 40/50 grades. Major physical and
mineralogical properties of the sands are summarized in Table 1. A more-detailed
description of the AccusandR properties can be found in Schroth et al. (1996). Preparation
of the sand consisted of rinsing with deionized water 8–10 times, until no turbidity was
observed in the supernatant. Next, the sand was dried in an oven at 45 jC for 48 h. No
other chemical treatments were performed to remove colloidal materials and oxides from
the sand grains.
Five solutions were used for the migration experiments. These solutions are
identified as: (A) 5 molal NaNO3; (B) 5 molal NaNO3 with 2% methanol by
volume; (C) distilled, deionized, water (NANOpureR 04751, Barnstead Thermolyne);
(D) 2 molal NaNO3; and (E) 0.75 molal NaNO3. Note that the NaNO3 was chosen
due to its high concentrations in the Hanford radioactive wastes. The molal
concentrations represent moles of salt per kilogram of water. The physical properties
Table 1
Accusand and packed chamber properties
12/20 20/30 30/40 40/50
Particle diameter, d50 (mm)a 1.105 0.713 0.532 0.359
Uniformity coefficient (d60/d10)a 1.231 1.130 1.207 1.200
Particle density (g/cm3)a 2.665 2.664 2.665 2.663
Total Fe (g/kg)a 9.31 7.64 7.65 5.58
Ks (cm/min)a 30.19 10.02 8.94 4.33
Porosity 0.342 0.335 0.337 0.340
Capillary fringe depth (height)b 47.5 (7.5) 41.5 (13.5) 37 (18.0) 32 (23.0)
zf (cm) 44 37 29 22
a From Schroth et al. (1996).b cm above zero pressure level.

Table 2
Solution properties
Solution Composition Density
(g/cm3)
Viscosity
(cp)
Fluid mobility
ratio
Surface tension
(mN/m)
A 5 molal NaNO3 1.247 1.314 0.96 80.54
B 5 molal NaNO3 + 2%
methanol
1.199 1.034 1.17 70.28
C Pure water 0.993 1.001 1.00 72.8
D 2 molal NaNO3 1.095 1.117 0.99 75.19
E 0.75 molal NaNO3 1.037 1.036 1.01 73.69
N. Weisbrod et al. / Journal of Contaminant Hydrology 72 (2004) 109–133114
of the solutions and a summary of the experimental details are given in Tables 2 and
3, respectively. Viscosity (GilmontR low shear falling ball viscometer), density and
surface tension (pendent drop technique on a KrussR Automated Goniometer DSA
10) were measured for each of the solutions (ThetaDyne, Charlotte, NC). Although
the solution properties were measured prior to interaction with the AccusandR, the
low organic content of the sand (b1%) suggest that no significant variation in those
properties are likely to occur. The addition of nitrate to the solutions raised the
surface tension and viscosity of the solution by promoting hydrogen-bonding strength.
This was offset by the addition of Methanol (surface tension of 25 mN/m) to solution
B to reduce the surface tension. The addition of 2% methanol (by volume) to a 5
molal NaNO3 solution lowered the surface tension to approximately that of pure
water, while only slightly lowering viscosity and density (Table 2).
The relative mobilities of different fluids can be estimated from ratios of kinematic
viscosities, (q‘/l‘)/(qw/lw), where q is the fluid density, l is the dynamic viscosity, and the
subscripts ‘ and w denote the fluid of interest (e.g., NaNO3 solution) and pure water,
respectively (Table 2). The relative mobility of the 5 molal NaNO3 solution is 0.96, which
indicates that this solution is actually less mobile than pure water, in spite of its higher
density, due to its much higher viscosity. The relative mobility of the NaNO3 solution
containing 2% methanol is 1.17, which indicates that this solution is the most mobile of
those tested. It should be noted, however, that these estimates of relative mobility do not
consider surface tension, wettability, or contact angle effects, which are discussed in more
detail with the experimental results.
Table 3
List of experiments reported, indicating the sand, pre-wetting solution and solutions applied, as well as the
number of images taken and the light transmission calibration parameter
Exp. no. Sand grade Pre-wetteda Left plume Center plume Right plume Number of frames Ires/Is
1 12/20 C A C B 77 0.336
2 20/30 C A C B 66 0.230
3 30/40 C A B C 52 0.141
4 40/50 C A C B 48 0.098
5 30/40 C A D E 60 0.154
6 40/50 A A C B 57 0.075
7 30/40 C A None B 78 0.135
a See solution properties in Table 2.

N. Weisbrod et al. / Journal of Contaminant Hydrology 72 (2004) 109–133 115
3.2. Experimental procedure
The salient experimental conditions of seven experiments (Experiments 1–7) are
summarized in Table 3. To insure reproducibility, three additional experiments were
carried out as repetitions of Experiments 2–4. These results were consistent with the first
experiments and are not discussed for reasons of brevity.
In all experiments, the chamber was prepared and packed with a single sand grade as
described in Niemet and Selker (2001) and Weisbrod et al. (2002). The pore space was
purged with at least 10 pore volumes of CO2 gas, slowly delivered through the lower port.
Next, distilled water (solution C) was delivered through the same port at f 20 ml/min
until the media was saturated, with the exception of Experiment 7, in which solution Awas
used for the wetting process. To ensure complete saturation and removal of dissolved CO2,
four additional pore volumes of water were passed through the sand. The porosity of each
pack (Table 1) was determined based on the volume of fluid required to saturate the sand,
the mass of sand and the overall internal volume of the chamber. Images were taken prior
to and following saturation in all experiments, which were termed the ‘‘dry’’ and
‘‘saturated’’ images, respectively. After saturation, the chamber was allowed to slowly
drain ( < 10 ml/min) for 24 h, with the zero-pressure level held at the height of the
manifold’s upper surface. Following drainage the outflow pipe was closed in all experi-
ments, excluding Experiment 7. The vertical extent of saturated media (capillary fringe
height) ranged from 7.5 to 23 cm above the manifold surface, depending upon sand grade
(Table 1).
Typically, three evenly spaced 5-ml solution applications (Table 2) were dripped at a
rate of 1 ml/min onto the surface of the sand. In Experiment 7, only two solutions were
used (Table 3). An image was taken immediately after application, followed by imaging at
10-min intervals for the first 3 h after the injection, at 1-h intervals from 3 to 24 h after the
injection, at 2-h intervals from 24 to 48 h after the injection and at 3-h intervals from 48 to
72 h after the injection. In some of the experiments, additional images were taken after 72
h. The total number of images ranged from 48 to 78 per experiment (Table 3).
3.3. Image processing and data analysis
Post-experiment image processing to determine liquid saturation from the raw data
images was performed using the method of Niemet and Selker (2001). After removing the
bias and dark signals from the images, the relative degree of light transmission, I/Is, was
computed on a pixel-by-pixel basis, where I represents the transmission image of interest
and Is represents the saturated image. The log-scaled relative degree of light transmission,
X, was then determined as
X ¼ lnI
Is
� ��ln
Ires
Is
� �ð4Þ
where, Ires/Is is the average relative light transmission at residual saturation (Sres),
determined for each experiment from the image immediately prior to application of the
N. Weisbrod et al. / Journal of Contaminant Hydrology 72 (2004) 109–133116
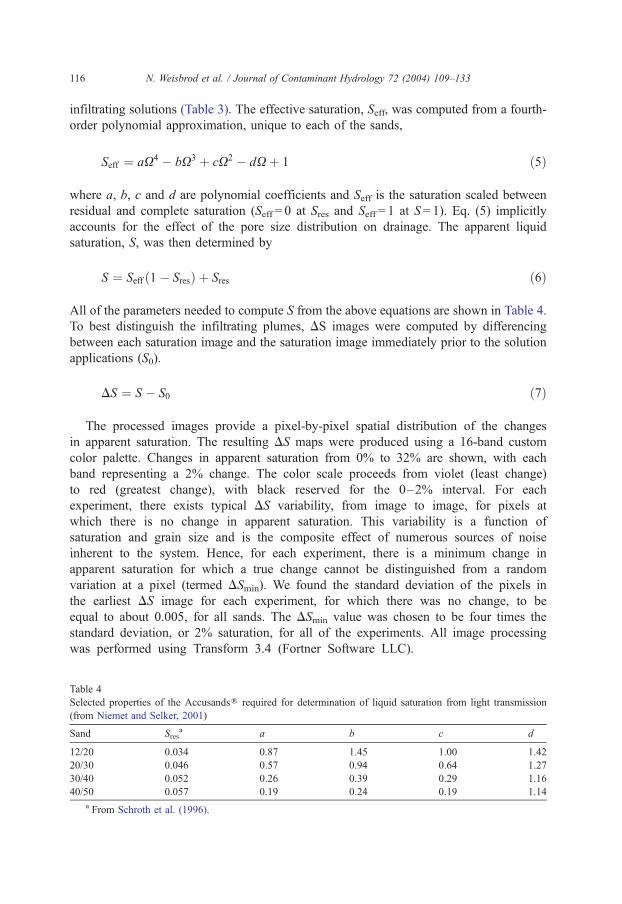
infiltrating solutions (Table 3). The effective saturation, Seff, was computed from a fourth-
order polynomial approximation, unique to each of the sands,
Seff ¼ aX4 � bX3 þ cX2 � dX þ 1 ð5Þ
where a, b, c and d are polynomial coefficients and Seff is the saturation scaled between
residual and complete saturation (Seff = 0 at Sres and Seff = 1 at S = 1). Eq. (5) implicitly
accounts for the effect of the pore size distribution on drainage. The apparent liquid
saturation, S, was then determined by
S ¼ Seff ð1� SresÞ þ Sres ð6Þ
All of the parameters needed to compute S from the above equations are shown in Table 4.
To best distinguish the infiltrating plumes, DS images were computed by differencing
between each saturation image and the saturation image immediately prior to the solution
applications (S0).
DS ¼ S � S0 ð7Þ
The processed images provide a pixel-by-pixel spatial distribution of the changes
in apparent saturation. The resulting DS maps were produced using a 16-band custom
color palette. Changes in apparent saturation from 0% to 32% are shown, with each
band representing a 2% change. The color scale proceeds from violet (least change)
to red (greatest change), with black reserved for the 0–2% interval. For each
experiment, there exists typical DS variability, from image to image, for pixels at
which there is no change in apparent saturation. This variability is a function of
saturation and grain size and is the composite effect of numerous sources of noise
inherent to the system. Hence, for each experiment, there is a minimum change in
apparent saturation for which a true change cannot be distinguished from a random
variation at a pixel (termed DSmin). We found the standard deviation of the pixels in
the earliest DS image for each experiment, for which there was no change, to be
equal to about 0.005, for all sands. The DSmin value was chosen to be four times the
standard deviation, or 2% saturation, for all of the experiments. All image processing
was performed using Transform 3.4 (Fortner Software LLC).
Table 4
Selected properties of the AccusandsR required for determination of liquid saturation from light transmission
(from Niemet and Selker, 2001)
Sand Sresa a b c d
12/20 0.034 0.87 1.45 1.00 1.42
20/30 0.046 0.57 0.94 0.64 1.27
30/40 0.052 0.26 0.39 0.29 1.16
40/50 0.057 0.19 0.24 0.19 1.14
a From Schroth et al. (1996).
N. Weisbrod et al. / Journal of Contaminant Hydrology 72 (2004) 109–133 117
Wetting front depth is defined here as the location of the tip of the plume where
DSzDSmin. To better distinguish the wetting front contours, two smoothing passes were
performed on the DS images. In each smoothing pass, every pixel was averaged with its
eight nearest neighbors. Incremental wetting front velocities, vi, were calculated from the
vertical distance traveled by the wetting front over the time between consecutive images:
vi ¼zi � zi�1
ti � ti�1
ð8Þ
These velocities describe the dynamic behavior of the plumes as they evolve and provide
information about the flow process within a restricted depth interval for the conditions at
that time.
It should be noted that high concentrations of salts increase the index of refraction of the
liquid and consequently affect the saturation values measured using the light transmission
method. As the index of refraction of the liquid increases, it approaches that of the
translucent sand particles, resulting in less interfacial losses as the light passes between
solid and liquid phases (Niemet and Selker, 2001). The result will be a net increase in
transmitted light provided that the media is close to saturation. However, an increase in the
index of refraction of the liquid will create a greater differential between the index of
refraction of the gaseous phase and increase the interfacial losses between the liquid and
gaseous phases. Hence, relative to pure water, an increase in the index of refraction can be
expected to produce an increase in transmitted light when the media is nearly saturated and a
decrease in transmitted light when the media is near residual saturation. The magnitude of
the change in light transmission for a given salt depends on both the salt concentration and
the degree of liquid saturation and cannot be accurately corrected for at this time. While this
will affect apparent saturation values predicted from light transmission and would be of
concern if precise mass balances were required, it does not significantly affect the
delineation of the plumes.
4. Results
4.1. Residually saturated zone
Images showing the changes in apparent saturation (DS) following application of the
solutions are shown in Figs. 2–5, for sand grades 12/20 (Experiment 1), 20/30
(Experiment 2), 30/40 (Experiment 3) and 40/50 (Experiment 4), respectively. The first
image (time = 0) was taken immediately after the solution application was completed. The
infiltrating fluids in these experiments were A, C and B, from left to right (except
Experiment 3, Tables 2 and 3). The resident fluid was distilled water, C. Wetting front
depth as a function of time for these four experiments is presented in Fig. 6. From Figs. 2–
6, it is clear that, in all four experiments, solution A migrated downward faster than B and
B faster than C. Modification of the application location (A, B, C—from left to right), as
demonstrated in Experiment 3 (Fig. 4), had no influence on the relative migration rates,
showing that packing variations across the width of the chamber were negligible.

Fig. 2. Three frames from Experiment 1. Solutions A, C and B (left to right, respectively) were applied to 12/20
sand pre-wetted with pure water C. Time from end of application is noted above each frame. The pseudo-
colorized images describe the apparent changes in saturation (DS) with respect to before solutions were applied.
N. Weisbrod et al. / Journal of Contaminant Hydrology 72 (2004) 109–133118
Since the imaging time sequence was similar for all the experiments, the incremental
wetting front velocities can be directly compared at a given time, from the slopes of the
curves on Fig. 6 (note the data triplets at each time). Also, velocities can be compared at
Fig. 3. Three frames from Experiment 2. Solutions A, C and B (left to right, respectively) were applied to 20/30
sand pre-wetted with pure water C. Time from end of application is noted above each frame. The pseudo-
colorized images describe the apparent changes in saturation (DS) with respect to before solutions were applied.
Arrow denotes the secondary plume.

Fig. 5. Three frames from Experiment 4. Solutions A, C and B (left to right, respectively) were applied to 40/50
sand pre-wetted with pure water C. Time from end of application is noted above each frame. The pseudo-
colorized images describe the apparent changes in saturation (DS) with respect to before solutions were applied.
Arrow denotes the secondary plume. Note that fluid from plume A developed a flow path along the left side of the
chamber.
Fig. 4. Three frames from Experiment 3. Solutions A, B and C (left to right, respectively) were applied to 30/40
sand pre-wetted with pure water C. Time from end of application is noted above each frame. The pseudo-
colorized images describe the apparent changes in saturation (DS) with respect to before solutions were applied.
Arrow denotes the secondary plume.
N. Weisbrod et al. / Journal of Contaminant Hydrology 72 (2004) 109–133 119
N. Weisbrod et al. / Journal of Contaminant Hydrology 72 (2004) 109–133120
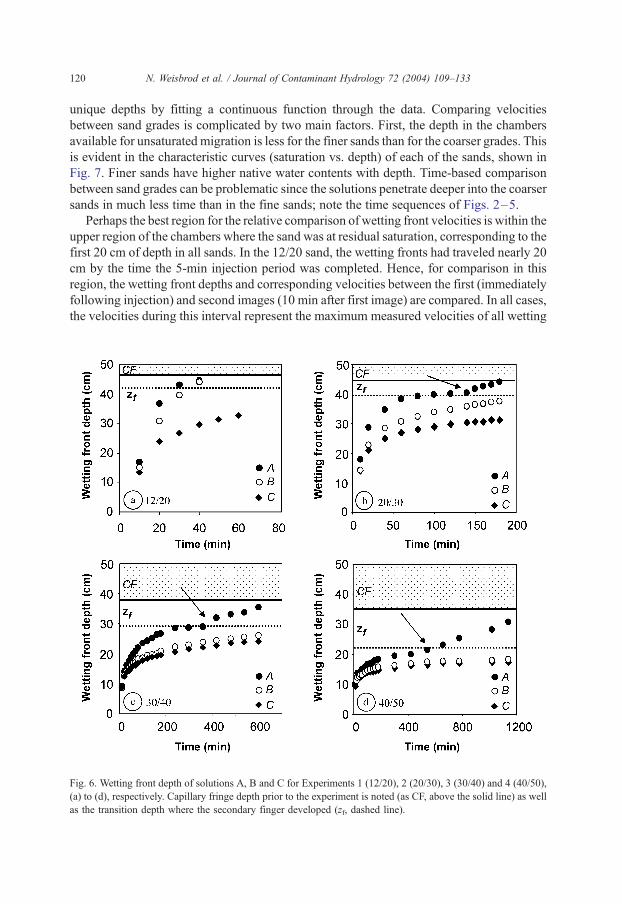
unique depths by fitting a continuous function through the data. Comparing velocities
between sand grades is complicated by two main factors. First, the depth in the chambers
available for unsaturated migration is less for the finer sands than for the coarser grades. This
is evident in the characteristic curves (saturation vs. depth) of each of the sands, shown in
Fig. 7. Finer sands have higher native water contents with depth. Time-based comparison
between sand grades can be problematic since the solutions penetrate deeper into the coarser
sands in much less time than in the fine sands; note the time sequences of Figs. 2–5.
Perhaps the best region for the relative comparison of wetting front velocities is within the
upper region of the chambers where the sand was at residual saturation, corresponding to the
first 20 cm of depth in all sands. In the 12/20 sand, the wetting fronts had traveled nearly 20
cm by the time the 5-min injection period was completed. Hence, for comparison in this
region, the wetting front depths and corresponding velocities between the first (immediately
following injection) and second images (10 min after first image) are compared. In all cases,
the velocities during this interval represent the maximum measured velocities of all wetting
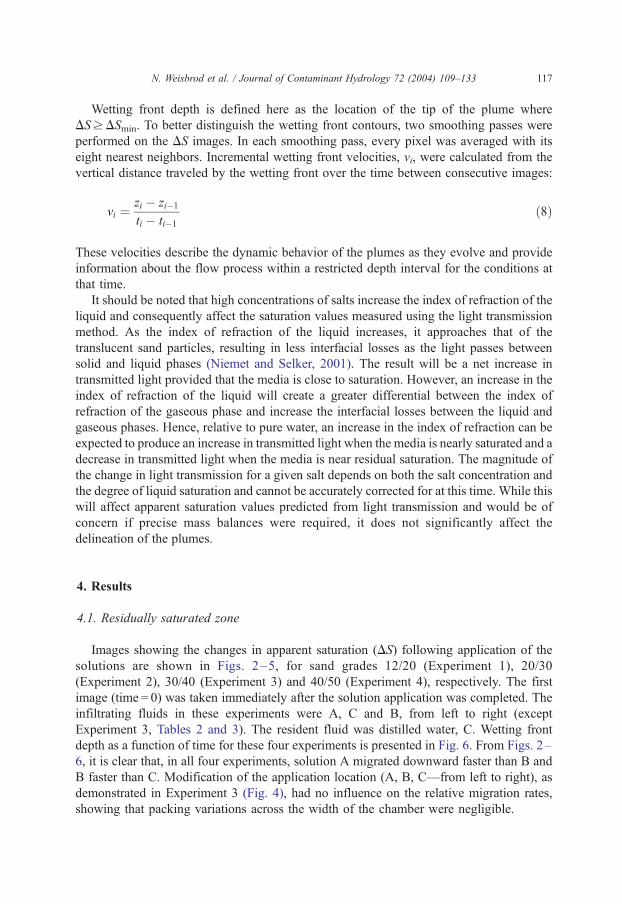
Fig. 6. Wetting front depth of solutions A, B and C for Experiments 1 (12/20), 2 (20/30), 3 (30/40) and 4 (40/50),
(a) to (d), respectively. Capillary fringe depth prior to the experiment is noted (as CF, above the solid line) as well
as the transition depth where the secondary finger developed (zf, dashed line).
0.0 0.2 0.4 0.6 0.8 1.0
50
40
30
20
10
0
Saturation
Dep
th,
cm
zf,20/30
44
37
29
22
outflow manifold depth = 55 cm
zf,12/20
zf,30/40
zf,40/50
12/20 20/30 30/40 40/50
Fig. 7. Characteristic curves of the four sand grades as calculated from the image immediately prior to
the application of the solutions. Each depth measurement represents the average of all pixels within the
given row. The transition depth between residual and funicular water content, zf, is noted for each sand
grade.
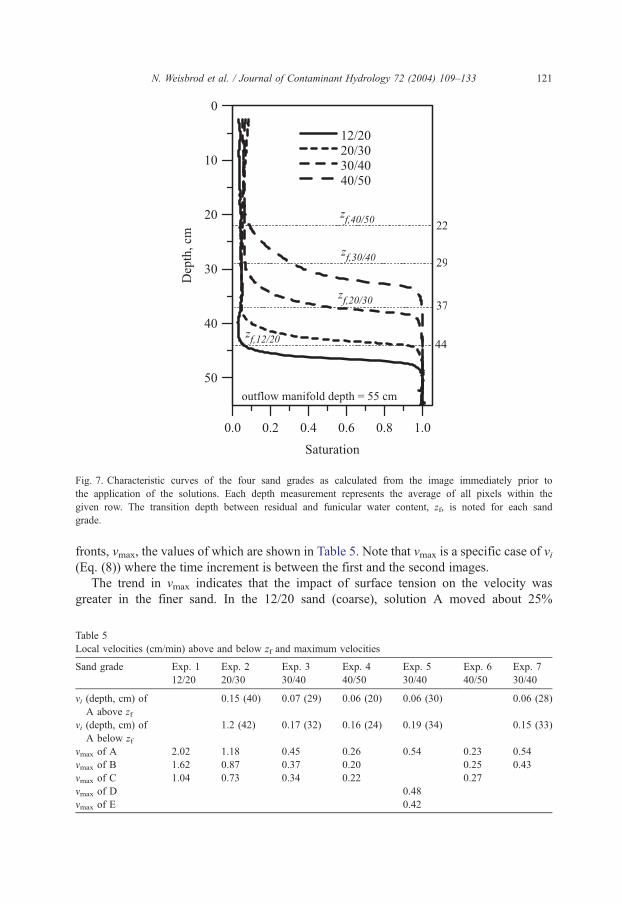
N. Weisbrod et al. / Journal of Contaminant Hydrology 72 (2004) 109–133 121
fronts, vmax, the values of which are shown in Table 5. Note that vmax is a specific case of vi(Eq. (8)) where the time increment is between the first and the second images.
The trend in vmax indicates that the impact of surface tension on the velocity was
greater in the finer sand. In the 12/20 sand (coarse), solution A moved about 25%
Table 5
Local velocities (cm/min) above and below zf and maximum velocities
Sand grade Exp. 1
12/20
Exp. 2
20/30
Exp. 3
30/40
Exp. 4
40/50
Exp. 5
30/40
Exp. 6
40/50
Exp. 7
30/40
vi (depth, cm) of
A above zf
0.15 (40) 0.07 (29) 0.06 (20) 0.06 (30) 0.06 (28)
vi (depth, cm) of
A below zf
1.2 (42) 0.17 (32) 0.16 (24) 0.19 (34) 0.15 (33)
vmax of A 2.02 1.18 0.45 0.26 0.54 0.23 0.54
vmax of B 1.62 0.87 0.37 0.20 0.25 0.43
vmax of C 1.04 0.73 0.34 0.22 0.27
vmax of D 0.48
vmax of E 0.42

N. Weisbrod et al. / Journal of Contaminant Hydrology 72 (2004) 109–133122
faster than solution B, but both migrated more than 50% faster than solution C (Figs.
2 and 6a, Table 5). Therefore, it seems that both higher solution density and higher
surface tension led to the higher migration rate of the solutions. In the 20/30 sand,
solution A migrated about 36% faster than B and about 62% faster than C (Figs. 3
and 6b, Table 5). In the 30/40 and 40/50 sand grades, solution A migrated about
27% and 24%, faster than B and C, respectively, which moved at similar rates
despite their different densities (Figs. 4, 5 and 6c,d, Table 5). In the 40/50 sand, the
velocity of B was slightly lower than C, despite the significantly higher density of B.
It should be noted, however, that the velocities were generally very low in these sand
grades. Therefore, over the 10-min interval for which vmax was calculated, the
solutions migrated a very small distance. The overall travel time through the residual
water content zone (see Fig. 7) of solution A is more than a factor of three less than
that of solutions B and C in the 30/40 and 40/50 sands.
In Figs. 2–5, it is evident that significantly greater apparent changes in saturation
were observed for the saline plumes relative to the pure water plumes for each of the
sands. For 12/20 sand (Fig. 2), where the three plumes are distinctly separated at
early time, the total predicted volumetric changes in the saline plumes exceed the
pure water plume by up to 50%. This phenomenon is likely the result of the higher
indices of refraction of the saline solutions relative to pure water, as discussed
previously. Therefore, it should be recognized for the saline plumes that the apparent
changes in saturation are not representative of actual changes in saturation and should
be used only as an indication of relative plume displacement.
4.2. Zone with saturations above residual
In all sand grades except 12/20, a ‘‘secondary finger’’ developed at the tip of the
wetting front of solution A (Figs. 3–6), at a point slightly above the capillary fringe.
This occurrence is marked by a narrowing of the plume width and an increase in the
local velocity (Table 5). Due to the 1-h delay between images at this point in the
experiment, the exact depth and time of the velocity increase could not be
determined. Development of the secondary finger appears to correspond to the depth
where transition between residual pendular water and water in the funicular state
occurred. We use the symbol zf to refer to the depth at which the rapid transition
from residual to funicular water occurs (Fig. 7). This also corresponds to the depth
where the secondary finger formation was initiated.
It should be noted that the DS values within the secondary finger were less than
4%, which is only slightly above the DSmin. In contrast, the DS values within the
wetting front of the primary plume were greater than 10%. Therefore, it is likely that
different mechanisms controlled the flow in the primary vs. secondary finger. The
low DS values below zf suggest that flow may have occurred via this zone before the
secondary finger was actually observed, corresponding to regions where DS <DSmin.
Fluid accumulation on top of the capillary fringe before the secondary finger was
observed to reach this depth supports this hypothesis. No secondary fingers were
observed for solutions B or C in the four experiments. They apparently did not reach
the critical depth, zf, required for this to occur (Fig. 6).
N. Weisbrod et al. / Journal of Contaminant Hydrology 72 (2004) 109–133 123
4.3. Impact of salt concentration, resident fluid and merging plumes
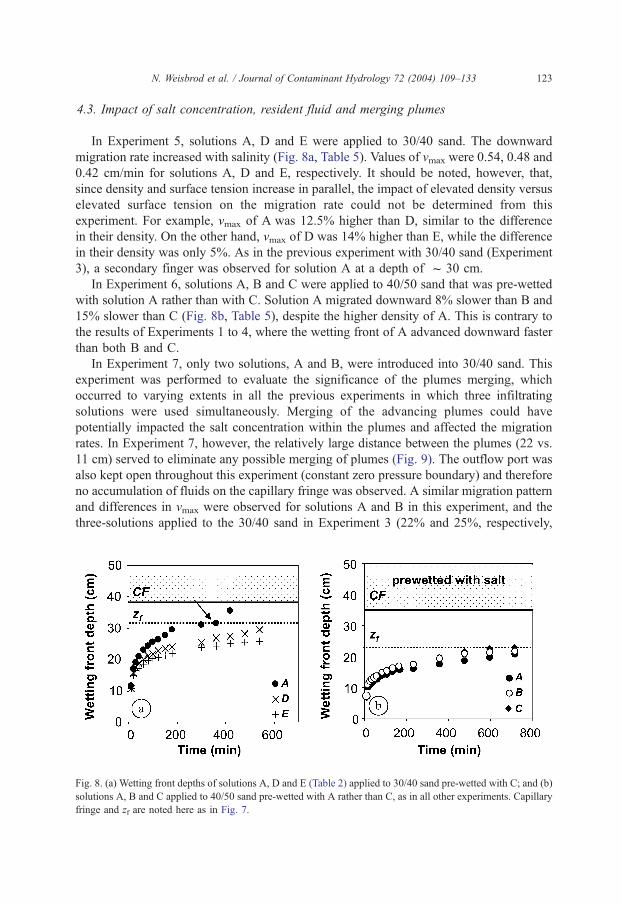
In Experiment 5, solutions A, D and E were applied to 30/40 sand. The downward
migration rate increased with salinity (Fig. 8a, Table 5). Values of vmax were 0.54, 0.48 and
0.42 cm/min for solutions A, D and E, respectively. It should be noted, however, that,
since density and surface tension increase in parallel, the impact of elevated density versus
elevated surface tension on the migration rate could not be determined from this
experiment. For example, vmax of A was 12.5% higher than D, similar to the difference
in their density. On the other hand, vmax of D was 14% higher than E, while the difference
in their density was only 5%. As in the previous experiment with 30/40 sand (Experiment
3), a secondary finger was observed for solution A at a depth of f 30 cm.
In Experiment 6, solutions A, B and C were applied to 40/50 sand that was pre-wetted
with solution A rather than with C. Solution A migrated downward 8% slower than B and
15% slower than C (Fig. 8b, Table 5), despite the higher density of A. This is contrary to
the results of Experiments 1 to 4, where the wetting front of A advanced downward faster
than both B and C.
In Experiment 7, only two solutions, A and B, were introduced into 30/40 sand. This
experiment was performed to evaluate the significance of the plumes merging, which
occurred to varying extents in all the previous experiments in which three infiltrating
solutions were used simultaneously. Merging of the advancing plumes could have
potentially impacted the salt concentration within the plumes and affected the migration
rates. In Experiment 7, however, the relatively large distance between the plumes (22 vs.
11 cm) served to eliminate any possible merging of plumes (Fig. 9). The outflow port was
also kept open throughout this experiment (constant zero pressure boundary) and therefore
no accumulation of fluids on the capillary fringe was observed. A similar migration pattern
and differences in vmax were observed for solutions A and B in this experiment, and the
three-solutions applied to the 30/40 sand in Experiment 3 (22% and 25%, respectively,
Fig. 8. (a) Wetting front depths of solutions A, D and E (Table 2) applied to 30/40 sand pre-wetted with C; and (b)
solutions A, B and C applied to 40/50 sand pre-wetted with A rather than C, as in all other experiments. Capillary
fringe and zf are noted here as in Fig. 7.
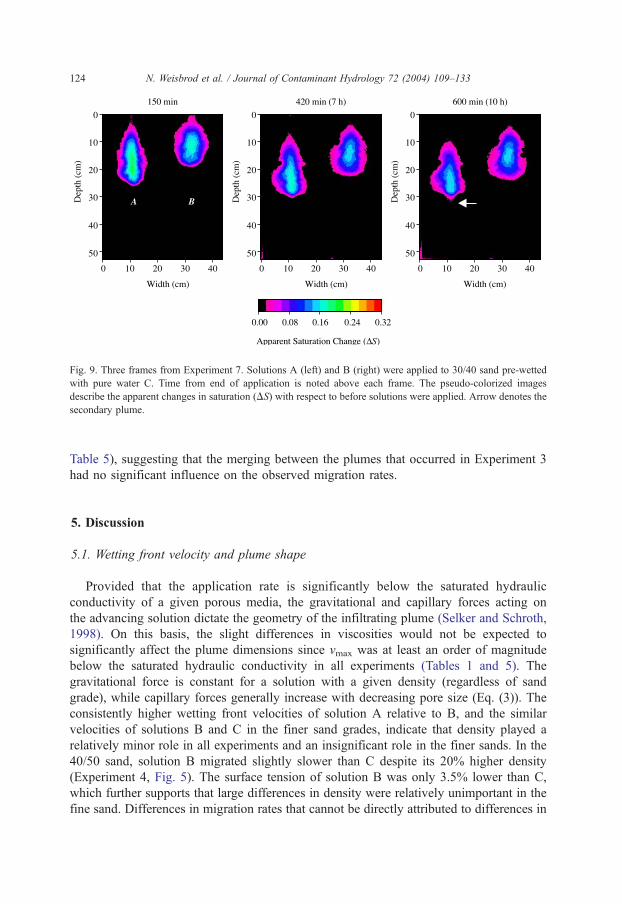
Fig. 9. Three frames from Experiment 7. Solutions A (left) and B (right) were applied to 30/40 sand pre-wetted
with pure water C. Time from end of application is noted above each frame. The pseudo-colorized images
describe the apparent changes in saturation (DS) with respect to before solutions were applied. Arrow denotes the
secondary plume.
N. Weisbrod et al. / Journal of Contaminant Hydrology 72 (2004) 109–133124
Table 5), suggesting that the merging between the plumes that occurred in Experiment 3
had no significant influence on the observed migration rates.
5. Discussion
5.1. Wetting front velocity and plume shape
Provided that the application rate is significantly below the saturated hydraulic
conductivity of a given porous media, the gravitational and capillary forces acting on
the advancing solution dictate the geometry of the infiltrating plume (Selker and Schroth,
1998). On this basis, the slight differences in viscosities would not be expected to
significantly affect the plume dimensions since vmax was at least an order of magnitude
below the saturated hydraulic conductivity in all experiments (Tables 1 and 5). The
gravitational force is constant for a solution with a given density (regardless of sand
grade), while capillary forces generally increase with decreasing pore size (Eq. (3)). The
consistently higher wetting front velocities of solution A relative to B, and the similar
velocities of solutions B and C in the finer sand grades, indicate that density played a
relatively minor role in all experiments and an insignificant role in the finer sands. In the
40/50 sand, solution B migrated slightly slower than C despite its 20% higher density
(Experiment 4, Fig. 5). The surface tension of solution B was only 3.5% lower than C,
which further supports that large differences in density were relatively unimportant in the
fine sand. Differences in migration rates that cannot be directly attributed to differences in

N. Weisbrod et al. / Journal of Contaminant Hydrology 72 (2004) 109–133 125
fluid mobility (Table 2) are presumably a result of surface tension and contact angle
effects.
The plume widths are difficult to quantify since they evolve in time, are convoluted in
shape, and the fingers merged at later time in the finer sands. Qualitatively, from Figs. 2–5
and 9, it is apparent that a narrower finger was formed by the higher surface tension
solution (A) relative to the lower surface tension solutions (B and C), especially for the
finer sands. This suggests that the lateral transport of A was restricted when C was the
resident fluid. Since capillarity promotes spreading of the infiltrating phase into the porous
media, one might expect the higher surface tension fluids to spread more laterally than the
relatively lower surface tension liquids (given zero contact angle and equal density).
However, our results show that the increased surface tension of the advancing fluid
actually resulted in reduced lateral spreading, while vertical wetting front velocity
increased. These results suggest that the effective contact angles were non-zero.
The broad, bulbous plumes observed for solutions B and C are consistent with the
results of Diment and Watson (1985) and Glass et al. (1989) for water introduced from
point sources into sand that was initially at residual water content. On the other hand, the
more sharply defined and narrow shapes of the solution A plumes, are similar to those
observed in numerous experiments and simulations where solutions were applied to water-
repellent or dry soils (Bauters et al., 2000; Nieber et al., 2000).
In natural soils, which are rarely dry at depth, the occurrence of fingering is still under
debate (e.g., Glass and Nicholl, 1996). Also, many coarsely textured natural soils have
laterally dominant micro-layering within single strata, and cross bedding with contrasting
texture, both due to turbulent and unstable depositional processes. The results presented
here suggest that fingering can be enhanced in pre-wetted media when the imbibing
solution has elevated surface tension. Moreover, water vapor diffusion from the surround-
ing low water content environment into the saline solution, may further promote plume
transport (Xu and Preuss, 2001; Weisbrod et al., 2000, 2003). As noted in those papers,
water vapor diffusion is likely to be a very important long-term mechanism leading to
continued migration of saline plumes. Water vapor diffusion is not of significant
importance at the time scales considered in the work presented here, but is discussed in
detail by Weisbrod et al. (2003).
When the sand was pre-wetted with high-salinity solution, A (Experiment 6, Fig. 8), it
was observed that the pure water, with lowest density and lowest surface tension, migrated
most quickly, while the methanol solution plume was more rapid than the pure saline
solution. However, the velocities were all within 15%. The lower surface tension imbibing
solutions appear to have mixed with the higher surface tension resident solution more
aggressively. Unlike the issue of contact angle, this process is not amenable to a simple
force-balance analysis to estimate the expected magnitude of the effect. It is not clear how
these processes would effect movement at actual sites, since uniform contamination with a
saline solution seems an unlikely description of initial conditions.
5.2. Surface tension and apparent contact angle
Lowering the surface tension of a fluid by heating or adding surfactants makes it a
better ‘‘wetting agent’’, improving its ability to enter porous media. Conversely, increasing

N. Weisbrod et al. / Journal of Contaminant Hydrology 72 (2004) 109–133126
the surface tension (by adding salts) results in more cohesive forces within the fluid
molecules at the surface, giving rise to an energetic obstacle to imbibition in water-wetted
media. This latter situation corresponds to the case when the advancing fluid was the
saline solution (A) and the low surface tension was the resident one (C), as well as the
initial entry of saline solution in a pristine subsurface environment.
While the classical equations for capillary pressure, Eqs. (1)–(3), explain the hydro-
static or equilibrium condition of a single fluid in dry media or a media pre-wetted with the
same fluid (where the contact angle is assumed to be close to zero), they may be
insufficient for systems pre-wetted with a different fluid. In a system where the resident
and advancing solutions have distinct surface energies, the forces at the interfaces between
solutions may be different from those found entirely within either the resident or
advancing fluids, and the effective contact angle is likely to be non-zero under certain
conditions.
Three force balance conceptualizations at the contact point between an advancing and
resident fluid are shown in Fig. 10: (a) the resident and the advancing fluids are the same
(A into A or C into C). The fluids and surface energies are equal and a zero contact angle
(c= 0) is expected at the contact point between fluids; (b) the advancing fluid has a lower
surface tension than the resident fluid (C into A). Here, the contact angle is also expected
to be zero; however, the fluids will not establish a mechanically stable condition until full
mixing has occurred. Prior to equilibrium, the net force is into the surrounding medium,
which may assist in spreading; and (c) the advancing solution has a higher surface tension
than the resident fluid (A into C). A non-zero gas–liquid contact angle is required for the
advancing solution to maintain mechanical equilibrium at the interface between the fluids.
Given the surface tension values of A and C (Table 2), balance of force in the direction of
wetting requires that the contact angle for A into C is equal to 25.3j (Eq. (2)). Using the
Washburn approach (Washburn, 1921) combined with the Green and Ampt Model (Green
and Ampt, 1911), McGinnis (2001) calculated the dynamic contact angle of solutions A
and C while imbibing into columns packed with 40/50 AccusandR pre-wetted with C. It
was found that while a contact angle of f 2j was calculated for C imbibing into C,
f 21j was calculated for A imbibing into C, which corresponds well with the predictions
from Eq. (2).
In all three cases depicted in Fig. 10, it was assumed that the thin film of resident fluid
is absorbed by the advancing fluid and immediately mixed. Since the total volume of water
in all the thin films is low, the solution behind the contact point is representative of the
initial advancing fluid composition until enough resident fluid has been incorporated to
achieve significant dilution. Furthermore, all interfacial forces between the liquid and solid
phases were assumed to be equal and opposite about the contact point. Some degree of
mixing is likely to occur about the contact point between the advancing and the resident
fluids, effectively changing the local contact angle in the zone of mixing. However, the
effective contact angle is expected to remain unchanged in the bulk of the advancing fluid
(Fig. 10c). The extent of the mixing zone is dynamic and is expected to increase over time
until complete mixing between fluids is achieved; at which point, the contact angle will be
zero. In addition to mechanical dispersion and diffusion, another mechanism that can
contribute to mixing between the advancing and resident fluids is the Marangoni effect
(Adamson and Gast, 1997), where micro-scale (sub-pore scale) turbulence may manifest
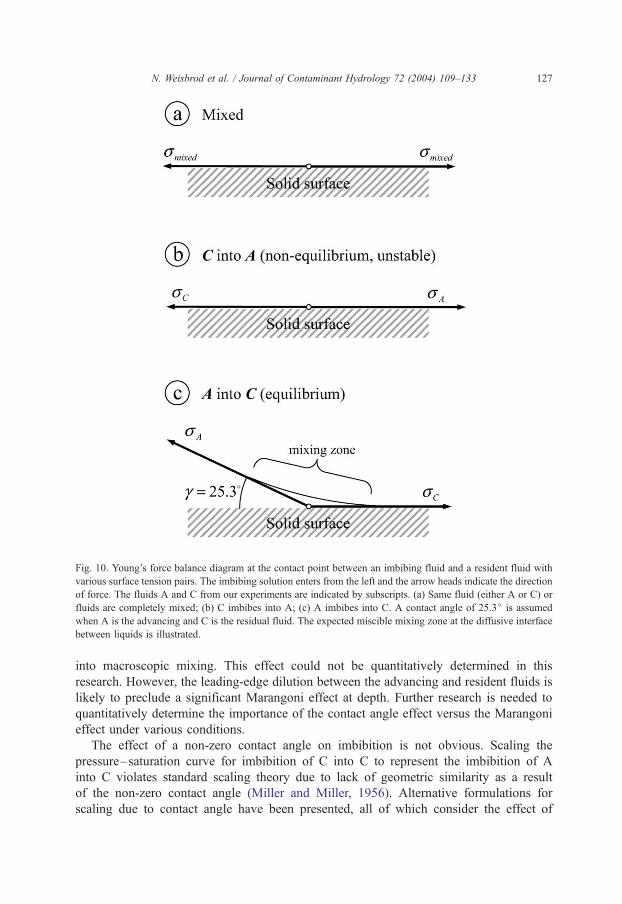
Fig. 10. Young’s force balance diagram at the contact point between an imbibing fluid and a resident fluid with
various surface tension pairs. The imbibing solution enters from the left and the arrow heads indicate the direction
of force. The fluids A and C from our experiments are indicated by subscripts. (a) Same fluid (either A or C) or
fluids are completely mixed; (b) C imbibes into A; (c) A imbibes into C. A contact angle of 25.3j is assumed
when A is the advancing and C is the residual fluid. The expected miscible mixing zone at the diffusive interface
between liquids is illustrated.
N. Weisbrod et al. / Journal of Contaminant Hydrology 72 (2004) 109–133 127
into macroscopic mixing. This effect could not be quantitatively determined in this
research. However, the leading-edge dilution between the advancing and resident fluids is
likely to preclude a significant Marangoni effect at depth. Further research is needed to
quantitatively determine the importance of the contact angle effect versus the Marangoni
effect under various conditions.
The effect of a non-zero contact angle on imbibition is not obvious. Scaling the
pressure–saturation curve for imbibition of C into C to represent the imbibition of A
into C violates standard scaling theory due to lack of geometric similarity as a result
of the non-zero contact angle (Miller and Miller, 1956). Alternative formulations for
scaling due to contact angle have been presented, all of which consider the effect of

N. Weisbrod et al. / Journal of Contaminant Hydrology 72 (2004) 109–133128
contact angle on pendular water (Melrose, 1965; Demond and Roberts, 1991;
Frankenfield and Selker, 1994). All of these methods scale the pressure–saturation
curve downward; i.e. yield a lower capillary pressure than would result from scaling
by contact angle alone.
Using Eqs. 22–27 of Rockhold et al. (2002), pc and Seff were tabulated for both
zero and non-zero contact angles over a range of pendular ring sizes from
0VuV 45j, at 0.1j increments. Effective saturation was converted to degree of
saturation by Eq. (6). Contact angle scaling factors, pc(a)/pc(0) were then determined
as a function of saturation; shown in Fig. 11 for contact angles of 10j, 25.3j and
45j. The scaling factors for capillary pressures at corresponding saturations were
computed by linear interpolation between discrete data pairs. Interestingly, since the
relative capillary pressures are controlled by the geometry of single pendular rings,
the scaling factor is independent of porosity.
The effect of contact angle scaling on the pressure–saturation curve for 40/50 sand
is depicted in Fig. 12. The primary drainage curve for C (pure water), taken from
Experiment 4, is shown as the thin solid line. Relative to C, the primary drainage
curve for A scales only by the different surface tension (Table 2) as dictated by Eq.
(3), shown as the thick solid line. These two cases correspond to capillary pressure–
saturation curves for porous media that have been rewetted by the same fluid,
assuming no gas entrapment. The scaled characteristic curve where A is the
Fig. 11. The scaling factor as a function of saturation for three different contact angles as calculated using Eqs.
(22)– (27) in Rockhold et al. (2002).
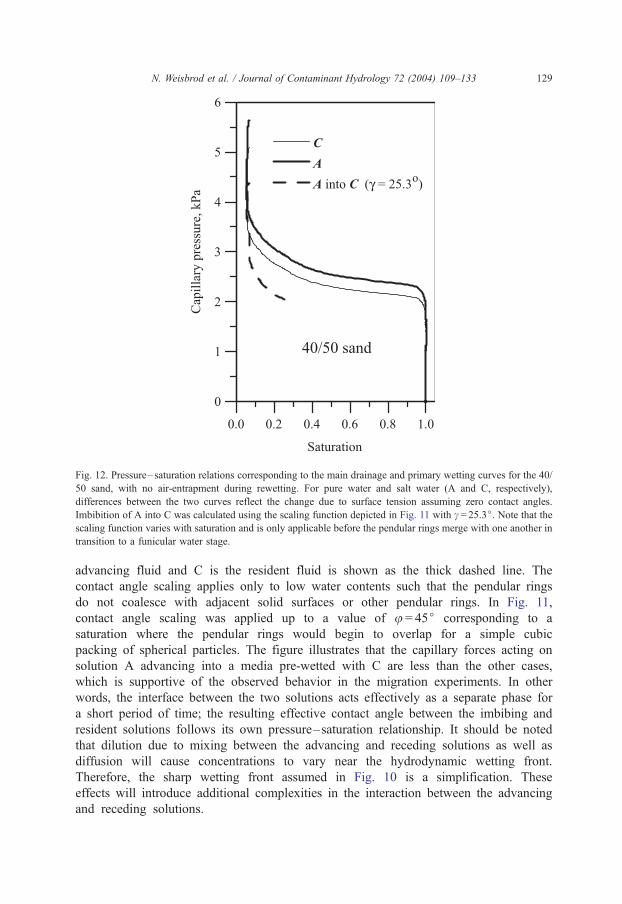
Fig. 12. Pressure–saturation relations corresponding to the main drainage and primary wetting curves for the 40/
50 sand, with no air-entrapment during rewetting. For pure water and salt water (A and C, respectively),
differences between the two curves reflect the change due to surface tension assuming zero contact angles.
Imbibition of A into C was calculated using the scaling function depicted in Fig. 11 with c = 25.3j. Note that thescaling function varies with saturation and is only applicable before the pendular rings merge with one another in
transition to a funicular water stage.
N. Weisbrod et al. / Journal of Contaminant Hydrology 72 (2004) 109–133 129
advancing fluid and C is the resident fluid is shown as the thick dashed line. The
contact angle scaling applies only to low water contents such that the pendular rings
do not coalesce with adjacent solid surfaces or other pendular rings. In Fig. 11,
contact angle scaling was applied up to a value of u = 45j corresponding to a
saturation where the pendular rings would begin to overlap for a simple cubic
packing of spherical particles. The figure illustrates that the capillary forces acting on
solution A advancing into a media pre-wetted with C are less than the other cases,
which is supportive of the observed behavior in the migration experiments. In other
words, the interface between the two solutions acts effectively as a separate phase for
a short period of time; the resulting effective contact angle between the imbibing and
resident solutions follows its own pressure–saturation relationship. It should be noted
that dilution due to mixing between the advancing and receding solutions as well as
diffusion will cause concentrations to vary near the hydrodynamic wetting front.
Therefore, the sharp wetting front assumed in Fig. 10 is a simplification. These
effects will introduce additional complexities in the interaction between the advancing
and receding solutions.
N. Weisbrod et al. / Journal of Contaminant Hydrology 72 (2004) 109–133130
5.3. Secondary plume and film flow
Secondary plumes were observed for most plumes of solution A at zf (Figs. 3–6 and 9,
see arrows). This event was associated with a narrowing of the finger width and an
increased rate of downward movement (Figs. 6b–d and 8a, see arrows). A similar sudden
acceleration was observed for finger movement from an air-dry soil into an underlying
moist soil by Liu et al. (1994). Finger velocity increased and finger width decreased upon
contact with the moist soil.
In our experiments, the wetting process above zf took place by way of a classical
capillary transport from empty to full pores (series of Haines jumps), while below this
depth the movement followed film flow along grain surfaces without the noticeable filling
of pores. In the media with water held in a pendular state, the DS within the imbibing
plume was always above 10%, while below zf the DS was between 2% and 4%; this
suggests that the migration mechanism changed dramatically once the plumes reached a
region where the film thickness was sufficient to conduct the flow. Slight changes in fluid
film thickness may have been responsible for the minor increases in DS below zf. Fluid
accumulated on top of the capillary fringe before the visible (DS>DSmin) secondary finger
developed (Figs. 3–5), indicating that fluid also migrated to the capillary fringe through
changes in saturation less than DSmin. Film flow has been suggested as a mechanism for
flow in unsaturated porous media (Lu et al., 1994a,b) and along fracture surfaces (Or and
Tuller, 2000; Tokunaga and Wan, 1997; Tokunaga et al., 2000). Our observations imply
that film flow played an important role in the downward migration of fluid in unsaturated
porous media above residual water content.
6. Summary and conclusions
Laboratory experiments demonstrated that high surface tension solutions penetrating
into homogenous pre-wetted unsaturated porous media significantly enhanced vertical
fingered flow. It appears that differences in surface tension between the infiltrating and
resident fluids, and consequently the contact angle, had the greatest impact on wetting
front velocity and geometry. Our assumption is that the gradient in surface energy at the
interface between the resident fluid (coating the particles) and the advancing fluid
prevented a zero contact angle from forming between the fluids over the relatively short
period of contact during migration. The magnitude of the resulting contact angle was
estimated from the relative surface tension with the understanding that the contact angle is
effective across a zone of mixing. Although pure water and saline solutions are typically
considered completely miscible fluids, our results suggest that the mixing process is not
spontaneous. The micro-scale processes at the interface are not completely understood. It
should be noted, however, that direct measurements of contact angles at the interface of the
migrating saline solution and the residual pore water is impossible at this time and
therefore the proposed mechanism cannot be proven directly. Therefore, the possibility
that other mechanisms could underlie the observed phenomena cannot be eliminated.
Once the infiltrating solutions reached the depth where resident saturation increased
above residual levels, zf, a visible secondary plume developed at the tip of the plume

N. Weisbrod et al. / Journal of Contaminant Hydrology 72 (2004) 109–133 131
and the local wetting front velocity increased. The secondary plumes appeared to
migrate via film flow rather than isolated pore filling. The accumulation of fluid on top
of the capillary fringe without visible contact with the fingertip suggested that film
flow occurred through very small changes in water content, below the detection limits
of our system (DS < 2%). Further research is needed to quantify the impact of surface
tension in different salt solutions and various concentrations as well as to better
understand the practical implications of the observed film flow. Also, possible methods
to measure the resulting contact angle between solutions need to be investigated.
Beyond scientific interest, the observed phenomena appear to be influential where
infiltrating solutions have high surface tension and should ultimately be incorporated in
predictive models.
Acknowledgements
We would like to thank Anderson Ward and Maria Dragila for the many constructive
discussions provided during the preparation of this manuscript. Thanks to Joan Sandeno
for her editorial assistance. The insightful reviews of Emil Frind and Karsten Preuss were
appreciated and helped to improve the paper. This work was funded by the Department of
Energy under contract number DE-FG07-98ER14925.
References
Adamson, A.W., Gast, A.P., 1997. Physical Chemistry of Surfaces. Wiley, New York.
Bauters, T.W.J., Steenhuis, T.S., Dicarlo, D.A., Nieber, J.L., Dekker, L.W., Ritsema, C.J., Parlange, J.Y., Ha-
verkamp, R., 2000. Physics of water repellent soils. J. Hydrol. 231-232, 233-243.
Blume, T., Weisbrod, N., Selker, J.S., 2002. Permeability changes in layered sediments: impact of particle release.
Ground Water 40 (5), 466–474.
Butkus, M.A., Grasso, D., 1998. Impact of electrolytes on interfacial energy. J. Colloid Interface Sci. 200,
172–181.
Demond, A.H., Roberts, P.V., 1991. Effect of interfacial forces on two-phase capillary–saturation relationship.
Water Resour. Res. 27, 423–437.
Dicarlo, D.A., Bauters, T.W.J., Darnault, J.G., Wong, E., Bierek, B.R., Steenhuis, T.S., Parlange, J.Y., 2000.
Surfactant-induced changes in gravity fingering of water through a light oil. J. Contam. Hydrol. 41, 317–334.
Diment, G.A., Watson, K.K., 1985. Stability analysis of water movement in unsaturated porous media. 3.
Experimental studies. Water Resour. Res. 21, 979–984.
Drelich, J., Miller, J.D., Good, R.J., 1996. The effect of drop (bubble) size on advancing and receding contact
angles for heterogeneous and rough solid surfaces as observed with sessile-drop and captive-bubble techni-
ques. J. Colloid Interface Sci. 179, 37–50.
Frankenfield, J., Selker, J.S., 1994. Fluid interfacial geometry at the pore scale and its effects on characteristic
curves. Proceedings of the 14th Annual Hydrology Days. Colorado State University, Fort Collins, Colorado.
Hydrology Days Publications, Atherton, CA, pp. 111–122.
GJPO, 1996. Vadose Zone Characterization Project at the Hanford Tank Farms. SX Tank Farm Report. GJ-HAN-
DOE/ID12548-268 (GJPO-HAN-4). US Department of Energy, Grand Junction Projects Office, Grand
Junction, CO.
Glass, R.J., Nicholl, M.J., 1996. Physics of gravity fingering of immiscible fluids within porous media: an
overview of current understanding and selected complicating factors. Geoderma 70, 133–163.

N. Weisbrod et al. / Journal of Contaminant Hydrology 72 (2004) 109–133132
Glass, R.J., Steenhuis, T.S., Parlange, J.Y., 1989. Mechanism for finger persistence in homogeneous unsaturated
porous media: theory and verification. Soil Sci. 148, 60–70.
Green, T.R., Ampt, G.A., 1911. Studies on soil physics: I. Flow of air and water through soils. J. Agric. Sci. 4,
1–24.
Hassanizadeh, S.M., Celia, M.A., Dahle, H.K., 2002. Dynamic effect in the capillary pressure–saturation rela-
tionship and its impact on unsaturated flow. Vadose Zone J. 1, 38–57.
Lide, D.R., 1991. Handbook of Chemistry and Physics, 71st ed. CRC Press, Boca Raton, Florida 33431.
Liu, Y., Steenhuis, T.S., Parlange, J.Y., 1994. Closed-form solution for finger width in sandy soils at different
water content. Water Resour. Res. 30, 949–952.
Lu, T.X., Biggar, J.W., Nielsen, D.R., 1994a. Water movement in glass bead porous media: 1. Experiments of
capillary rise and hysterisis. Water Resour. Res. 30, 3275–3281.
Lu, T.X., Biggar, J.W., Nielsen, D.R., 1994b. Water movement in glass bead porous media: 2. Experiments of
infiltration and finger flow. Water Resour. Res. 30, 3283–3290.
McGinnis, T., 2001. Determining Contact Angle of Solutions with Varying Surface Tension on Dry and Pre-
wetted Silica Sands, M.Sc., Oregon State University, Corvallis.
Melrose, J.C., 1965. Wettability as related to capillary action in porous media. Soc. Pet. Eng. J. 5,
259–271.
Miller, E.E., Miller, R.D., 1956. Physical theory for capillary flow phenomena. J. Appl. Phys. 27, 324–332.
Morrow, N.R., 1975. The effect of surface roughness on contact angle with special reference to petroleum
recovery. J. Can. Pet. Technol. 14, 42–53.
Nieber, J.L., Bauters, T.W.J., Steenhuis, T.S, Parlange, J.Y., 2000. Numerical simulation of experimental gravity-
driven unstable flow in water repellent sand. J. Hydrol. 231-232, 295-307.
Niemet, M.R., Selker, J.S., 2001. A new method for quantification of liquid saturation in 2 D translucent porous
media systems using light transmission. Adv. Water Resour. 24, 651–666.
Or, D., Tuller, M., 2000. Flow in unsaturated fractured porous media: hydraulic conductivity of rough surfaces.
Water Resour. Res. 36, 1165–1177.
Ouyang, Y., Zheng, C., 1999. Density-driven transport of dissolved chemicals through unsaturated soil. Soil Sci.
164, 376–390.
Philip, J.R., 1971. Limitations on scaling by contact angle. Soil Sci. Soc. Am., 507–509.
Rockhold, M.L., Yarwood, R.R., Niemet, M.R., Bottomley, P.J., Selker, J.S., 2002. Considerations for modeling
bacterial-induced changes in hydraulic properties of variably saturated porous media. Adv. Wat. Resour. 25,
477–495.
Schroth, M.H., Ahern, S.J., Selker, J.S., Istok, J.D., 1996. Characterization of Miller—similar silica sands for
laboratory hydrologic studies. Soil Sci. Soc. Am. J. 60, 1331–1339.
Selker, J.S., Schroth, M.H., 1998. Evaluation of hydrodynamic scaling in porous media using finger dimensions.
Water Resour. Res. 34, 1875–1880.
Smith, J.E., Gillham, R.W., 1994. The effect of concentration-dependent surface tension on the flow of water and
transport dissolved organic compounds: a pressure head-based formulation and numerical model. Water
Resour. Res. 30, 343–354.
Smith, J.E., Gillham, R.W., 1999. Effect of solute concentration-dependent surface tension on unsaturated flow:
laboratory sand column experiments. Water Resour. Res. 35, 973–982.
Spelt, J.K., Li, D., Neumann, A.W., 1992. The equation of state approach to interfacial tensions. In: Schrader,
M.E., Loeb, G.I. (Eds.), Modern Approaches to Wettability—Theory and Applications. Plenum Press, New
York, pp. 101–142.
Tokunaga, T.K., Wan, J., 1997. Water film flow along fracture surfaces of porous rock. Water Resour. Res. 33,
1287–1295.
Tokunaga, T.K., Wan, J., Sutton, S.R., 2000. Transient film flow on rough fracture surfaces. Water Resour. Res.
36, 1737–1746.
Washburn, E.W., 1921. The dynamics of capillary flow. Phys. Rev. 17, 273–275.
Weisbrod, N., McGinnis, T., Niemet, M., Selker, J.S., 2000. Infiltration mechanisms of highly saline solutions
and possible implications for the Hanford site. EOS Trans AGU 81 (48) (Fall Meet. Suppl.).
Weisbrod, N., Niemet, R.M., Selker, J.S., 2002. Imbibition of saline solutions into dry and prewetted porous
media. Adv. Water Resour. 25 (7), 841–855.

N. Weisbrod et al. / Journal of Contaminant Hydrology 72 (2004) 109–133 133
Weisbrod, N., Niemet, R.M.R., McGinnis, T., Selker, S.J., 2003. Water vapor transport in the vicinity of imbibing
saline solution: homogenous and layered systems. Water Resour. Res. 39 (6), 1145 (doi: 10.1029/
2002WR001539).
Xu, T., Preuss, K., 2001. Thermophysical Properties of Sodium Nitrate and Sodium Chloride Solutions and their
Effects on Fluid Flow in Unsaturated Media, LBNL report LBNL-48193, September.