migration of antimony from pet trays into food simulant … of antimony from pet trays into food...
TRANSCRIPT

Migration of antimony from PET trays into food simulant and food: determination of Arrhenius
parameters and comparison of predicted and measured migration data
M. Haldimann*, A. Alt, A. Blanc, K. Brunner, F. Sager and V. Dudler
Federal Office of Public Health, Chemical Risks Section, Schwarzenburgstrasse 165, CH-3003 Bern, Switzerland
(Received 14 August 2012; final version received 13 November 2012)
Migration experiments with small sheets cut out from ovenable PET trays were performed in two-sided contactwith 3% acetic acid as food simulant at various temperatures. The fraction of diffusible antimony (Sb) wasestimated to be 62% in the PET sample under study. Apparent diffusion coefficients of Sb in PET trays weredetermined experimentally. Measurement of migration between 20 and 150�C yielded a linear Arrhenius plotover a wide temperature range from which the activation energy (Ea) of 188� 36 kJmol�1 and thepre-exponential factor (D0) of 3.6� 1014 cm2 s�1 were determined for diffusing Sb species. Ea was similar topreviously reported values for PET bottles obtained with a different experimental approach. Ea and D0 wereapplied as model parameters in migration modelling software for predicting the Sb transfer in real food. Readymeals intended for preparation in a baking oven were heated in the PET trays under study and the actual Sbmigration into the food phase was measured by isotope dilution ICP-MS. It was shown that the predictivemodelling reproduces correctly experimental data.
Keywords: exposure-modelling; metals analysis – ICP/MS; isotope ratios; migration – diffusion; packaging –PET; toxic elements; food simulants; processed foods
Introduction
Packed food, as consumed, may contain differentsubstances which are undesirable. Migration of sub-stances into foodstuffs is a subject of increasing interestand an important aspect of food packaging. Advancesin food packaging technology have made available awide variety of convenience foods, which can be takendirectly from the freezer to the microwave or conven-tional oven. The polymer of choice used for theseproducts is polyethylene terephthalate (PET) due to itsexcellent thermal stability, both in the deep freezer andin the oven. It will not thermally deform below 220�C,and accordingly PET trays are used for cooking orreheating of food. In addition, PET serves as bottlematerial for a variety of products, especially carbon-ated beverages, bottled water and fruit juices.
Polymers often contain contaminants as a result oftheir synthesis or manufacturing procedure. PET ismanufactured by polycondensation of ethylene glycoland terephthalic acid in the presence of antimonytrioxide (Sb2O3) as catalyst (Duh 2002). Residualmolecular antimony (Sb) catalyst materials can migrateinto food or water and be a potential contaminantfrom PET packaging materials. Sb was established ascatalyst of choice because it has some favourableproperties, e.g. it gives bright, shiny polymers. There
are two other main catalysts for PET: germanium
oxide and titanium compounds (Thiele 2001). Due tothe increasing importance of PET in food packaging,
an understanding of the migration properties of itsresidual compounds is important.
The possible migration of Sb into food is of great
concern due to its toxicity. A toxicological similaritybetween arsenic and Sb exists (Gebel 1997).
Oestrogenic activity of Sb(III) may impair the repro-
ductive function in adults (Choe et al. 2003). Inaddition, Sb trioxide is classified as possibly carcino-
genic to humans (Group 2B) by the InternationalAgency for Research on Cancer (IARC) (1989). In a
recent study, elemental Sb showed genotoxicity inchromosomal aberration tests in cultured mammalian
cells (Asakura et al. 2009). However, due to lack of
in vivo studies genotoxicity in humans cannot bedetermined at this time.
In recent years, some examples of contamination of
mineral water, drinks and foodstuffs have beenreported with PET. Several studies have examined
the leaching of Sb from PET bottles into mineral wateror juices (BAG 2005; Rusz Hansen & Pergantis 2006;
Shotyk et al. 2006; Westerhoff et al. 2008). However,even after a long storage time the levels in water were
well below the limits commonly specified for waters,
*Corresponding author. Email: [email protected]
Food Additives & Contaminants: Part A, 2013Vol. 30, No. 3, 587–
© 2013 Taylor & Francis
598, http://dx.doi.org/10.1080/19440049.2012.751631
i.e. 5 mg l�1 for natural mineral water set by EuropeanCommission Directive 2003/40 (European Commission2003) and the WHO (2003) drinking water guidelinevalue of 20 mg l�1 (Keresztes et al. 2009). In contrast, athigh temperatures much larger quantities of Sb migratefrom ovenable PET trays for ready meals into food(Haldimann et al. 2007). With regard to the TDI of6 mg kg�1 body weight day�1 for Sb established by theWHO, even the most contaminated PET trays did notpose a risk to health (WHO 2003). On the other hand,the European Commission (2005) set a specific migra-tion limit (SML) of 40 mg kg�1 for Sb. In some readymeals prepared in PET trays that were exposed to hightemperatures, the Sb concentration found in foodexceeded the SML (Haldimann et al. 2007). In fact, theEuropean Food Safety Authority (EFSA) (2004)acknowledged in its Scientific Opinion that the SMLmight be exceeded at high temperature. Therefore,testing for Sb migration has some utility in checkingfor compliance with regulations (SML).
Even though a number of studies on migration fromPET have been conducted, there are few investigationson the determination of specific mass transfer charac-teristics (Begley et al. 2005; Welle & Franz 2011). Ingeneral, PET shows low levels of global migration(Castle et al. 2004). PET belongs to the class ofengineering polymers which are excellent barrier mate-rials with small diffusion coefficients (Bharadwaj &Boyd 1999). In semi-crystalline PET, diffusion isstrongly influenced by its crystallinity fraction andmorphology.Due to the lowdiffusivity ofmostmigrantsin PET, the determination of diffusion coefficientsrequires long-term experiments. To examine the extentof Sbmigration fromPET tray packagingmaterials, 3%acetic acid was used as food simulant. Preliminaryresults were already presented at the 4th InternationalSymposium on Food Packaging (Alt et al. 2008).
The main objective of the present work is to reportexperimental Sb migration data, i.e. concentration ofSb in food simulant and food as a result of diffusionfrom the PET polymer interface. Diffusion coefficientswere calculated at various temperatures and theArrhenius parameters activation energy and pre-exponential factor were determined. These parametersserved as input for migration modelling, which wasperformed using a software package (AKTS 2012).
For this purpose, experiments were carried out inan autoclave batch reactor over a wide temperaturerange with diluted acetic acid as food simulant. Theincrease of the Sb concentrations in the simulant andits content in the PET were measured by ICP-MS. Inaddition, the PET content was verified by X-rayfluorescence spectroscopy (XRF).
Food simulating liquids can affect the migrationfrom PET polymers. Non-polar food stimulants forhigh-temperature applications are not suitable for Sbmigration tests, e.g. Sb was not detected in olive oil
(Ashby 1988; Fordham et al. 1995). On the other hand,polar food simulants may interact with PET (Begleyet al. 2005). In response to this situation, actual food thatreflects real conditions without the drawbacks ofsimulants was used for the validation of the migrationmodelling.
Materials and methods
Chemicals and standards
An isotopic Sb(III,V)-oxide (Sb2O4) standard with98.6% enriched 123Sb (1.4% 121Sb) was obtained fromChemotrade (Dusseldorf, Germany). A total of126.0mg Sb2O4 was dissolved to a final total Sbconcentration of 1.0mgml�1 in 15% HCl. From thissolution the concentration for the ICP-MS isotopespike was made up. Sb(III) oxide puriss. p.a.Fluka(Sigma-Aldrich, Buchs, Switzerland) was used for theXRF standards. Nitric acid 65% Suprapur�(Merck,Darmstadt, Germany) was used for the mineralisationof food and PET. Additionally, hydrofluoric acid 40%Suprapur� (Merck) was added to the mineralisation ofPET. Demineralised water with a specific conductivityof 18M� cm�1 was produced in a cartridge system(Purelab ultra, ELGA LabWater, Celle, Germany).Polyethylene (ERM�-EC680k, Institute for ReferenceMaterials and Measurements, Geel, Belgium) andwhite cabbage (BCR 679) were used as referencematerials for quality control measuring.
PET tray sample
New empty PET (Etimex E1231, Etimex PrimaryPackaging, Dietenheim, Germany) trays which areproduced for ovenable ready-to-eat lasagne wereobtained from a food producer (Bischofszell Food,Bischofszell, Switzerland). The thermoformed tray wasa multilayer sheet made of crystallised PET (CPET)covered by a layer of amorphous PET (APET). Theoverall thickness of the tray, 0.031� 0.004 cm (n¼ 6),was determined by analysis of electron microscopyimages (Hitachi TM-1000, Hitachi, Krefeld,Germany). The inner side of the tray was coated witha thin APET as a sealing layer against the covering foil.According to the tray manufacturer layer thickness isonly about 15 mm. The density of 1.35 g cm�3 wasdetermined with a density kit mounted on an analyticalbalance (Mettler-Toledo, Greifensee, Switzerland). Theform of the PET tray looked like a truncated pyramid(upside down) with a height of 3.8 cm, an internal basearea of 156.8 cm2 (14� 11.2 cm) and a top area of91.3 cm2 (11� 8.3 cm). Thus, a volume of 466 cm3 wasobtained, and it was verified by weighing a fill ofdemineralised water. The corresponding maximal con-tact surface was 260 cm2. The glass transition temper-ature was measured by differential scanning
M. Haldimann et al.588

calorimetry (DSC 1, Mettler-Toledo) and fell in therange between 74.5 to 76.3�C. The apparent degree ofcrystallinity of this particular PET tray was measuredfrom DSC spectra and amounted to 27%. There wasno DSC response that could be attributed to theamorphous layer.
Mineralisation of PET for ICP-MS measurement
Microwave-assisted pressure digestion of PET wascarried out in an autoclave (MLS Ultraclave III, MLS,Leutkirch, Germany). Small PET slabs of 20–40mgwere cut out from trays and directly weighed intoperfluoralkoxy (PFA) polymer tubes (10ml). A total of2.0ml HNO3 65% (Merck, Suprapur�) and 0.2ml HF40% (Merck, Suprapur�) were added. The reactor wasinitially pressurised with nitrogen from the laboratorygas supply at 55 bar by a compressor (Junior II, Bauer,Munich, Germany). The digestion was initialised bygradually increasing the temperature to 220�C. Thetemperature level was then maintained for 120min at220�C. The process was terminated by cooling. Afterreleasing pressure at room temperature, the reactorchamber was vented for some 30min. Subsequently,the clear and colourless mineralised solutions weretransferred into 50ml polypropylene (PP) tubes(Sarstedt, Sevelen, Switzerland), and diluted tovolume with pure water. For measurements, thesample solution was prepared with 50 ml of the dilutedmineralised solution in 4950 ml HNO3 2.5%.Subsequently, the solutions were measured by sector-field ICP-MS (Element2, Thermo Fisher Scientific,Bremen, Germany) with external calibration andrhodium as internal standard. Because a certifiedreference material with PET properties was not avail-able, the ICP-MS method was validated measuring alow-density polyethylene (LDPE, ERM-EC680k) witha certified Sb content of 10.1� 1.6mg kg�1. PE differsfrom PET with respect to the mineralisation reactionand final composition of the sample solution. Themeasured Sb concentration of 10.4� 0.14mg kg�1
(n¼ 4) fell into the 95% confidence interval of thecertified value, thereby indicating accuracy and preci-sion of the Sb measurements in a polymer matrix.
Determination of Sb in PET by XRF
A PET foil containing only 8mgkg�1 Sb was used topreparematrix-matched XRF standards. The standardswere ground with a mixer mill (MM 301, Retsch, Haan,Germany). The insulated steel jars in which cryogenicgrinding was carried out were cooled in liquid nitrogen.The embrittled PET was subsequently milled for 7min.The resulting fine polymer powder was sieved to providea grain size fraction below 0.5mm. The appropriatequantities of Sb (as Sb2O3) were weighed directly to the
low Sb PET in a microbalance (Mettler, UMT2) anddistributed homogenously in the polymer matrix bymixing in the same mill at ambient temperature. A totalof 5 g quantities of the mixtures were then pelletised inan automatic hydraulic press (Atlas auto press, Specac,Orpington, Kent, UK) at applied load of 25 t. Pellets of25mm diameter and 9.5mm thickness were obtained,which exhibited mechanical stability with flat, hard andshiny surfaces. Subsequently, the pellets were used tocalibrate theXRFmeasurement of Sb in PET at levels of8, 100, 200, 300 and 400mgkg�1. The Sb content of thePET under study was measured with energy dispersiveXRF (PANalytical, Almelo, The Netherlands). Theinstrument was equipped with an Sc-W X-ray tube,operated at 600W. The tube irradiated secondarytargets, which acted as an X-ray source. Accordingly,radiation coming from the target was used to excite thesamples. To measure Sb, an aluminium oxide (Al2O3)target that scattered tube radiation was inserted. In thisway, Sb-K�1 and Sb-K�2 peak counts at 26.4 and26.1 keV, respectively, were recorded during 200 s.A linear calibration curve was obtained measuringboth sides of the pellets and averaging the counts foreach level.
Determination of Sb migration into 3% acetic acid
Identical PET sheets, 0.31mm thick, 60mm in lengthand 30mm in height, were used for the migration tests.The slices were cut out from original PET trays usingscissors and a cardboard cutter. The slices were cleanedin a supersonic bath with demineralised water for1min. After drying, the slices were weighed; theaverage mass was 761� 42.7mg. A single sample slabwas placed vertically in the a quartz cell with a volumeof 130ml. A total of 89ml 3% acetic acid was pouredinto the quartz cell, thereby the liquid level rose abovethe PET slab. The cells were covered with Teflon capsto prevent evaporation and then placed in a holder,which was mounted in the same autoclave used for thedigestion of PET (MLS Ultraclave III). In the auto-clave chamber the cells are immersed in water, whichtakes up microwave energy and ensures homogenoustemperature distribution in all simulant solutions. Thetemperature of the solutions was controlled accordingto pre-assigned temperatures. The maximum micro-wave power of 1 kW was used to keep the temperatureramp short. Migration tests were made at 20, 30, 45,60, 75, 90, 105, 120, 135 and 150�C. Each isothermaltest lasted for 1, 5 and 24 h, or in some cases 46 h. Infact, all times are approximate because the cool-downramps were neglected. Initially, the chamber waspressurised with nitrogen to 50 bar or up to 90 barfor the long tests, respectively (�24 h). The highpressure is necessary to prevent boiling of the aceticacid. The pressure effect on the diffusion of molecules
589Food Additives & Contaminants: Part A

such as Sb glycolate can be neglected, assuming it doesnot change drastically between 1 and 50 bar (Fischer1997). Moreover, the effect of pressure on the densityof PET is very small (Eslami & Muller-Plathe 2009). Atlow temperatures of 20 and 30�C, the same diffusivitycells were thermostat controlled in a warming cup-board (Thermocenter, Renggli Salvis Lab, Rotkreuz,Switzerland) at atmospheric pressure. After coolingand releasing the pressure, the PET slabs were removedimmediately. Aliquot parts of the migration solutionwere diluted to 50ml with 2.5% nitric acid andmeasured by ICP-MS. The external calibration stan-dards were matrix-matched with acetic acid andrhodium was used as internal standard. The detectionlimit of this method for Sb in migration solutions was0.04 mg l�1.
Sb migration into food samples
Ready meals intended for oven heating were obtainedfrom local supermarkets. The food samples werehomogenised in a laboratory mixer (GrindomixGM200, Retsch) to ensure random and even distribu-tion of any irregularities in the food matrix. The PETtrays under study were equipped with two Pt-100temperature sensors soldered to a metallic sheet(5� 2� 1.3mm) and encapsulated by electrically insu-lating plastic (Innovative Sensor technology). Thesensors were placed on the bottom of the tray atopposite corners and immersed in the mixed food. Thefilling height was measured and contact surface andvolume were calculated for each food mix. Some of thePET trays were filled to the brim. According to thequantity of food the surface/volume ratios variedbetween 0.6 and 0.7. The food samples in the PETtrays were heated for 30min in a thermostatic heatingcupboard (Thermocenter, Renggli Salvis Lab,Rotkreuz, Switzerland) at 200�C, while the tempera-ture in the food was recorded every 3 s with atemperature-measuring device (Ecolog TP4-L, Elpro-Buchs, Buchs, Switzerland). In preliminary measure-ments, both thermometers showed nearly identicalreadings, indicating a homogeneous temperature dis-tribution in the tray. After heating, the food sampleswere allowed to cool for some time before beingremoved from the PET tray. The samples were weighedbefore and after heating. Again, the samples werehomogenised in the laboratory mixer to obtain auniform distribution of the migrated Sb in the food.
Mineralisation of food samples
A total of 0.2 g of the freeze-dried food samples wasdigested with 2ml nitric acid, 10mol l�1, in the samemicrowave autoclave used for PET mineralisation.To each sample, a volume of 150 ml of a 37.5 ngml�1
123Sb-spike (tracer) solution was added for the subse-quent isotope dilution analysis by ICP-MS. Thereactor was initially pressurised with nitrogen at55 bar. The digestion temperature was maintained at250�C during 45min, whereby the pressure increasedto 150 bar. At the completion of the reaction, thereactor was cooled to 50�C and the pressure wasgradually released. The reactor chamber was openedand the processed samples were vented to remove NOx
and then diluted to 10ml with demineralised water.
Isotope dilution analysis of food
A Thermo Fisher Scientific (Bremen, Germany) sector-field ICP-MS Element 2 instrument was equipped witha mini-cyclonic glass spray Chamber (Twinnabar,Glass-Expansion, West Melbourne, Australia) and aconcentric glass nebuliser (Sea Spray, Glass-Expansion, West Melbourne, Australia), which wasoperated in an argon sample gas flow range of0.96–1.0 lmin�1. The auxiliary gas flow was0.77–0.88 lmin�1. Optimisation of the instrument wasperformed with 1 ngml�1 indium to obtain maximumsignals and best stability. Low resolution (Dm/m at10% height) at approximately 300 was used. TheICP-MS was operated under the ‘‘E-scan’’ mode, i.e.the magnetic field was kept constant while the accel-eration lenses voltage was changed. Although thisapproach is the most efficient for isotope ratio mea-surements, it can be a source of mass discriminationeffects. For the present study, however, it did not havemuch of an impact on the measurements since only thetwo Sb isotopes (123Sb, 121Sb) were involved for thesample measurement. The experimentally measured121Sb/123Sb ratio of a standard Sb solution was1.31� 0.017, which agreed with the theoretical ratioof 1.34 for natural Sb. The detector dead time was25 ns. The Sb isotopes were monitored 10ms for eachmeasurement channel. Twenty samples per peak wererecorded. The resulting measuring time for this partic-ular segment was 0.25 s. The scans were repeated12 times, which amounted to a total measuring time of73 s. The take-up and wash times were 2 and 3min,respectively. 121Sb/123Sb ratios of the mineralisedsample solutions spiked with 123Sb tracer were directlymeasured and the Sb concentration was calculatedwith the Element 2 isotope dilution software.
A white cabbage sample (BCR-679) with a certifiedSb concentration of 20.6� 2.6 mg kg�1 was used to testthe accuracy of the isotope dilution analysis for theICP-MS measurement of Sb in food. The measured Sbconcentration of 21.2� 2.2 mg kg�1 fell in to the 95%confidence interval of the certified value. Cabbage wasnot an ideal food matrix because the samples measuredin this study consisted mainly of pasta, meat or fish.However, the behaviour of the two Sb isotopes is very
590 M. Haldimann et al.
similar across the sample introduction system andICP-MS instrument, and thus various matrix effectsattributed to food are compensated.
Determination of apparent diffusion coefficients
Assessment of migration contaminants from foodpackaging was based on Fick’s Second Law, whichrelates the time rate of concentration change to thesecond derivative of the concentration gradientthrough the diffusion coefficient (Crank 1956). Themigration of a readily soluble migrant from the twosides of the thin plane polymer sheet contacting a largevolume of food or simulant solvent can be described ina simplified way:
Mt
M0¼
4
l
ffiffiffiffiffiffiDt
�
rð1Þ
where Mt is the amount of migrant in the food or thefood simulant at the time t; M0 is the initial amount ofSb in the PET, which is available for diffusion; l is theslab thickness; and D is the diffusion coefficient in thePET (Vergnaud 1991). The relative error made onMt/M0 by using Equation (1) instead of a more exactexpression is only 0.1% when the ratio50.5 (Vergnaud1991). Under experimental conditions (24 h), the rela-tive error made atMt/M0¼ 0.9 is about 10%. Equation(1) is based on several assumptions such as completemixing of the simulant, a constant diffusionmechanism,and no interaction between solvent and polymer. Formost experiments these conditions are not fully satis-fied. The interfacemass transfer resistance at the surfaceof the PET material in contact with food or simulantwas considered negligible on the side of the food. Hence,the migration process is controlled by diffusion of Sb inthe PETmaterial.Most of the described packaging foodsystems led to a solution as expressed by Equation (1)(Pennarun et al. 2004b; Begley et al. 2005; Welle &Franz 2011). It was shown that Sb migration from PETtrays did not depend on the type of food, e.g. liquid orsemi-solid (Haldimann et al. 2007). This suggests thatmass transfer from container surface to food is not arate-limiting kinetic step and can be neglected.
Determination of activation energy
Diffusion of Sb in the PET polymer is a thermallyactivated process, with diffusion coefficients D thatdepend on temperature, as described by the Arrheniusequation:
D ¼ D0e�Ea=RT ð2Þ
where D is the diffusion coefficient (cm2 s�1); the pre-exponential factor D0 is the theoretical maximumdiffusion coefficient at infinitely high temperature; Ea
is the activation energy (Jmol�1); R is the universal gasconstant (8.314 Jmol�1K�1); and T is temperature(K). Ea and D0 can be calculated as regressionparameters for the linearised Equation (2). In addition,a non-linear regression technique with Equation (2)was used (Brauner & Shacham 1997). Non-linearregression applied to equation (2) leads to the follow-ing minimisation problem:
minS ¼Xni¼1
D�D0e�Ea=RTi
� �2ð3Þ
where S is the sum of the error squares; and n is thetotal number of data points in the relation of diffusioncoefficients (D) versus absolute temperature (T).Nevertheless, the parameters calculated usingeither linear and non-linear regression are onlyapproximate because of experimental error in theobserved D values.
Statistical analysis
The statistic software SAS 9.2 was used to estimate theArrhenius parameters Do and Ea with confidenceintervals from linear regression analysis (Equation(2)). In contrast, non-linear estimation normallyincludes a broad variety of statistical procedures. Weperformed non-linear least squares, which is analogousto ordinary least squares. It minimises squared devi-ations of the dependent variable data values fromvalues estimated by the function at the same indepen-dent variable data points (Equation (3)). The system issolved numerically in an iterative process by the leastsquares Gauss–Newton method using Systat 13 soft-ware. The starting values had to be set close to thepreviously estimated values of D0 and Ea (fromEquation (2)); otherwise, the algorithm failed toconverge. A paired t-test was carried out to comparethe difference between measured and simulated Sbquantities.
Model calculations
The SML software release 4.5.3 (AKTS 2012) was usedto predict the amount of Sb that migrates from thePET tray to the food. It employs finite element analysis(FEA) to solve migration problems where an analyticalsolution of the Fickian equation is not possible. Thisnumerical analysis is based on a system of nodes whichconstruct a grid or mesh. The grid-point distribution ischosen with variable step lengths (Roduit et al. 2005).Among other models the software comprises theArrhenius equation for temperature dependence, forwhich the experimentally determined parameters Do
and Ea were required as inputs. The packagingspecification was defined as the surface-to-volume
591Food Additives & Contaminants: Part A

ratio based on the actual contact surface and thevolume of the food. The PET was treated as a one-layer polymer of average properties, i.e. density,thickness and initial Sb concentration were set asmeasured. The Sb partition coefficient was arbitrarilyset to 1. The program can calculate the migrationbased on customised temperature profiles, whichallows use of experimentally measured temperaturesin the food matrix. The software uses a non-linearregression algorithm by Levenberg–Marquardt.
Results and discussion
Measurements of Sb in polymer and food matrices
The total concentration of Sb in the PET under studywas concurrently determined by ICP-MS and energy-dispersive XRF. Both methods required differentsample preparation techniques, i.e. nitric acid miner-alisation and direct measurement of solid PET. ICP-MS and XRF measurements yielded comparable Sbconcentrations of 290� 5.7 and 318� 18.1mg kg�1,respectively. Taking into consideration that XRFsuffers from matrix effects, the agreement betweenthe two methods was satisfactory; the difference wasstatistically not significant (p¼ 0.1). The sample PETtray had a normal level of residual Sb when comparedwith the previously reported results (Haldimann et al.2007). In addition, the CRMs were used for qualitycontrol purposes.
Diffusion coefficients of Sb in PET
After being exposed to acidic solution at high temper-atures, the PET sheets did not show any visual damageor decomposition at the outer surface. Acetic aciddissolved the migrants readily, even though at temper-atures above 135�C fine white powder residues wereobserved, which most likely originate from partialhydrolytic degradation or concomitant migration com-pounds of the PET, e.g. terephthalic acid. The residueswere isolated and its mass fractions were less than 5%.The powders were analysed by XRF analysis and noSb, titanium or other inorganic constituents weredetected. Moreover, the infrared spectrum (IR)obtained nearly coincided with a reference spectrumof terephthalic acid. According to the library assign-ment, the residue also contained isophthalic acid.
From the series of experimental data for migrationlevel in relation to time, the parameters of the linearregression model were calculated for each temperature.An example plot of the diffusion experimental dataand fitted curves by using Equation (1) for three casesis shown in Figure 1. It depicts the experimentalmigration progress of Sb to acetic acid as function ofthe square root of time. The plot of Mt/M0 versus t
0.5
showed a linear relationship, which confirms the
validity of Fick’s law to describe the diffusion processof Sb in PET. From the slope of the curves, theapparent diffusion coefficients (DFick) were deter-mined. Poor correlation was observed at temperatureslower than 90�C. This may be due to inconsistentdiffusion of Sb at low temperatures during shortmigration times associated with higher experimentalerrors observed at low concentrations. For this reason,diffusion coefficients (D) were derived from repeatedmeasurements of 24-h migration tests. The calculatedapparent diffusion coefficient values are summarised inTable 1.
Sb mass balance
The equilibrium Sb concentration in the Etimex E1231PET polymer and that in the contacting phase weredetermined at 150�C. The highest amount of a Sb thatcan migrate to food simulant was estimated as illus-trated in Figure 1. It is assumed that after a contacttime of 24 h, most of the diffusible Sb the PETmigrated to the 3% acetic acid phase and did notincrease any further after a contact time of 48 h.Accordingly, the fraction of diffusible Sb was about62% (Table 1).
Polycondensation catalysis by Sb compounds(Sb2O3) is homogeneous, i.e. the catalyst is soluble inthe reaction medium. The reaction of an applied Sbcompound with ethylene glycol leads to the formationof a glycolate complex, which is the pre-catalyst (Biroset al. 2002; Duh 2002; El-Toufaili et al. 2006). Thus,the predominant diffusible species are monodentate
Figure 1. Selected kinetics of migrated Sb fractions (mt) froma PET tray into 3% acetic acid versus the square root of timeat 150�C (�), 135�C (N) and 105�C (^). The PET traycontains 290mgkg�1 Sb, of which 62% is available fordiffusion, i.e. m0/mt¼ 1. The value 41 is attributed toexperimental errors.
592 M. Haldimann et al.

Table
1.ComparisonoftheArrheniusparametersobtained
from
aseries
ofisothermalmigrationmeasurementsofSbfrom
PETsheetsinto
3%
aceticacidwith95%
confidence
intervals(C
I).
Tem
perature
(�C)
Specific
migration
(mgdm
–2)
Migrated
(%)
nDiffusioncoefficient,D
(cm
2s�
1)
Pre-exponentialfactor
Activationenergya
DFick
(cm
2s�
1)
ln(D
0)
95%
CI
D0
(cm
2s�
1)
Ea
(kJmol�
1)
95%
CI
nReg
R2
20
(8.7�1.1)�10�5
0.013
3(2.9�0.6)�10�17
22.2
(13.8–30.7)
4.5�109
�152
�(177–128)
10
0.96
30
(1.0�0.3)�10�4
0.015
6(6.2�2.8)�10�17
26.5
(18.5–34.4)
3.2�1011
�165
�(189–142)
90.97
45
(9.7�0.8)�10�5
0.016
5(1.6�0.4)�10�16
31.8
(26.2–37.5)
6.6�1013
�182
�(200–165)
80.99
n.d.
60
(2.7�0.2)�10�4
0.05
2(1.2�0.3)�10�15
35.0
(29.6–40.4)
1.6�1015
�193
�(210–176)
70.99
n.d.
75
(7.9�1.7)�10�4
0.12
2(1.1�0.4)�10�14
36.5
(28.7–44.2)
6.9�1015
�198
�(222–173)
60.99
n.d.
90
(4.4�0.3)�10�3
0.68
2(3.2�0.7)�10�13
33.5
(22.3–44.8)
3.6�1014
�188
�(224–151)
50.99
5.3�10�13
105
0.018�0.001
3.3
4(6.6�1.4)�10�12
32.1
(5.9–58.3)
8.7�1013
�183
�(270–95)
40.98
8.6�10�12
120
0.040�0.006
6.8
4(3.0�0.8)�10�11
14.3
(�1.0–29.5)
1.6�106
�131
�(174–89)
30.93
2.7�10�11
135
0.12�0.02
18.6
4(2.4�0.8)�10�10
n.d.
n.d.
2.0�10�10
150
0.41�0.05
62.0
4(3.3�0.4)�10�9
3.7�10�9
Notes:Diffusioncoefficients,D,wereobtained
from
24-h
experim
ents;D
Fickwasderived
from
theslopeoftheplotM
t/M
0versust0.5in
thehigh-tem
perature
domain.
n,Number
ofisothermalexperim
ents;nReg,number
ofpoints
applied
inlinearregressionanalysis;n.d.,notdetermined.
aForcomparison,non-linearregressionanalysisyielded
anEavalueof187�0.08kJmol�
1.
593Food Additives & Contaminants: Part A
glycolate (�Sb�OCH2CH2OH) and chelate ligand(�OCH2CH2O�) Sb complexes. In contrast, the por-tion of diffusible inorganic Sb is probably very small.
In general, glycolate ligand derivatives of Sb aresensitive to hydrolysis (Maerov 1979). Thus, reactivityof the migrant in the food phase may prevent backdiffusion of Sb into the PET. Sb compounds of thisglycolate type are believed to be the active catalystcomponent in the condensation polymerisation to PET(Aharoni 1998). In contrast, a large Sb fraction ofapproximately 38% is not available for diffusion, i.e.Sb is either bound to the polymer chains or trappedwithin the PET crystalline zones and thus immobilisedin the polymer matrix. In absence of any losses, thegeneral mass balance gives the total amount of Sbpresent in the PET sheet (MTotal) that is equal to thesum of the amount migrating into the acetic acid phase(MHAc) plus the amount remaining in the PET (MR).This is valid at any instance:
MTotal ¼MR þMHAc ð4Þ
Equation (4) was verified at two different temper-atures. The relative recoveries of the remaining Sb inthe PET slabs after 24-h migration at 120 and 135�Cwere 95% and 86%, respectively. In other words, therecovered Sb from the sheets was approximatelycomplementary to the migrated fractions (Table 1).
Experimental determination of Ea and D0 underisothermal conditions
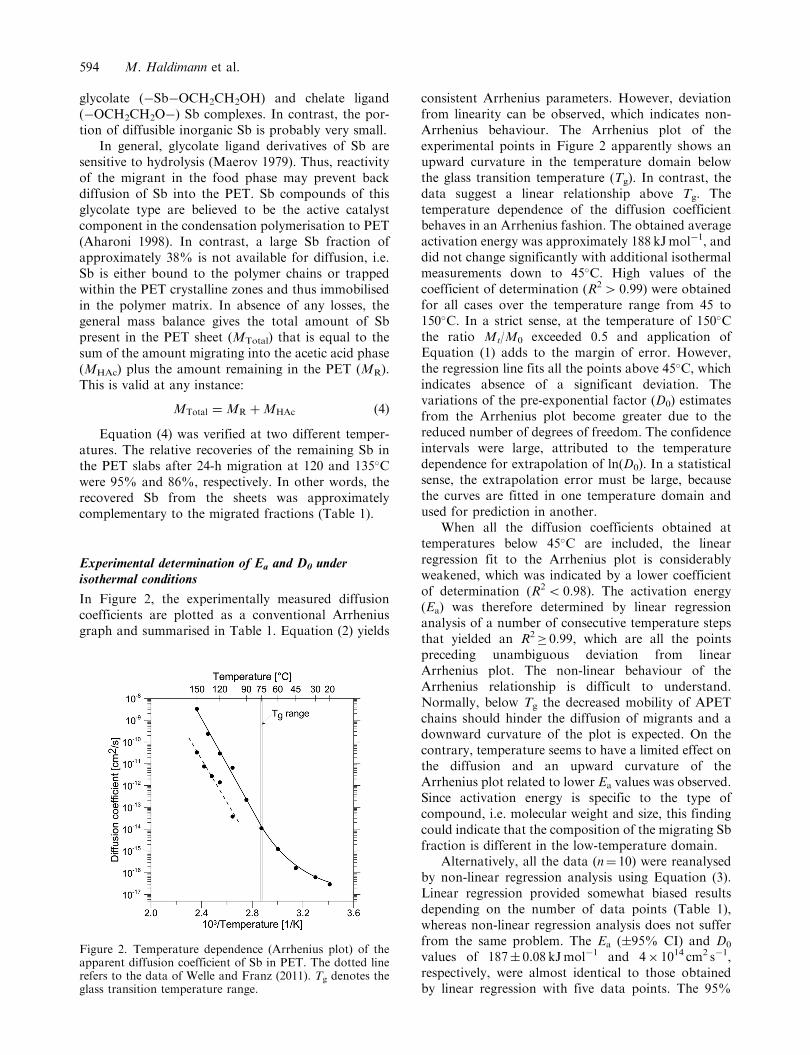
In Figure 2, the experimentally measured diffusioncoefficients are plotted as a conventional Arrheniusgraph and summarised in Table 1. Equation (2) yields
consistent Arrhenius parameters. However, deviationfrom linearity can be observed, which indicates non-Arrhenius behaviour. The Arrhenius plot of theexperimental points in Figure 2 apparently shows anupward curvature in the temperature domain belowthe glass transition temperature (Tg). In contrast, thedata suggest a linear relationship above Tg. Thetemperature dependence of the diffusion coefficientbehaves in an Arrhenius fashion. The obtained averageactivation energy was approximately 188 kJmol�1, anddid not change significantly with additional isothermalmeasurements down to 45�C. High values of thecoefficient of determination (R24 0.99) were obtainedfor all cases over the temperature range from 45 to150�C. In a strict sense, at the temperature of 150�Cthe ratio Mt/M0 exceeded 0.5 and application ofEquation (1) adds to the margin of error. However,the regression line fits all the points above 45�C, whichindicates absence of a significant deviation. Thevariations of the pre-exponential factor (D0) estimatesfrom the Arrhenius plot become greater due to thereduced number of degrees of freedom. The confidenceintervals were large, attributed to the temperaturedependence for extrapolation of ln(D0). In a statisticalsense, the extrapolation error must be large, becausethe curves are fitted in one temperature domain andused for prediction in another.
When all the diffusion coefficients obtained attemperatures below 45�C are included, the linearregression fit to the Arrhenius plot is considerablyweakened, which was indicated by a lower coefficientof determination (R25 0.98). The activation energy(Ea) was therefore determined by linear regressionanalysis of a number of consecutive temperature stepsthat yielded an R2
� 0.99, which are all the pointspreceding unambiguous deviation from linearArrhenius plot. The non-linear behaviour of theArrhenius relationship is difficult to understand.Normally, below Tg the decreased mobility of APETchains should hinder the diffusion of migrants and adownward curvature of the plot is expected. On thecontrary, temperature seems to have a limited effect onthe diffusion and an upward curvature of theArrhenius plot related to lower Ea values was observed.Since activation energy is specific to the type ofcompound, i.e. molecular weight and size, this findingcould indicate that the composition of the migrating Sbfraction is different in the low-temperature domain.
Alternatively, all the data (n¼ 10) were reanalysedby non-linear regression analysis using Equation (3).Linear regression provided somewhat biased resultsdepending on the number of data points (Table 1),whereas non-linear regression analysis does not sufferfrom the same problem. The Ea (�95% CI) and D0
values of 187� 0.08 kJmol�1 and 4� 1014 cm2 s�1,respectively, were almost identical to those obtainedby linear regression with five data points. The 95%
Figure 2. Temperature dependence (Arrhenius plot) of theapparent diffusion coefficient of Sb in PET. The dotted linerefers to the data of Welle and Franz (2011). Tg denotes theglass transition temperature range.
594 M. Haldimann et al.
confidence interval of Ea was considerably smaller,which demonstrated that more precise estimates can beobtained from all data instead of selected data pointsin the linear range. The comparison shows that linearregression is in principle not inferior to non-linearregression; however, the latter is robust and notsusceptible to deviation from Arrhenius behaviour atlow temperatures.
Comparison with literature data
Comparing the results with those found in the litera-ture is instructive. If the diffusion of an Sb compoundproceeded not disturbed by experimental conditions inidentically structured PET, the parameters D0 and Ea
would have unique values. Hence, all diffusion data fallonto the same line of an Arrhenius plot and the scatterin the data is due to experimental error. Consequently,another PET material will have a different pre-exponential factor or a different activation energy,i.e. the bottle PET data depicted in Figure 2 lie in adifferent region of the Arrhenius plot (Welle & Franz2011). The apparent diffusion coefficients of Sb inTable 1 were higher than previously reported experi-mental data from bottle PET (Welle & Franz 2011). Asillustrated in Figure 2, the linear part of the Arrheniusplot runs parallel to the data found by Welle and Franz(2011). Thus, the activations energies are essentially thesame, whereas the pre-exponential factors differ.
Factors controlling migration are the nature of theSb migrants and the morphology of the PET.Concerning migrants, molecular weight and shape,i.e. the chemical structure of Sb glycolate complexes, isof particular importance. Diffusion coefficients in PETare apparently more sensitive to the molecular weightof the diffusing species than in polyolefins (Pennarunet al. 2004a). Therefore, the molecular weight distri-bution of the diffusible Sb–glycol complexes is a keyfactor.
Furthermore, an influence of the PET morphologyon the diffusion coefficients can be expected. Semi-crystalline polymers such as PET contain separateamorphous and crystalline morphological regions.Diffusants cannot penetrate crystalline phases of PETpolymers readily and take the path of least resistancethrough amorphous regions (Whitehead 1977).However, the properties of amorphous regionsdepend also on crystallites, e.g. the mobility of polymerchains can be restricted by cross-linking of crystallites.Accordingly, crystallinity in combination with orien-tation can explain differences in diffusion coefficientsamong polymers (Dudler & Muinos 1996). The degreeof crystallinity in the bottle PET investigated by Welleand Franz (2011) was 43% and was considerablyhigher than that in the PET under study (27%). Straininduced crystallisation is a result of the stretch blow
moulding process used to make PET bottles. Incontrast to the non-oriented crystalline structures ofthermoformed trays, this manufacturing processresults in bottles with highly oriented crystallites,which could possibly explain the differences in thediffusion coefficients.
Another prominent difference between ovenwareand bottle PET is the content of titanium pigment,which is primarily used to alter the appearance. Inaddition, it may suppress strain-induced crystallisation(Taniguchi & Cakmak 2004). The titanium content of0.50%� 0.01% was measured by ICP-MS. Titaniumdioxide (TiO2) is a mineral that exhibits sorptionproperties. In particular, TiO2 nanoparticles have alarge adsorption capacity for arsenic, which is anelement with similar chemical properties to Sb (Sunet al. 2009). In bulk PET, the TiO2 particles arenormally present in sub-micron size and possess largesurfaces (Taniguchi & Cakmak 2004), and thus theymay be effective in delaying Sb diffusion. In the PETunder study, it is however unlikely that the presence ofTiO2 is responsible for the differing apparent diffusioncoefficients shown in Figure 2. The presence of TiO2
does not impede diffusion of Sb because it proceedsfaster in the tray PET when compared with bottle PET.
Experimental and simulated Sb migration intoreal food
Simulated Sb contents were obtained using the SMLsoftware AKTS, run with experimental Arrheniusparameters as input: Ea¼ 188 kJmol�1 and D0¼
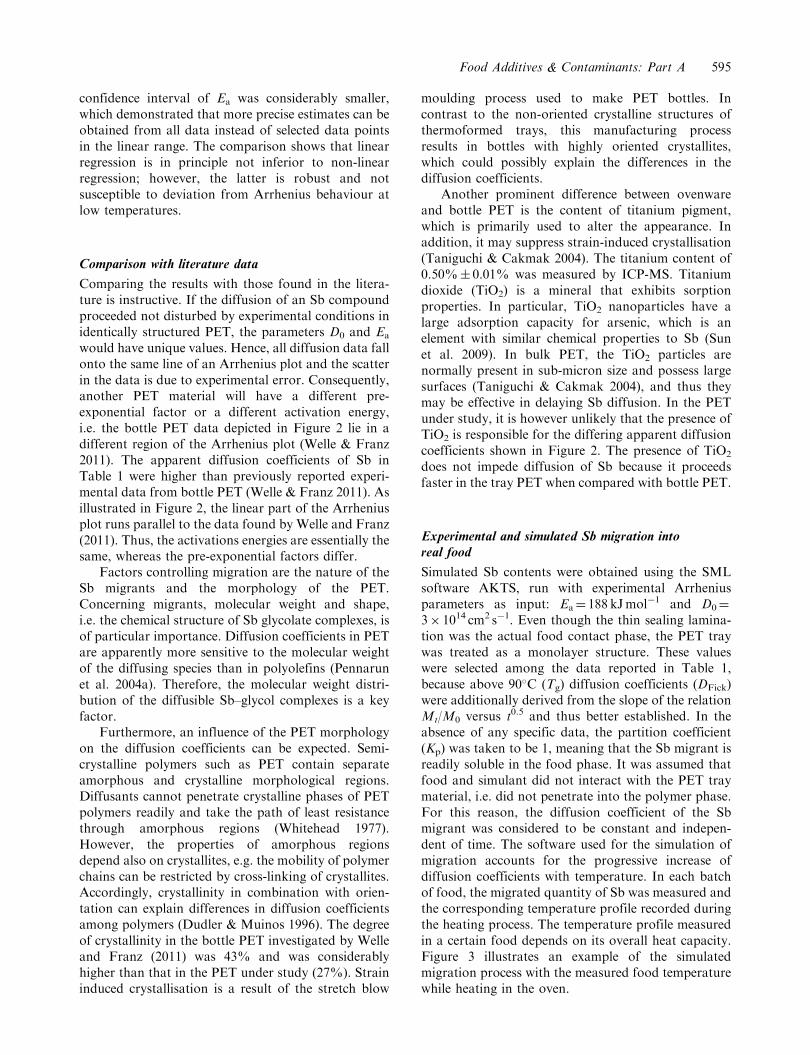
3� 1014 cm2 s�1. Even though the thin sealing lamina-tion was the actual food contact phase, the PET traywas treated as a monolayer structure. These valueswere selected among the data reported in Table 1,because above 90�C (Tg) diffusion coefficients (DFick)were additionally derived from the slope of the relationMt/M0 versus t0.5 and thus better established. In theabsence of any specific data, the partition coefficient(Kp) was taken to be 1, meaning that the Sb migrant isreadily soluble in the food phase. It was assumed thatfood and simulant did not interact with the PET traymaterial, i.e. did not penetrate into the polymer phase.For this reason, the diffusion coefficient of the Sbmigrant was considered to be constant and indepen-dent of time. The software used for the simulation ofmigration accounts for the progressive increase ofdiffusion coefficients with temperature. In each batchof food, the migrated quantity of Sb was measured andthe corresponding temperature profile recorded duringthe heating process. The temperature profile measuredin a certain food depends on its overall heat capacity.Figure 3 illustrates an example of the simulatedmigration process with the measured food temperaturewhile heating in the oven.
595Food Additives & Contaminants: Part A

The purpose of this study was to obtain quantita-
tive and reproducible data on Sb migration, and
therefore mixing and grinding of semi-liquid foods
was necessary to ensure maximum contact between the
phases. The result of the practical migration experi-
ments are listed in Table 2. The Sb concentrations in
the raw food products were clearly above background
levels because they depended on previous contact with
PET polymers (Haldimann et al. 2007). A three- to six-
fold increase of the Sb concentration in food was
observed as a result of heating in the oven.The results indicate there is no significant difference
(p¼ 0.1) between measured and simulated Sb
quantities, i.e. migration modelling successfully fittedthe experimental Sb data and made it possible topredict the migrated quantities with satisfactory accu-racy. Furthermore, this agreement demonstrated thatthe sealing layer has no barrier properties towards Sbcompounds from the parent PET. The simulatedvalues depend on Equation (1), which represents acase of negligible mass transfer resistance on the side ofthe food, i.e. the migration process is controlled bydiffusion in PET. However, progressive drying of thefood during the heating process may narrow down theactual contact surface by formation of tiny hollowspaces and cracks. Moreover, experience has shownthat the correct measurement of the temperature was akey factor in the success of the experiments.
The absolute worst-case migration would be theconcentration of Sb in the food if all migrants weretransferred from the polymer, which was not the casefor the PET under study. However, the migrated Sb inthe study samples certainly exceeded the quantities thatcan be expected in food after preparing it forconsumption. In this study, some of the PET trayswere filled to the brim with food, which is not normallythe case in retail packages. In addition, the pre-mixingof the food facilitated migration of Sb into the foodphase. Even though the measured Sb concentrationswere not normalised with respect to the surface/volumeratios, it is evident that the SML of 40 mg kg�1 was notexceeded in any of the food samples. In fact, the majorpart of the ready-to-use food products on sale areintended for heating in a microwave oven. In micro-wave foods the temperature approaches 100�C in a fewminutes and the cooking times are shorter. However,temperature monitoring of food in a microwave field isexperimentally very difficult. In tray-shaped productsmicrowave energy concentrates in the corners, givingrise to hot spots (Campanone & Zaritzky 2005). Hence,
Table 2. Increase of Sb concentration in ready meals after cooking in a conventional oven. Comparison between experimentallymeasured and simulated Sb migrating to food.
Ready meal Condition Dry matter (%)
Sb concentration (mg kg�1)a Migrated Sb mass (mg)
Dry matter Fresh matter Measured Simulated
Lasagna (with meat) Raw 26.0 6.5 1.7Cooked 29.9 31.5 9.4 3.0 4.0
Pasta gratin Raw 27.8 8.0 2.2Cooked 35.2 39.1 13.7 2.0 2.4
Cannelloni (Bolognese) Raw 27.8 10.0 2.8Cooked 35.4 38.3 13.6 1.8 2.2
Cannelloni Raw 32.1 11.7 3.7Cooked 35.7 41.8 14.9 4.7 4.7
Fish filets (Provencal) Raw 24.7 11.0 3.0Cooked 27.0 36.7 9.1 3.6 3.4
Pasta (with meat) Raw 27.0 10.1 2.6Cooked 35.9 38.6 13.8 2.1 2.8
Note: aMean values of duplicate determinations.
Figure 3. The solid line displays the simulated progressivemigration of Sb into food (cannelloni). The increase inconcentration represents Sb that was migrated into food as aresult of heating, i.e. the difference between total andbackground Sb. For comparison, the dashed curve representsthe respective temperature measured in the actual foodmatrix.
596 M. Haldimann et al.

the non-uniform temperature profile in the food would
make it difficult to simulate accurately the Sb migra-tion with the SML software. In any case, migration of
Sb from PET trays into food irradiated by microwavesis inferior to that heated in conventional baking ovens(Haldimann et al. 2007).
Conclusion
This study reports the migration properties of Sb fromPET to 3% acetic acid and real food for a food-contact
material, which represents the bulk of polymerscurrently used in ovenable ready meal packaging.The specific Arrhenius parameters needed in migration
modelling were derived. Migration modelling based onFick’s law gave a prediction of the Sb migrant
concentration under defined contact conditionsbetween food simulant and PET. A very satisfactoryagreement between model results and experimentally
measured food data was obtained, demonstrating thevalidity of the model and its inputs, i.e. Ea, D0 and
temperature profiles for a monolayer structure.Metals and semimetals such as Sb are not included
in the current European Union legislation for theestimation of their migration levels by recognised
diffusion models (European Commission 2002).However, with respect to regulatory guidelines, migra-tion modelling can be used as a tool for orientation
purposes. In industrial practice, simulations can beperformed to study the effect of the thickness, temper-ature and product volumes on the Sb concentration in
food, saving time and reducing the number of labora-tory analysis. Furthermore, this kind of migration
modelling might also be useful for estimating humanexposure to ensure a consumer safety margin.
References
Aharoni SM. 1998. The cause of the grey discoloration of
PET prepared by the use of antimony-catalysts. Polym
Eng Sci. 38:1039–1047.AKTS. 2012. AKTS-SML software [Internet]. Available
from: http://www.akts.com/sml-diffusion-migration-mul-
tilayer-packaging/download-diffusion-prediction-soft-
ware.html. Siders: AKTS.
Alt A, Haldimann M, Dudler V. 2008. Diffusion coefficient
of antimony catalysts in polyethylene terephthalate (PET)
materials. Poster presented at: 4th International
Symposium on Food Packaging – Scientific
Developments Supporting Safety and Quality; 2008 Nov
19; Prague, Czech Republic.Asakura K, Satoh H, Chiba M, Okamoto M, Serizawa K,
Nakano M, Omae K. 2009. Genotoxicity studies of heavy
metals: lead, bismuth, indium, silver and antimony.
J Occupat Health. 51:498–512.
Ashby R. 1988. Migration from polyethylene terephthalate
under all conditions of use. Food Addit Contam. 5(sup
001):485–492.BAG. 2005. Antimon in Mineralwasser. Beurteilung des
Gesundheitsrisikos Bull. 44:796–797.Begley T, Castle L, Feigenbaum A, Franz R, Hinrichs K,
Lickly T, Mercea P, Milana M, O’Brien A, Rebre S, et al.
2005. Evaluation of migration models that might be used
in support of regulations for food-contact plastics. Food
Addit Contam. 22:73–90.
Bharadwaj RK, Boyd RH. 1999. Small molecule penetrant
diffusion in aromatic polyesters: a molecular dynamics
simulation study. Polymer. 40:4229–4236.Biros SM, Bridgewater BM, Villeges-Estrada A, Tanski JM,
Parkin G. 2002. Antimony ethylene glycolate and cate-
cholate compounds: structural characterization of polyes-
terification catalysts. Inorgan Chem. 41:4051–4057.
Brauner N, Shacham M. 1997. Statistical analysis of linear
and nonlinear correlation of the Arrhenius equation
constants. Chem Eng Process Process Intensif. 36:243–249.Campanone LA, Zaritzky NE. 2005. Mathematical analysis
of microwave heating process. J Food Eng. 69:359–368.
Castle L, Macarthur R, Mead EM, Read WA. 2004.
Measurement uncertainty associated with overall migra-
tion testing. Food Addit Contam. 21:256–264.Choe SY, Kim SJ, Kim HG, Lee JH, Choi Y, Lee H, Kim Y.
2003. Evaluation of estrogenicity of major heavy metals.
Sci Total Env. 312:15–21.
Crank J. 1956. Diffusion in an plane sheet. In: The
mathematics of diffusion. Chap. 4. Oxford: Oxford
University Press; p. 42–61.Dudler V, Muinos C. 1996. Diffusion of benzotriazoles in
polypropylene: influence of polymer morphology and
stabilizer structure. ACS Adv Chem Ser. 249:441–454.
Duh B. 2002. Effect of antimony catalyst on solid-state
polycondensation of poly(ethylene terephthalate).
Polymer. 43:3147–3154.El-Toufaili FA, Feix G, Reichert KH. 2006. Mechanistic
investigations of antimony-catalyzed polycondensation in
the synthesis of poly(ethylene terephthalate). J Polym Sci
A: Polym Chem. 44:1049–1059.
Eslami H, Muller-Plathe F. 2009. Structure and mobility of
poly(ethylene terephthalate): a molecular dynamics simu-
lation study. Macromolecules. 42:8241–8250.European Commission. 2002. Commission Directive 2002/
72/EC of 6 August 2002 relating to plastic materials and
articles intended to come into contact with foodstuffs. Off
J Eur Union. L. 39:1–42.
European Commission. 2003. Commission Directive 2003/
40/EC of 16 May 2003 establishing the list, concentration
limits and labelling requirements for the constituents of
natural mineral waters and the conditions for using ozone-
enriched air for the treatment of natural mineral waters
and spring waters. Off J Eur Union. L 126:34–39.
European Commission. 2005. Commission Directive 2005/
79/EC of 18 November 2005 amending Directive 2002/72/
EC relating to plastic materials and articles intended to
come into contact with food. Off J Eur Union. L
302:35–45.European Food Safety Authority (EFSA). 2004. Opinion of
the Scientific Panel on Food Additives, Flavourings,
Processing Aids and Materials in Contact with Food
Food Additives & Contaminants: Part A 597

(AFC) on a request from the Commission related to a 2ndlist of substances for food contact materials. EFSA J.
24:1–13.Fischer T. 1997. Study on different parameters influencingthe additive-polymer compatibility [dissertation].Montanuniversitat: University of Leoben, Institute of
Materials Science and Testing of Plastics.Fordham PJ, Gramshaw JW, Crews HM, Castle L. 1995.Element residues in food contact plastics and their
migration into food simulants, measured by inductivelycoupled plasma-mass spectrometry. Food Addit Contam.12:651–669.
Gebel T. 1997. Arsenic and antimony: comparative approachon mechanistic toxicology. Chemico-Biol Interact. 107:131–144.
Haldimann M, Blanc A, Dudler V. 2007. Exposure to
antimony from polyethylene terephthalate (PET) traysused in ready-to-eat meals. Food Addit Contam. 24:860–868.
International Agency for Research on Cancer (IARC). 1989.Some organic solvents, resin monomers and relatedcompounds, pigments and occupational exposures in
paint manufacture and painting. 47:291. IARCMonographs on the Evaluation of Carcinogenic Risks toHumans.
Keresztes S, Tatar E, Mihucz VG, Virag I, Majdik C,Zaray G. 2009. Leaching of antimony from polyethyleneterephthalate (PET) bottles into mineral water. Sci TotalEnv. 407:4731–4735.
Maerov SB. 1979. Influence of antimony catalysts withhydroxyethoxy ligands on polyester polymerization.J Polym Sci Polym Chem Ed. 17:4033–4040.
Pennarun PY, Dole P, Feigenbaum A. 2004a. Functionalbarriers in PET recycled bottles. Part I. Determination ofdiffusion coefficients in bioriented PET with and without
contact with food simulants. J Appl Polym Sci. 92:2845–2858.
Pennarun PY, Dole P, Feigenbaum A. 2004b. Overestimated
diffusion coefficients for the prediction of worst casemigration from PET: application to recycled PET and tofunctional barriers assessment. Packag Technol Sci.17:307–320.
Roduit B, Borgeat CH, Cavin S, Fragniere C, Dudler V.2005. Application of finite element analysis (FEA) for the
simulation of release of additives from multilayer poly-meric packaging structures. Food Addit Contam. 22:945–955.
Rusz Hansen H, Pergantis SA. 2006. Detection of antimony
species in citrus juices and drinking water stored in PETcontainers. J Anal At Spectrom. 21:731–733.
Shotyk W, Krachler M, Chen B. 2006. Contamination of
Canadian and European bottled waters with antimonyfrom PET containers. J Environ Monit. 8:288–292.
Sun H, Zhang X, Zhang Z, Chen Y, Crittenden JC. 2009.
Influence of titanium dioxide nanoparticles on speciationand bioavailability of arsenite. Environ Poll. 157:1165–1170.
Taniguchi A, Cakmak M. 2004. The suppression of strain
induced crystallization in PET through sub micron TiO2
particle incorporation. Polymer. 45:6647–6654.Thiele UK. 2001. The current status of catalysis and catalyst
development for the industrial process of poly(ethyleneterephthalate) polycondensation. Int J Polymeric Mat.50:387–394.
Vergnaud JM. 1991. Liquid transport processes in polymericmaterials: modeling and industrial applications.Englewood Cliffs, NJ: Prentice Hall. Chapter 1,
Diffusion in a plane sheet; p. 1–17.Welle F, Franz R. 2011. Migration of antimony from PETbottles into beverages: determination of the activationenergy of diffusion andmigrationmodelling compared with
literature data. Food Addit Contam A. 28:115–126.Westerhoff P, Prapaipong P, Shock E, Hillaireau A. 2008.Antimony leaching from polyethylene terephthalate (PET)
plastic used for bottled drinking water. Water Res.42:551–556.
Whitehead BD. 1977. The crystallization and drying of
polyethylene terephthalate (PET). Ind Eng Chem ProcessDes Dev. 16:341–346.
World Health Organization (WHO). 2003. Antimony in
drinking-water. Background document for preparation ofWHO Guidelines for drinking-water quality. WHO/SDE/WSH/03.04/74. Geneva: WHO.
598 M. Haldimann et al.