migrants’ remittances from italy · interviewed migrants differ by country of origin, gender,...
TRANSCRIPT
MAY 2014
International remittances and access to financial services for migrants in Turin, Italy
A Greenback 2.0 RepoRt
Migrants’ Remittancesfrom Italy

i
A survey by
Migrants’
Remittances
from ItalyInternational remittances and access to financial services for migrants in Turin, ItalyA GREENBACK 2.0 REPORT
MAY 2014
8974-FM.pdf i8974-FM.pdf i 5/23/14 3:56 PM5/23/14 3:56 PM

8974-FM.pdf ii8974-FM.pdf ii 5/19/14 3:42 PM5/19/14 3:42 PM
iii
CONTENTS
FOREWORD AND ACKNOWLEDGMENTS . . . . . . . . . . . . . . . . . . . . . . . . . . . . . . . . . . . . . . . . . . . . . . v
LIST OF TABLES AND FIGURES . . . . . . . . . . . . . . . . . . . . . . . . . . . . . . . . . . . . . . . . . . . . . . . . . . . . . . . . vii
EXECUTIVE SUMMARY . . . . . . . . . . . . . . . . . . . . . . . . . . . . . . . . . . . . . . . . . . . . . . . . . . . . . . . . . . . . . . . . . . . xi
INTRODUCTION . . . . . . . . . . . . . . . . . . . . . . . . . . . . . . . . . . . . . . . . . . . . . . . . . . . . . . . . . . . . . . . . . . . . . . . . . . . . 1
INTERNATIONAL REMITTANCES AND THE ECONOMIC CRISIS: THE CONTEXT OF THE SURVEY . . . . . . . . . . . . . . . . . . . . . . . . . . . . . . . . . . . . . . . . . . . . . . . . . . . . . . . . 3
The world scenario: large and growing remittance flows . . . . . . . . . . . . . . . . . . . . . . . . . . . . . . . 3
Italy and Piedmont: a context of severe and protracted economic crisis . . . . . . . . . . . . . 4
THE GREENBACK 2.0 SURVEY: RESEARCH OBJECTIVES AND DATA COLLECTION . . . . . . . . . . . . . . . . . . . . . . . . . . . . . . . . . . . . . . . . . . . . . . . . . . . . . . . . . . . . . . . . . . . . . . . . . . . . . . 7
Work plan and survey design . . . . . . . . . . . . . . . . . . . . . . . . . . . . . . . . . . . . . . . . . . . . . . . . . . . . . . . . . . . . . . 7
Research objectives . . . . . . . . . . . . . . . . . . . . . . . . . . . . . . . . . . . . . . . . . . . . . . . . . . . . . . . . . . . . . . . . . . . . 7
Sample structure definition . . . . . . . . . . . . . . . . . . . . . . . . . . . . . . . . . . . . . . . . . . . . . . . . . . . . . . . . . . . . 7
Sampling method and surveying technique . . . . . . . . . . . . . . . . . . . . . . . . . . . . . . . . . . . . . . . . . . . . . 8
EMPIRICAL FINDINGS . . . . . . . . . . . . . . . . . . . . . . . . . . . . . . . . . . . . . . . . . . . . . . . . . . . . . . . . . . . . . . . . . . . . 9
The demographic and economic profiles . . . . . . . . . . . . . . . . . . . . . . . . . . . . . . . . . . . . . . . . . . . . . . . . 9
Job type, occupation, and sectors . . . . . . . . . . . . . . . . . . . . . . . . . . . . . . . . . . . . . . . . . . . . . . . . . . . . 11
Individual income . . . . . . . . . . . . . . . . . . . . . . . . . . . . . . . . . . . . . . . . . . . . . . . . . . . . . . . . . . . . . . . . . . . . . . . 15
Savings & financial inclusions . . . . . . . . . . . . . . . . . . . . . . . . . . . . . . . . . . . . . . . . . . . . . . . . . . . . . . . . . . . . . 16
Savings . . . . . . . . . . . . . . . . . . . . . . . . . . . . . . . . . . . . . . . . . . . . . . . . . . . . . . . . . . . . . . . . . . . . . . . . . . . . . . . . . . 16
Banking products and services . . . . . . . . . . . . . . . . . . . . . . . . . . . . . . . . . . . . . . . . . . . . . . . . . . . . . . . 16
Access to credit . . . . . . . . . . . . . . . . . . . . . . . . . . . . . . . . . . . . . . . . . . . . . . . . . . . . . . . . . . . . . . . . . . . . . . . . 18
Microcredit . . . . . . . . . . . . . . . . . . . . . . . . . . . . . . . . . . . . . . . . . . . . . . . . . . . . . . . . . . . . . . . . . . . . . . . . . . . . . . 21
Remittance behaviors: flows and recipients, operator and costs . . . . . . . . . . . . . . . . . . . . . . 21
Main recipients and motivations . . . . . . . . . . . . . . . . . . . . . . . . . . . . . . . . . . . . . . . . . . . . . . . . . . . . . . . 21
Channels and Remittance Service Providers . . . . . . . . . . . . . . . . . . . . . . . . . . . . . . . . . . . . . . . . 23
Volume per transaction and per year . . . . . . . . . . . . . . . . . . . . . . . . . . . . . . . . . . . . . . . . . . . . . . . . 27
Transaction costs: a distorted perception . . . . . . . . . . . . . . . . . . . . . . . . . . . . . . . . . . . . . . . . . . . 27
Trends in remittances . . . . . . . . . . . . . . . . . . . . . . . . . . . . . . . . . . . . . . . . . . . . . . . . . . . . . . . . . . . . . . . . . . 30
Received remittances . . . . . . . . . . . . . . . . . . . . . . . . . . . . . . . . . . . . . . . . . . . . . . . . . . . . . . . . . . . . . . . . . . 31
CONCLUSIONS . . . . . . . . . . . . . . . . . . . . . . . . . . . . . . . . . . . . . . . . . . . . . . . . . . . . . . . . . . . . . . . . . . . . . . . . . . . 35
REFERENCES . . . . . . . . . . . . . . . . . . . . . . . . . . . . . . . . . . . . . . . . . . . . . . . . . . . . . . . . . . . . . . . . . . . . . . . . . . . . . 37
8974-FM.pdf iii8974-FM.pdf iii 5/19/14 3:42 PM5/19/14 3:42 PM

iv GREENBACK 2.0 REPORT 2014
ANNEX I—FROM THE SURVEY DESIGN TO THE FIELDWORK: A METHODOLOGICAL NOTE . . . . . . . . . . . . . . . . . . . . . . . . . . . . . . . . . . . . . . . . . . . . . . . . . . . . . . . . . . . 39
The Questionnaire . . . . . . . . . . . . . . . . . . . . . . . . . . . . . . . . . . . . . . . . . . . . . . . . . . . . . . . . . . . . . . . . . . . . . . . . . 39
Training of interviewers and pilots . . . . . . . . . . . . . . . . . . . . . . . . . . . . . . . . . . . . . . . . . . . . . . . . . . . . . . . 40
The fieldwork: sampling strategy and entry points . . . . . . . . . . . . . . . . . . . . . . . . . . . . . . . . . . . . 40
Feedbacks from the fieldwork . . . . . . . . . . . . . . . . . . . . . . . . . . . . . . . . . . . . . . . . . . . . . . . . . . . . . . . . . . . . 42
Data entry, cleaning and analysis . . . . . . . . . . . . . . . . . . . . . . . . . . . . . . . . . . . . . . . . . . . . . . . . . . . . . . . . 43
ANNEX II—DETAILED STATISTICS . . . . . . . . . . . . . . . . . . . . . . . . . . . . . . . . . . . . . . . . . . . . . . . . . . . . . 45
A. Italy’s remittance and foreign resident population data . . . . . . . . . . . . . . . . . . . . . . . . . . . . 45
B. Survey data: remittances . . . . . . . . . . . . . . . . . . . . . . . . . . . . . . . . . . . . . . . . . . . . . . . . . . . . . . . . . . . . . . 47
8974-FM.pdf iv8974-FM.pdf iv 5/19/14 3:42 PM5/19/14 3:42 PM

v
FOREWORD AND ACKNOWLEDGMENTS
With over $400 billion officially recorded annual flows to developing countries, remittances are a critical source of national and families’ income. However, high
transaction costs and other inefficiencies in the process often adversely impact migrant workers and their families.
The G8 and G20 have, therefore, set among their objectives the reduction of the average cost of remittances by five percentage points in five years (5x5 objective). Achieving the objective would save $16 billion per year: these funds would simply remain to migrants and their families and could contribute significantly to improving the living conditions of the migrants themselves as well as reducing poverty in their countries of origin.
Project Greenback 2.0 aims at increasing efficiency in the market for remittances through an innovative approach: promote change inspired by the real needs of the ulti-mate beneficiaries of international money transfers: the migrants and their families.
In Project Greenback 2.0, Remittances Champion Cities are selected. The World Bank work to implement initiatives aiming at increasing transparency and efficiency in the market for remittance services. The focus is on migrants and their needs. Cooperation between migrants, remittance service providers, and public authorities is key for the achievement of the Project’s objectives. Turin, Italy is the first “Remittances Champion City.”
In this context, the World Bank commissioned this study, which is the result of the joint efforts of FIERI (Forum of International and European Research on Immigration) and Labor (Laboratorio R. Revelli).
The team included Ferruccio Pastore (Director, FIERI), Eleonora Castagnone (Senior Researcher, FIERI), Claudia Villosio (Senior Researcher, Labor), and Laura Bartolini (Junior Researcher, Labor), whom we all wish to thank. The fieldwork was coordinated by Laura Bartolini and Marta Pinto (Junior Researcher, FIERI). Data were processed and analyzed by Laura Bartolini and Claudia Villosio. The team wish to thank FIERI’s inter-viewers for their great work: Serena Anastasi, Dario Basile, Elena Evangelisti, Agnese Migliardi, Emanuela Roman.
Project Greenback 2.0 is coordinated by Marco Nicolì (Financial Sector Specialist, World Bank). In Turin, the team is coordinated by Viviana Premazzi and includes Romina Car-puci, Leyden Durand, and Khaled Elsadat.
I would like to express our gratitude to all of the participating communities, groups, and associations, the City of Turin and other local authorities and, most importantly, the interviewed migrants who gave us their time and their attention.
Massimo CirasinoManager, Financial Infrastructure and Remittances
Payment Systems Development GroupThe World Bank
8974-FM.pdf v8974-FM.pdf v 5/20/14 8:59 AM5/20/14 8:59 AM

8974-FM.pdf vi8974-FM.pdf vi 5/19/14 3:42 PM5/19/14 3:42 PM

LIST OF TABLES AND FIGURES vii
List of Tables and FiguresTable 1: Remittance outflows, 2007–2012: first 10 Italian provinces (€ thousand). . . . . . . . . . . . . . . . . . . . . . . . . . . . . . . . . . . . . . . . . . . . . . . . . . . . . . . . . . . . . . . . . . . . . . . . . . . . . 5
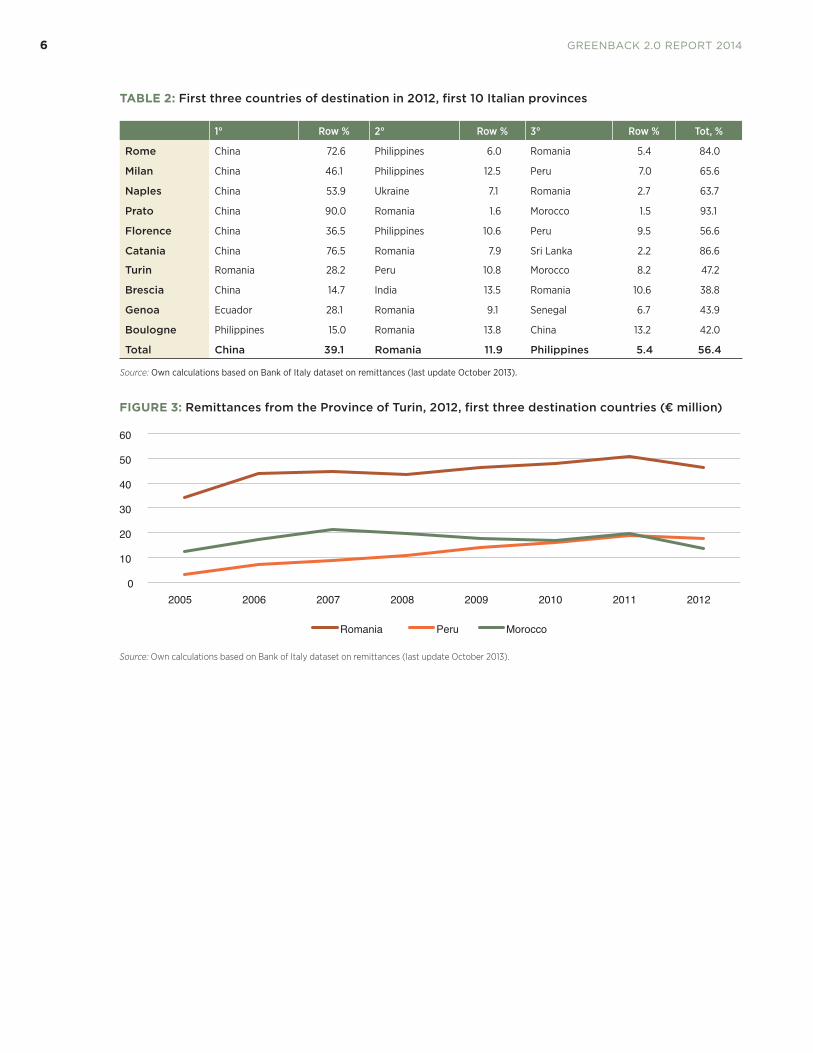
Table 2: First three countries of destination in 2012, first 10 Italian provinces . . . . . . . . . . . . . . . . . . . . . . . . . . . . . . . . . . . . . . . . . . . . . . . . . . . . . . . . . . . . . . . . . . 6
Table 3: Main characteristics of the sample, by country of origin . . . . . . . . . . . . . . . . . 9
Table 4: Documents at the time of first entry in Italy . . . . . . . . . . . . . . . . . . . . . . . . . . . . . 10
Table 5: Average number of relatives, by country of residence . . . . . . . . . . . . . . . . . . . 11
Table 6: Job distribution by type of contract for those arrived before and after 2008 . . . . . . . . . . . . . . . . . . . . . . . . . . . . . . . . . . . . . . . . . . . . . . . . . . . . . . . . . . . . . . . . . . . . . . . . . . 13
Table 7: Distribution by type of occupation,* by gender . . . . . . . . . . . . . . . . . . . . . . . . . . . 14
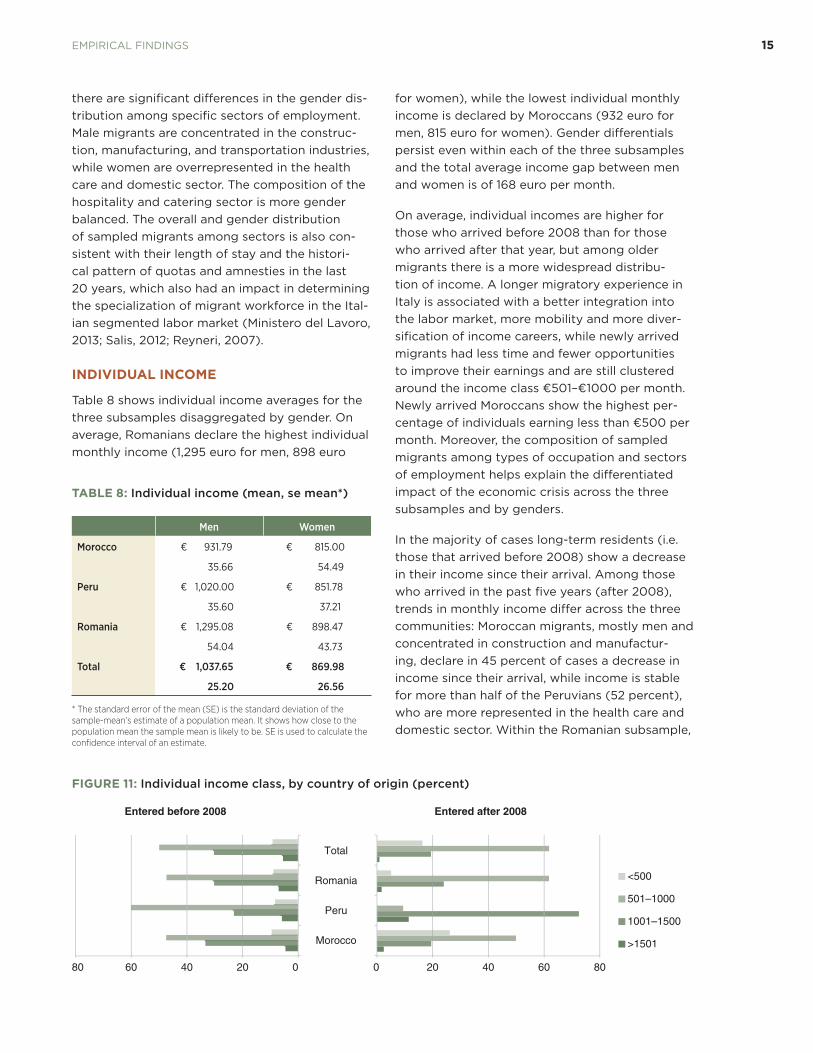
Table 8: Individual income (mean, se mean*) . . . . . . . . . . . . . . . . . . . . . . . . . . . . . . . . . . . . . . . . 15
Table 9: To whom do you send money? Remittance recipients, percent of total flows . . . . . . . . . . . . . . . . . . . . . . . . . . . . . . . . . . . . . . . . . . . . . . . . . . . . . . . . . . . . . . . . . . . 21
Table 10: Average amount sent per year, by recipient . . . . . . . . . . . . . . . . . . . . . . . . . . . . . 22
Table 11: Number and share of flows per channel, by country . . . . . . . . . . . . . . . . . . . . . 24
Table 12: Average amount sent per flows, by type of channel used . . . . . . . . . . . . . . 27
Table 13: Frequencies of transaction per flow, percent of total flows . . . . . . . . . . . . 28
Table 14: Average amount sent per transaction and per year . . . . . . . . . . . . . . . . . . . . . 28
Table 15: Average cost per transaction as percent of the amount sent, by type of channel used . . . . . . . . . . . . . . . . . . . . . . . . . . . . . . . . . . . . . . . . . . . . . . . . . . . . . . . . . . . . . . . 29
Table 16: Comparison between actual average costs and perceived average cost . . . . . . . . . . . . . . . . . . . . . . . . . . . . . . . . . . . . . . . . . . . . . . . . . . . . . . . . . . . . . . . . . . . . . . . . . . . . 29
Table 17: Cost composition (percent), by type of channel used . . . . . . . . . . . . . . . . . . . 29
Table 18: Intercepted migrants excluded from the survey . . . . . . . . . . . . . . . . . . . . . . . . . 43
Table 19: Remittance outflows by Italian Regions, 2012 . . . . . . . . . . . . . . . . . . . . . . . . . . . . 45
Table 20: Remittance outflows by destination country, 2012 . . . . . . . . . . . . . . . . . . . . . 46
Table 21: Remittance outflows from the Province of Turin, first 20 destination countries 2005–2012 (€ million) . . . . . . . . . . . . . . . . . . . . . . . . . . . . . . . . . . . . 46
Table 22: Foreign resident population in the Province of Turin, first 20 origin countries, 2003–2011 . . . . . . . . . . . . . . . . . . . . . . . . . . . . . . . . . . . . . . . . . . . . . . . . . . . . . . . 47
Table 23: Flows’ recipients, by main channel . . . . . . . . . . . . . . . . . . . . . . . . . . . . . . . . . . . . . . . . 47
Table 24: Average amount sent per year (classes), by country . . . . . . . . . . . . . . . . . . . 48
Table 25: Average amount sent per year, by recipient . . . . . . . . . . . . . . . . . . . . . . . . . . . . . 48
Table 26: Average amount sent per year, by type of channel used . . . . . . . . . . . . . . . 48
Figure 1: International financial flows, 1990–2016. . . . . . . . . . . . . . . . . . . . . . . . . . . . . . . . . . . . 3
Figure 2: Foreign resident population and remittances in Italy, 2005–2012 . . . . . . 5
Figure 3: Remittances from the Province of Turin, 2012, first three destination countries (€ million) . . . . . . . . . . . . . . . . . . . . . . . . . . . . . . . . . . . . . . . . . . . . . . . . . . . . . . . 6
8974-FM.pdf vii8974-FM.pdf vii 5/19/14 3:42 PM5/19/14 3:42 PM

viii GREENBACK 2.0 REPORT 2014
Figure 4: The three phases of the research . . . . . . . . . . . . . . . . . . . . . . . . . . . . . . . . . . . . . . . . . . 7
Figure 5: Municipality of Turin: districts . . . . . . . . . . . . . . . . . . . . . . . . . . . . . . . . . . . . . . . . . . . . . . 8
Figure 6: Transitions in legal status, between the initial period of residence in Italy and 2013 . . . . . . . . . . . . . . . . . . . . . . . . . . . . . . . . . . . . . . . . . . . . . . . . . . . . . . . . . . 11
Figure 7: Distribution by number of relatives residing in the country of origin . . . . . . . . . . . . . . . . . . . . . . . . . . . . . . . . . . . . . . . . . . . . . . . . . . . . . . . . . . . . . . . . . . . . . . . . . . . . . . . . . . 12
Figure 8: Distribution by number of children left in the country of origin (percent of those with children) . . . . . . . . . . . . . . . . . . . . . . . . . . . . . . . . . . . . . . . . . . . . . . . . . . . . . . . 12
Figure 9: Hours worked per week (percent) . . . . . . . . . . . . . . . . . . . . . . . . . . . . . . . . . . . . . . . . . 13
Figure 10: Sectors of occupation,* percent of total sample . . . . . . . . . . . . . . . . . . . . . . . 14
Figure 11: Individual income class, by country of origin (percent) . . . . . . . . . . . . . . . . . 15
Figure 12: Individual income: trend since the arrival in Italy (percent of total subsample) . . . . . . . . . . . . . . . . . . . . . . . . . . . . . . . . . . . . . . . . . . . . . . . . . . . . . . . . . 16
Figure 13: Could you save since the beginning of 2013? If yes, how much? . . . . . . . 17
Figure 14: Type of savings (percent of those who save) . . . . . . . . . . . . . . . . . . . . . . . . . . . . 17
Figure 15: Bank account ownership . . . . . . . . . . . . . . . . . . . . . . . . . . . . . . . . . . . . . . . . . . . . . . . . . . 18
Figure 16: Types of bank account (percent of total sample) . . . . . . . . . . . . . . . . . . . . . . . 18
Figure 17: Number of bank accounts in the HH (percent) . . . . . . . . . . . . . . . . . . . . . . . . . . 19
Figure 18: Services and products used (percent of total sample, more than one option allowed) . . . . . . . . . . . . . . . . . . . . . . . . . . . . . . . . . . . . . . . . . . . . . . . . . . . . . . . 19
Figure 19: Type of cards owned (percent of total sample, more than one option allowed) . . . . . . . . . . . . . . . . . . . . . . . . . . . . . . . . . . . . . . . . . . . . . . . . . . . . . . . . . . . . . . . . . . . 19
Figure 20: Loans’ distribution, classes of € (percentage of migrants with a loan) . . . . . . . . . . . . . . . . . . . . . . . . . . . . . . . . . . . . . . . . . . . . . . . . . . . . . . . . . . . . . . . . . . . . . . . . . . . . . 19
Figure 21: To whom did you ask for money? (percent). . . . . . . . . . . . . . . . . . . . . . . . . . . . . 20
Figure 22: In case you will need a loan, to whom would you ask? . . . . . . . . . . . . . . . . 20
Figure 23: Have you ever heard about microcredit? If yes, did you ever address a microcredit agency? . . . . . . . . . . . . . . . . . . . . . . . . . . . . . . . . . . . . . . . . . . . . . . . . . . . . . . . . 21
Figure 24: What is the money sent used for (percent more than one answer allowed) . . . . . . . . . . . . . . . . . . . . . . . . . . . . . . . . . . . . . . . . . . . . . . . . . . . . . . . . . . . . . . . . . . . . . . . . 23
Figure 25: Types of channel used to send remittances (percent of total flows) . . . . . . . . . . . . . . . . . . . . . . . . . . . . . . . . . . . . . . . . . . . . . . . . . . . . . . . . . . . . . . . . . . . . . . . . . . . . . . 24
Figure 26: Operator used, by type (percent of total flows). . . . . . . . . . . . . . . . . . . . . . . . 25
Figure 27: Bank operators (percent of total bank operators used) . . . . . . . . . . . . . . . 25
Figure 28: Where the transaction took place? (percent of total flows) . . . . . . . . . . 26
Figure 29: How long does it take for the money to be available at destination? (percent by channel) . . . . . . . . . . . . . . . . . . . . . . . . . . . . . . . . . . . . . . . . . . . . . . . . 26
Figure 30: How did you choose your main channel? (more than one answer allowed) . . . . . . . . . . . . . . . . . . . . . . . . . . . . . . . . . . . . . . . . . . . . . . . . . . . . . . . . . . . . . . . . . . . . . . . . 27
Figure 31: Pros and cons of main channels, percent . . . . . . . . . . . . . . . . . . . . . . . . . . . . . . . . 30
Figure 32: Did you ever have a problem? If yes, which kind of problem? . . . . . . . . 30
Figure 33: In case you had problems, did you look for help? . . . . . . . . . . . . . . . . . . . . . . . 31
8974-FM.pdf viii8974-FM.pdf viii 5/19/14 3:42 PM5/19/14 3:42 PM

LIST OF TABLES AND FIGURES ix
Figure 34: Since your arrival in Italy, is your main channel changed? (percentage of total sample) . . . . . . . . . . . . . . . . . . . . . . . . . . . . . . . . . . . . . . . . . . . . . . . . . . . . . . . . . . 31
Figure 35: What kind of channel did you use at that time? (percentage of those that have changed) . . . . . . . . . . . . . . . . . . . . . . . . . . . . . . . . . . . . . . . . . . . . . . . . . . . . . . . . . . . . . . 31
Figure 36: Trend in total amount sent since the arrival in Italy, by country of origin . . . . . . . . . . . . . . . . . . . . . . . . . . . . . . . . . . . . . . . . . . . . . . . . . . . . . . . . . . . . . . . . . . . . . . . . . . . . . . . . . . 31
Figure 37: Reasons for a decrease in remittance amount (percent) . . . . . . . . . . . . . . 32
Figure 38: Received remittances, by country and person of origin . . . . . . . . . . . . . . . 32
Figure 39: Questionnaire structure. . . . . . . . . . . . . . . . . . . . . . . . . . . . . . . . . . . . . . . . . . . . . . . . . . . 39
Figure 40: Map of Turin and data collection points . . . . . . . . . . . . . . . . . . . . . . . . . . . . . . . . 42
8974-FM.pdf ix8974-FM.pdf ix 5/19/14 3:42 PM5/19/14 3:42 PM

8974-FM.pdf x8974-FM.pdf x 5/19/14 3:42 PM5/19/14 3:42 PM

xi
EXECUTIVE SUMMARY
“Greenback 2.0–Torino” is a project led by the World Bank, in partnership with the City of Turin, aimed at fostering the development of an efficient and transparent
market for remittances. Within this framework, this survey, conducted by FIERI and Laboratorio R. Revelli between July and September 2013, investigated the demand side of the remittance market in the city of Turin, collecting 480 in-depth interviews of migrants from the Moroccan, Peruvian and Romanian communities. These are the three most numerous communities in the city and the largest in terms of remittances sent to the country of origin. The survey is aimed at describing the economic and financial profile of migrants. Specifically, it investigates the interconnected dimensions of financial behaviors— patterns of consumption and savings, remittances and investments, and financial needs and aspirations. Strong emphasis is given to remittance services and access to different types of financial products and services.
Interviewed migrants differ by country of origin, gender, length of stay in Italy, type of occupation and related economic stability. Moroccans and Peruvians tend to have larger families than Romanians, considering both relatives in the origin country and in Italy. Moroccan migrants show on average a longer presence in Italy and hence a higher rate of family reunification than both Peruvians and Romanians, which instead often report to have children left in the country of origin. As for economic conditions and level of inte-gration into the Italian labor market, differences arise across the subsamples and by gen-der. Romanians report the highest average monthly income, while Moroccans have the lowest earnings. This differentiation is consistent with the job and sector specialization of the three subsamples: Moroccan migrants, mostly men, are employed in manufactur-ing and construction, while many Peruvians and Romanians, especially among women, are employed in the care and domestic sector and seem to have more stable and higher earnings. Moreover, the relatively better economic condition among Romanians can also be attributed to their acquisition of the EU citizenship in 2007, which may facilitate their economic integration and stability.
Collected data suggests, on average a good level of economic and financial integration
of interviewed migrants, who, on average, declared high usage of financial products and instruments connected to a bank account, while microcredit is not popular and used very marginally.
As for the remittance service providers and channels for sending remittances, 83 per-
cent of all recorded remittance flows are sent in cash through a money transfer opera-
tor, and only a very small proportion through a bank account, a prepaid card, or twin cards. Although transaction costs are often deemed to be the crucial element in decid-ing if and how often to send remittances, remittance behaviors also seem to respond to other important characteristics of each channel and service provider, such as the
8974-FM.pdf xi8974-FM.pdf xi 5/20/14 8:59 AM5/20/14 8:59 AM

xii GREENBACK 2.0 REPORT 2014
availability of agencies at origin and at destination, the easy access for recipients to withdraw the money, the relative transaction speed, etc.
The analysis depicts a widespread misperception of transaction costs and overall service conditions by migrants. Remitters have low awareness of costs’ composition and often do not consider the presence of exchange rate’s margins and fixed costs at destination, irrespective of the preferred remittance service provider. Moreover, highly frequent flows are associated with low-value transactions, which imply an overall higher weight of fixed costs on the total amount sent per year. These characteristics suggest there is room for improvement in terms of competitiveness and transparency of all remittance service providers and the need for greater awareness and financial literacy and management skills among remitters.
The survey also provides a picture of trends and changes in migrants’ behaviors since arrival in Italy and demonstrates the impact of the current economic crisis on income and remittance flows. Declining economic conditions in the migrant communities depends, among other things, on different job specializations within the Italian labor market. Nevertheless, our empirical data show on average a severe situation in which the protracted economic instability is threatening the overall level of economic integra-tion of migrants and their capacity to keep remittance flows constant over time. In this regard, it is worth noting the role of reverse remittances, which represent the support from the origin household to migrants’ income to overcome the period of crisis. Never-theless, comparing trends in income and remittances, for the time being migrants’ remit-tances seem to be more resilient than income to the worsening of economic conditions
in Italy in the last five years.
8974-FM.pdf xii8974-FM.pdf xii 5/19/14 3:42 PM5/19/14 3:42 PM

1
INTRODUCTION
1
1
Migrants’ remittances represent a substantial amount of money both in terms of contribu-
tion to family income in the origin country and the aggregated financial inflows for receiving economies.
In 2013, the World Bank launched “Project Green-back 2.0—Remittances Champion Cities” and selected Turin, which is located in the Northern part of Italy, as the first “Remittance Champion City.”1 The Project aims at investigating the local market for international remittances and at favor-ing changes both on the supply and demand side, in order to boost transparency and efficiency and respond to the actual needs expressed by remittance senders and beneficiaries—the migrants, their families, and their origin countries in general.
As a part of the Project, FIERI (Forum of Interna-tional and European Research on Immigration) and Labor (Laboratorio R. Revelli) conducted a survey on migrants residing in Turin to explore their level of financial inclusion and their preva-lent practices in sending remittances to their ori-gin countries, with special attention to changing trends in a time of deep economic crisis.
This Report starts by presenting the international and Italian context of international remittance flows in the past decade, as a general framework of the study (Chapter 2). The connection between the labor market integration of migrants with the more general economic trends in their destination
1 For more information on Project Greenback 2.0 visit http://remittanceprices.worldbank.org
countries is a crucial issue in the current aca-demic and political debate. Trends and impacts of the economic crisis reflect themselves in micro-behaviors and affect also the transnational activi-ties of migrants. Chapter 3 presents the objectives of the research and the related survey design and sampling techniques for the fieldwork, while a specific methodological note is added at the end of the Report on the fieldwork phase. Chapter 4 focuses on empirical findings from the analysis of the 480 interviews collected. After a brief descrip-tion of demographic and economic conditions of interviewed migrants, the core of this section is devoted to the analysis of migrants’ attitudes and behaviors in sending remittances, in engaging in investments and savings, and to explore changes across time and according to their occupational status at destination. In light of the global com-mitment to the reduction of remittance costs2 as a part of a more comprehensive strategy to foster the migration and development nexus, a specific section deals with remittance service provid-ers and remittance costs revealing still room for improvement for the development of a competi-tive and transparent remittance market.
The conclusive chapter highlights the main empir-ical findings and suggests further lines of analysis on migratory models, migrant economic inte-gration and transnationalism from the collected empirical evidence.
2 A global effort is in place for the reduction of remittance prices. The so-called “5x5 objective” was adopted by the G8 at the 2009 L’Aquila Summit where the commitment was made “to achieve in particular the objective of a reduction of the global average costs of transferring remittances from the present 10 percent to 5 percent in five years.” In 2010, the G20 committed to a “significant reduction in the cost of remittances” and established a Devel-opment Action for Remittances.
8974-Chapter1.pdf 18974-Chapter1.pdf 1 5/19/14 3:41 PM5/19/14 3:41 PM

8974-Chapter1.pdf 28974-Chapter1.pdf 2 5/19/14 3:41 PM5/19/14 3:41 PM

3
INTERNATIONAL REMITTANCES AND THE ECONOMIC CRISIS: THE CONTEXT OF THE SURVEY
3
2
The world scenario: large and growing remittance flowsSince the late 1990s, officially recorded monetary remittances sent by international migrants to their origin countries have exceeded official develop-ment assistance (ODA) and portfolio investments. Remittance growth rate in real terms has been impressive, especially in the decade preceding the 2008 financial crisis (1999–2008). Re-gaining momentum after the negative shock experienced during 2008–2010 as a consequence of the global economic and financial crisis, remittance flows to developing countries reached an estimated $401 billion in 2012 (+5.3 percent compared with 2011: World Bank, 2013a) and are expected to increase by 6.3 percent to reach $414 billion in 2013 (World Bank, 2013b).
Compared to foreign direct investments (FDI), remittances proved to be less volatile and more resilient to idiosyncratic shocks of the economic
cycle. Indeed, remittances remained remarkably stable in the wake of the recent financial crisis, compared to other types of international financial flows (World Bank, 2011). Moreover, compared to official development assistance, which repre-sents all financial flows provided by national and multilateral official agencies in order to promote economic development and welfare of develop-ing countries, remittances seem to have a more direct impact in fighting poverty and promoting social development at the household level (see for example de Haas, 2007).
The possible risks of imbalances in the exchange rate, due to a non-negligible inflow of foreign currencies (US dollars and euro, above all) in receiving countries, have proved to be serious only in very few cases (El Salvador and Moldavia, see Ratha, 2007). Still receiving countries should avoid becoming excessively dependent upon remittances since significant annual variations in inflows are fairly common at the country level.
FIGURE 1: International financial flows, 1990–2016
0
100
200
300
400
500
600
700
1990
1991
1992
1993
1994
1995
1996
1997
1998
1999
2000
2001
2002
2003
2004
2005
2006
2007
2008
2009
2010
2011
2012
2013
e
2014
f
2015
f
2016
f
ODA
Pvt debt &portfolio equity
RemittancesFDI
US$ billion
Source: World Bank, 2013b:2
8974-Chapter2.pdf 38974-Chapter2.pdf 3 5/8/14 2:57 PM5/8/14 2:57 PM

4 GREENBACK 2.0 REPORT 2014
Many important issues are related to the study of remittance flows and of migrants’ behavior in sending money to their households and countries of origin. International development institutions, academics and policy makers have progressively integrated migration and remittances into the development discourses, policies and programs. Motivations behind remittances have been deeply investigated (see for example Rapoport and Doc-quier, 2005) as well as the extent to which remit-tances affect recipient households’ wellbeing, investment and consumption levels in the receiv-ing countries all play an insurance role against external shocks. Also the study of remittances may shed some lights on intra-household resource allocation, disentangling preferences and behav-iors of migrants and individual household mem-bers that receive the money (Yang, 2011).
Both receiving and sending countries play a role in building an appropriate and transparent framework to manage remittance flows in the most efficient and productive way at the macro as well as at the micro (household) level. In this respect, immigration countries can act on regula-tion of remittances service providers (RSP) and channels in order to facilitate access to formal and transparent services for remitters, to dimin-ish costs and inefficiencies and to lower the
interconnections between informal systems and international criminal activities (money launder-ing, terrorism, etc.; World Bank, 2013b). Types of RSP and channels differ a lot in terms of transfers’ speed, distribution of agencies in both sending and receiving countries, administrative burdens and costs. The issue of sending costs is one of the most debated at the international level (Yang, 2011; Gibson et al, 2006) and one where the mul-tilateral action taken by the World Bank and other organizations with private actors is more effec-tive. Field studies have shown that terms and con-ditions of remittances services are too often not fully and easily available to senders, who might not be able to perceive all the components of the final cost and to then choose the more appropri-ate RSP for their needs (World Bank, 2007). The structure and accessibility of the remittance mar-ket is also strictly connected to the wider issue of migrants’ financial inclusion.
Italy and Piedmont: a context of severe and protracted economic crisisOur empirical investigation has been conducted in a context of severe and protracted economic crisis in Italy, which since 2008 has dramatically
FIGURE 2: Foreign resident population and remittances in Italy, 2005–2012
3,000
3,500
4,000
4,500
5,000
5,500
6,000
6,500
7,000
7,500
8,000
2.0
2.5
3.0
3.5
4.0
4.5
5.0
2005 2006 2007 2008 2009 2010 2011 2012
Foreign resident population,* millions Remittance outflows, millions of € (right axis)
Source: Istat and Bank of Italy.
*Break in series in 2011: from 2012 data are adjusted for new Census data.
8974-Chapter2.pdf 48974-Chapter2.pdf 4 5/8/14 2:57 PM5/8/14 2:57 PM

INTERNATIONAL REMITTANCES AND THE ECONOMIC CRISIS: THE CONTEXT OF THE SURVEY 5
affected both the native and the immigrant popu-lation. Immigrant workers are often deemed to suffer more in terms of employment and income reduction than Italian workers because of their relatively weaker contractual position, their lower education level, their concentration in highly pro-cyclical economic sectors such as manufacturing and the construction industry (among the more recent contributions on this issue, see Fondazione Leone Moressa, 2013; Pastore et al, 2013; Bonifazi and Marini, 2013; Ministero del Lavoro, 2013; but also Ricucci, 2011).
Data on remittance outflows confirm the nega-tive economic conditions of migrants residing in Italy. Differing from the global trend, remit-tances from Italy showed a sensible decline in 2011–2012, with the overall amount sent in 2012 close to the level of 2009. Official data provided by the Bank of Italy on MTOs, banks, Poste Ital-iane, and other financial institutions (Fondazione Moressa, 2013:111–112), show that the decrease in the total remittance volume is due more to the decrease in the number of remitting migrants than to the decrease in the amount sent by each of them (on average, 1673 € per year in 2012). The decrease in the number of remitting migrants and in the total outflows from Italy is even more
striking if one considers that the total migrant population residing in the country kept growing, although at a slower pace, also in the last years of economic downturn.
Almost half of the entire remittances flow is sent from only two regions, Lazio and Lombardy. Piedmont represents 4.2 percent of remittances outflows and the Province of Turin is the seventh for volumes after those of Rome, Milan, Naples, Prato, Florence, and Catania. While China alone is the destination of almost 40 percent of all remit-tances sent from Italy, differences at the province level reflect the different composition of migrant population across Italy (see the Annex I-A for more detailed data).
In line with national and local official data, our study confirms the negative trends in income and economic stability for migrants residing in Turin (see Fig. 3). Although there are non-negligible differences among migrant communities, which are mainly driven by their different economic integration and labor market specializations, the average economic conditions are worsening since the outbreak of the economic crisis in 2008 with a sensible impact on remittance behaviors and prospects (Fullin & Reyneri, 2013).
TABLE 1: Remittance outflows, 2007–2012: first 10 Italian provinces (€ thousand)
2007 2008 2009 2010 2011 2012 2011–2012
a.v. a.v. a.v. a.v. a.v. a.v. % % var.
Rome 1,500,353 1,697,718 1,784,703 1,786,274 2,040,017 1,938,168 28.40 –5.00
Milan 824,860 862,825 897,412 941,826 1,031,305 965,969 14.10 –6.30
Naples 170,810 183,887 240,856 225,751 305,707 295,600 4.30 –3.30
Prato 449,739 415,823 485,559 191,699 249,102 208,458 3.10 –16.30
Florence 244,295 254,110 253,728 207,345 233,604 197,194 2.90 –15.60
Catania 50,754 57,736 77,992 93,402 156,095 178,292 2.60 14.20
Turin 180,411 180,361 180,262 180,538 193,321 164,577 2.40 –14.90
Brescia 127,297 132,627 131,617 132,094 152,763 134,645 2.00 –11.90
Genoa 95,313 109,471 116,682 119,319 122,450 110,734 1.60 –9.60
Boulogne 126,135 138,722 130,773 130,700 131,858 108,989 1.60 –17.30
Total 6,039,255 6,376,949 6,747,818 6,572,224 7,394,398 6,833,116 100 –7.60
Source: Own calculations based on Bank of Italy dataset on remittances (last update October 2013).
8974-Chapter2.pdf 58974-Chapter2.pdf 5 5/8/14 2:57 PM5/8/14 2:57 PM
6 GREENBACK 2.0 REPORT 2014
TABLE 2: First three countries of destination in 2012, first 10 Italian provinces
1° Row % 2° Row % 3° Row % Tot, %
Rome China 72.6 Philippines 6.0 Romania 5.4 84.0
Milan China 46.1 Philippines 12.5 Peru 7.0 65.6
Naples China 53.9 Ukraine 7.1 Romania 2.7 63.7
Prato China 90.0 Romania 1.6 Morocco 1.5 93.1
Florence China 36.5 Philippines 10.6 Peru 9.5 56.6
Catania China 76.5 Romania 7.9 Sri Lanka 2.2 86.6
Turin Romania 28.2 Peru 10.8 Morocco 8.2 47.2
Brescia China 14.7 India 13.5 Romania 10.6 38.8
Genoa Ecuador 28.1 Romania 9.1 Senegal 6.7 43.9
Boulogne Philippines 15.0 Romania 13.8 China 13.2 42.0
Total China 39.1 Romania 11.9 Philippines 5.4 56.4
Source: Own calculations based on Bank of Italy dataset on remittances (last update October 2013).
FIGURE 3: Remittances from the Province of Turin, 2012, first three destination countries (€ million)
0
10
20
30
40
50
60
2005 2006 2007 2008 2009 2010 2011 2012
Romania Peru Morocco
Source: Own calculations based on Bank of Italy dataset on remittances (last update October 2013).
8974-Chapter2.pdf 68974-Chapter2.pdf 6 5/8/14 2:57 PM5/8/14 2:57 PM

7
THE GREENBACK 2.0 SURVEY: RESEARCH OBJECTIVES AND DATA COLLECTION
7
3
Work plan and survey designAs illustrated in Figure 4, the research was com-posed by three interconnected phases: 1) the research design and the definition of the sample structure, 2) the data collection, registration, and analysis, and 3) the preparation of the final report.
This section presents the main characteristics of the research and survey design, while a more detailed description of the fieldwork, with notes on questionnaire’s definition process, data collec-tion and registration is presented in the Method-ological Note (Annex I).
RESEARCH OBJECTIVES
The main objective of the Study was to explore financial needs and behaviors of migrants resid-ing in the city of Turin, with a focus on patterns of remittances, financial inclusion, and access to banking services in Italy. The survey investigates migrants’ relation with banks, their savings allo-cation in Italy and their origin countries, and the possible changes since the beginning of their
migratory experience in Italy, also highlighting the impact of the economic crisis on remittance flows. In particular, the study aimed at investigating two interconnected dimensions:
• Financial behaviors: remittance sending, consumption and savings, investments in the origin country, insurance and other financial services;
• Financial needs and aspirations in terms of costs, availability, and accessibility to different types of financial products and services, with stronger attention to remittance services.
SAMPLE STRUCTURE DEFINITION
In 2012, the number of foreign citizens residing in the Municipality of Turin was 142,157, represent-ing 16 percent of the total population (Comune di Torino, 20133). According to this data, Romania, Morocco and Peru are the first three countries of origin, representing almost 60 percent of total migrant population. The largest represented immi-grant community is the Romanian community (56,438 individuals, 40 percent of the total immi-grant population), which mostly resides in the 5° District Borgata Vittoria, Le Vallette, Madonna Di Campagna (ibid.). The second largest community is the Moroccan community (20,577 individuals, 14 percent of total migrant population), which is mainly concentrated in the 6° District Barriera di Milano, Falchera, Regio Parco. Peruvians repre-sent around 7 percent of total migrant population (9,569 individuals) and are mostly found in the 3° District Cenisia, Pozzostrada, San Paolo (see Fig. 5).
3 Available figures at the municipality level are not yet adjusted for the new data from the last general Census of 2011. Istat (Italy’s National Institute of Statistics) is currently updating and adjusting population historical data since 2001. See Annex II-A for historical trends in foreign resident population in the Province of Turin by country of origin.
FIGURE 4: The three phases of the research
8974-Chapter3.pdf 78974-Chapter3.pdf 7 5/8/14 2:58 PM5/8/14 2:58 PM

8 GREENBACK 2.0 REPORT 2014
Romania, Peru and Morocco are also the first three destination countries of remittances from the Province of Turin, representing respectively 28.2 percent, 10.8 percent, and 8.2 percent of all outflows (Fondazione Moressa, 2013; Banca d’Italia, 2013). At the same time, these three coun-tries differ in their geographical position, socio-economic condition, and modes of migration to Italy.
For all these reasons, the research focuses on these three nationalities and the sample is con-structed of three equally large subsamples according to the citizenship at birth of the interviewees:
• Subsample 1—Short-range EU: Romania
• Subsample 2—Short-range non-EU: Morocco
• Subsample 3—Long-range: Peru
The total sample size is 480 individuals. The sam-ple is composed of foreign-born individuals resid-ing in the city of Turin at the time of the interview, including naturalized immigrants, from the three selected countries, between 18 and 64 years old.
Each subsample is stratified according to the length of stay in Italy, with around 20 percent of interviewed migrants who have a ‘short’ migra-tory experience (of five years or less) and arrived after 2008. Subsamples are not equally stratified by gender, which has been assumed to be less significant with regard to the survey’s objectives. Nevertheless, the final gender composition offers
an interesting picture of migrant population within each community.
To be included in the sample, the interviewed migrants had to comply with four pre-requisites:
1. to have res ided in Italy for at least one year (with or without a regular residence status);
2. to live in the city of Turin (or in one of the sur-rounding municipalities of the metropolitan area);
3. to have an income (through any type of job or occupation); and
4. to have sent remittances to his/her country of origin at least once since the beginning of 2013.
Sampling method and surveying techniqueAlthough administrative data exist on the dis-tribution of migrant citizens in the city of Turin (e.g. Anagrafe, the Municipal Residence Regis-try), up-to-date data on their structure in terms of employment status and on the presence of irregular residents are scarcely available. Hence, since the reference migrant population is not completely known in advance, a “center sampling technique” has been applied in order to design a balanced sample (Blangiardo, 2004; Blangiardo et al, 2011).
As a preliminary step, a significant and repre-sentative number of “centers” in Turin has been identified: migration association and organiza-tions, places of work, entertainment, health-care and meeting centers, social-informal services etc. From that list of aggregation centers, the sample was defined by applying two basic criteria of the “snowball sampling” (see Annex I for more details on this method):
• no more than 10 contacts/interviews from the same entry point or key informant (reference person);
• no more than five contacts/interviews from an individual already included in the sample.
The survey has been conducted by a team of six interviewers through paper and pencil interviews (PAPI), using printed questionnaires administered face-to-face and lasting about 20–30 minutes each. The questionnaire is structured with closed-ended questions, skips and connected sections.
FIGURE 5: Municipality of Turin: districts
8974-Chapter3.pdf 88974-Chapter3.pdf 8 5/8/14 2:58 PM5/8/14 2:58 PM

9
EMPIRICAL FINDINGS
9
4
The demographic and economic profilesThe average profile of the final sample is reported in Table 3, which includes statistics on gender, age, length of stay in Italy, and education level of the 480 interviewed individuals.
The overall sample is relatively gender-balanced (43 percent of interviewed migrants are women).
Nevertheless at the subsample level, gender dif-ferences are more evident: of the migrants inter-viewed women represented 61 percent of the Romanians, 54 percent of the Peruvians, and only 14 percent of the Moroccans. Indeed, interviewers found it particularly difficult to intercept Moroc-can women complying with the survey criteria, mainly because of the low activity rate of female Moroccans compared to the one of their Peruvian and Romanian counterparts.
TABLE 3: Main characteristics of the sample, by country of origin
Morocco Peru Romania Total
Freq. Col % Freq. Col % Freq. Col % Freq. Col %
Sex Male 136 85.53 74 45.96 62 38.75 272 56.67
Female 23 14.47 87 54.04 98 61.25 208 43.33
Arrival in Italy
Before 2008 128 80.5 117 72.67 121 75.63 366 76.25
After 2008 31 19.5 44 27.33 39 24.38 114 23.75
Age class 18–24 17 10.69 2 1.24 19 11.88 38 7.92
25–29 18 11.32 8 4.97 23 14.38 49 10.21
30–39 69 43.40 63 39.13 56 35.00 188 39.17
40–49 44 27.67 52 32.30 38 23.75 134 27.92
50–59 9 5.66 30 18.63 22 13.75 61 12.71
60+ 2 1.26 6 3.73 2 1.25 10 2.08
Educationlevel
None 6 3.77 0 0.00 0 0.00 6 1.25
Elementary 7 4.40 0 0.00 2 1.25 9 1.88
Lower second 63 39.62 26 16.15 21 13.13 110 22.92
Upper second 58 36.48 95 59.01 94 58.75 247 51.46
Post-sec, non ter. 0 0.00 1 0.62 27 16.88 28 5.83
Short-cycle ter. 1 0.63 1 0.62 0 0.00 2 0.42
Bachelor 11 6.92 10 6.21 9 5.63 30 6.25
Master 13 8.18 28 17.39 7 4.38 48 10.00
Marital status
Married 83 52.2 78 48.45 74 46.25 235 48.96
Separated 8 5.03 14 8.7 6 3.75 28 5.83
Divorced 7 4.4 13 8.07 19 11.88 39 8.13
Widow 1 0.62 2 1.25 3 0.63
Single 56 35.22 34 21.12 32 20.0 122 25.42
Cohabiting 5 3.14 21 13.04 27 16.88 53 11.04
8974-Chapter4.pdf 98974-Chapter4.pdf 9 5/8/14 2:58 PM5/8/14 2:58 PM

10 GREENBACK 2.0 REPORT 2014
Morocco Peru Romania Total
Freq. Col % Freq. Col % Freq. Col % Freq. Col %
Italian citizenship acquisition 15 9.43 10 6.21 3 1.88 28 5.83
By gender M F M F M F M F
Age, avg. 36.6 37.1 42.1 41.1 35.9 38.1 37.9 39.3
Length of stay in Italy, avg. 10.9 10.6 8.8 10.7 9.4 8.6 10.0 9.7
Years of schooling, avg. 10.5 12.4 13.1 13.4 12.5 13.0 11.7 13.1
Total 159 100 161 100 160 100 480 100
* Education levels follow the ISCED international classification (Unesco). The post-secondary non tertiary class includes all vocational or university courses after the high school diploma and which last no more than one year.
TABLE 3: Main characteristics of the sample, by country of origin (continued)
With regard to formal qualifications and compe-tences, the number of migrants with an elemen-tary level of education (or lower) is low for each of the three subsamples, and the average level of education of the sample is relatively high (10 per-cent hold a master’s degree, 7 percent a bachelor degree, 51 percent a high school level degree). Here too, however, differences among the three sub-groups are evident. Peruvians show the highest level of education attained (59 percent with a high school diploma and 17 percent with a master’s degree), closely followed by Roma-nians (59 percent with a high school diploma, 17 percent with a non-university qualification after the high school diploma). Almost 40 percent of Moroccans attained a lower secondary school diploma, while 37 percent an upper secondary diploma. In only 25 percent of cases migrants are sure that their level of education is recognized in Italy, regardless to where it was attained. It is worth noticing that 7 percent of migrants have
achieved their highest education level in Italy and that 35.6 percent of them have attended some sort of professional and/or vocational training courses in Italy, with high variations in terms of length (from one month to two years) and subject of the course (from carpentry to health care, from computer science to cooking).
Almost half of the interviewed migrants are mar-ried. Moroccans have the higher level of single individuals (35 percent), while among Romanians and Peruvians there is a higher incidence of sepa-rated or divorced individuals (respectively 18 per-cent and 16 percent).
At the time of first entry in Italy, one third of the sample had a tourist visa (33.3 percent), one quarter was totally undocumented (25.4 percent), and only a 15.6 percent of the sample had a visa for work reasons (see Table 4).
TABLE 4: Documents at the time of first entry in Italy
Morocco Peru Romania Total
Freq. % Freq. % Freq. % Freq. %
Visa—work 35 22.01 30 18.63 10 6.25 75 15.63
Visa—student 9 5.66 1 0.62 2 1.25 12 2.50
Visa—family reasons 19 11.95 19 11.80 2 1.25 40 8.33
Visa—tourism 26 16.35 65 40.37 68 42.50 159 33.13
Visa—not needed 8 5.03 1 0.62 53 33.13 62 12.92
Visa—other* 1 0.63 2 1.24 3 1.88 6 1.25
Undocumented 59 37.11 43 26.71 20 12.50 122 25.42
Do not answer 2 1.26 0 0.00 2 1.25 4 0.83
Total 159 100 161 100 160 100 480 100
* Other type of visas includes: religious, professional exchange, and visa released by another EU Member State.
8974-Chapter4.pdf 108974-Chapter4.pdf 10 5/8/14 2:58 PM5/8/14 2:58 PM

EMPIRICAL FINDINGS 11
As for the legal status, 25 percent of the inter-viewees declared they were undocumented at the time of their arrival in Italy, while in 2013 only 7.5 percent of them (all among Moroccans) are without a regular permit of stay. These figures are in line with the migration policy and regula-tion prevalent in Italy in the last two decades (Salis, 2012; Reyneri, 2007), which have progres-sively restricted regular possibilities of entering the country to work and have at the same time allowed more than 1.6 million foreign individuals to regularize their legal status through succes-sive amnesties between 1986 and 2009 (IDOS, 2013: 119).
Probably because of their longer length of stay in Italy, the highest share of EU long-term residence permits is found among Moroccans (27 percent of them), who also present the high-est rate of citizenship acquisition (9 percent of the subsample). The vast majority of Peruvians hold a renewable residence permit linked to their job position (75 percent of them), while Roma-nians no longer need a permit to stay or reside in Italy after the accession to the EU in 2007. Romanians also seem to be less interested in the naturalization processes.
Table 5 and subsequent figures present the com-position of migrants’ families. Interviewees were asked to list all their first grade relatives (parents, siblings, partners and children), residing in Italy, in their origin country or elsewhere.
Moroccan and Peruvian families are larger, on average, than Romanian ones. Among those with children, the vast majority reside with them: the number of children left in the country of origin is quite low among Moroccan migrants (24.3 per-cent) and slightly higher for Peruvians (39.8 per-cent) and Romanians (31.7 percent).
JOB TYPE, OCCUPATION, AND SECTORS
All migrants included in the sample and inter-viewed were employed, in order to ensure that they had control over economic resources in rela-tion to remittance decisions. This section briefly presents the job position, the prevalent sector of occupation and the distribution of earnings of the sample.
Migrants were asked to describe their main job or occupation, the one they consider the most important in terms of hours, earnings or stabil-ity, without prejudice for informal occupations,
FIGURE 6: Transitions in legal status, between the initial period of residence in Italy and 2013
The figure represents transition in legal status from “initial period of residence” (spell 1) to 2013 (spell 2), in absolute values by country of origin. All possible conditions—types of permit to stay, documents or reasons for the lack of them—were considered. The category “Not needed” includes migrants entered when Italy’s immigration law did not require a permit to stay, and European citizens (mostly Romanians after 2007). The “999” indicates the very low share of migrants which refused to answer.
TABLE 5: Average number of relatives, by country of residence
Total
In the Origin
Country In ItalyIn Other
Countries
Morocco 7.00 4.72 2.16 0.27
Peru 6.92 4.24 2.45 0.21
Romania 4.58 2.38 2.06 0.16
8974-Chapter4.pdf 118974-Chapter4.pdf 11 5/8/14 2:58 PM5/8/14 2:58 PM

12 GREENBACK 2.0 REPORT 2014
FIGURE 7: Distribution by number of relatives residing in the country of origin
23.4
32.3
17.7
3.21.9
0
5
10
15
20
25
30
35
400
1–2
3–4
5–6
7–8
9–10
11+
Morocco Peru Romania
15.8
5.7
32.3
25.5
10.6
5.0
1.20
1–2
3–4
5–6
7–8
9–10
11+
20.5
5.0
34.6
6.3
2.50.6 0.0
0
1–2
3–4
5–6
7–8
9–10
11+
39.6
16.4
FIGURE 8: Distribution by number of children left in the country of origin (percent of those with children)
9.55.4
9.5
0
10
20
30
40
50
60
70
80
0 1 2 3+
Morocco Peru Romania
75.7
0 1 2 3+ 0 1 2 3+
15.717.6
6.5
60.2
13.9 13.9
4.0
68.3
non-regular jobs etc. Table 6 presents the dis-tribution of job types among migrants, who specified if the arrangement included a formal, written contract or not. Among dependent work-ers, 12 percent of those who arrived before 2008, and 21 percent of those that arrived after 2008, declared to work without a regular contract. The majority of them declared to work as domestic workers (both health care and domestic ser-vices) or in the food service (restaurants, small ethnic food shops). The lack of regular contrac-tual arrangements is higher among autonomous
workers (27.5 percent and 58.3 percent respec-tively among those arrived before and after 2008), although they represent less than a quar-ter of the total sample. In particular, small retailers and peddlers in outdoor markets often state to be non-regular.
Interviewees tended to declare the official num-ber of hours worked per week, as stated in the contract or in the agreement with the employer. However, while many of them reported to work part-time (less than 40 hours per week), they
8974-Chapter4.pdf 128974-Chapter4.pdf 12 5/8/14 2:58 PM5/8/14 2:58 PM

EMPIRICAL FINDINGS 13
also admitted to working more than the official number of hours, where the difference is paid outside the contract, with no fiscal contributions or taxes paid for them. Moreover, 19 percent of the sample stated to have one or more second jobs in addition to the one described in detail. Hence, the total amount of hours worked as presented in Figure 9 and the overall level of irregular work is surely underestimated.
Following the official classification of profes-sions provided by ISTAT, which distinguishes jobs in terms of their content (tasks, responsibili-ties) and their level of qualification, a “gendered”
specialization seems to apply to each of the three subsamples. Indeed, roughly half of the inter-viewed women tend to be classified as qualified workers in trade and services, a category which comprises also qualified health workers. Men seem to be more represented in the productive sectors as industrial workers and farmers (66 per-cent of Romanian males, 30 percent of Moroccan males). High percentages of Moroccans and Peru-vians, both males and females, are employed as non-qualified workers in occupations within the service and the productive sector, which do not require any kind of specific skills or qualifications (around 30 percent and 50 percent respectively).
TABLE 6: Job distribution by type of contract for those arrived before and after 2008
Before 2008 After 2008
Contract Contract
No Yes Total Tot % No Yes Total Tot %
Dependent 46 232 278 76.0 24 76 100 87.7
Co.co.co/project worker 6 6 1.6
Occasional 4 5 9 2.5 1 1 0.9
Autonomous—employer 6 6 1.6 2 2 1.8
Autonomous—P.IVA* 2 16 18 4.9
Autonomous—own 13 18 31 8.5 6 2 8 7.0
Autonomous—family firm 1 1 0.3 1 1 0.9
Autonomous—coop. member 2 2 0.5
Coop. member & employee 15 15 4.1 2 2 1.8
Total 66 300 366 100 32 82 114 100
Total percent row 18.0 82.0 100 28.1 71.9 100
*Partita IVA is the Italian VAT identification number, assigned to firms and autonomous workers for value added tax purposes.
FIGURE 9: Hours worked per week (percent)
0
5.83
9.79
16.88
39.38
14.79
7.50 5.835
10
15
20
25
30
35
40
45
Hours Per Week Worked (Percent)
0–10
11–2
0
21–3
0
31–4
0
41–5
0
51–6
0
61–1
00
8974-Chapter4.pdf 138974-Chapter4.pdf 13 5/8/14 2:58 PM5/8/14 2:58 PM

14 GREENBACK 2.0 REPORT 2014
The distribution of our sample by sector of employment is consistent with the latest available data on the migrant workforce in Italy (Ministero del Lavoro, 2013). The service industry employs more than half of all interviewed migrants, with a strong predominance in health care services (28 percent), followed by services for which
families are the direct employers (12 percent: housekeeping, elderly and children domestic care etc.), and hospitality and catering (9 percent: restaurants, hotels, ethnic food shops etc.). Manu-facturing and construction represent, respectively, 11 percent and 12 percent of total employment in the sample. Although not shown here in detail,
TABLE 7: Distribution by type of occupation*, by gender
Morocco Peru Romania Total
M F M F M F M F
Freq % Freq % Freq % Freq % Freq % Freq % Freq % Freq %
High professionals** 8 6.0 3 13.0 2 2.7 6 6.9 6 9.7 9 9.2 16 5.9 18 8.7
Qualified w. in trade & services*** 33 24.6 12 52.2 22 29.7 36 41.4 4 6.5 50 51.0 59 21.9 98 47.1
Workers & farmers 40 29.9 0 0.0 11 14.9 1 1.1 41 66.1 2 2.0 92 34.1 3 1.4
Drivers of machines & transp. 14 10.4 1 4.3 3 4.1 0 0.0 3 4.8 0 0.0 20 7.4 1 0.5
Non-qualified workers 39 29.1 7 30.4 36 48.6 44 50.6 8 12.9 37 37.8 83 30.7 88 42.3
Total 134 100 23 100 74 100 87 100 62 100 98 100 270 100 208 100
* Occupation categories follow international classifications and ISTAT codes, in the table above at the lowest level of disaggregation (1 digit).
** High professionals include Lawyers & managers, High technicians, High professionals, Executive officers.
*** Qualified workers in trade and services include all qualified workers in trade services (shop keepers, retailers), in catering and accommodation services (cooks, barmen), in health care and social services (nurses, care workers), in cultural and personal services.
FIGURE 10: Sectors of occupation,* percent of total sample
11%
12%
11%
7%
9%
28%
4%
12%
6% Manufacturing
Construction
Trade
Transport
Hospitality & catering
Health care
Other services
Family as employer**
Other***
* Sectors of occupation follow the international classification ATECO 2007–ISTAT.
** It includes all workers whose employer is a family (not a private or public firm). In this category are comprised housekeepers and all domestic workers in general.
*** Residual, it includes: agriculture, electricity prod., science, rental, entertainment, communication and financial services.
8974-Chapter4.pdf 148974-Chapter4.pdf 14 5/8/14 2:58 PM5/8/14 2:58 PM
EMPIRICAL FINDINGS 15
there are significant differences in the gender dis-tribution among specific sectors of employment. Male migrants are concentrated in the construc-tion, manufacturing, and transportation industries, while women are overrepresented in the health care and domestic sector. The composition of the hospitality and catering sector is more gender balanced. The overall and gender distribution of sampled migrants among sectors is also con-sistent with their length of stay and the histori-cal pattern of quotas and amnesties in the last 20 years, which also had an impact in determining the specialization of migrant workforce in the Ital-ian segmented labor market (Ministero del Lavoro, 2013; Salis, 2012; Reyneri, 2007).
INDIVIDUAL INCOME
Table 8 shows individual income averages for the three subsamples disaggregated by gender. On average, Romanians declare the highest individual monthly income (1,295 euro for men, 898 euro
for women), while the lowest individual monthly income is declared by Moroccans (932 euro for men, 815 euro for women). Gender differentials persist even within each of the three subsamples and the total average income gap between men and women is of 168 euro per month.
On average, individual incomes are higher for those who arrived before 2008 than for those who arrived after that year, but among older migrants there is a more widespread distribu-tion of income. A longer migratory experience in Italy is associated with a better integration into the labor market, more mobility and more diver-sification of income careers, while newly arrived migrants had less time and fewer opportunities to improve their earnings and are still clustered around the income class €501–€1000 per month. Newly arrived Moroccans show the highest per-centage of individuals earning less than €500 per month. Moreover, the composition of sampled migrants among types of occupation and sectors of employment helps explain the differentiated impact of the economic crisis across the three subsamples and by genders.
In the majority of cases long-term residents (i.e. those that arrived before 2008) show a decrease in their income since their arrival. Among those who arrived in the past five years (after 2008), trends in monthly income differ across the three communities: Moroccan migrants, mostly men and concentrated in construction and manufactur-ing, declare in 45 percent of cases a decrease in income since their arrival, while income is stable for more than half of the Peruvians (52 percent), who are more represented in the health care and domestic sector. Within the Romanian subsample,
TABLE 8: Individual income (mean, se mean*)
Men Women
Morocco € 931.79 € 815.00
35.66 54.49
Peru € 1,020.00 € 851.78
35.60 37.21
Romania € 1,295.08 € 898.47
54.04 43.73
Total € 1,037.65 € 869.98
25.20 26.56
* The standard error of the mean (SE) is the standard deviation of the sample-mean’s estimate of a population mean. It shows how close to the population mean the sample mean is likely to be. SE is used to calculate the confidence interval of an estimate.
FIGURE 11: Individual income class, by country of origin (percent)
80 60 40 20 0
Entered before 2008
0 20 40 60 80
Morocco
Peru
Romania
Total
Entered after 2008
<500
501–1000
1001–1500
>1501
8974-Chapter4.pdf 158974-Chapter4.pdf 15 5/8/14 2:58 PM5/8/14 2:58 PM
16 GREENBACK 2.0 REPORT 2014
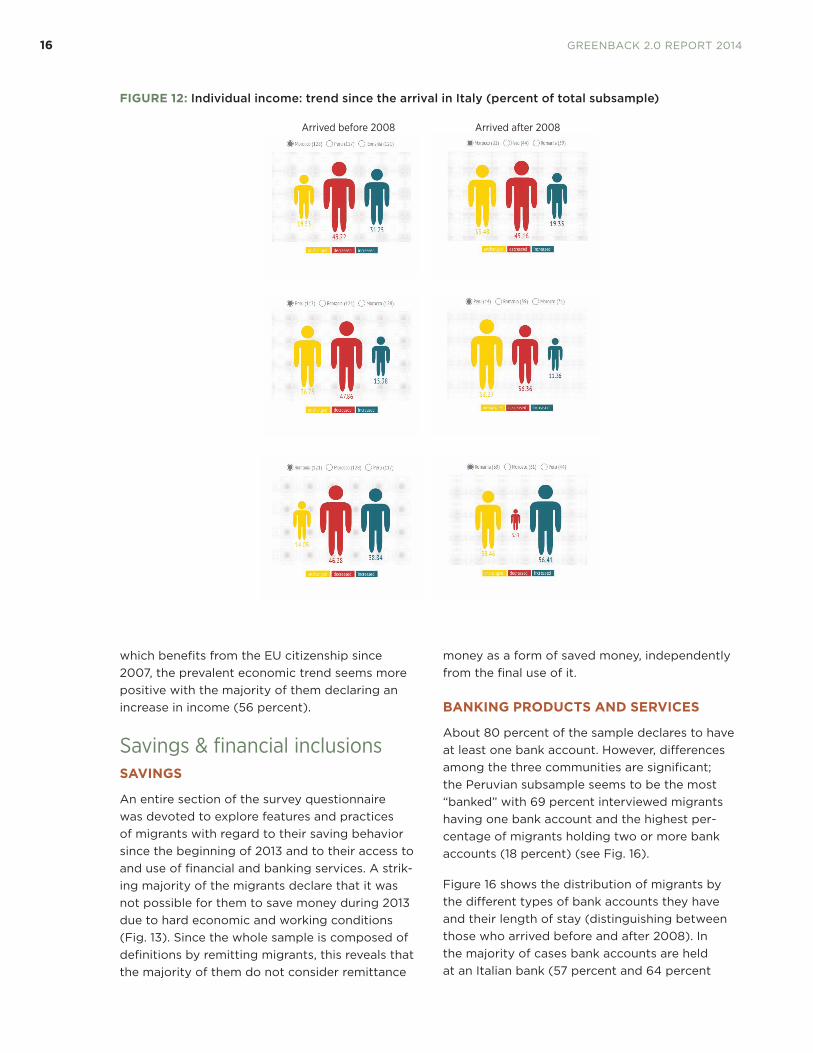
which benefits from the EU citizenship since 2007, the prevalent economic trend seems more positive with the majority of them declaring an increase in income (56 percent).
Savings & financial inclusionsSAVINGS
An entire section of the survey questionnaire was devoted to explore features and practices of migrants with regard to their saving behavior since the beginning of 2013 and to their access to and use of financial and banking services. A strik-ing majority of the migrants declare that it was not possible for them to save money during 2013 due to hard economic and working conditions (Fig. 13). Since the whole sample is composed of definitions by remitting migrants, this reveals that the majority of them do not consider remittance
money as a form of saved money, independently from the final use of it.
BANKING PRODUCTS AND SERVICES
About 80 percent of the sample declares to have at least one bank account. However, differences among the three communities are significant; the Peruvian subsample seems to be the most “banked” with 69 percent interviewed migrants having one bank account and the highest per-centage of migrants holding two or more bank accounts (18 percent) (see Fig. 16).
Figure 16 shows the distribution of migrants by the different types of bank accounts they have and their length of stay (distinguishing between those who arrived before and after 2008). In the majority of cases bank accounts are held at an Italian bank (57 percent and 64 percent
FIGURE 12: Individual income: trend since the arrival in Italy (percent of total subsample)
Arrived before 2008 Arrived after 2008
�
�
�
8974-Chapter4.pdf 168974-Chapter4.pdf 16 5/8/14 2:58 PM5/8/14 2:58 PM

EMPIRICAL FINDINGS 17
FIGURE 13: Could you save since the beginning of 2013? If yes, how much?
81.2518.75
If yes, how much? Average per month, in euro.
0
5
10
15
20
25
30
35
0–100 101–250 251–500 >500
FIGURE 14: Type of savings (percent of those who save)
62.9
1.01.02.1
12.4
2.11.01.0
16.5How do you save?
CC Italy
CC Morocco
CC Romania
CC Romania + Italy
Savings bonds, Italy
Savings bonds, Romania
Treasury bonds, Italy
Savings fund
Other (at home)
8974-Chapter4.pdf 178974-Chapter4.pdf 17 5/8/14 2:58 PM5/8/14 2:58 PM

18 GREENBACK 2.0 REPORT 2014
respectively), but there are also a small number of migrants with two or more accounts (8.7 percent and 10.5 percent), one in Italy and one attached to the country of origin (foreign bank with the agency in Turin or in the country of origin). Among those with a longer period of stay in Italy (more than five years) there is a higher propor-tion (24.6 percent against 14 percent) of migrants without any kind of bank account.
Considering all adults living with the interviewed migrants as a household unit, access to at least
one bank account is even more widespread, although 9.8 percent of all migrants live in a household which is totally non-banked.
Among products and services offered by bank institutions, migrants frequently use the possibility of crediting their salary or wage on the account (52.7 percent), followed by bank transfers (35 per-cent), automatic bill payments (28.8 percent), and online services (18.5 percent)4. About 70 percent of the sample has a debit card, 17.3 percent has a pre-paid card and 10 percent a credit card. Over one-fifth of the sample (22 percent), independent of having a bank account or not, does not possess any kind of card; 28.8 percent use some type of financial product and services.
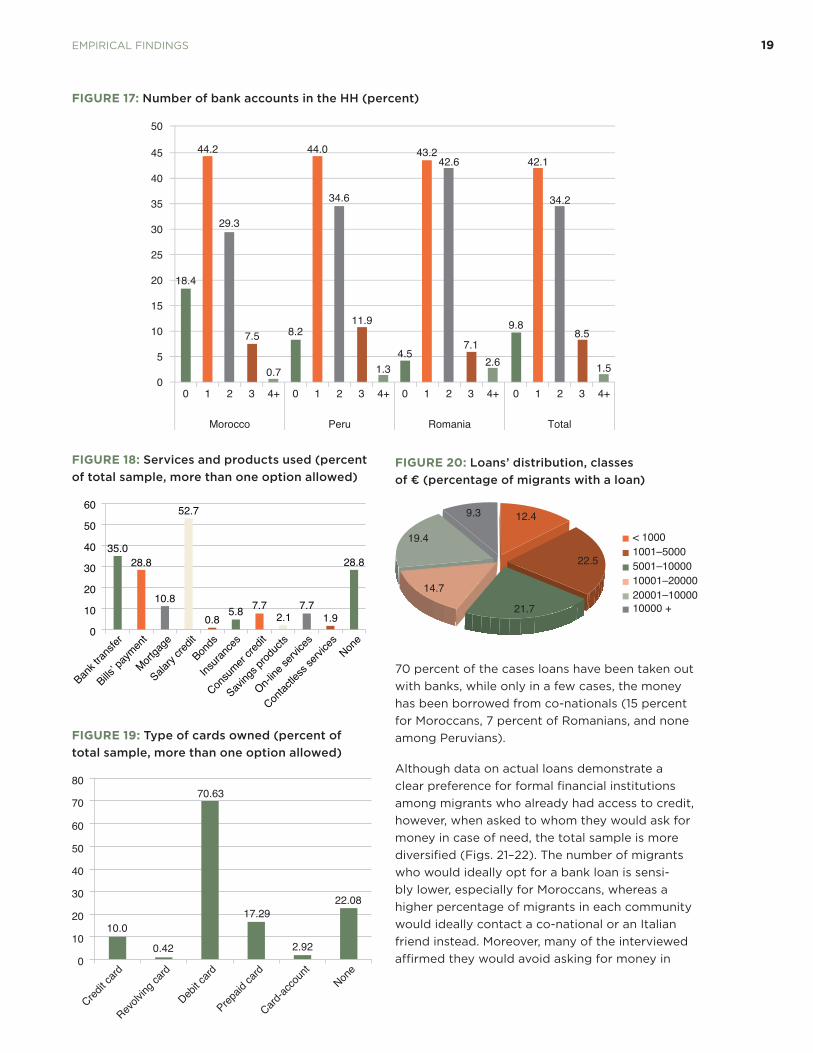
ACCESS TO CREDIT
Figure 20 presents the distribution of loans by classes (in Euro) for the 27 percent of the sample which currently has a loan. More than a half of loans (56.5 percent) are below 10,000 euro, but interestingly 9.3 percent of them are above 100,000 euro, possibly representing mortgage loans for purchasing an apartment. In more than
4 The questionnaire used a broad definition of on-line services, including any type of activity made via internet banking, from checking the move-ments’ list to ordering payments and transfers.
FIGURE 15: Bank account ownership
0%
10%
20%
30%
40%
50%
60%
70%
80%
100%
Morocco Peru Romania
90%
None
One
Two or more
11
111
37
18
112
31
15
107
38
FIGURE 16: Types of bank account (percent of total sample)
0
10
20
30
40
50
60
24.6
57.1
7.91.6
8.714.0
64.0
7.9 3.510.5
Non
e
Ban
k, in
Ital
y
Ban
coP
osta
Ban
k, a
broa
d
Tw
o or
mor
e, It
aly
& a
broa
d
Non
e
Ban
k, in
Ital
y
Ban
coP
osta
Ban
k, a
broa
d
Tw
o or
mor
e, It
aly
& a
broa
d
Before 2008 After 2008
8974-Chapter4.pdf 188974-Chapter4.pdf 18 5/8/14 2:58 PM5/8/14 2:58 PM
EMPIRICAL FINDINGS 19
FIGURE 17: Number of bank accounts in the HH (percent)
00 1 2 3 4+ 0 1 2 3 4+ 0 1 2 3 4+ 0 1 2 3 4+
5
10
15
20
25
30
35
40
50
Morocco Peru Romania Total
45
18.4
44.2
29.3
7.5
0.7
8.2
44.0
34.6
11.9
1.3
4.5
43.242.6
7.1
2.6
9.8
42.1
34.2
8.5
1.5
FIGURE 18: Services and products used (percent of total sample, more than one option allowed)
0
10
20
30
40
50
60
Bank t
rans
fer
Bills’ p
aym
ent
Mor
tgag
e
Salary
cred
it
Bonds
Insu
ranc
es
Consu
mer
cred
it
Saving
s pro
ducts
On-lin
e se
rvice
s
Conta
ctles
s ser
vices
None
35.028.8
52.7
0.8
10.87.7
5.87.7
2.1 1.9
28.8
FIGURE 19: Type of cards owned (percent of total sample, more than one option allowed)
0
10
20
30
40
50
60
70
80
Credit
card
Revolv
ing ca
rd
Debit c
ard
Prepa
id ca
rd
Card-
acco
unt
None
10.0
0.42 2.92
17.29
70.63
22.08
FIGURE 20: Loans’ distribution, classes of € (percentage of migrants with a loan)
< 10001001–50005001–1000010001–2000020001–1000010000 +
9.3
19.4
14.7
21.7
22.5
12.4
70 percent of the cases loans have been taken out with banks, while only in a few cases, the money has been borrowed from co-nationals (15 percent for Moroccans, 7 percent of Romanians, and none among Peruvians).
Although data on actual loans demonstrate a clear preference for formal financial institutions among migrants who already had access to credit, however, when asked to whom they would ask for money in case of need, the total sample is more diversified (Figs. 21–22). The number of migrants who would ideally opt for a bank loan is sensi-bly lower, especially for Moroccans, whereas a higher percentage of migrants in each community would ideally contact a co-national or an Italian friend instead. Moreover, many of the interviewed affirmed they would avoid asking for money in
8974-Chapter4.pdf 198974-Chapter4.pdf 19 5/8/14 2:58 PM5/8/14 2:58 PM

20 GREENBACK 2.0 REPORT 2014
FIGURE 21: To whom did you ask for money? (percent)
0 10 20 30 40 50 60 8070
MA
PE
RO
MA
PE
RO
MA
PE
RO
MA
PE
RO
MA
PE
RO
MA
PE
RO
MA
PE
ROItalia
nsC
o-N
atio
nals
Mic
roC
redi
tC
onsu
mer
Cre
dit
Ban
coP
osta
Oth
erF
inan
cial
Inst
.
Ban
k
FIGURE 22: In case you will need a loan, to whom would you ask?
0 10 20 30 40 50
MAPEROMAPEROMAPEROMAPERO
MAPEROMAPEROMAPEROC
onsu
mer
Cre
dit
Oth
erF
inan
cial
Inst
.
Ban
coP
osta
MAPEROMAPEROMAPERO
Don
’tK
now
Em
ploy
erM
icro
Cre
dit
Ban
kIta
lian
Frie
nds
Co-
Nat
iona
lsT
oN
obod
y
8974-Chapter4.pdf 208974-Chapter4.pdf 20 5/8/14 2:58 PM5/8/14 2:58 PM

EMPIRICAL FINDINGS 21
any case because they are uncomfortable with the idea of being indebted (31 percent of Moroccans, 15 percent of Peruvians and Romanians) and they fear this possibility.
MICROCREDIT
To complete the picture on migrants’ financial inclusion and access to credit, it is interesting that interviewed migrants do not seem to consider microfinance and microcredit services5 as valu-able options for accessing financial resources with requirements and criteria different from those of banks, even though official data for Italy and for the Province of Turin show an increase of micro-credit service providers. Only slightly more than three percent of the total sample has ever con-tacted a microcredit agency (Fig. 23), preferring instead the more favorable conditions (no need
5 Microcredit is defined as a financial instrument designed for individuals who are not eligible for traditional banks’ loans since they lack real collater-als or because of their negative historic records within the banking system. The European Commission defines as “micro” a credit that is below the threshold of €10,000 for individual and family reasons, €25,000 for entre-preneurial activities. See: http://ec.europa.eu/enterprise/policies/finance/borrowing/microcredit/
of collaterals) and the impossibility of getting a bank loan.
Remittance behaviors: flows and recipients, operator and costsMAIN RECIPIENTS AND MOTIVATIONS
Sending money to the origin country is a transna-tional activity, which typically characterizes the migration experience. The analysis of remittance transfers helps understand the level and depth of migrants’ labor market integration at destination and of their connection with the origin house-holds, which directly influence the frequency, amount, and regularity of flows.
Interviewed migrants have been asked to describe all flows of remittances they send to recipients, each with its specific characteristics in terms of amount, frequency, channels, and cost. For this reason, the number of recorded flows is higher than the number of interviews.
Recipients are defined as the individuals who materially receive the money. As such they do not necessarily coincide with beneficiaries, as the recipient may use the money to benefit a third person. This is the case, for example, of children of minor age left in the country of origin, who are not directly receiving the money, but can benefit from remittances sent to other relatives.
For each of the three communities the majority of remittance flows is addressed towards parents: 60 percent of flows sent by Moroccan migrants, almost 57 percent of those sent by Peruvians,
FIGURE 23: Have you ever heard about microcredit? If yes, did you ever address a microcredit agency?
No66%
Yes34%
Yes10%
No90%
TABLE 9: To whom do you send money? Remittance recipients, percent of total flows
Morocco Peru Romania Total
Freq. % Freq. % Freq. % Freq. %
Parents 138 60.26 105 56.76 95 46.34 338 54.60
Siblings 62 27.07 29 15.68 39 19.02 130 21.00
Partner 10 4.37 14 7.57 12 5.85 36 5.82
Children 2 0.87 19 10.27 19 9.27 40 6.46
Other relatives 10 4.37 13 7.03 18 8.78 41 6.62
Partner’s relatives 3 1.31 5 2.7 17 8.29 25 4.04
Friends 4 1.75 0 0 5 2.44 9 1.45
Total 229 100 185 100 205 100 619 100
8974-Chapter4.pdf 218974-Chapter4.pdf 21 5/8/14 2:58 PM5/8/14 2:58 PM

22 GREENBACK 2.0 REPORT 2014
and 46 percent of those sent by Romanians are directed to one of the parents or both. Also sib-lings receive a high share of total flows, especially in the case of Moroccans (27 percent from respec-tively Moroccans, 16 percent from Peruvians, and 19 percent from Romanians).
More divergence among the three communities is found on flows addressed to children: while 10 percent of total flows sent by Peruvians and 9 percent of flows sent by Romanians is directed to their children, this type of flows is almost non-existent among Moroccans (0.9 percent). Roma-nians show the highest share of flows addressed to their partner’s relatives (8 percent): this could be explained by the higher proportion of women among Romanians, which could have a higher propensity to send money to their parents-in-law than men. Remittances directed to friends and acquaintances mainly represent flows for the repayment of a debt incurred with someone outside the family. Although parents receive flows more often in all the three sub-samples, total annual flows directed towards members of the nuclear family (partner, chil-dren) are higher on average in comparison with flows directed towards other relatives (parents, siblings, others).
Data on remittance recipients and on the size of flows by recipient seem coherent with the aver-age family size in the three origin countries (with extended families more frequent in Morocco and Peru than in Romania) and with the average length of stay of the three selected subsamples. Moroccans have a longer migration history in Italy and specifically in Turin, to which is associated a more complete process of family reunification at
least for nuclear family members (children and partner, often a female one). The relatively high share of flows directed to children left behind in Peru and Romania can be explained by a shorter migration experience in Italy of the two com-munities and also by the prevalence in the two subsamples of female migrants, who are often employed in the domestic service and care sector and for which it might be more difficult to fulfil bureaucratic requisites for a reunification with children. As for Romania moreover, the free move-ment within the European Union borders makes contacts with the family left in the origin country relatively easier, diminishing the frequency of reunifications at destination.
The analysis of recipients is strictly connected with the motivations behind the decision to remit. Different motivations can be clustered around some distinct categories according to the actual use of money and to the nature of relationships that remittances contribute to maintain (Rapoport and Docquier, 2005). Altruism, compensation for past services, insurance, intra-family loan repay-ment, strategic investment, and savings are all possible motivations and can operate simultane-ously. Quantifying the relative importance of dif-ferent reasons and purposes has proved to be a challenging empirical exercise (Yang, 2011) and many social scientists only focused on the study of remittance impact on recipients both at the household and at a country level (de Haas, 2007; Castagnone et al, 2013).
Our study can only analyze senders’ motivations behind remittances without exploring the impor-tant issue of the control of money by the receivers (Ashraf et al, 2011), since we do not have parallel
TABLE 10: Average amount sent per year, by recipient
Mean Std. Dev. N. flows Min Max
Partner € 2,711.11 2057.67 36 100 �7200
Children € 2,356.88 1916.45 40 100 �8400
Partner’s relatives € 1,452.83 1513.86 23 100 �5640
Parents € 1,445.93 1593.59 333 �50 14400
Siblings € 960.16 1525.31 127 �50 12000
Other relative € 806.25 802.58 40 �50 �3600
Friends € 611.11 716.67 9 100 �2400
Total € 1,425.12 1648.98 608 �50 14400
8974-Chapter4.pdf 228974-Chapter4.pdf 22 5/8/14 2:58 PM5/8/14 2:58 PM

EMPIRICAL FINDINGS 23
information from recipients in origin countries. In the vast majority of cases, the money serves for increasing the level of consumption of receivers—food expenditures, health care services especially for the elderly, unspecified general expenditures also connected with specific lifetime events—and for supporting the education of children. In 20 percent of cases flows were directed to sup-port relatives in case of idiosyncratic (individual) emergencies and covariate (aggregated) shocks in the origin area. Housing expenditures (improve-ment and maintenance of a property) and invest-ments in new assets seem to be important for 10.4 percent and 6.9 percent of flows respectively.
CHANNELS AND REMITTANCE
SERVICE PROVIDERS
Italian regulation of remittance market is based upon the EU Directive 2007/64/CE, which is aimed at protecting clients and regulating opera-tors through more competition and transparency (Fondazione Moressa, 2013: 109). With the Law Decree 27 January 2010, payment and financial institutions are allowed to operate as sending channels through new instruments (bank trans-fers, debt and credit cards, etc.). Among newly regulated remittances service providers, money transfer operators (MTOs) are those with the high-est share of the Italian market (Bank of Italy, 2013) as well as in the majority of Western countries,
offering a very widespread distribution of agen-cies and operators also in rural areas of origin countries and highly competitive services in terms of transfer speed.
The prevalence of MTOs on all other RSPs is con-firmed by our empirical data (Fig. 25), where bank transfers, card transactions, and hand- carried cash transfers represent together less than one fifth of total recorded flows. Transaction via twin cards, prepaid cards, and account to cash6 represent a very small proportion of total flows (2 percent).
Peruvian migrants use almost exclusively (99 per-cent of flows) a money transfer operator, while a more diversified choice is made by Moroccans and Romanians, who also use hand-carried cash trans-fers (10.5 percent and 18.5 percent respectively) and bank transfers (4 percent and 12.7 percent).
Among private non-financial operators for cash transfers by hand, migrants are more likely to choose relatives or friends than transport
6 Twin cards are two cards connected, one used in Italy to send money and the other at the destination to receive it. Prepaid cards are cards that can be used at destination and recharged from a bank or post office in Italy. The account to cash allows sending money from a bank account in Italy to a partner agency/bank at destination. The recipient will be able to get his money in cash. Some MTOs offer a service called “mobile account to cash”, through which customers with a bank account can send money through their mobile phone to an MTO agency where recipients receive money in cash.
FIGURE 24: What is the money sent used for (percent more than one answer allowed)
0
10
20
30
40
50
60
70
80
9080.4
49.4
24.0 21.5 20.2
10.46.9
3.5 2.7 2.3
Food
Health
Educa
tion
Gener
al Con
sum
p.
Emer
genc
ies
Housin
g
Inves
tmen
ts
Saving
s
Trans
port
Debt r
epay
men
t
8974-Chapter4.pdf 238974-Chapter4.pdf 23 5/8/14 2:58 PM5/8/14 2:58 PM

24 GREENBACK 2.0 REPORT 2014
agencies. Among banks, Unicredit is the most fre-quently used (43.5 percent of flows via bank oper-ators), but many other Italian and foreign banks, often linked to the origin countries of migrants, are used in a large number of cases (Banque Chaabi du Maroc, Cec Bank, Attijariwafabank).
As for MTOs, Western Union is the most frequent choice (53 percent of flows via MTO), followed by Ria (16 percent), and MoneyGram (9 per-cent). Nevertheless, there is a high variability and migrants often use operators that have a clear regional or local connotation. Chavin, a money transfer operator for Peru, represents alone 7 per-cent of flows via MTO, followed by Smith&Smith (Romania), Flouss Express (Morocco), and others.
Interestingly, one-third of the interviewees have changed type of channels or operators since the
beginning of their migratory experience in Italy. Among those who changed, 42 percent used to use a MTO, 20 percent sent money via bank trans-fer and 7 percent used the post office (almost the only available option until about 20 years ago). About 14 percent of them state to have always used a MTO, but to have changed opera-tor according to costs and services offered. In the majority of cases, migrants moved from West-ern Union (historically, the first MTO available) to another operator more specialized in sending money to their country of origin.
As reported in Figure 28, the vast majority of transactions, regardless of the specific channel used, take place at a dedicated agency. Among those who use a non-financial intermediary for a cash to cash transfer, the money is more
TABLE 11: Number and share of flows per channel, by country
Morocco Peru Romania Total
Freq. % Freq. % Freq. % Freq. %
Money transfer 190 �82.97 184 �99.46 135 �65.85 509 �82.23
Hand-carried cash to cash �24 �10.48 ��1 ��0.54 �38 �18.54 �63 �10.18
Bank transfer ��9 ��3.93 ��0 ��0.00 �26 �12.68 �35 ��5.65
Prepaid card ��2 ��0.87 ��0 ��0.00 ��5 ��2.44 ��7 ��1.13
Count to cash ��4 ��1.75 ��0 ��0.00 ��0 ��0.00 ��4 ��0.65
Twin cards ��0 ��0.00 ��0 ��0.00 ��1 ��0.49 ��1 ��0.16
Total 229 100 185 100 205 100 619 100
FIGURE 25: Types of channel used to send remittances (percent of total flows)
0.20.7
1.1
5.69.8
82.7
Twin cards
Count to cash
Prepaid card
Bank transfer
Hand-carried cash to cash
Money Transfer
8974-Chapter4.pdf 248974-Chapter4.pdf 24 5/8/14 2:58 PM5/8/14 2:58 PM

EMPIRICAL FINDINGS 25
frequently put in the hands of a relative or a friend rather than using a private transport firm or a generic private intermediary.7
7 Some travel agencies offer to transport not only passengers and their luggage but also packages alone within which migrants usually send mate-rial objects and money. “Private intermediaries” is used here to generically refer to individuals who physically put the money directly into the hands of the receivers at the destination.
The choice of the channel and service provider depends on many different variables. Both the sender’s context (existence and accessibility of agencies, opening hours, convenience and ease of transactions, etc.) and the circumstances of recipients and their area of residence (availability of agencies, opening hours, easiness to access for
FIGURE 26: Operator used, by type (percent of total flows)
0
5
10
15
20
25
30
35
40
45
5.8 4.00.7 0.3
5.53.0
43.0
5.8
12.8
7.6
0.8
8.0
1.3 1.5
Friend
Inte
rmedia
ry
Tra
sport
agencie
s
Italia
n b
ank, lo
cal
Italia
n b
ank, national*
Fore
ign b
ank
Weste
rnU
nio
n
WU
+O
thers
**
Ria
MoneyG
ram
MoneyT
ransfe
r
Peru
's M
TO
Moro
cco's
MT
O
Rom
ania
's M
TO
Private operator Bank operator Money transfer operator
* Include Poste Italiane.
** In almost five percent of cases, migrants declared to use—for the same flow (same amount, same frequency, same recipient)—Western Union or another MTO specialized for a specific destination country (Flouss, Valuetransh, Smith&Smith). The choice depends from time to time on where the MTO agencies are located in the city and on the presence of temporary offers and promotions.
FIGURE 27: Bank operators (percent of total bank operators used)
0
5
10
15
20
25
30
35
40
45
9.8
2.0 2.0
39.2
7.8
3.92.0 2.0
9.8 9.85.9
3.9 2.0
Poste
lItlia
ne
Bancs d
’ A
lba
Banca P
op. di N
ovara
Unic
redit
Banca I
nte
sa
BN
L
Bark
ley’s
ING
Ba
nque C
haabi (M
A)
Cec B
ank (
RO
)
Attija
riw
afa
bank (
MA
)
Raiffe
isen b
ank (
RO
)
BM
CE
Bank (
MA
)
Italian European Origin Countries
8974-Chapter4.pdf 258974-Chapter4.pdf 25 5/8/14 2:58 PM5/8/14 2:58 PM

26 GREENBACK 2.0 REPORT 2014
recipients, additional costs, etc.) may influence the final choice in terms of RSP, amount and fre-quency of the flows.
Faster transactions—through which the money can be available at the destination within the hour—are those made via MTO or pre-paid card,
while bank transfers are generally slower and the hand-carried cash transfer often implies no pre-determined delivery time.
The word-of-mouth among friends and acquain-tances appears to influence the final decision more than any other factor; local or national
FIGURE 28: Where the transaction took place? (percent of total flows)
0
10
20
30
40
50
60
70
80 77.7
1.1 3.6 3.14.4
3.76.5
Agenc
y (ba
nk, M
TO)
Post o
ffice
Toba
cco
shop
Inte
rnet
Call ce
nter
Via an
inte
rmed
iary
Via a
relat
ive/fr
iend
FIGURE 29: How long does it take for the money to be available at destination? (percent by channel)
0 10 20 30 40 50 60 70
<1hsame day
1day2days
3–5days6days+
<1hsame day
1day2days
6days+<1h
same day1day<1h
same day1day
2days3–5days
not preset
Ban
k tr
ansf
erM
oney
tr
ansf
erP
repa
id
card
Han
d-ca
rrie
d ca
sh to
cas
h
8974-Chapter4.pdf 268974-Chapter4.pdf 26 5/8/14 2:58 PM5/8/14 2:58 PM
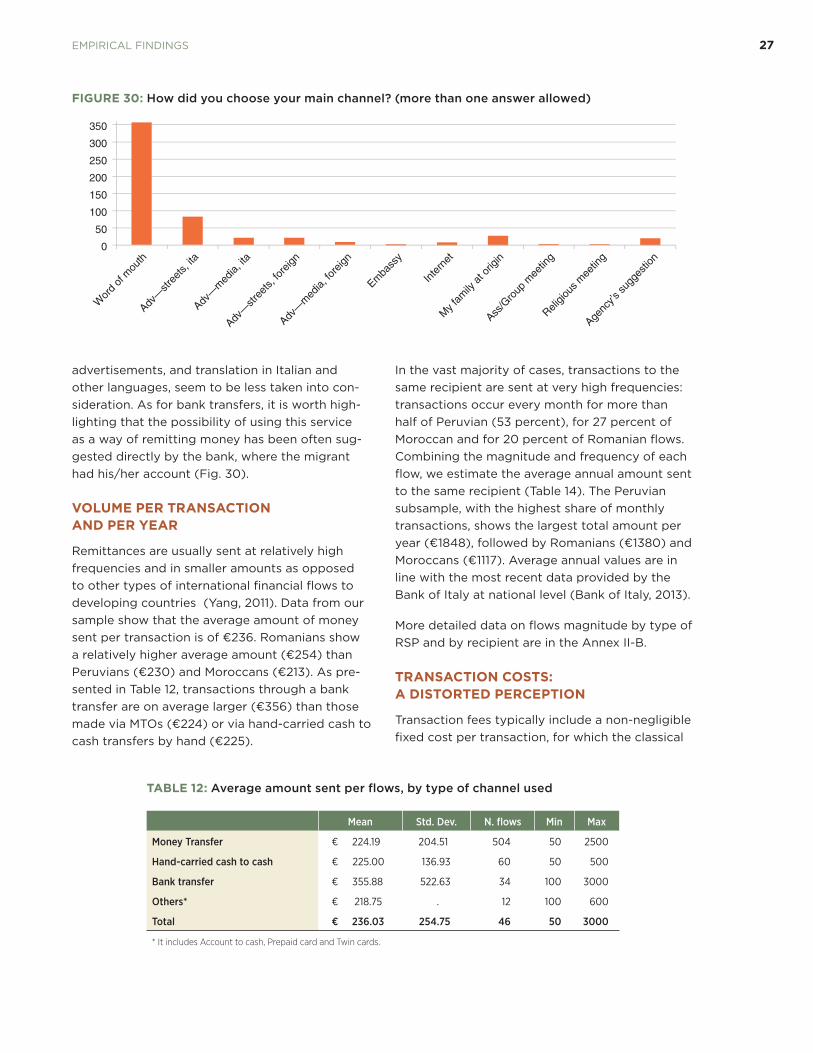
EMPIRICAL FINDINGS 27
advertisements, and translation in Italian and other languages, seem to be less taken into con-sideration. As for bank transfers, it is worth high-lighting that the possibility of using this service as a way of remitting money has been often sug-gested directly by the bank, where the migrant had his/her account (Fig. 30).
VOLUME PER TRANSACTION
AND PER YEAR
Remittances are usually sent at relatively high frequencies and in smaller amounts as opposed to other types of international financial flows to developing countries (Yang, 2011). Data from our sample show that the average amount of money sent per transaction is of €236. Romanians show a relatively higher average amount (€254) than Peruvians (€230) and Moroccans (€213). As pre-sented in Table 12, transactions through a bank transfer are on average larger (€356) than those made via MTOs (€224) or via hand-carried cash to cash transfers by hand (€225).
In the vast majority of cases, transactions to the same recipient are sent at very high frequencies: transactions occur every month for more than half of Peruvian (53 percent), for 27 percent of Moroccan and for 20 percent of Romanian flows. Combining the magnitude and frequency of each flow, we estimate the average annual amount sent to the same recipient (Table 14). The Peruvian subsample, with the highest share of monthly transactions, shows the largest total amount per year (€1848), followed by Romanians (€1380) and Moroccans (€1117). Average annual values are in line with the most recent data provided by the Bank of Italy at national level (Bank of Italy, 2013).
More detailed data on flows magnitude by type of RSP and by recipient are in the Annex II-B.
TRANSACTION COSTS:
A DISTORTED PERCEPTION
Transaction fees typically include a non-negligible fixed cost per transaction, for which the classical
FIGURE 30: How did you choose your main channel? (more than one answer allowed)
0
Wor
d of
mou
th
Adv—
stree
ts, ita
Adv—
med
ia, ita
Adv—
stree
ts, fo
reign
Adv—
med
ia, fo
reign
Emba
ssy
Inte
rnet
My f
amily
at o
rigin
Ass/G
roup
mee
ting
Religio
us m
eetin
g
Agenc
y’s su
gges
tion
50
100
150
200
250
300
350
TABLE 12: Average amount sent per flows, by type of channel used
Mean Std. Dev. N. flows Min Max
Money Transfer € 224.19 204.51 504 50 2500
Hand-carried cash to cash € 225.00 136.93 60 50 500
Bank transfer € 355.88 522.63 34 100 3000
Others* € 218.75 . 12 100 600
Total € 236.03 254.75 46 50 3000
* It includes Account to cash, Prepaid card and Twin cards.
8974-Chapter4.pdf 278974-Chapter4.pdf 27 5/8/14 2:58 PM5/8/14 2:58 PM
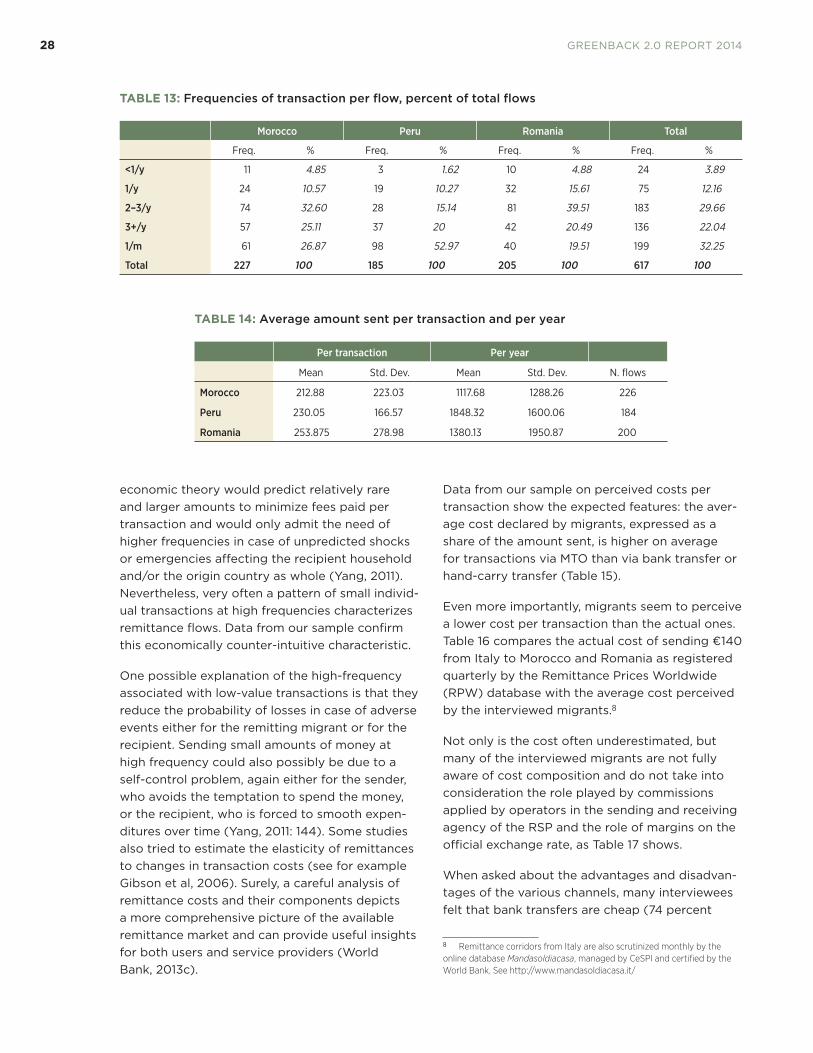
28 GREENBACK 2.0 REPORT 2014
economic theory would predict relatively rare and larger amounts to minimize fees paid per transaction and would only admit the need of higher frequencies in case of unpredicted shocks or emergencies affecting the recipient household and/or the origin country as whole (Yang, 2011). Nevertheless, very often a pattern of small individ-ual transactions at high frequencies characterizes remittance flows. Data from our sample confirm this economically counter-intuitive characteristic.
One possible explanation of the high-frequency associated with low-value transactions is that they reduce the probability of losses in case of adverse events either for the remitting migrant or for the recipient. Sending small amounts of money at high frequency could also possibly be due to a self-control problem, again either for the sender, who avoids the temptation to spend the money, or the recipient, who is forced to smooth expen-ditures over time (Yang, 2011: 144). Some studies also tried to estimate the elasticity of remittances to changes in transaction costs (see for example Gibson et al, 2006). Surely, a careful analysis of remittance costs and their components depicts a more comprehensive picture of the available remittance market and can provide useful insights for both users and service providers (World Bank, 2013c).
Data from our sample on perceived costs per transaction show the expected features: the aver-age cost declared by migrants, expressed as a share of the amount sent, is higher on average for transactions via MTO than via bank transfer or hand-carry transfer (Table 15).
Even more importantly, migrants seem to perceive a lower cost per transaction than the actual ones. Table 16 compares the actual cost of sending €140 from Italy to Morocco and Romania as registered quarterly by the Remittance Prices Worldwide (RPW) database with the average cost perceived by the interviewed migrants.8
Not only is the cost often underestimated, but many of the interviewed migrants are not fully aware of cost composition and do not take into consideration the role played by commissions applied by operators in the sending and receiving agency of the RSP and the role of margins on the official exchange rate, as Table 17 shows.
When asked about the advantages and disadvan-tages of the various channels, many interviewees felt that bank transfers are cheap (74 percent
8 Remittance corridors from Italy are also scrutinized monthly by the online database Mandasoldiacasa, managed by CeSPI and certified by the World Bank. See http://www.mandasoldiacasa.it/
TABLE 13: Frequencies of transaction per flow, percent of total flows
Morocco Peru Romania Total
Freq. % Freq. % Freq. % Freq. %
<1/y 11 4.85 3 1.62 10 4.88 24 3.89
1/y 24 10.57 19 10.27 32 15.61 75 12.16
2–3/y 74 32.60 28 15.14 81 39.51 183 29.66
3+/y 57 25.11 37 20 42 20.49 136 22.04
1/m 61 26.87 98 52.97 40 19.51 199 32.25
Total 227 100 185 100 205 100 617 100
TABLE 14: Average amount sent per transaction and per year
Per transaction Per year
Mean Std. Dev. Mean Std. Dev. N. flows
Morocco 212.88 223.03 1117.68 1288.26 226
Peru 230.05 166.57 1848.32 1600.06 184
Romania 253.875 278.98 1380.13 1950.87 200
8974-Chapter4.pdf 288974-Chapter4.pdf 28 5/8/14 2:58 PM5/8/14 2:58 PM
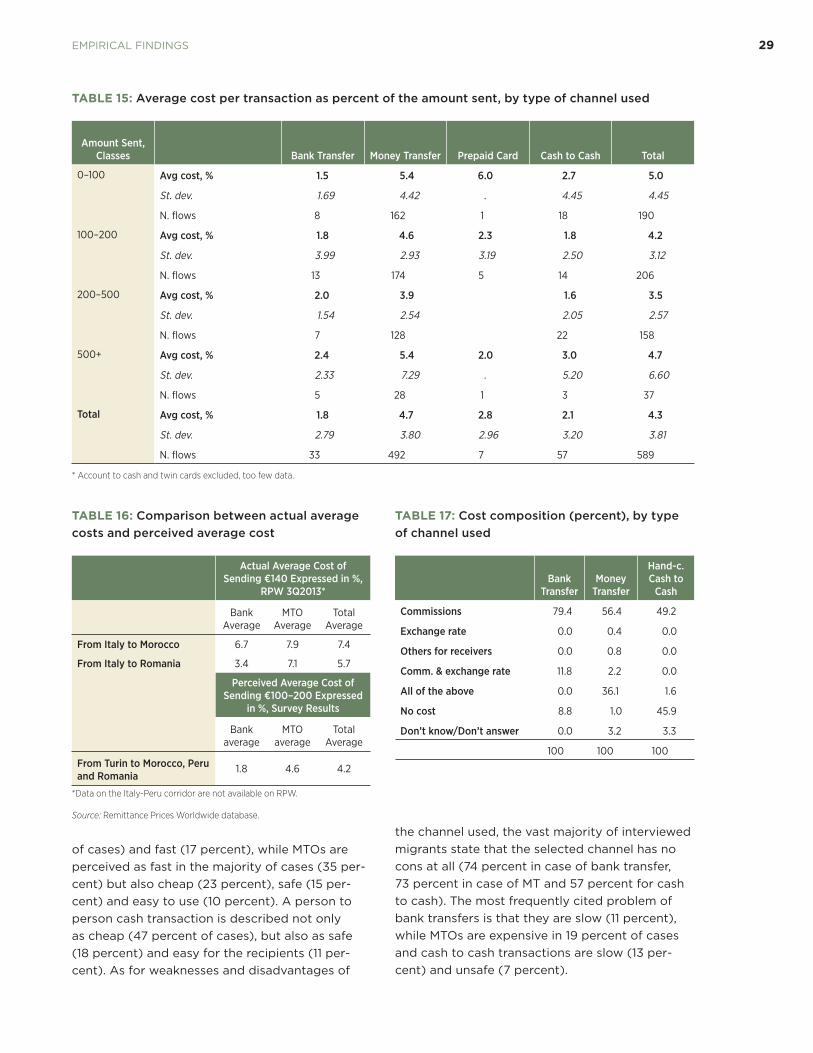
EMPIRICAL FINDINGS 29
of cases) and fast (17 percent), while MTOs are perceived as fast in the majority of cases (35 per-cent) but also cheap (23 percent), safe (15 per-cent) and easy to use (10 percent). A person to person cash transaction is described not only as cheap (47 percent of cases), but also as safe (18 percent) and easy for the recipients (11 per-cent). As for weaknesses and disadvantages of
the channel used, the vast majority of interviewed migrants state that the selected channel has no cons at all (74 percent in case of bank transfer, 73 percent in case of MT and 57 percent for cash to cash). The most frequently cited problem of bank transfers is that they are slow (11 percent), while MTOs are expensive in 19 percent of cases and cash to cash transactions are slow (13 per-cent) and unsafe (7 percent).
TABLE 15: Average cost per transaction as percent of the amount sent, by type of channel used
Amount Sent, Classes Bank Transfer Money Transfer Prepaid Card Cash to Cash Total
0–100 Avg cost, % 1.5 5.4 6.0 2.7 5.0
St. dev. 1.69 4.42 . 4.45 4.45
N. flows 8 162 1 18 190
100–200 Avg cost, % 1.8 4.6 2.3 1.8 4.2
St. dev. 3.99 2.93 3.19 2.50 3.12
N. flows 13 174 5 14 206
200–500 Avg cost, % 2.0 3.9 1.6 3.5
St. dev. 1.54 2.54 2.05 2.57
N. flows 7 128 22 158
500+ Avg cost, % 2.4 5.4 2.0 3.0 4.7
St. dev. 2.33 7.29 . 5.20 6.60
N. flows 5 28 1 3 37
Total Avg cost, % 1.8 4.7 2.8 2.1 4.3
St. dev. 2.79 3.80 2.96 3.20 3.81
N. flows 33 492 7 57 589
* Account to cash and twin cards excluded, too few data.
TABLE 16: Comparison between actual average costs and perceived average cost
Actual Average Cost of Sending €140 Expressed in %,
RPW 3Q2013*
Bank Average
MTO Average
Total Average
From Italy to Morocco 6.7 7.9 7.4
From Italy to Romania 3.4 7.1 5.7
Perceived Average Cost of Sending €100–200 Expressed
in %, Survey Results
Bank average
MTO average
Total Average
From Turin to Morocco, Peru and Romania
1.8 4.6 4.2
*Data on the Italy-Peru corridor are not available on RPW.
Source: Remittance Prices Worldwide database.
TABLE 17: Cost composition (percent), by type of channel used
Bank
TransferMoney
Transfer
Hand-c. Cash to
Cash
Commissions 79.4 56.4 49.2
Exchange rate 0.0 0.4 0.0
Others for receivers 0.0 0.8 0.0
Comm. & exchange rate 11.8 2.2 0.0
All of the above 0.0 36.1 1.6
No cost 8.8 1.0 45.9
Don’t know/Don’t answer 0.0 3.2 3.3
100 100 100
8974-Chapter4.pdf 298974-Chapter4.pdf 29 5/8/14 2:58 PM5/8/14 2:58 PM
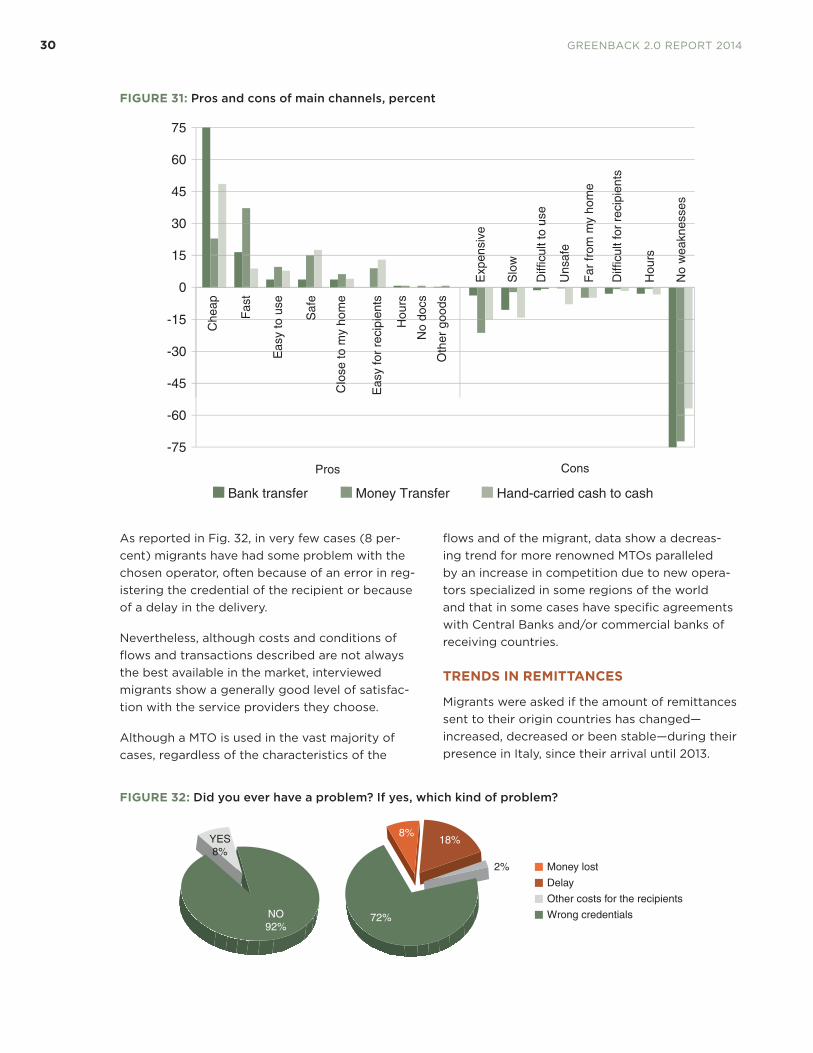
30 GREENBACK 2.0 REPORT 2014
As reported in Fig. 32, in very few cases (8 per-cent) migrants have had some problem with the chosen operator, often because of an error in reg-istering the credential of the recipient or because of a delay in the delivery.
Nevertheless, although costs and conditions of flows and transactions described are not always the best available in the market, interviewed migrants show a generally good level of satisfac-tion with the service providers they choose.
Although a MTO is used in the vast majority of cases, regardless of the characteristics of the
flows and of the migrant, data show a decreas-ing trend for more renowned MTOs paralleled by an increase in competition due to new opera-tors specialized in some regions of the world and that in some cases have specific agreements with Central Banks and/or commercial banks of receiving countries.
TRENDS IN REMITTANCES
Migrants were asked if the amount of remittances sent to their origin countries has changed—increased, decreased or been stable—during their presence in Italy, since their arrival until 2013.
FIGURE 31: Pros and cons of main channels, percent
-75
-60
-45
-30
-15
0
15
30
45
60
75
Che
ap
Fas
t
Eas
y to
use
Saf
e
Clo
se to
my
hom
e
Eas
y fo
r re
cipi
ents
Hou
rs
No
docs
Oth
er g
oods
Exp
ensi
ve
Slo
w
Diffi
cult
to u
se
Uns
afe
Far
from
my
hom
e
Diffi
cult
for
reci
pien
ts
Hou
rs
No
wea
knes
ses
Pros Cons
Bank transfer Money Transfer Hand-carried cash to cash
FIGURE 32: Did you ever have a problem? If yes, which kind of problem?
YES8%
NO92%
72%
8%18%
2% Money lost
Delay
Other costs for the recipients
Wrong credentials
8974-Chapter4.pdf 308974-Chapter4.pdf 30 5/8/14 2:58 PM5/8/14 2:58 PM

EMPIRICAL FINDINGS 31
Remittances increased for a very small propor-tion of migrants within each community (Fig. 36). Among Peruvians the total amount has remained stable across time in the majority of cases (49.7 percent), while for 56.1 percent of Moroc-cans and 55.3 percent of Romanians the money sent has diminished.
The reasons behind a reduction in the total amount sent are mainly of two types: either a decrease in the demand for remittances or a defi-cit in migrant’s supply. In many cases, consistently
with the prevalent trends among the foreign resi-dent population in the city of Turin, family reuni-fication processes have diminished the number of remittance recipients in the origin countries and at the same time have increased needs and expenditures in Italy (Fig. 37).
In 65 percent of cases nevertheless, the reduc-tion in the remittance amount has to be ascribed to the worsening economic conditions during the crisis, with an increase in instability and a decrease in earnings, which prevent migrants from maintaining their precedent levels of con-tributions to their relatives abroad. Nevertheless, while comparing income and remittance trends, it seems that remittances decreased slightly less often as they were more resilient than income to the worsening economic conditions in Italy during the last five years (see Fig. 12 for a comparison).
RECEIVED REMITTANCES
The literature on the migration and development nexus has recently enlightened the existence of reverse remittances as flows from the home
FIGURE 33: In case you had problems, did you look for help?
50%
6%
20%
22%
2%
No
Agency director
MT director
Agency at destination
Friend
FIGURE 34: Since your arrival in Italy, is your main channel changed? (percentage of total sample)
Yes33%
No67%
FIGURE 35: What kind of channel did you use at that time? (percentage of those that have changed)
Bank transfer
Count to cash
MT
Hand-carried cash to cash intermediary
Hand-carried cash to cash friend/relative
Other MT*
Postal order
42%
20%
1%
9%
7%
14%
7%
FIGURE 36: Trend in total amount sent since the arrival in Italy, by country of origin
� �
8974-Chapter4.pdf 318974-Chapter4.pdf 31 5/8/14 2:58 PM5/8/14 2:58 PM

32 GREENBACK 2.0 REPORT 2014
FIGURE 37: Reasons for a decrease in remittance amount (percent)
0 20 40 60 80
Reduction in income
Reduction in demand from recipients
Reduction in n. of recipients
Increase in expenditures in Italy
Increase in family members in Italy
More insecure income
Less savings
Other relatives contribute
Less convenient change with
FIGURE 38: Received remittances, by country and person of origin
Yes25%
75%
From where?
From where?
Morocco
75%
25%
72%
43%
50%
25%
25%
38% 36%
20%3%
3%
43%
14%
7%7%
14%
20%3%2%
Yes2%
Peru
Peru
No75%
No98%
Yes9%
Romania From where?
From whom?
From whom?
From whom?
No91%
Italy
Peru
USA
Egypt
Other Europe*
Morocco*
Romania
Italy
France
Partner
Children
Partner
Parents
Other relatives
Parents
Other relatives
Friends
Partner
Children
Other relatives
* An interviewed Romanian migrant is married with a Moroccan migrant and receives money from her partner’s relative in Morocco.
8974-Chapter4.pdf 328974-Chapter4.pdf 32 5/8/14 2:58 PM5/8/14 2:58 PM

EMPIRICAL FINDINGS 33
communities to migrants, which may take differ-ent forms (services, goods, but also money) and contribute to maintain reciprocal relationships between migrants and their household of origins (Mazzuccato, 2010).
Although our study only focuses on monetary remittance flows and does not investigate on in-kind and social transfers, survey data on reverse remittances reveal that a non-negligible share of migrants receive money from co-nationals (either a relative or a friend) outside Italy.9 One
9 It is worth noticing that, among those not included in the sample because of their non-compliance with the conditions regarding employ-ment and remittances since the beginning of 2013, between one-sixth and one-fifth of the migrants have declared that their economic conditions have deteriorated since they started to receive remittances from their relatives. For more information of migrants excluded from the sample see the Meth-odological Note.
out of four Moroccan migrants receives money from their relatives, while percentages are lower for Romanians (9 percent) and Peruvians (2 per-cent). The money usually comes from origin countries, but also from some European countries, where other family members live. These reverse monetary flows can be seen as counter-cyclical flows and help understanding how deeply the economic crisis impacts the migrants’ economic integration and their wellbeing in Italy (Fullin & Reyneri, 2013).
8974-Chapter4.pdf 338974-Chapter4.pdf 33 5/8/14 2:58 PM5/8/14 2:58 PM

8974-Chapter4.pdf 348974-Chapter4.pdf 34 5/8/14 2:58 PM5/8/14 2:58 PM

35
CONCLUSIONS
35
5
The survey conducted within Project “Greenback 2.0” aimed at describing the economic and finan-cial profile of migrants residing in the city of Turin, in particular, investigating the interconnected dimensions of financial behaviors and of finan-cial needs in terms of accessibility to different types of financial products and services. The sur-vey focused mainly on the monetary remittance behaviors and services as remittances are perhaps the most widely understood migrant’s transna-tional activity and play a crucial role in many migrant sending countries, both in terms of GDP contribution at the macro-level and as an addi-tional income source for origin households at the micro-level. The final sample is composed of three equally large subsamples of Moroccan, Peruvian, and Romanian migrants, which represent the first three foreign communities in Turin in terms of residents and of remittances sent.
The analysis of empirical data presented in the previous sections of this Report puts into light four main strands of results, which unfold further opportunities of in-depth investigation.
First, in spite of the differences in frequency and amount per transactions among the three selected subsamples, remittances are usually sent at relatively high frequencies and in small amounts and registered average annual amounts are in line with the average level for migrants in Italy. The analysis reveals a widespread misper-ception of transaction costs and overall service conditions by migrants: remitters have low aware-ness of costs’ composition and often do not con-sider the presence of exchange rate’s margins and fixed costs at destination, irrespectively of the preferred remittance service provider. Moreover, highly frequent flows are associated with low-value transactions, which imply an overall higher weight of fixed costs on the total amount sent per
year. These characteristics suggest there is room for improvement in terms of competitiveness and transparency of all remittance service providers and of greater awareness and management ability of remitters in order to minimize transaction costs and make more efficient decisions.
Secondly, our survey dealt with remittances intended as international transfers of money from migrants to their origin countries. Nevertheless the economic contribution of migrants to home countries takes many other forms, from punctual contributions in correspondence with specific events (birthdays and funerals, religious and national holydays to name a few) to long-term commitment for productive and social invest-ments in the origin area. Decisions on the type and level of economic transnational engagement vary with the type and length of the experience abroad as well as with the level of integration of migrants at different stages of their migratory process. A further step of analysis would be to connect remittance levels with the micro charac-teristics of migrants’ in terms of gender, education level and employment condition, with the meso-level, such as the household composition at origin and at destination, but also with country-level variables, which can either foster or prevent other types of transnational engagement. This could also help us explaining the different prevalent behavior among surveyed short-range (Moroccan, Romanian) and long-range (Peruvian) migrant.
A third important issue to be further explored is the role of migratory models in influencing remit-tance practices and needs. Interviewed migrants differ by country of origin, gender, length of stay in Italy, type of occupation and related economic stability. Moroccans and Peruvians typically have larger families than Romanians, considering both relatives in the origin country and in Italy.
8974-Chapter5.pdf 358974-Chapter5.pdf 35 5/19/14 3:42 PM5/19/14 3:42 PM
36 GREENBACK 2.0 REPORT 2014
Moroccan migrants show on average a longer presence in Italy and hence a higher rate of family reunification than both Peruvians and Romanians, who instead often report to have children left in the country of origin. Collected data suggests on average a good level of economic and financial integration of interviewed migrants, although differences arise across subsamples and by gen-der. Hence, results suggest that different remit-ting practices, i.e. frequency and amount, type of receivers and purpose of the money pertain to distinct migratory models in terms of familiar net-works and reunification strategies for spouse and children, distance from the home country, length of migration, and type of labor market integration abroad. Migrants who consider their migratory experience as permanent and who progressively proceed with family reunification processes at destination behave differently from migrants who consider the possibility of return or of circularity between the origin and the destination country. Moreover, our selected subsamples provide evi-dence of different gender models, which deserve further inquiry. Patterns of transnational economic activities are consistent with data on the partici-pation of men and women in the labor market at destination. Although women remit less than men on average, does the remittance-income ratio dif-fer between men and women? Do women remit for different purposes and to different types of recipients compared to their male co-nationals? These questions will be driving further analyses on the empirical evidence collected through the Greenback 2.0 survey.
Finally, our empirical Study suggests a non-linear relation between integration and transnational engagement. The length of stay abroad is usu-ally taken as an (imperfect) measure of migrant’s integration at destination: the level of economic, social and political integration is expected to grow with the length of migration, which can be associ-ated with a more stable job, an improvement in the type and length of a residence permit, family formation, social engagement and political partic-ipation etc. Our data indicate that migrants’ trans-national economic engagement does not always diminish with time, as we found migrants who still remit after twenty or thirty years of migration. Hence, a better integration at destination may not prevent migrants from engaging in transnational activities or keeping a connection with the origin country. Moreover, these trends are also found during periods of severe economic crisis which, on average, has deteriorated migrants’ economic conditions, putting at stake the overall level of economic integration of migrants and their capac-ity to keep remittance flows constant over time.
Since remittances seem to be resistant to income drops, this could suggest that under certain con-ditions integration and transnationalism are not mutually exclusive. A deeper analysis of their occupational and economic trajectories since their arrival in Italy could provide a better understand-ing of the reciprocal connections between their integration processes at destination and their transnational economic activities.
8974-Chapter5.pdf 368974-Chapter5.pdf 36 5/19/14 3:42 PM5/19/14 3:42 PM

37
REFERENCES
37
Ashraf, N. Aycinena, D., Martinez, A. C., & Yang, D.
(2011), “Remittances and the Problem of Con-
trol: A Field Experiment among Migrants from
El Salvador.” http://www-personal.umich
.edu/~deanyang/papers/aamy_
remittancecontrol.pdf
Bank of Italy (2013), Le rimesse verso l’estero degli
immigrati in Italia http://www.bancaditalia.it/
statistiche/rapp_estero/rimesse.
Blangiardo, G. C. (2004), “Campionamento
per centri nelle indagini sulla presenza stra-
niera in Lombardia: una nota metodologica,”
in Aa.Vv., Studi in ricordo di Marco Martini,
Giuffrè, Milano.
Blangiardo, G. C., Baio, G. & Blangiardo, M. (2011),
“Center sampling technique in foreign migra-
tion surveys: a methodological note,” Jour-
nal of Official Statistics, Vol. 27, No. 3, 2011,
pp. 451–465.
Bonifazi, C. & Marini, C. (2013), “The impact of
the economic crisis on foreigners in the Ital-
ian labor market,” Journal of Ethnic and
Migration Studies.
Castagnone, E., Mezger, C., Schoumaker, B., Nazio
T., Rokotonarivo N. (2013), “Understanding
Afro-European labor trajectories: integration of
migrants into the European labor market, trans-
national economic participation and economic
reintegration into the country of origin. A com-
parative Study,” MAFE WP 26, January: http://
www.ined.fr/fichier/t_telechargement/57781/
telechargement_fichier_en_wp26_
understandingafro.eulabortrajectories.pdf
Centro Studi e Ricerche IDOS (2013), Dossier
Statistico Immigrazione—Rapporto UNAR Dalle
discriminazioni ai diritti, Roma.
CeSPI (2012), Primo Report—Osservatorio Nazio-
nale sull’Inclusione Finanziaria dei Migranti
in Italia, CeSPI—Centro Studi di Politica
Internazionale.
CeSPI (2013), Secondo Rapporto—
Osservatorio Nazionale sull’Inclusione
Finanziaria dei Migranti in Italia, CeSPI—
Centro Studi di Politica Internazionale.
Cingolani, P. & Ricucci, R (2013), Transmediterranei—
Le collettività di origine nordafricana in
Piemonte tra continuità e cambiamento, Rap-
porto di Ricerca, FIERI, Torino.
Comune di Torino, (2013), Stranieri residenti a
Torino distribuiti per provenienza e circo-
scrizione, http://www.comune.torino.it/
informacasa/studi_statistiche/processi_
demografici/stranieri_torino.shtml
de Haas, H. (2007), “Remittances, migration and
social development,” in Social policy and devel-
opment, n.34, October, www.imi.ox.ac.uk/pdfs/
unrisd-remittances-mig-dev.
Fondazione Leone Moressa (2013), Rapporto
annuale sull’economia dell’immigrazione—
Edizione 2013, Tra percorsi migratori e compor-
tamento economico, Bologna, Il Mulino.
Fullin, G. and Reyneri, E. (2013), “Introduzione.
Gli immigrati in un mercato del lavoro in crisi:
il caso italiano in prospettiva comparata,” in
Mondi Migranti 1.2013 Immigrazione e crisi eco-
nomica, pp. 21–35, Franco Angeli.
Galossi Emanuele, (Settembre 2013), L’impatto
della crisi sulle condizioni di vita e di lavoro
degli immigrati: un’indagine dell’Associazione
Bruno Trentin, Ass. Bruno Trentin e IRES.
Gibson, J., McKenzie, D. & Rohorua, H. (2006),
“How cost elastic are remittances? Evidence
from Tongan migrants in New Zealand,” Pacific
Economic Bulletin, 21:1:112–28.
International Organization for Migration (2013),
Questionnaire for the project “Developing
a platform for development partnerships
between diaspora and entrepreneurs in Egypt,
Morocco, Tunisia and Lebanon through dona-
tions, loans and services,” coordinated by IOM
Regional Office in Egypt, Cairo.
Mazzuccato, V. (2010), “Reverse Remittances in
the Migration–Development Nexus: Two-Way
Flows between Ghana and the Netherlands,”
Population Space Place 17, 454–468.
Ministero del Lavoro e delle Politiche Sociali 2013,
Terzo Rapporto Annuale—Gli Immigrati nel
mercato del lavoro in Italia, Roma. http://www
8974-References.pdf 378974-References.pdf 37 5/8/14 2:59 PM5/8/14 2:59 PM

38 GREENBACK 2.0 REPORT 2014
.lavoro.gov.it/PrimoPiano/Documents/Terzo
percent20Rapporto percent20Annuale.
percent20Gli percent20immigrati percent20nel
percent20mercato percent20del
percent20lavoro percent20in percent20Italia
percent202013.pdf
Nicolì, M. & Corazza, C. (2010), The Market for
Remittance Services in the Czech Republic:
Outcomes of a Survey among Migrants. World
Bank: https://openknowledge.worldbank.org/
handle/10986/2521
Pastore F., Salis E., Villosio C. (2013) L’Italia e
l’immigrazione low cost: fine di un ciclo?, in
Mondi Migranti 1.2013 Immigrazione e crisi
economica, pp. 151–172, Franco Angeli.
Ratha, D., (2007), Leveraging remittances
for development, Policy Brief, Migration
Policy Institute, http://siteresources
.worldbank.org/INTPROSPECTS/
Resources/334934-1100792545130/
LeveragingRemittancesforDev.pdf .
Reyneri, E. (2007), “Immigration in Italy: trends
and perspectives,” ARGO—IOM, http://www
.portalecnel.it/portale/indlavdocumenti.nsf/0/
466486C57FF3FF42C125737F0050A9EC/
$FILE/Reyneri-percent20Immigration
percent20in percent20Italy.pdf
Ricucci, R. (2011), Le famiglie straniere di fronte
alla crisi. Istantanee piemontesi, Rapporto di
Ricerca, FIERI, Torino: http://fieri.it/2011/02/11/
le-famiglie-straniere-di-fronte-alla-crisi-
istantanee-piemontesi/
Rapoport, H. And Docquier, F. (2005), “The Eco-
nomics of Migrants’ Remittances,” IZA Discus-
sion Paper Series, DP No. 1531, March 2005.
Salis, E. (2012), “Labour migration governance in
contemporary Europe. The case of Italy,” FIERI
WP, LAB-MIG-GOV Project, April: http://www
.labmiggov.eu/wp-content/uploads/2012/04/
LABMIGOV_WP1_Italy_Final-report.pdf
Schoumaker, B., & Diagne, A. (2010), Migrations
between Africa and Europe: Data Collection
Report, MAFE Methodological Note 2: http://
www.ined.fr/fichier/t_telechargement/58222/
telechargement_fichier_fr_note.2_
schoumaker_diagne_2011.pdf
Strozza, S. (2004). “Estimates of the Illegal For-
eigners in Italy: A Review of the Literature,”
IMR-Center for Migration Studies of New York ,
38:1:309–331.
The World Bank and Bank for International Settle-
ment 2007, General principles for international
remittance services, January http://
siteresources.worldbank.org/
INTPAYMENTREMMITTANCE/Resources/
New_Remittance_Report.pdf
The World Bank 2011, Migration and Remittances
Factbook—Second Edition, Washington D.C.
The World Bank 2012, Guidance Report for the
Implementation of the CPSS-World Bank—
General Principles for International Remittances
Services, October, http://web.worldbank.org/
WBSITE/EXTERNAL/TOPICS/EXTFINANCIAL
SECTOR/0,,contentMDK:23289589~pagePK:
210058~piPK:210062~theSitePK:282885,00.html
The World Bank (2012), Migration and Develop-
ment Brief 19, Migration and Remittances
Team, Development Prospects Group,
Washington DC.
The World Bank, (2013a), Migration and Devel-
opment Brief 20, Migration and Remittances
Team, Development Prospects Group, April 19,
Washington DC.
The World Bank (2013b), Migration and Develop-
ment Brief 21, Migration and Remittances Team,
Development Prospects Group, October 2,
Washington DC.
The Word Bank (2013c), Remittance Prices World-
wide, Issue No. 8—December 2013, https://
remittanceprices.worldbank.org/sites/default/
files/RPW_Report_Dec2013.pdf
Yang, D. (2011), “Migrant Remittances,” Jour-
nal of Economic Perspectives, Volume 25:3,
pp. 129–152.
8974-References.pdf 388974-References.pdf 38 5/8/14 2:59 PM5/8/14 2:59 PM

39
FROM THE SURVEY DESIGN TO THE FIELDWORK: A METHODOLOGICAL NOTE
39
The Questionnai reAfter the research objectives and the survey sample structure were defined together with the World Bank, the research team within FIERI and Labor (Laboratorio R. Revelli worked at the preparation of the Questionnaire and of the field work. The general framework and the questions about remittances are inspired by previous stud-ies on migration and remittances. In particular, the research team grounded the questionnaire struc-ture on a previous empirical research run by the World Bank in Czech Republic (Nicolì and Carro-zza, 2010) as well as on other surveys conducted by the International Organization for Migration
(2013), INED (Schoumaker & Diagne, 2010), and CeSPI-ABI (CeSPI, 2012, 2013). Moreover, every time it was possible, the content, wording and label of questions were formulated as close as possible to those included in the Italian Labor Force Survey and other national and international surveys (Bank of Italy, Eurostat) in order to allow a comparison of survey results with existing offi-cial statistics.
The questionnaire was intended for face-to-face interviews lasting around 20–30 minutes each and administered by trained interviewers in Italian, but with the possibility of translating questions and concepts also in Spanish, French and English.
ANNEX 1
FIGURE 39: Questionnaire structure
Intro & privacy statement
Section B: Personal information (sex, age, birth and currentcitizenship, marital status, religion, education and training)
Section C: Info on family components and HH structure(sex, age, birth and current citizenship, marital status).
Section D: Individual and HH income.
Section E: Financial inclusionBCA, savings and other bank products, access to credit and microcredit.
Section F: RemittancesIntensity, freq., operators & costs, direction & use. Received remittances.
Section G: OccupationType of job, productive sector, contract and hours.
Section H: Legal statusEntry documents and permit to stay, at the beginning and now.
Section I: Crisis’s impact
Only for thosein Italy since2008 and
before
Section L: Training/Information on financial services.
Follow up: Availability to be recontracted for training and follow-up.
For the interviewer: Post-interview comments.
Section A: Filter questions–To be in Italy since at least 1 year–To reside in Turin (and the surrounding area)–To have an income (any type of source)–To rend remittances at least one since the beginning of 2013)
Survey on migrants’ financial needs and behavior in Turin
–Questionnaire structure
8974-Annex1.pdf 398974-Annex1.pdf 39 5/8/14 2:57 PM5/8/14 2:57 PM
40 GREENBACK 2.0 REPORT 2014
The structure of the questionnaire (Fig. 39) was intended to first understand whether or not include the migrant in the sample through four filter questions and then to address each specific section—demography, income and earnings, finan-cial inclusion, remittances, job and occupation, legal status and availability to further training—in a logical sequence for the interviewed.
Training of interviewers and pilotsThe fieldwork team was composed by six quali-fied interviewers, one of which was the coordina-tor and the person in charge of keeping contacts with the research team and the interviewers at the same time.
As a preliminary phase to the fieldwork, the inter-viewers attended a specific training on the project objectives and on the overall structure and logic of the study, on the specific content of each ques-tion of the questionnaire and on the strategies for the sample definition and the interview process. During the training session, the questionnaire’s draft was given to the interviewers along with the related documentation for the fieldwork:
• leaflet on the project to be distributed to inter-viewed migrants
• a preliminary list of entry points and key infor-mants of the three communities
• a guide (20 pages) to support interviewers in the fieldwork phase, with practical insights on interviewing and data collection techniques and with a detailed description of each section of the questionnaire, to lower problems of interpretation and wording
• privacy statements to be signed by migrants to guarantee the anonymity of the interview
• follow-up forms through which interview-ers collected contacts information (name, telephone number and/or email addresses) of migrants interested in taking part in edu-cational and non-educational meetings in a second phase of the Greenback 2.0 project
• personal access to the online platform Survey Monkey, for the registration of questionnaire data
• vouchers in the value of 10 euros, lasting one year, for purchases in a book shop (books,
magazines, children toys and stationary) to be offered to the interviewed migrants as an incentive/reward for their participation.
Before starting the fieldwork phase, a pilot of around a dozen interviews was conducted in order to test the length, structure and consistency of the questionnaire. The test was very important for interviewers to verify the interviewing tech-niques and to test the difficulty of single ques-tions, their exact wording, and the correct way to register received answers. Especially for the section on economic and financial situation of migrants and their families, the pilot interviews provided with important feedbacks on the sensi-tiveness and clearness of each specific question. Finally, interviewers were trained on the most effective way to convince migrants to complete the whole questionnaire, how to offer an incentive (voucher) and how to obtain consent to the use of sensible data (privacy statement).
Thanks to this pilot, it was noted that some spe-cific wordings and concepts had to be further clarified to interviewed migrants. For example, the word “remittance” was defined as “the money you send to your origin country,” which all the inter-viewees understood without any difficulty. While, in general, the comprehension was good enough, in some cases migrants needed more explanations on concepts and content of the question from the interviewer. Moreover, during the test some ques-tions were modified and some response options added (e.g. “member of a cooperative” was added among types of occupation). The test revealed that on average each interview would last around twenty minutes.
Feedbacks from the pilot interviews were dis-cussed together with interviewers and integrated in the final version of the questionnaire.
The fieldwork: sampling strategy and entry pointsThe fieldwork timespan was from 01 July to 05 September 2013. Pilot interviews were collected between 01 and 05 July 2013.
Interviewers were sub-divided into three mini-teams made up of two people, each one focused on one specific community (80 interviews per
8974-Annex1.pdf 408974-Annex1.pdf 40 5/8/14 2:57 PM5/8/14 2:57 PM

FROM THE SURVEY DESIGN TO THE FIELDWORK: A METHODOLOGICAL NOTE 41
researcher, 160 interviews per community, 480 interviews in total). This subdivision gave them the opportunity to improve and optimize com-munication and coordination between them-selves on the entry points, centers and key informants specific for each of the three com-munities, to avoid overlapping and repetitions. This community-focused approach helped the insertion of the interviewers in the three commu-nities: analyzing just one community each, they were able to obtain a good understanding of the assigned community.
Starting from an initial list, interviewers constantly updated a comprehensive dataset of key infor-mants and of collective entry points, with opening hours and contacts of reference individuals. This preliminary phase of mapping the city of Turin in terms of places and reference points for each of the three communities was even more fundamen-tal as the survey took place during the summer period, when many public offices, local associa-tions and organizations are closed. The final list is made of centers of interests of many different types—places of work, recreational clubs, public offices and local authorities, religious centers and commercial companies—some specific to each of the three communities and some more cross-cultural, multi-lingual and general. For example, researchers concentrated in the areas surrounding the three Consulates for the three communities, in some parks and green areas renowned to be hang out by Peruvian migrants (Pellerina and Colletta Park), in a market area in Corso Racconigi and in a specific part of the Valentino Park where there are some kiosks and stalls run by Romanians. More cross-cultural entry points were represented by public offices such as migrant offices within the police headquarters (Questura) and the munici-pality of Turin, as well as charities, NGOs and local-based associations for migrant integration (Gruppo Abele, Alma Mater, Asai, Fratia, etc.). These places were precious for the data collection as their characteristics allowed for greater acces-sibility to migrants with different socio-economic profiles, age structure, origins and length of stay, hence helping to lower the selection bias in build-ing the sample.
Although the timing of the survey made the map-ping of viable entry points more difficult, inter-viewers were still able to comply with the two
basic in order to lower possible bias and distor-tions in the final sample definition and structure:
• no more than ten contacts/interviews from one entry point;
• no more than five contacts/interviews from an individual included in the sample (already interviewed).
The first criterion is grounded on the center sam-pling technique presented by Blangiardo (2004) and based upon the recognition of some refer-ence points for a specific community (a commu-nity leader, the representative or president of an association, a renowned cultural mediator etc.), who collaborated with the interviewers to facili-tate their approach and to get better understand-ing a community. The second criterion applies the snowball sampling, a special non-probability method used when a desired sample is rare or not fully known in advance. It relies on referrals from initial subjects to generate additional waves of respondents from among their acquaintances, so that the sampled group appears to grow like a rolling snowball10. In our case, snowballing allowed interviewers to receive suggestions from interviewed migrants on some other co-nationals with the required characteristics to be included in the survey and possibly interested in partici-pating. A positive aspect of using this recalling technique is that it makes it easier to earn trust and to engage them in the survey, as the first contact is made via the presentation of a friend or co-national.
Nevertheless, a large number of total interviews were collected through an anonymous approach of the interviewers in public/open places (pub-lic gardens, streets etc.). The constant presence of the researchers in the aforementioned areas allowed them to be recognized and to be wel-comed by the different communities. In some cases, from a preliminary contact in a street or in a public space, the interviewers were invited to access private dwellings in order to be more com-fortable during the interview and to take part into
10 Proposed by Goodman (1961), this selection process is clearly non- random and it lowers search costs at the expense of introducing bias, because the technique itself reduces the likelihood that the sample will rep-resent a good cross section from the population. Nevertheless, a number of variants have been tested to overcome limits and bias that non-randomness implies. As regards to Italy, Strozza (2004) reports on various examples where different types of snowball sampling have been tested.
8974-Annex1.pdf 418974-Annex1.pdf 41 5/8/14 2:57 PM5/8/14 2:57 PM
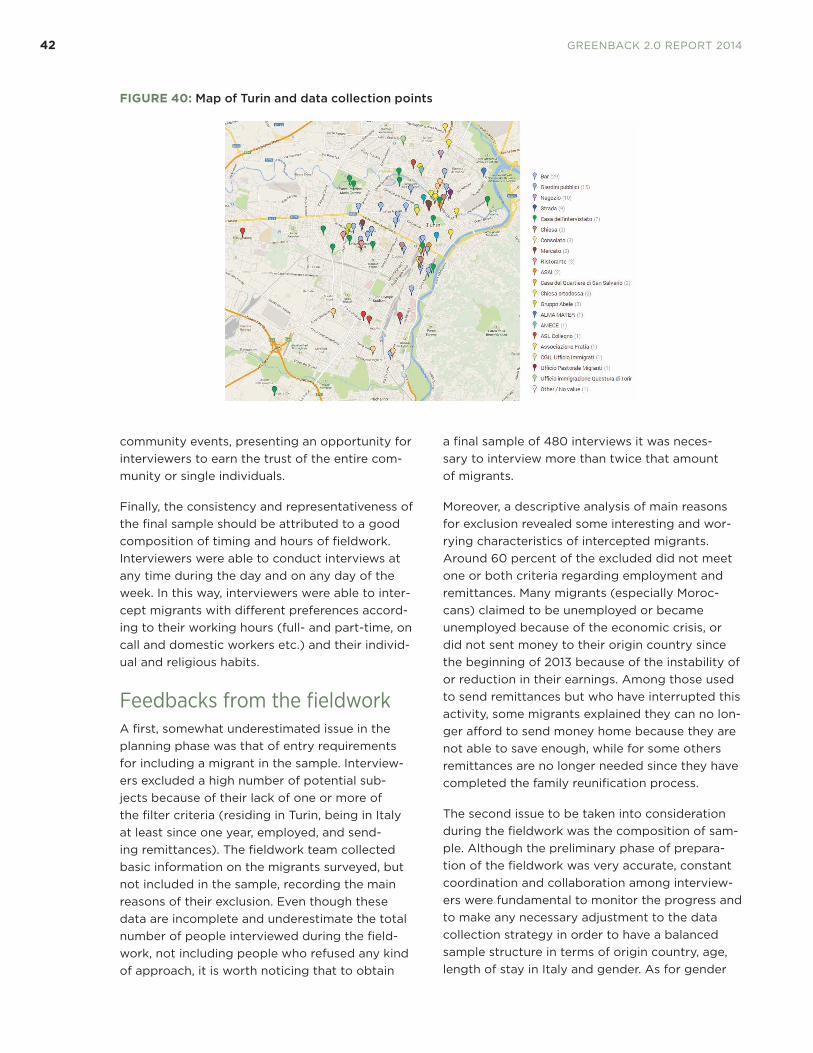
42 GREENBACK 2.0 REPORT 2014
FIGURE 40: Map of Turin and data collection points
community events, presenting an opportunity for interviewers to earn the trust of the entire com-munity or single individuals.
Finally, the consistency and representativeness of the final sample should be attributed to a good composition of timing and hours of fieldwork. Interviewers were able to conduct interviews at any time during the day and on any day of the week. In this way, interviewers were able to inter-cept migrants with different preferences accord-ing to their working hours (full- and part-time, on call and domestic workers etc.) and their individ-ual and religious habits.
Feedbacks from the fieldworkA first, somewhat underestimated issue in the planning phase was that of entry requirements for including a migrant in the sample. Interview-ers excluded a high number of potential sub-jects because of their lack of one or more of the filter criteria (residing in Turin, being in Italy at least since one year, employed, and send-ing remittances). The fieldwork team collected basic information on the migrants surveyed, but not included in the sample, recording the main reasons of their exclusion. Even though these data are incomplete and underestimate the total number of people interviewed during the field-work, not including people who refused any kind of approach, it is worth noticing that to obtain
a final sample of 480 interviews it was neces-sary to interview more than twice that amount of migrants.
Moreover, a descriptive analysis of main reasons for exclusion revealed some interesting and wor-rying characteristics of intercepted migrants. Around 60 percent of the excluded did not meet one or both criteria regarding employment and remittances. Many migrants (especially Moroc-cans) claimed to be unemployed or became unemployed because of the economic crisis, or did not sent money to their origin country since the beginning of 2013 because of the instability of or reduction in their earnings. Among those used to send remittances but who have interrupted this activity, some migrants explained they can no lon-ger afford to send money home because they are not able to save enough, while for some others remittances are no longer needed since they have completed the family reunification process.
The second issue to be taken into consideration during the fieldwork was the composition of sam-ple. Although the preliminary phase of prepara-tion of the fieldwork was very accurate, constant coordination and collaboration among interview-ers were fundamental to monitor the progress and to make any necessary adjustment to the data collection strategy in order to have a balanced sample structure in terms of origin country, age, length of stay in Italy and gender. As for gender
8974-Annex1.pdf 428974-Annex1.pdf 42 5/8/14 2:57 PM5/8/14 2:57 PM
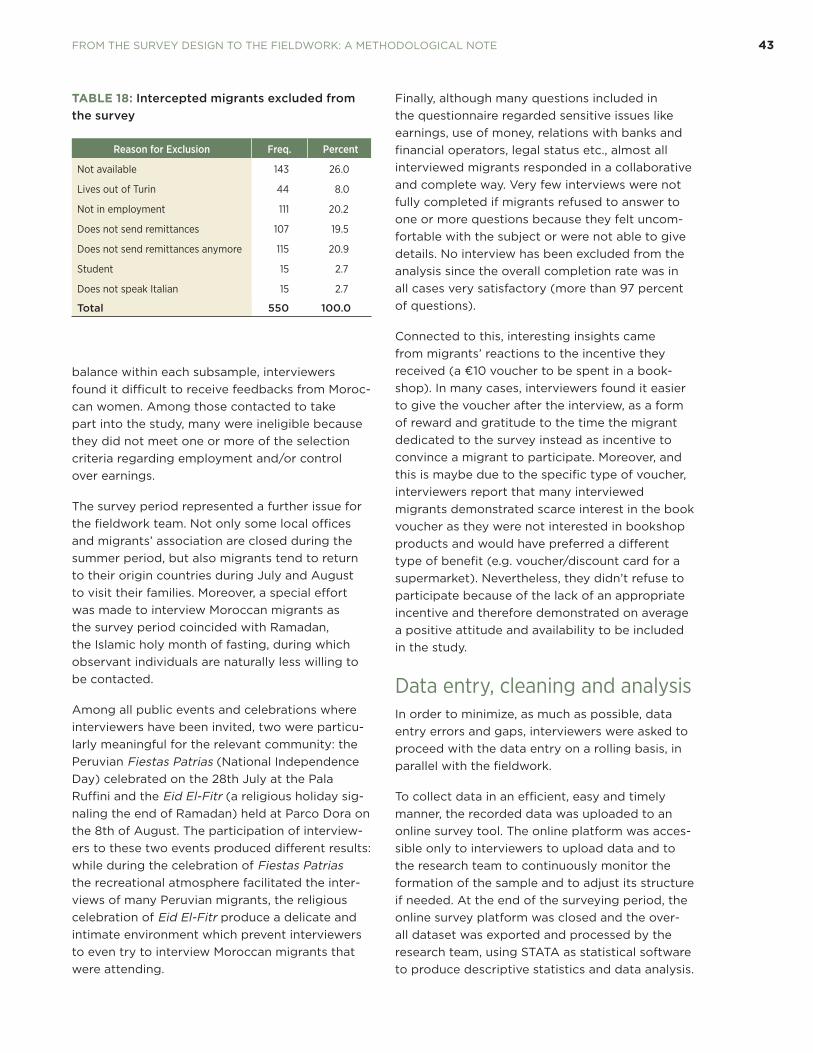
FROM THE SURVEY DESIGN TO THE FIELDWORK: A METHODOLOGICAL NOTE 43
balance within each subsample, interviewers found it difficult to receive feedbacks from Moroc-can women. Among those contacted to take part into the study, many were ineligible because they did not meet one or more of the selection criteria regarding employment and/or control over earnings.
The survey period represented a further issue for the fieldwork team. Not only some local offices and migrants’ association are closed during the summer period, but also migrants tend to return to their origin countries during July and August to visit their families. Moreover, a special effort was made to interview Moroccan migrants as the survey period coincided with Ramadan, the Islamic holy month of fasting, during which observant individuals are naturally less willing to be contacted.
Among all public events and celebrations where interviewers have been invited, two were particu-larly meaningful for the relevant community: the Peruvian Fiestas Patrias (National Independence Day) celebrated on the 28th July at the Pala Ruffini and the Eid El-Fitr (a religious holiday sig-naling the end of Ramadan) held at Parco Dora on the 8th of August. The participation of interview-ers to these two events produced different results: while during the celebration of Fiestas Patrias the recreational atmosphere facilitated the inter-views of many Peruvian migrants, the religious celebration of Eid El-Fitr produce a delicate and intimate environment which prevent interviewers to even try to interview Moroccan migrants that were attending.
Finally, although many questions included in the questionnaire regarded sensitive issues like earnings, use of money, relations with banks and financial operators, legal status etc., almost all interviewed migrants responded in a collaborative and complete way. Very few interviews were not fully completed if migrants refused to answer to one or more questions because they felt uncom-fortable with the subject or were not able to give details. No interview has been excluded from the analysis since the overall completion rate was in all cases very satisfactory (more than 97 percent of questions).
Connected to this, interesting insights came from migrants’ reactions to the incentive they received (a €10 voucher to be spent in a book-shop). In many cases, interviewers found it easier to give the voucher after the interview, as a form of reward and gratitude to the time the migrant dedicated to the survey instead as incentive to convince a migrant to participate. Moreover, and this is maybe due to the specific type of voucher, interviewers report that many interviewed migrants demonstrated scarce interest in the book voucher as they were not interested in bookshop products and would have preferred a different type of benefit (e.g. voucher/discount card for a supermarket). Nevertheless, they didn’t refuse to participate because of the lack of an appropriate incentive and therefore demonstrated on average a positive attitude and availability to be included in the study.
Data entry, cleaning and analysisIn order to minimize, as much as possible, data entry errors and gaps, interviewers were asked to proceed with the data entry on a rolling basis, in parallel with the fieldwork.
To collect data in an efficient, easy and timely manner, the recorded data was uploaded to an online survey tool. The online platform was acces-sible only to interviewers to upload data and to the research team to continuously monitor the formation of the sample and to adjust its structure if needed. At the end of the surveying period, the online survey platform was closed and the over-all dataset was exported and processed by the research team, using STATA as statistical software to produce descriptive statistics and data analysis.
TABLE 18: Intercepted migrants excluded from the survey
Reason for Exclusion Freq. Percent
Not available 143 26.0
Lives out of Turin 44 8.0
Not in employment 111 20.2
Does not send remittances 107 19.5
Does not send remittances anymore 115 20.9
Student 15 2.7
Does not speak Italian 15 2.7
Total 550 100.0
8974-Annex1.pdf 438974-Annex1.pdf 43 5/8/14 2:57 PM5/8/14 2:57 PM

8974-Annex1.pdf 448974-Annex1.pdf 44 5/8/14 2:57 PM5/8/14 2:57 PM
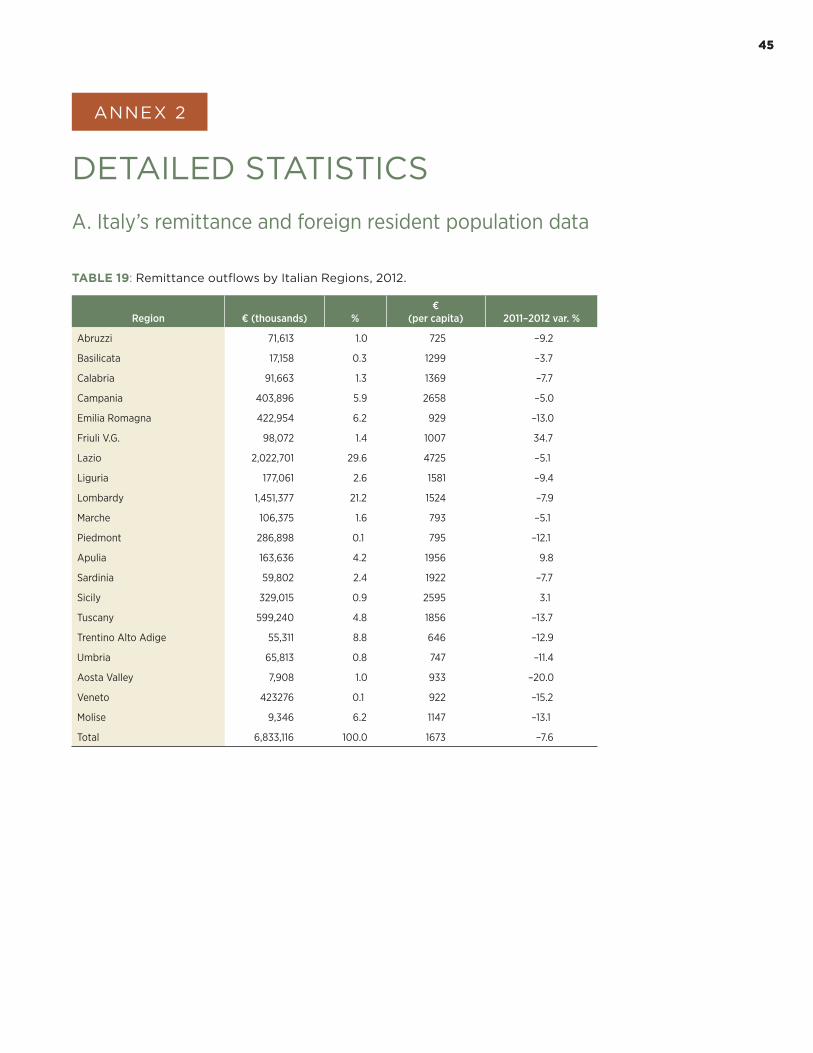
45
DETAILED STATISTICS
45
A. Italy’s remittance and foreign resident population data
TABLE 19: Remittance outflows by Italian Regions, 2012.
Region € (thousands) %€
(per capita) 2011–2012 var. %
Abruzzi 71,613 1.0 725 –9.2
Basilicata 17,158 0.3 1299 –3.7
Calabria 91,663 1.3 1369 –7.7
Campania 403,896 5.9 2658 –5.0
Emilia Romagna 422,954 6.2 929 –13.0
Friuli V.G. 98,072 1.4 1007 34.7
Lazio 2,022,701 29.6 4725 –5.1
Liguria 177,061 2.6 1581 –9.4
Lombardy 1,451,377 21.2 1524 –7.9
Marche 106,375 1.6 793 –5.1
Piedmont 286,898 0.1 795 –12.1
Apulia 163,636 4.2 1956 9.8
Sardinia 59,802 2.4 1922 –7.7
Sicily 329,015 0.9 2595 3.1
Tuscany 599,240 4.8 1856 –13.7
Trentino Alto Adige 55,311 8.8 646 –12.9
Umbria 65,813 0.8 747 –11.4
Aosta Valley 7,908 1.0 933 –20.0
Veneto 423276 0.1 922 –15.2
Molise 9,346 6.2 1147 –13.1
Total 6,833,116 100.0 1673 –7.6
ANNEX 2
8974-Annex2.pdf 458974-Annex2.pdf 45 5/8/14 2:57 PM5/8/14 2:57 PM
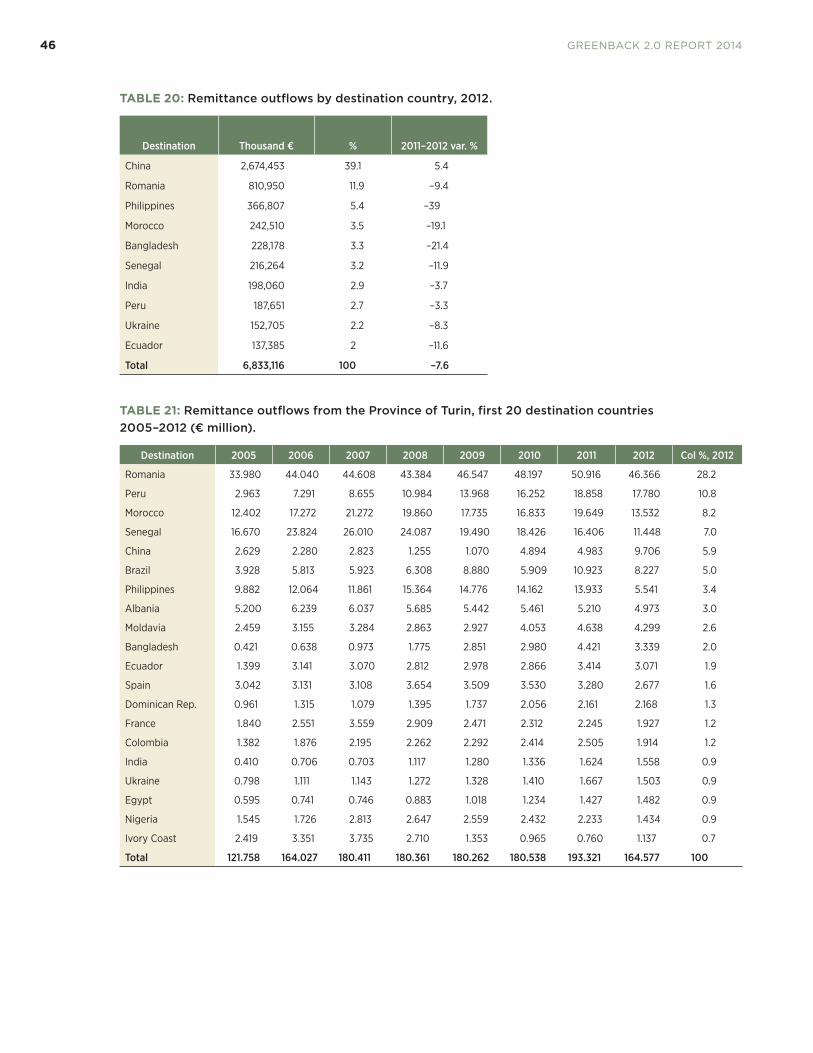
46 GREENBACK 2.0 REPORT 2014
TABLE 20: Remittance outflows by destination country, 2012.
Destination Thousand € % 2011–2012 var. %
China 2,674,453 39.1 5.4
Romania 810,950 11.9 –9.4
Philippines 366,807 5.4 –39
Morocco 242,510 3.5 –19.1
Bangladesh 228,178 3.3 –21.4
Senegal 216,264 3.2 –11.9
India 198,060 2.9 –3.7
Peru 187,651 2.7 –3.3
Ukraine 152,705 2.2 –8.3
Ecuador 137,385 2 –11.6
Total 6,833,116 100 –7.6
TABLE 21: Remittance outflows from the Province of Turin, first 20 destination countries 2005–2012 (€ million).
Destination 2005 2006 2007 2008 2009 2010 2011 2012 Col %, 2012
Romania 33.980 44.040 44.608 43.384 46.547 48.197 50.916 46.366 28.2
Peru 2.963 7.291 8.655 10.984 13.968 16.252 18.858 17.780 10.8
Morocco 12.402 17.272 21.272 19.860 17.735 16.833 19.649 13.532 8.2
Senegal 16.670 23.824 26.010 24.087 19.490 18.426 16.406 11.448 7.0
China 2.629 2.280 2.823 1.255 1.070 4.894 4.983 9.706 5.9
Brazil 3.928 5.813 5.923 6.308 8.880 5.909 10.923 8.227 5.0
Philippines 9.882 12.064 11.861 15.364 14.776 14.162 13.933 5.541 3.4
Albania 5.200 6.239 6.037 5.685 5.442 5.461 5.210 4.973 3.0
Moldavia 2.459 3.155 3.284 2.863 2.927 4.053 4.638 4.299 2.6
Bangladesh 0.421 0.638 0.973 1.775 2.851 2.980 4.421 3.339 2.0
Ecuador 1.399 3.141 3.070 2.812 2.978 2.866 3.414 3.071 1.9
Spain 3.042 3.131 3.108 3.654 3.509 3.530 3.280 2.677 1.6
Dominican Rep. 0.961 1.315 1.079 1.395 1.737 2.056 2.161 2.168 1.3
France 1.840 2.551 3.559 2.909 2.471 2.312 2.245 1.927 1.2
Colombia 1.382 1.876 2.195 2.262 2.292 2.414 2.505 1.914 1.2
India 0.410 0.706 0.703 1.117 1.280 1.336 1.624 1.558 0.9
Ukraine 0.798 1.111 1.143 1.272 1.328 1.410 1.667 1.503 0.9
Egypt 0.595 0.741 0.746 0.883 1.018 1.234 1.427 1.482 0.9
Nigeria 1.545 1.726 2.813 2.647 2.559 2.432 2.233 1.434 0.9
Ivory Coast 2.419 3.351 3.735 2.710 1.353 0.965 0.760 1.137 0.7
Total 121.758 164.027 180.411 180.361 180.262 180.538 193.321 164.577 100
8974-Annex2.pdf 468974-Annex2.pdf 46 5/8/14 2:57 PM5/8/14 2:57 PM

DETAILED STATISTICS 47
TABLE 22: Foreign resident population in the Province of Turin, first 20 origin countries, 2003–2011.
Country of Origin 2003 2004 2005 2006 2007 2008 2009 2010 2011
Romania 10787 24818 33628 39570 44158 73557 85817 91786 95258
Morocco 13540 15636 19532 20830 22511 23895 26247 27999 28693
Albania 5557 6850 7930 8522 9165 9713 10493 10861 11136
Peru 3779 5173 5922 6470 7044 7500 8388 9769 10481
China 2840 3389 4357 4869 5483 5829 6221 6832 7553
Moldova 357 1594 2396 2957 3417 3808 4756 5641 6685
Egypt 1453 1786 2332 2602 2913 3242 3601 3960 4344
Nigeria 1491 1818 2194 2349 2595 2807 3064 3337 3638
Philippines 1758 2014 2278 2429 2562 2748 2995 3227 3494
Brazil 1380 1683 1828 2049 2297 2524 2774 2953 3040
Tunisia 1225 1361 1536 1675 1813 1948 2095 2136 2121
France 1724 1763 1851 1892 1966 2056 2111 2072 2111
Ecuador 271 809 1061 1252 1423 1534 1654 1783 1907
Senegal 808 954 1297 1420 1480 1519 1599 1650 1688
Ukraine 222 501 695 811 915 1011 1123 1279 1388
Poland 595 681 794 916 1049 1209 1270 1313 1347
Spain 868 873 913 950 988 1055 1091 1090 1112
Bosnia Herz. 751 838 808 856 913 931 968 992 1045
United Kingdom 865 897 1001 1002 1028 1072 1087 1060 1031
Germany 781 778 797 854 899 950 984 972 958
Province of Turin, tot 62084 86728 106276 118284 129533 164592 185073 198249 207488
B. Survey data: remittancesTABLE 23: Flows’ recipients, by main channel.
Bank Transfer Money Transfer H.-c. Cash to Cash
Freq. % Freq. % Freq. %
Parents 27 77.14 271 53.24 35 55.56
Children 1 2.86 34 6.68 4 6.35
Siblings 4 11.43 112 22 11 17.46
Partner 30 5.89 5 7.94
Partner’s relatives 2 5.71 21 4.13 1 1.59
Other relatives 1 2.86 35 6.88 5 7.94
Friends 6 1.18 2 3.17
Total 35 100 509 100 63 100
8974-Annex2.pdf 478974-Annex2.pdf 47 5/8/14 2:57 PM5/8/14 2:57 PM

48 GREENBACK 2.0 REPORT 2014
TABLE 24: Average amount sent per year (classes), by country.
Morocco Peru Romania
Freq. % Freq. % Freq. %
<200 28 12.23 16 8.65 33 16.1
201–500 41 17.9 21 11.35 49 23.9
501–1000 77 33.62 32 17.3 44 21.46
1001–2500 62 27.07 68 36.76 43 20.98
2501–5000 12 5.24 40 21.62 20 9.76
5000+ 9 3.93 8 4.32 16 7.8
Total 229 100 185 100 205 100
TABLE 25: Average amount sent per year, by type of channel used.
Mean Std. Dev. N. flows Min Max
Money transfer € 1,442.5 1652.9 503 50 14400
Cash to cash € 1,075.0 1249.1 60 100 6000
Bank transfer € 1,677.3 2027.2 33 100 9000
Others* € 1,752.1 . 12 100 7200
Total € 1,425.1 1649.0 608 50 14400
* Includes Count to cash, Prepaid card and Twin cards
8974-Annex2.pdf 488974-Annex2.pdf 48 5/12/14 3:27 PM5/12/14 3:27 PM

MAY 2014
Migrants’ Remittances from ItalyInternational remittances and access to financial
servicesfor migrants in Turin, Italy International remittances and access to financial services for migrants in Turin, Italy
A Greenback 2.0 RepoRt
Migrants’ Remittancefrom Italy
Cover photo: courtesy of Michele D’Ottavio
A survey by