migrahack: responsive data visualization tutorial will learn the basics of responsive design and...
TRANSCRIPT
Migrahack: Responsive DataVisualization Tutorial
Release
David Eads
April 21, 2014

Contents
1 Prerequisites 31.1 Web browser . . . . . . . . . . . . . . . . . . . . . . . . . . . . . . . . . . . . . . . . . . . . . . . 31.2 Text editor . . . . . . . . . . . . . . . . . . . . . . . . . . . . . . . . . . . . . . . . . . . . . . . . 31.3 Command-line interface . . . . . . . . . . . . . . . . . . . . . . . . . . . . . . . . . . . . . . . . . 31.4 Git and GitHub . . . . . . . . . . . . . . . . . . . . . . . . . . . . . . . . . . . . . . . . . . . . . . 3
2 Planning: Know your data 52.1 Principles . . . . . . . . . . . . . . . . . . . . . . . . . . . . . . . . . . . . . . . . . . . . . . . . . 52.2 Our data . . . . . . . . . . . . . . . . . . . . . . . . . . . . . . . . . . . . . . . . . . . . . . . . . 5
3 Planning: Sketch your interface 73.1 Step 1: Sketch a lot . . . . . . . . . . . . . . . . . . . . . . . . . . . . . . . . . . . . . . . . . . . . 83.2 Step 2: Winnow it down . . . . . . . . . . . . . . . . . . . . . . . . . . . . . . . . . . . . . . . . . 83.3 Step 3: Sketch again . . . . . . . . . . . . . . . . . . . . . . . . . . . . . . . . . . . . . . . . . . . 83.4 Final concept . . . . . . . . . . . . . . . . . . . . . . . . . . . . . . . . . . . . . . . . . . . . . . . 8
4 Set up: Bootstrap your project 114.1 Create files and directories . . . . . . . . . . . . . . . . . . . . . . . . . . . . . . . . . . . . . . . . 114.2 Hello Git . . . . . . . . . . . . . . . . . . . . . . . . . . . . . . . . . . . . . . . . . . . . . . . . . 114.3 Download some data . . . . . . . . . . . . . . . . . . . . . . . . . . . . . . . . . . . . . . . . . . . 134.4 index.html: page skeleton . . . . . . . . . . . . . . . . . . . . . . . . . . . . . . . . . . . . . . . . 134.5 index.html: Title . . . . . . . . . . . . . . . . . . . . . . . . . . . . . . . . . . . . . . . . . . . . . 144.6 index.html: Meta . . . . . . . . . . . . . . . . . . . . . . . . . . . . . . . . . . . . . . . . . . . . . 144.7 index.html: CSS . . . . . . . . . . . . . . . . . . . . . . . . . . . . . . . . . . . . . . . . . . . . . 154.8 index.html: Analytics . . . . . . . . . . . . . . . . . . . . . . . . . . . . . . . . . . . . . . . . . . 154.9 Interlude: Adding css/style.css . . . . . . . . . . . . . . . . . . . . . . . . . . . . . . . . . . . . . . 164.10 index.html: Add introduction . . . . . . . . . . . . . . . . . . . . . . . . . . . . . . . . . . . . . . 184.11 index.html: Add introduction . . . . . . . . . . . . . . . . . . . . . . . . . . . . . . . . . . . . . . 194.12 index.html: Add navigation . . . . . . . . . . . . . . . . . . . . . . . . . . . . . . . . . . . . . . . 204.13 index.html: Add content placeholders . . . . . . . . . . . . . . . . . . . . . . . . . . . . . . . . . . 204.14 index.html: Add footer . . . . . . . . . . . . . . . . . . . . . . . . . . . . . . . . . . . . . . . . . . 214.15 index.html: Scripts . . . . . . . . . . . . . . . . . . . . . . . . . . . . . . . . . . . . . . . . . . . . 214.16 js/app.js: Hello world . . . . . . . . . . . . . . . . . . . . . . . . . . . . . . . . . . . . . . . . . . 214.17 Did it work? . . . . . . . . . . . . . . . . . . . . . . . . . . . . . . . . . . . . . . . . . . . . . . . 22
5 Build: Getting set up 235.1 Download . . . . . . . . . . . . . . . . . . . . . . . . . . . . . . . . . . . . . . . . . . . . . . . . . 235.2 Create placeholders . . . . . . . . . . . . . . . . . . . . . . . . . . . . . . . . . . . . . . . . . . . 23
i
5.3 Build: Set up Backbone collection . . . . . . . . . . . . . . . . . . . . . . . . . . . . . . . . . . . . 245.4 Build: Process data with collection methods . . . . . . . . . . . . . . . . . . . . . . . . . . . . . . . 25
6 Build: Make a table 29
7 Break: Taking stock 33
8 Build: Make a time-series bar chart 358.1 A basic chart view . . . . . . . . . . . . . . . . . . . . . . . . . . . . . . . . . . . . . . . . . . . . 358.2 Add the d3 code . . . . . . . . . . . . . . . . . . . . . . . . . . . . . . . . . . . . . . . . . . . . . 38
ii

Migrahack: Responsive Data Visualization Tutorial, Release
This tutorial will walk you through the process of building a simple news application and publishing it on the web.You will learn the basics of responsive design and charting with D3 by visualizing data from the @chitowncodersCook County Jail scraper.
You will get hands-on experience in every stage of the development process: working with data, sketching mockups,writing HTML, CSS, and Javascript and recording your work using Git’s version control system.
You will learn to use Backbone JS to structure your application, Underscore JS to process data, Twitter Bootstrap tostructure your markup, and D3 for data visualization. The techniques used here were first described in ResponsiveCharts with D3 and Backbone by Ryan Nagle.
This guide was prepared for Migrahack Mexico City, April 3-6, 2014 and presented by David Eads.
• Tutorial: http://migrahack.readthedocs.org/
• Demonstration: http://26thycalifornia.recoveredfactory.net
• Code repository: https://github.com/sc3/26thycalifornia
• Issues: https://github.com/sc3/26thycalifornia/issues
Contents 1

Migrahack: Responsive Data Visualization Tutorial, Release
2 Contents
CHAPTER 1
Prerequisites
1. A fundamental understanding of HTML, CSS, and Javascript
2. A modern web browser (Chrome or Firefox)
3. A text editor to work with plain text files
4. A command-line interface to interact with your computer
5. Git version control software
6. (Optional) An account at GitHub.com
1.1 Web browser
Chrome or Firefox. Chrome (or Chromium on Linux) is recommended for its superior debugging tools.
1.2 Text editor
You’ll be editing simple “plain text” files.
Just like you need a word processor for writing human language, you need a text editor for working with plain textsuch as HTML markup, CSS, and Javascript.
Sublime Text is highly recommended. It’s fast, simple, and runs on all major platforms.
1.3 Command-line interface
Every computer should be a way to open a window that lets you type in commands. Different operating systems givethis tool slightly different names, but they all have some form of it, and there are alternative programs you can installas well.
On Windows you can find the command-line interface by opening the “command prompt.” Here are instructions forWindows 8 and earlier versions.
On Apple computers, you open the “Terminal” application.
Ubuntu Linux comes with a program of the same name.
3
Migrahack: Responsive Data Visualization Tutorial, Release
1.4 Git and GitHub
Git is a version control program for saving the changes you make to files over time. This is useful when you’re workingon your own, but quickly becomes essential with large software projects, especially if you work with other developers.
GitHub is a website that hosts git code repositories, both public and private. It comes with many helpful tools forreviewing code and managing projects. It also has some extra tricks that make it easy to publish web pages, which wewill use later.
GitHub offers helpful guides for installing Git in Windows, Macs and Linux. You can verify it’s installed from yourcommand line like so:
git --version
Once that’s done, you should create an account at GitHub, if you don’t already have one. It shouldn’t cost youanything. The free plan is all that’s required to complete this lesson.
4 Chapter 1. Prerequisites
CHAPTER 2
Planning: Know your data
2.1 Principles
• Acquire meaningful data (the data for this tutorial comes from a scraper).
• Question the data: - Does the data need cleaning or scrubbing? - What comparisons can be made? - How canthe data be bucketed or categorized? - How can the data be normalized and averaged?
• Process data: “Boil down” into useful summary data structures. - Time series - Ratios - Distributions
• Publish raw and summarized data with a web API
Time summaries of crime incident data by David Eads describes how the Chicago Tribune applies these techniques tocrime data.
2.2 Our data
Our data comes from http://cookcountyjail.recoveredfactory.net/api/2.0/daily_population. This API endpoint providesdata in the JSON format that looks like:
[{
date: "2013-07-22",booked: "177",females_booked: "18",females_booked_as: "0",females_booked_bk: "16",females_booked_in: "0",females_booked_lt: "1",females_booked_un: "0",females_booked_wh: "1",females_left: "16",females_left_as: "0",females_left_bk: "11",females_left_in: "0",females_left_lt: "2",females_left_un: "0",females_left_wh: "3",females_population: "1092",females_population_as: "5",females_population_bk: "775",females_population_in: "3",
5
Migrahack: Responsive Data Visualization Tutorial, Release
females_population_lt: "107",females_population_un: "0",females_population_wh: "202",left: "187"males_booked: "159",males_booked_as: "1",males_booked_bk: "98",males_booked_in: "0",males_booked_lt: "30",males_booked_un: "0",males_booked_wh: "30",males_left: "171",males_left_as: "4",males_left_bk: "119",males_left_in: "0",males_left_lt: "34",males_left_un: "0",males_left_wh: "14",males_population: "12012",males_population_as: "73",males_population_bk: "8912",males_population_in: "7",males_population_lt: "1951",males_population_un: "0",males_population_wh: "1069",population: "13104",
},// ...
]
As you can see, this date provides daily population and booking / exit counts for each day the scraper ran. Such datacan be used to generate simple but useful statistics like average/min/max and to plot time series.
6 Chapter 2. Planning: Know your data

7
Migrahack: Responsive Data Visualization Tutorial, Release
CHAPTER 3
Planning: Sketch your interface
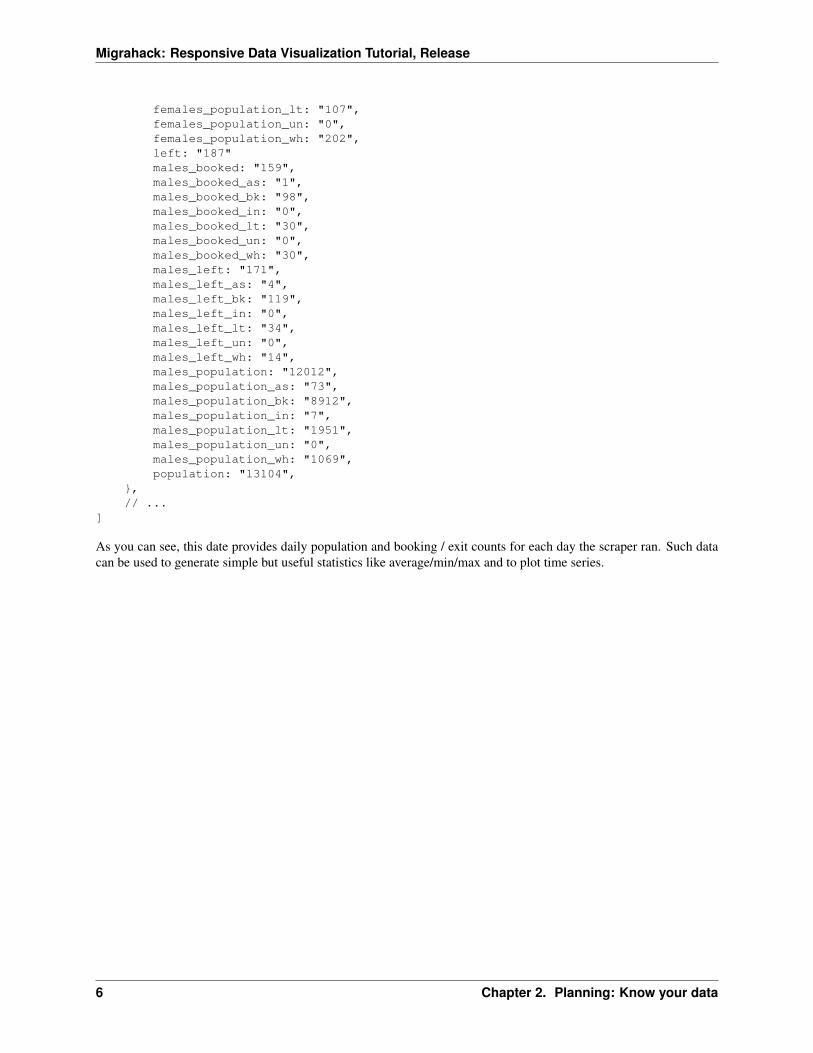
3.1 Step 1: Sketch a lot
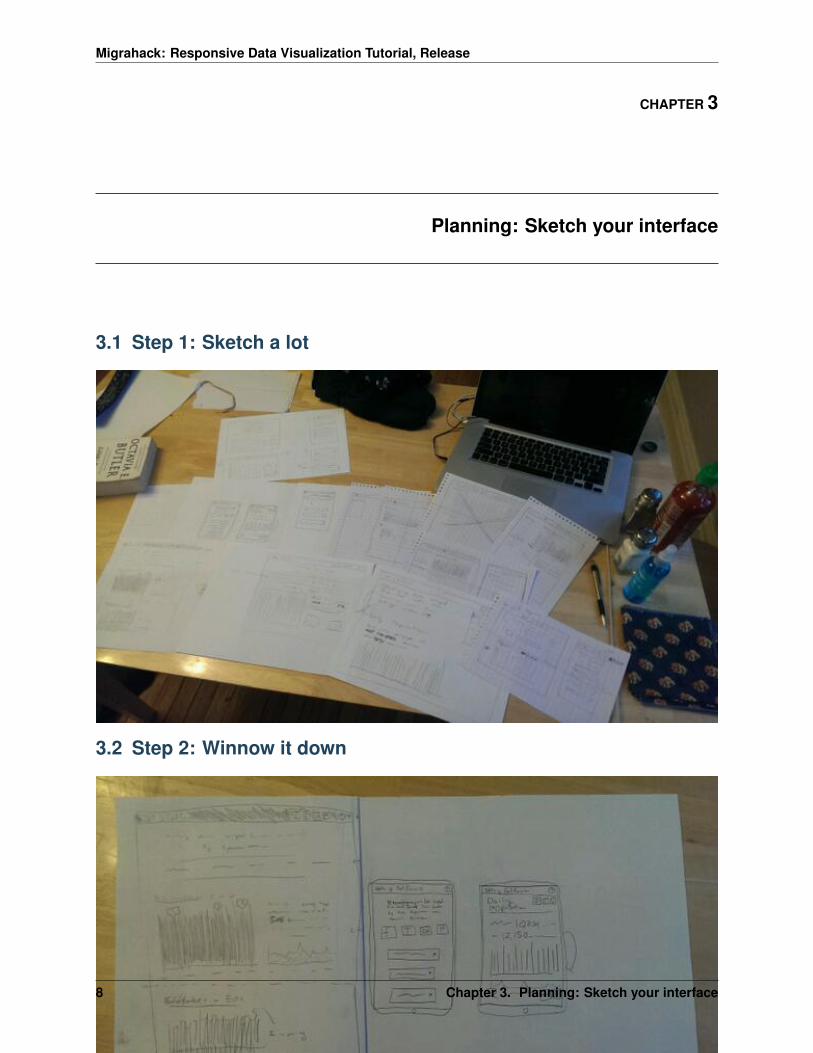
3.2 Step 2: Winnow it down
3.3 Step 3: Sketch again
3.4 Final concept
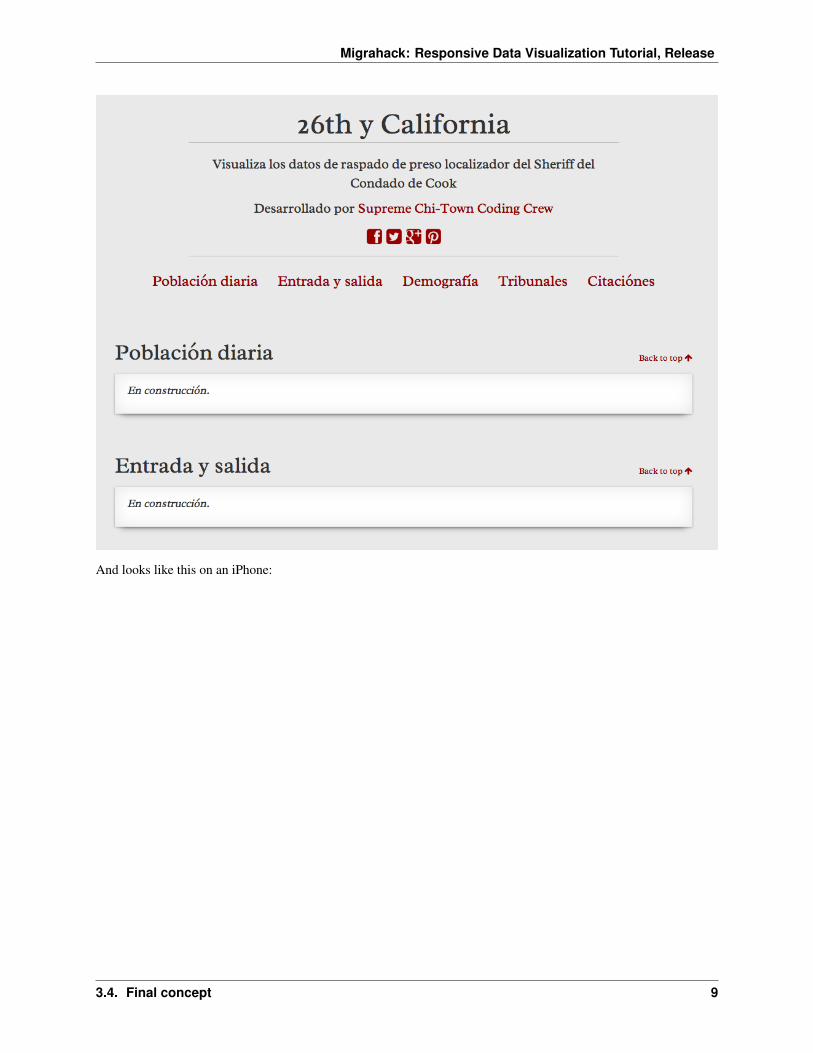
Using just HTML, I banged together a concept for the site. Once you’re done with the set up chapters, you will havea site that looks like this on a desktop:
8 Chapter 3. Planning: Sketch your interface
Migrahack: Responsive Data Visualization Tutorial, Release
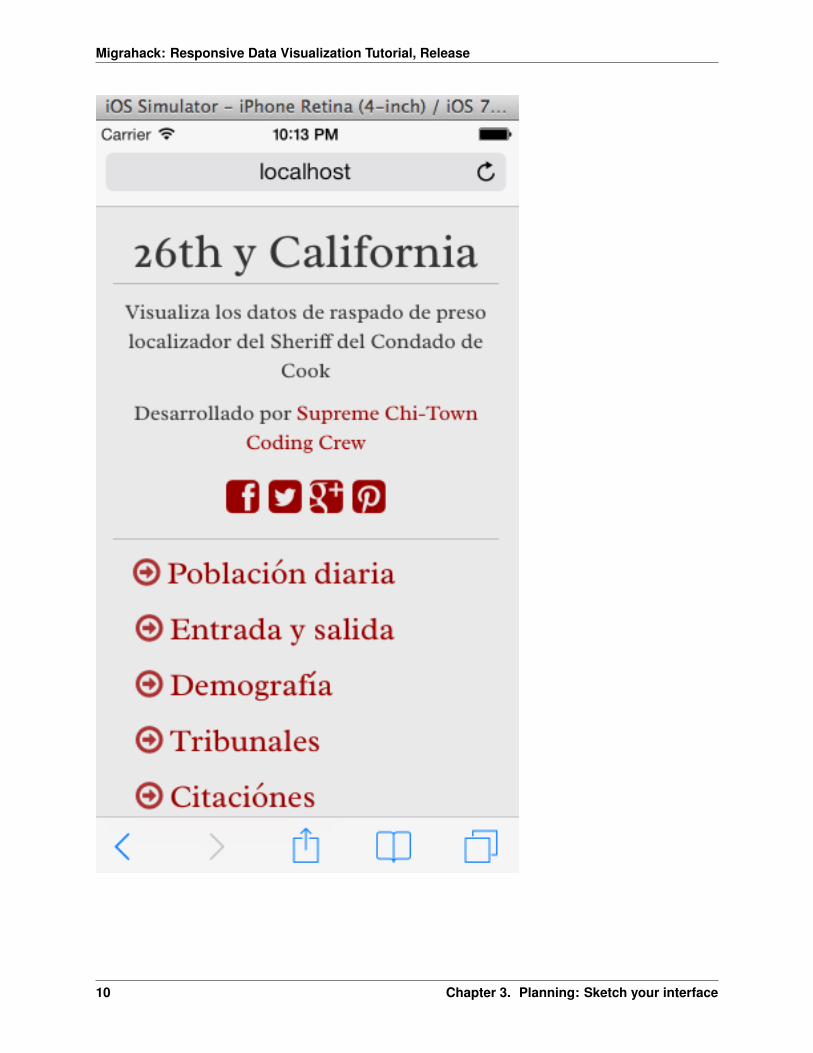
And looks like this on an iPhone:
3.4. Final concept 9
Migrahack: Responsive Data Visualization Tutorial, Release
10 Chapter 3. Planning: Sketch your interface
CHAPTER 4
Set up: Bootstrap your project
Note: Don’t care about the nitty gritty details of setting up your project? Not running OS X or Linux? Just skip aheadto the Build chapters.
Let’s go through the gory process of setting up a basic static site. Shameless plug: Tools like Tarbell automate thisprocess.
4.1 Create files and directories
Start by creating a directory for your project.
mkdir 26thycaliforniacd 26thycalifornia
mkdir creates a directory. cd changes the current working directory.
Now create a bunch of empty files and directories.
mkdir cssmkdir datamkdir jstouch index.htmltouch README.mdtouch css/style.csstouch js/Data.jstouch js/Charts.jstouch js/app.js
touch creates an empty file if none exists.
Note: So how do you know what to create to start off with? Practice! Your sketches and experience will be yourguide.
4.2 Hello Git
You’ve gone from an empty directory to a structure to start working with. This would be a good time to make a noteof the work you’ve done so far. Say hello to the Git version control system:
11
Migrahack: Responsive Data Visualization Tutorial, Release
git init
The git command is always followed by a subcommand, like init, which tells git what to do. The init subcommandcreates a new repository in the current directory.
Find out the state of your repository.
git status# On branch master## Initial commit## Untracked files:# (use "git add <file>..." to include in what will be committed)## README.md# css/# index.html# js/
Tell git about all the new files you’ve created:
git add .
The add subcommand adds files to be committed. The dot . signifies all new files. You can read git add . as“add all new and changed files to the next batch of changes to be logged.”
Check the status of your repository again.
git status# On branch master## Initial commit## Changes to be committed:# (use "git rm --cached <file>..." to unstage)## new file: README.md# new file: css/style.css# new file: index.html# new file: js/Data.js# new file: js/Charts.js# new file: js/app.js
Log your changes (in this case, adding all those empty files). The commit subcommand creates a new entry in thehistory with a message attached to it.
git commit -m "creado 26th y california"
The -m "Some message" flag specifies a message to associate with this set of changes.
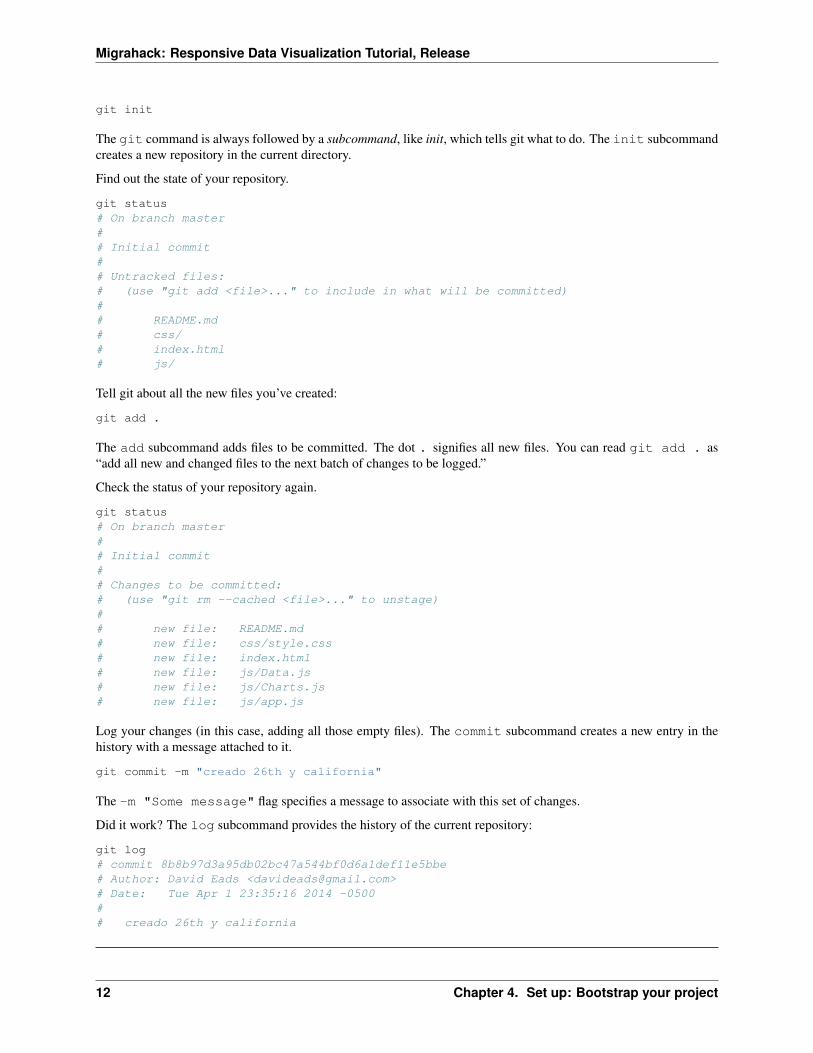
Did it work? The log subcommand provides the history of the current repository:
git log# commit 8b8b97d3a95db02bc47a544bf0d6a1def11e5bbe# Author: David Eads <[email protected]># Date: Tue Apr 1 23:35:16 2014 -0500## creado 26th y california
12 Chapter 4. Set up: Bootstrap your project
Migrahack: Responsive Data Visualization Tutorial, Release
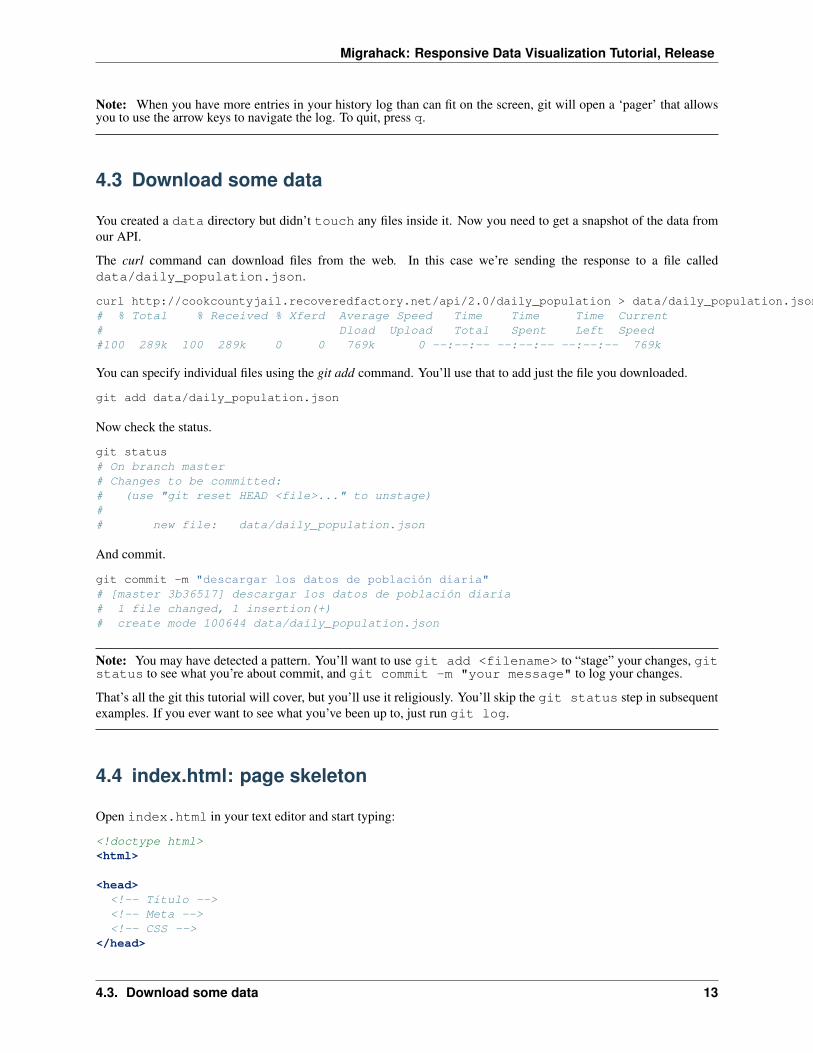
Note: When you have more entries in your history log than can fit on the screen, git will open a ‘pager’ that allowsyou to use the arrow keys to navigate the log. To quit, press q.
4.3 Download some data
You created a data directory but didn’t touch any files inside it. Now you need to get a snapshot of the data fromour API.
The curl command can download files from the web. In this case we’re sending the response to a file calleddata/daily_population.json.
curl http://cookcountyjail.recoveredfactory.net/api/2.0/daily_population > data/daily_population.json# % Total % Received % Xferd Average Speed Time Time Time Current# Dload Upload Total Spent Left Speed#100 289k 100 289k 0 0 769k 0 --:--:-- --:--:-- --:--:-- 769k
You can specify individual files using the git add command. You’ll use that to add just the file you downloaded.
git add data/daily_population.json
Now check the status.
git status# On branch master# Changes to be committed:# (use "git reset HEAD <file>..." to unstage)## new file: data/daily_population.json
And commit.
git commit -m "descargar los datos de población diaria"# [master 3b36517] descargar los datos de población diaria# 1 file changed, 1 insertion(+)# create mode 100644 data/daily_population.json
Note: You may have detected a pattern. You’ll want to use git add <filename> to “stage” your changes, gitstatus to see what you’re about commit, and git commit -m "your message" to log your changes.
That’s all the git this tutorial will cover, but you’ll use it religiously. You’ll skip the git status step in subsequentexamples. If you ever want to see what you’ve been up to, just run git log.
4.4 index.html: page skeleton
Open index.html in your text editor and start typing:
<!doctype html><html>
<head><!-- Título --><!-- Meta --><!-- CSS -->
</head>
4.3. Download some data 13
Migrahack: Responsive Data Visualization Tutorial, Release
<body><!-- Introducción --><!-- Navegación --><!-- Contenido --><!-- Bibliotecas de código --><!-- Aplicación -->
</body></html>
Now commit your changes:
git add index.htmlgit commit -m "crear la estructura de index.html"
Note: You may need to add or change sections of the file later. Your starting point will never be perfect, so don’tworry about making it perfect. Just be clean and consistent.
Each of the commented sections will need content based on our sketches. Let’s do this! You’ll work top to bottom,showing only the section of the file you’re working on.
Note: You’ll notice we’re going all out and adding basic social media sharing tags and analytics.
4.5 index.html: Title
<!-- Título --><title>26th y California</title>
git add index.htmlgit commit -m "incorporar titulo de proyecto"
4.6 index.html: Meta
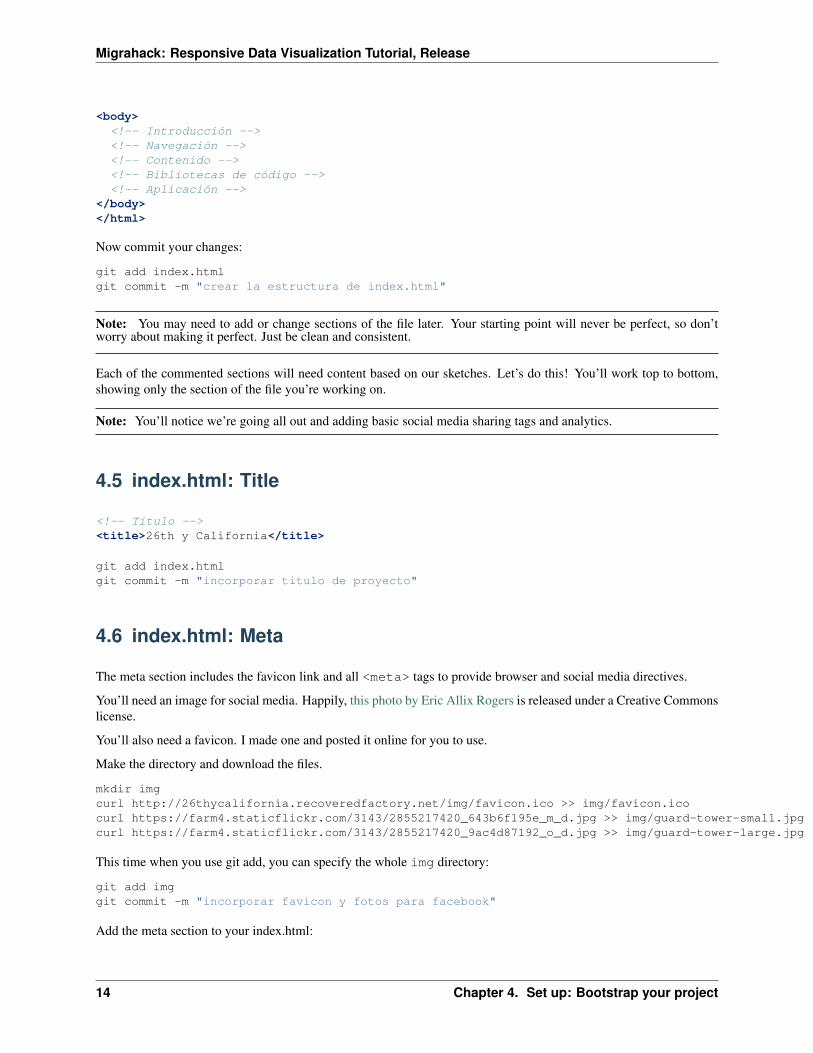
The meta section includes the favicon link and all <meta> tags to provide browser and social media directives.
You’ll need an image for social media. Happily, this photo by Eric Allix Rogers is released under a Creative Commonslicense.
You’ll also need a favicon. I made one and posted it online for you to use.
Make the directory and download the files.
mkdir imgcurl http://26thycalifornia.recoveredfactory.net/img/favicon.ico >> img/favicon.icocurl https://farm4.staticflickr.com/3143/2855217420_643b6f195e_m_d.jpg >> img/guard-tower-small.jpgcurl https://farm4.staticflickr.com/3143/2855217420_9ac4d87192_o_d.jpg >> img/guard-tower-large.jpg
This time when you use git add, you can specify the whole img directory:
git add imggit commit -m "incorporar favicon y fotos para facebook"
Add the meta section to your index.html:
14 Chapter 4. Set up: Bootstrap your project
Migrahack: Responsive Data Visualization Tutorial, Release
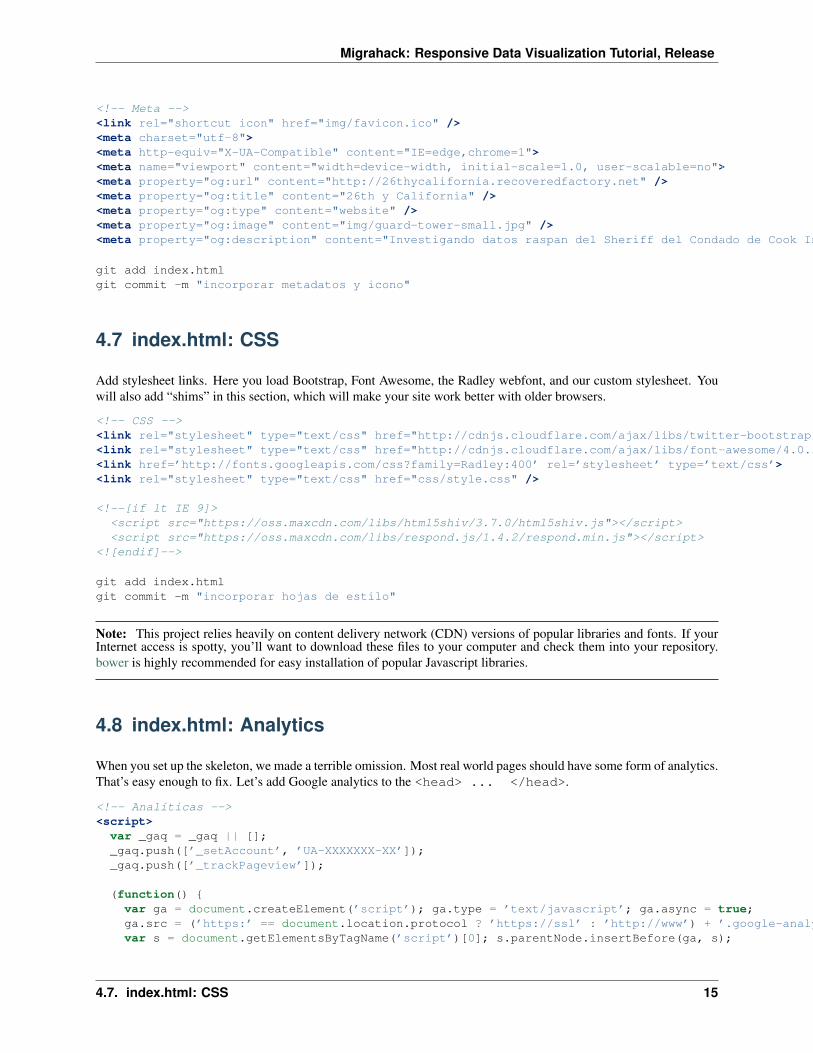
<!-- Meta --><link rel="shortcut icon" href="img/favicon.ico" /><meta charset="utf-8"><meta http-equiv="X-UA-Compatible" content="IE=edge,chrome=1"><meta name="viewport" content="width=device-width, initial-scale=1.0, user-scalable=no"><meta property="og:url" content="http://26thycalifornia.recoveredfactory.net" /><meta property="og:title" content="26th y California" /><meta property="og:type" content="website" /><meta property="og:image" content="img/guard-tower-small.jpg" /><meta property="og:description" content="Investigando datos raspan del Sheriff del Condado de Cook Inmate Locator." />
git add index.htmlgit commit -m "incorporar metadatos y icono"
4.7 index.html: CSS
Add stylesheet links. Here you load Bootstrap, Font Awesome, the Radley webfont, and our custom stylesheet. Youwill also add “shims” in this section, which will make your site work better with older browsers.
<!-- CSS --><link rel="stylesheet" type="text/css" href="http://cdnjs.cloudflare.com/ajax/libs/twitter-bootstrap/3.1.1/css/bootstrap.min.css" /><link rel="stylesheet" type="text/css" href="http://cdnjs.cloudflare.com/ajax/libs/font-awesome/4.0.3/css/font-awesome.min.css" /><link href=’http://fonts.googleapis.com/css?family=Radley:400’ rel=’stylesheet’ type=’text/css’><link rel="stylesheet" type="text/css" href="css/style.css" />
<!--[if lt IE 9]><script src="https://oss.maxcdn.com/libs/html5shiv/3.7.0/html5shiv.js"></script><script src="https://oss.maxcdn.com/libs/respond.js/1.4.2/respond.min.js"></script>
<![endif]-->
git add index.htmlgit commit -m "incorporar hojas de estilo"
Note: This project relies heavily on content delivery network (CDN) versions of popular libraries and fonts. If yourInternet access is spotty, you’ll want to download these files to your computer and check them into your repository.bower is highly recommended for easy installation of popular Javascript libraries.
4.8 index.html: Analytics
When you set up the skeleton, we made a terrible omission. Most real world pages should have some form of analytics.That’s easy enough to fix. Let’s add Google analytics to the <head> ... </head>.
<!-- Analíticas --><script>
var _gaq = _gaq || [];_gaq.push([’_setAccount’, ’UA-XXXXXXX-XX’]);_gaq.push([’_trackPageview’]);
(function() {var ga = document.createElement(’script’); ga.type = ’text/javascript’; ga.async = true;ga.src = (’https:’ == document.location.protocol ? ’https://ssl’ : ’http://www’) + ’.google-analytics.com/ga.js’;var s = document.getElementsByTagName(’script’)[0]; s.parentNode.insertBefore(ga, s);
4.7. index.html: CSS 15
Migrahack: Responsive Data Visualization Tutorial, Release
})();</script>
git add index.htmlgit commit -m "incorporar analíticas"
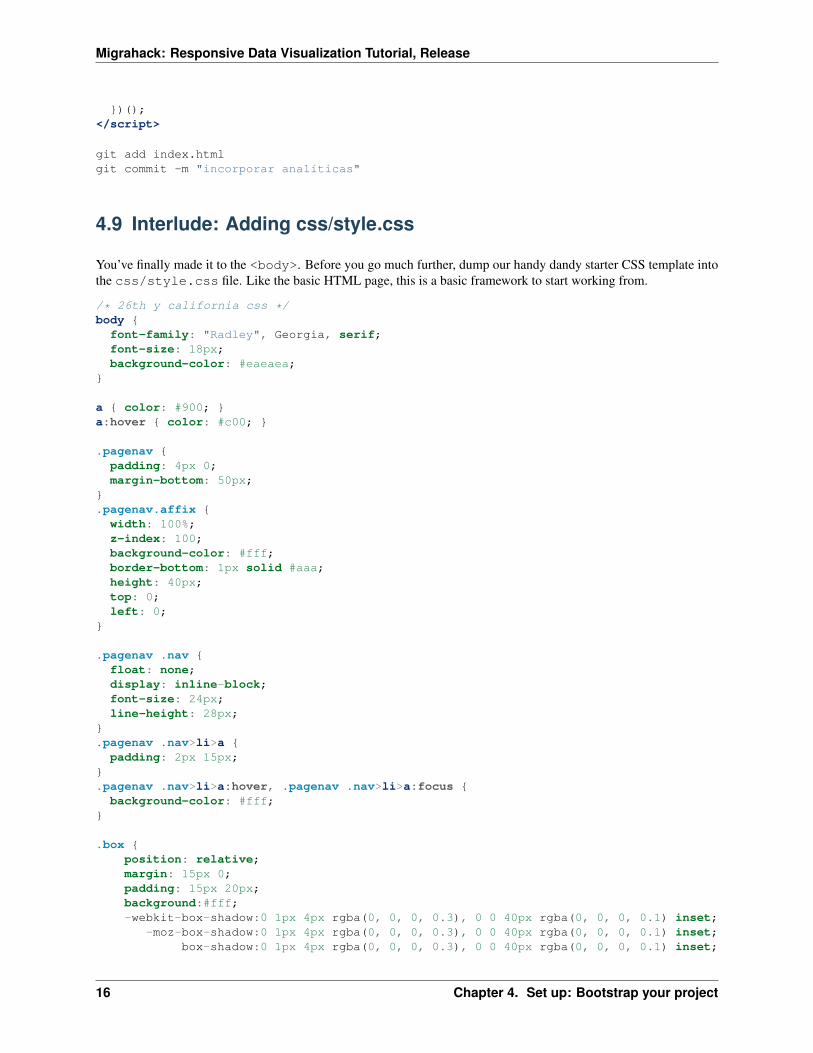
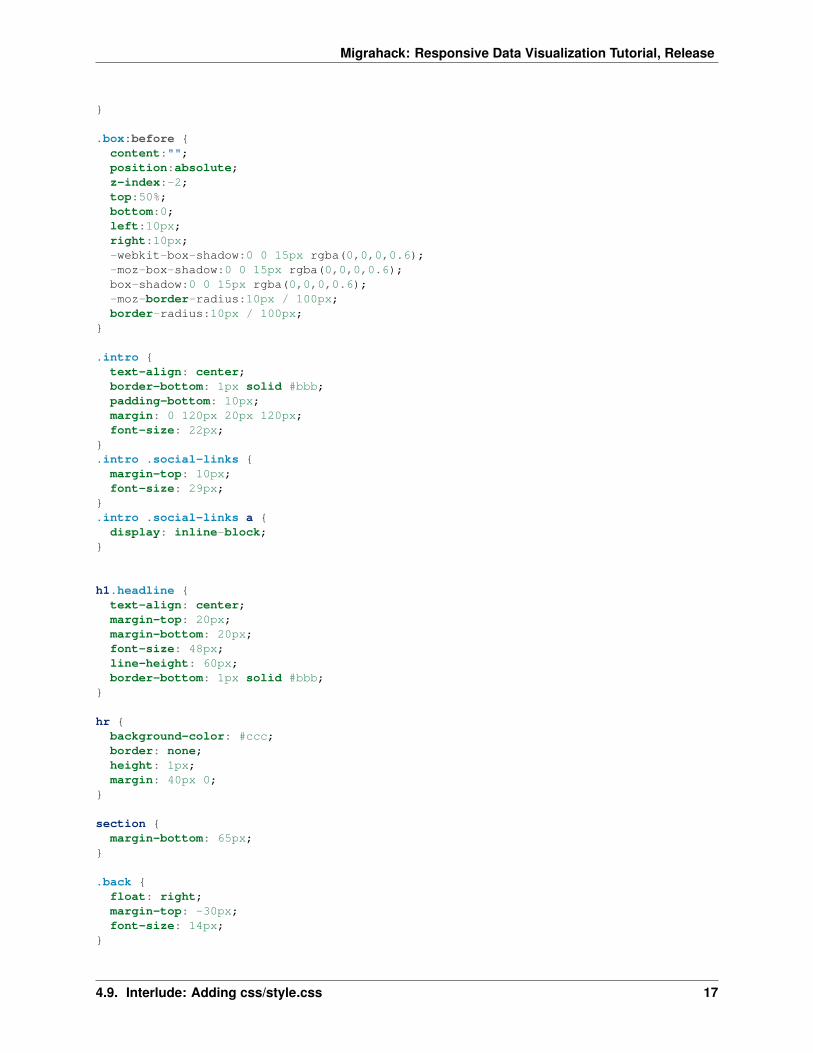
4.9 Interlude: Adding css/style.css
You’ve finally made it to the <body>. Before you go much further, dump our handy dandy starter CSS template intothe css/style.css file. Like the basic HTML page, this is a basic framework to start working from.
/* 26th y california css */body {
font-family: "Radley", Georgia, serif;font-size: 18px;background-color: #eaeaea;
}
a { color: #900; }a:hover { color: #c00; }
.pagenav {padding: 4px 0;margin-bottom: 50px;
}.pagenav.affix {
width: 100%;z-index: 100;background-color: #fff;border-bottom: 1px solid #aaa;height: 40px;top: 0;left: 0;
}
.pagenav .nav {float: none;display: inline-block;font-size: 24px;line-height: 28px;
}.pagenav .nav>li>a {
padding: 2px 15px;}.pagenav .nav>li>a:hover, .pagenav .nav>li>a:focus {
background-color: #fff;}
.box {position: relative;margin: 15px 0;padding: 15px 20px;background:#fff;-webkit-box-shadow:0 1px 4px rgba(0, 0, 0, 0.3), 0 0 40px rgba(0, 0, 0, 0.1) inset;
-moz-box-shadow:0 1px 4px rgba(0, 0, 0, 0.3), 0 0 40px rgba(0, 0, 0, 0.1) inset;box-shadow:0 1px 4px rgba(0, 0, 0, 0.3), 0 0 40px rgba(0, 0, 0, 0.1) inset;
16 Chapter 4. Set up: Bootstrap your project
Migrahack: Responsive Data Visualization Tutorial, Release
}
.box:before {content:"";position:absolute;z-index:-2;top:50%;bottom:0;left:10px;right:10px;-webkit-box-shadow:0 0 15px rgba(0,0,0,0.6);-moz-box-shadow:0 0 15px rgba(0,0,0,0.6);box-shadow:0 0 15px rgba(0,0,0,0.6);-moz-border-radius:10px / 100px;border-radius:10px / 100px;
}
.intro {text-align: center;border-bottom: 1px solid #bbb;padding-bottom: 10px;margin: 0 120px 20px 120px;font-size: 22px;
}.intro .social-links {
margin-top: 10px;font-size: 29px;
}.intro .social-links a {
display: inline-block;}
h1.headline {text-align: center;margin-top: 20px;margin-bottom: 20px;font-size: 48px;line-height: 60px;border-bottom: 1px solid #bbb;
}
hr {background-color: #ccc;border: none;height: 1px;margin: 40px 0;
}
section {margin-bottom: 65px;
}
.back {float: right;margin-top: -30px;font-size: 14px;
}
4.9. Interlude: Adding css/style.css 17
Migrahack: Responsive Data Visualization Tutorial, Release
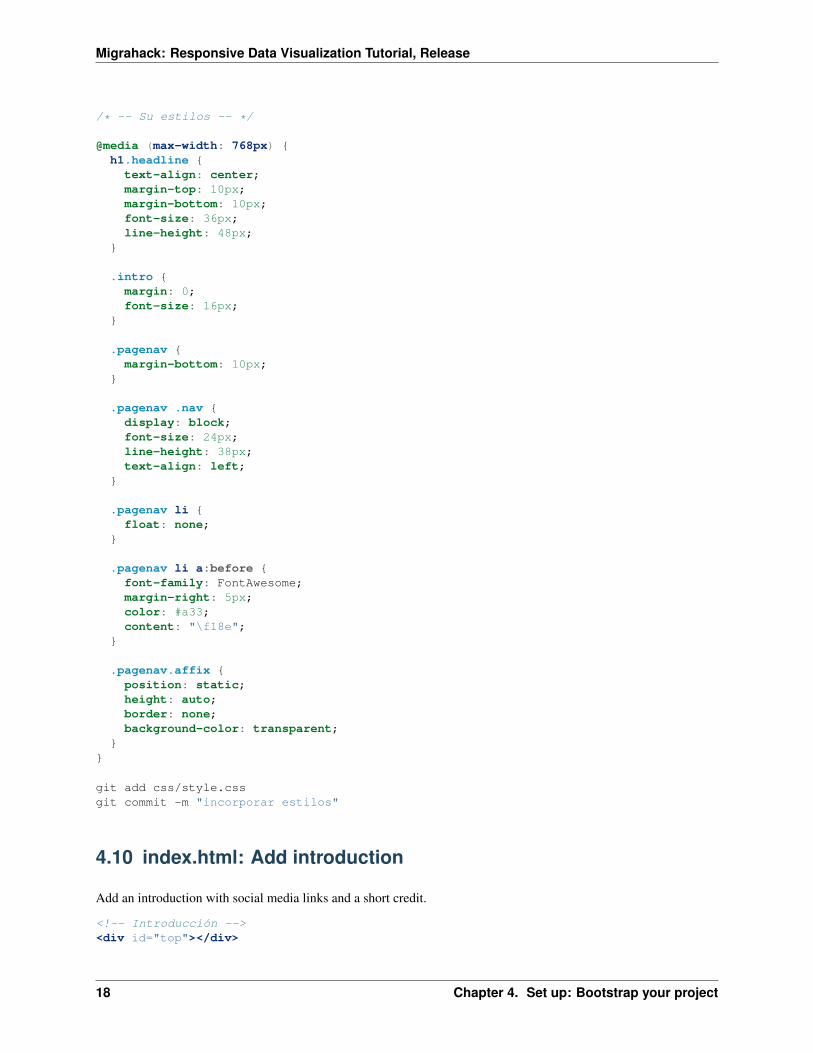
/* -- Su estilos -- */
@media (max-width: 768px) {h1.headline {text-align: center;margin-top: 10px;margin-bottom: 10px;font-size: 36px;line-height: 48px;
}
.intro {margin: 0;font-size: 16px;
}
.pagenav {margin-bottom: 10px;
}
.pagenav .nav {display: block;font-size: 24px;line-height: 38px;text-align: left;
}
.pagenav li {float: none;
}
.pagenav li a:before {font-family: FontAwesome;margin-right: 5px;color: #a33;content: "\f18e";
}
.pagenav.affix {position: static;height: auto;border: none;background-color: transparent;
}}
git add css/style.cssgit commit -m "incorporar estilos"
4.10 index.html: Add introduction
Add an introduction with social media links and a short credit.
<!-- Introducción --><div id="top"></div>
18 Chapter 4. Set up: Bootstrap your project
Migrahack: Responsive Data Visualization Tutorial, Release
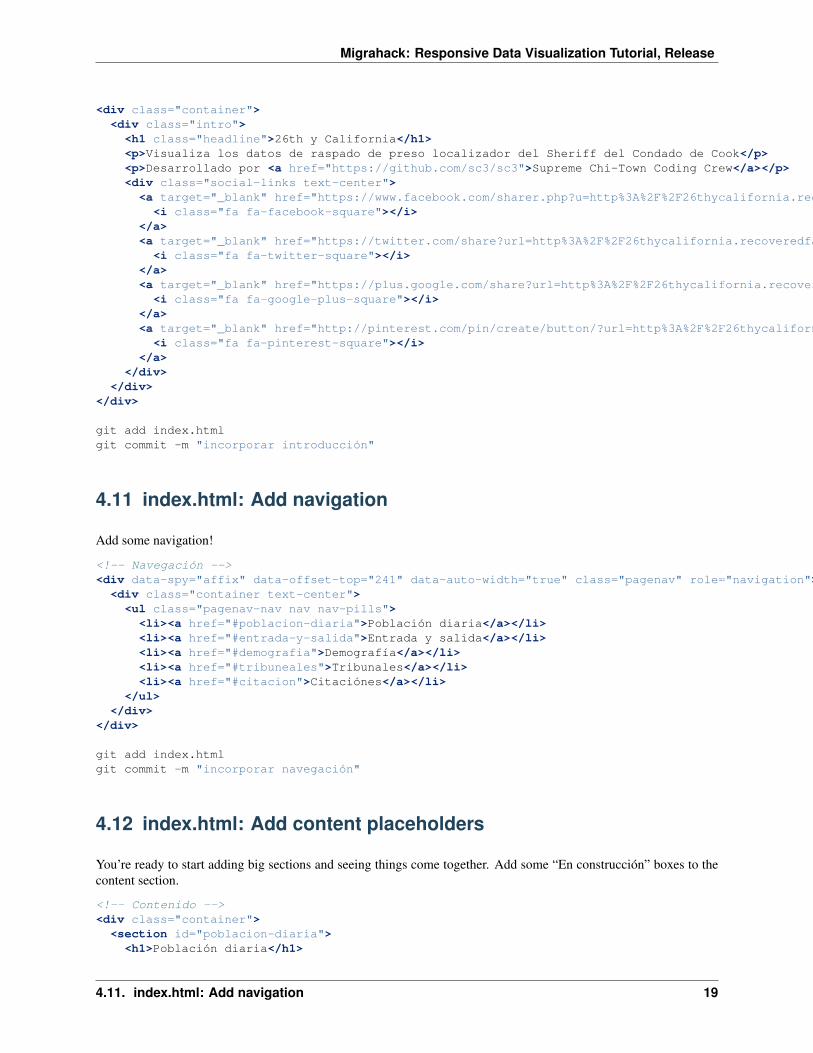
<div class="container"><div class="intro"><h1 class="headline">26th y California</h1><p>Visualiza los datos de raspado de preso localizador del Sheriff del Condado de Cook</p><p>Desarrollado por <a href="https://github.com/sc3/sc3">Supreme Chi-Town Coding Crew</a></p><div class="social-links text-center"><a target="_blank" href="https://www.facebook.com/sharer.php?u=http%3A%2F%2F26thycalifornia.recoveredfactory.net&t=26th+y+California">
<i class="fa fa-facebook-square"></i></a><a target="_blank" href="https://twitter.com/share?url=http%3A%2F%2F26thycalifornia.recoveredfactory.net&text=26th+y+California">
<i class="fa fa-twitter-square"></i></a><a target="_blank" href="https://plus.google.com/share?url=http%3A%2F%2F26thycalifornia.recoveredfactory.net"><i class="fa fa-google-plus-square"></i>
</a><a target="_blank" href="http://pinterest.com/pin/create/button/?url=http%3A%2F%2F26thycalifornia.recoveredfactory.net&media=http%3A%2F%2F26thycalifornia.recoveredfactory.net%2Fimg%2Fguard-tower-large.jpg&description=26th+y+California">
<i class="fa fa-pinterest-square"></i></a>
</div></div>
</div>
git add index.htmlgit commit -m "incorporar introducción"
4.11 index.html: Add navigation
Add some navigation!
<!-- Navegación --><div data-spy="affix" data-offset-top="241" data-auto-width="true" class="pagenav" role="navigation">
<div class="container text-center"><ul class="pagenav-nav nav nav-pills"><li><a href="#poblacion-diaria">Población diaria</a></li><li><a href="#entrada-y-salida">Entrada y salida</a></li><li><a href="#demografia">Demografía</a></li><li><a href="#tribuneales">Tribunales</a></li><li><a href="#citacion">Citaciónes</a></li>
</ul></div>
</div>
git add index.htmlgit commit -m "incorporar navegación"
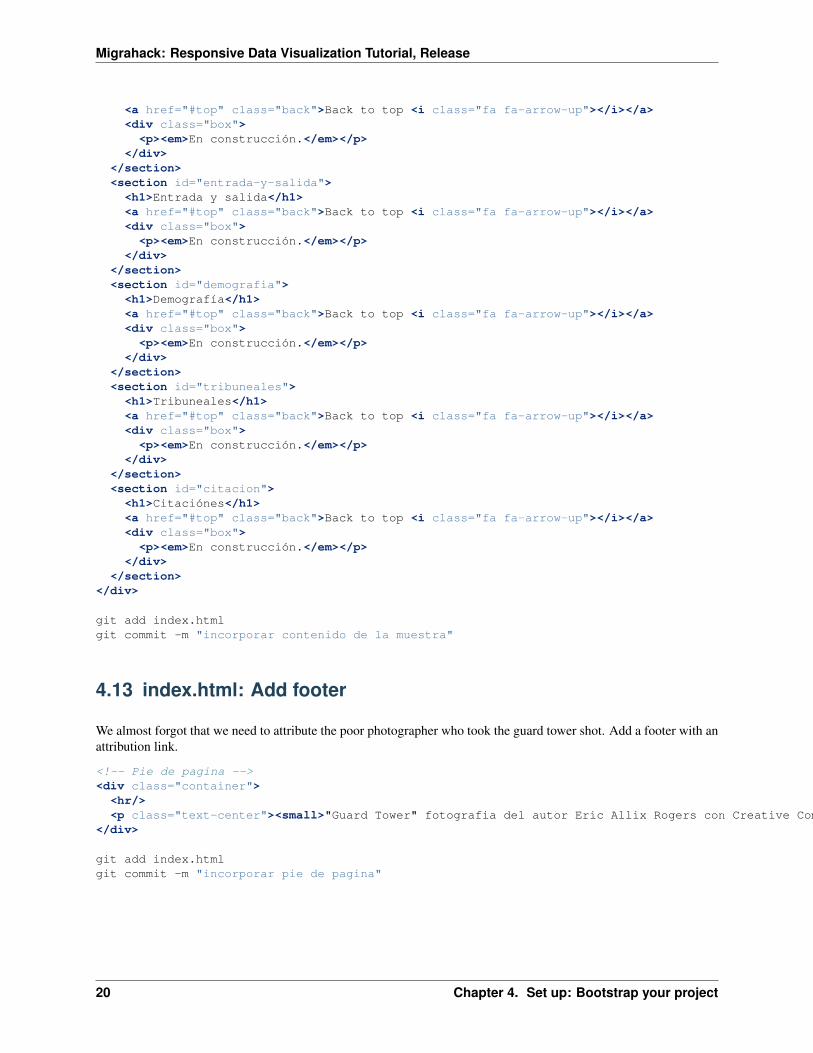
4.12 index.html: Add content placeholders
You’re ready to start adding big sections and seeing things come together. Add some “En construcción” boxes to thecontent section.
<!-- Contenido --><div class="container">
<section id="poblacion-diaria"><h1>Población diaria</h1>
4.11. index.html: Add navigation 19
Migrahack: Responsive Data Visualization Tutorial, Release
<a href="#top" class="back">Back to top <i class="fa fa-arrow-up"></i></a><div class="box"><p><em>En construcción.</em></p>
</div></section><section id="entrada-y-salida"><h1>Entrada y salida</h1><a href="#top" class="back">Back to top <i class="fa fa-arrow-up"></i></a><div class="box"><p><em>En construcción.</em></p>
</div></section><section id="demografia"><h1>Demografía</h1><a href="#top" class="back">Back to top <i class="fa fa-arrow-up"></i></a><div class="box"><p><em>En construcción.</em></p>
</div></section><section id="tribuneales"><h1>Tribuneales</h1><a href="#top" class="back">Back to top <i class="fa fa-arrow-up"></i></a><div class="box"><p><em>En construcción.</em></p>
</div></section><section id="citacion"><h1>Citaciónes</h1><a href="#top" class="back">Back to top <i class="fa fa-arrow-up"></i></a><div class="box"><p><em>En construcción.</em></p>
</div></section>
</div>
git add index.htmlgit commit -m "incorporar contenido de la muestra"
4.13 index.html: Add footer
We almost forgot that we need to attribute the poor photographer who took the guard tower shot. Add a footer with anattribution link.
<!-- Pie de pagina --><div class="container">
<hr/><p class="text-center"><small>"Guard Tower" fotografia del autor Eric Allix Rogers con Creative Commons <a href="https://creativecommons.org/licenses/by-nc-sa/2.0/">Attribution-NonCommercial-ShareAlike 2.0</a></small></p>
</div>
git add index.htmlgit commit -m "incorporar pie de pagina"
20 Chapter 4. Set up: Bootstrap your project
Migrahack: Responsive Data Visualization Tutorial, Release
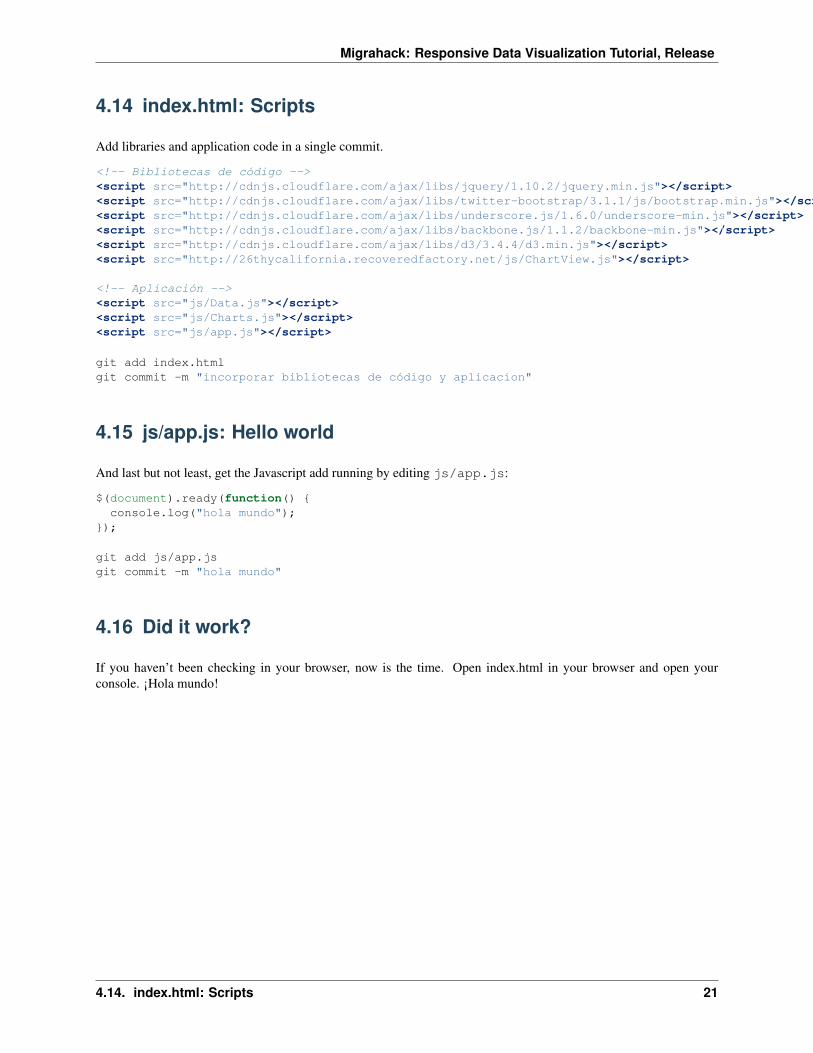
4.14 index.html: Scripts
Add libraries and application code in a single commit.
<!-- Bibliotecas de código --><script src="http://cdnjs.cloudflare.com/ajax/libs/jquery/1.10.2/jquery.min.js"></script><script src="http://cdnjs.cloudflare.com/ajax/libs/twitter-bootstrap/3.1.1/js/bootstrap.min.js"></script><script src="http://cdnjs.cloudflare.com/ajax/libs/underscore.js/1.6.0/underscore-min.js"></script><script src="http://cdnjs.cloudflare.com/ajax/libs/backbone.js/1.1.2/backbone-min.js"></script><script src="http://cdnjs.cloudflare.com/ajax/libs/d3/3.4.4/d3.min.js"></script><script src="http://26thycalifornia.recoveredfactory.net/js/ChartView.js"></script>
<!-- Aplicación --><script src="js/Data.js"></script><script src="js/Charts.js"></script><script src="js/app.js"></script>
git add index.htmlgit commit -m "incorporar bibliotecas de código y aplicacion"
4.15 js/app.js: Hello world
And last but not least, get the Javascript add running by editing js/app.js:
$(document).ready(function() {console.log("hola mundo");
});
git add js/app.jsgit commit -m "hola mundo"
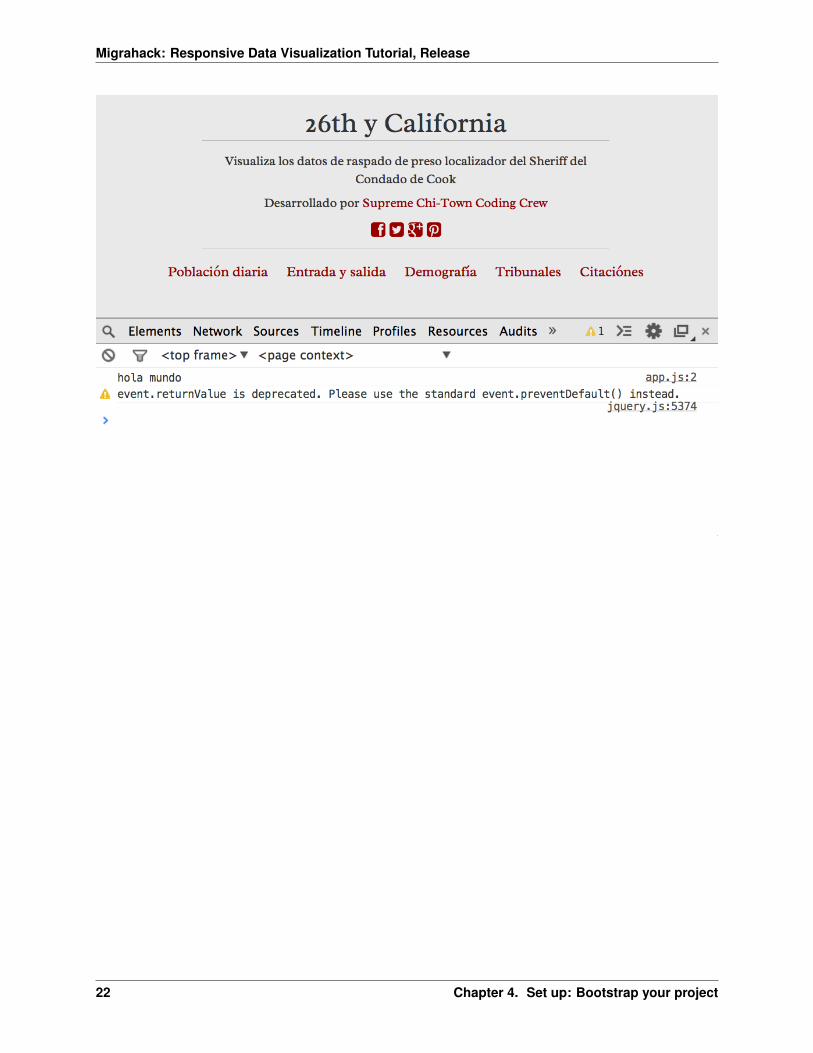
4.16 Did it work?
If you haven’t been checking in your browser, now is the time. Open index.html in your browser and open yourconsole. ¡Hola mundo!
4.14. index.html: Scripts 21
Migrahack: Responsive Data Visualization Tutorial, Release
22 Chapter 4. Set up: Bootstrap your project
CHAPTER 5
Build: Getting set up
You will now build some Javascript tools to process and analyze the daily population data from the jail.
5.1 Download
If you skipped the setup section, you’ll need to download the source code.
5.2 Create placeholders
Open index.html in your editor. Find the section associated with the jail population:
<section id="poblacion-diaria"><h1>Población diaria</h1><a href="#top" class="back">Back to top <i class="fa fa-arrow-up"></i></a><div class="box"><p><em>En construcción.</em></p>
</div></section>
There it is! And construcción is now happening. You should stub out the basic architecture. In this case it will be awide column for a chart and a narrow column for some statistics.
<section id="poblacion-diaria"><h1>Población diaria</h1><a href="#top" class="back">Back to top <i class="fa fa-arrow-up"></i></a><div class="row"><div class="col-md-8"><h2>grafico venir</h2>
</div><div class="col-md-4">
<div class="box"><h2>tabla venir</h2>
</div></div>
</div></section>
Now commit your changes!
23
Migrahack: Responsive Data Visualization Tutorial, Release
git commit -am "incorporar avisos a ’venir’ a seccion poblacion"
Note: Did you notice how we used the -a flag in git commit -am <message>? This commits all modifiedfiles in your repository, sight unseen. It’s effiecient, but should be used with care. For the rest of the tutorial we’ll useit exclusively except when adding new files. Commit messages will no longer come with any description but simplyfollow every code block.
5.3 Build: Set up Backbone collection
You will first need a way of accessing and processing your data.
Open js/Data.js to create a Backbone collection to keep track of the data.
var DailyPopulationCollection = Backbone.Collection.extend({url: ’data/daily_population.json’
});
Hmmm, that didn’t seem very hard. What will this do for you?
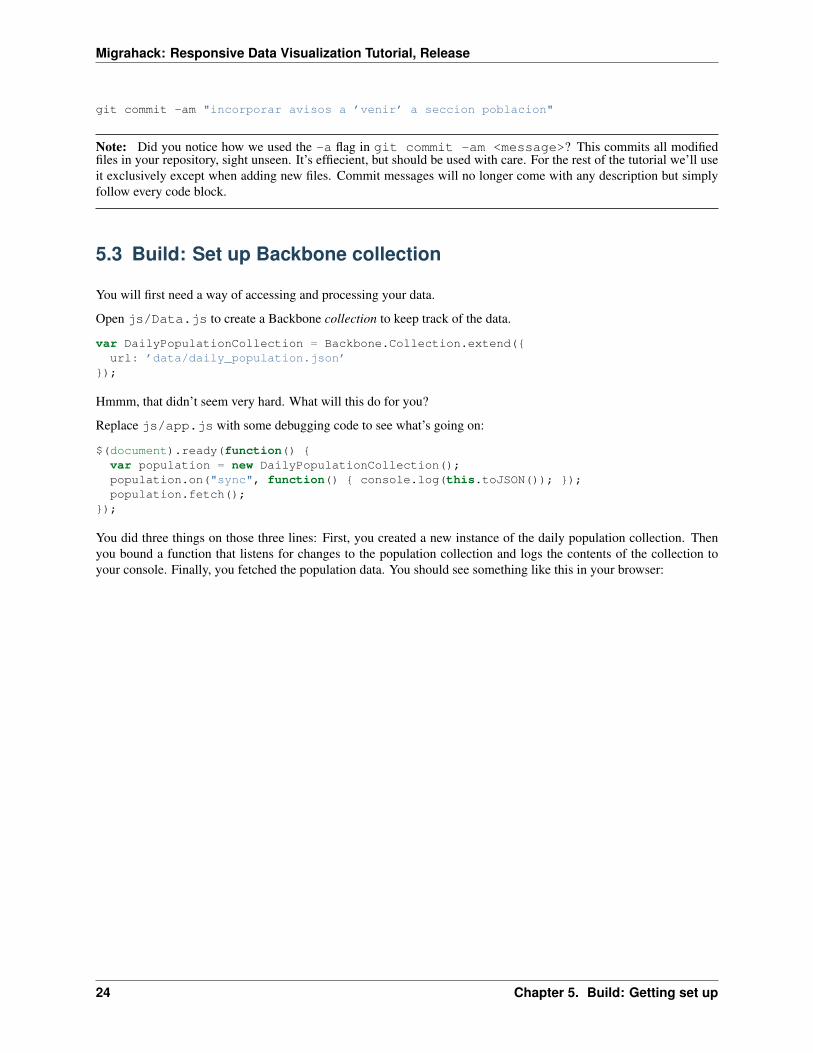
Replace js/app.js with some debugging code to see what’s going on:
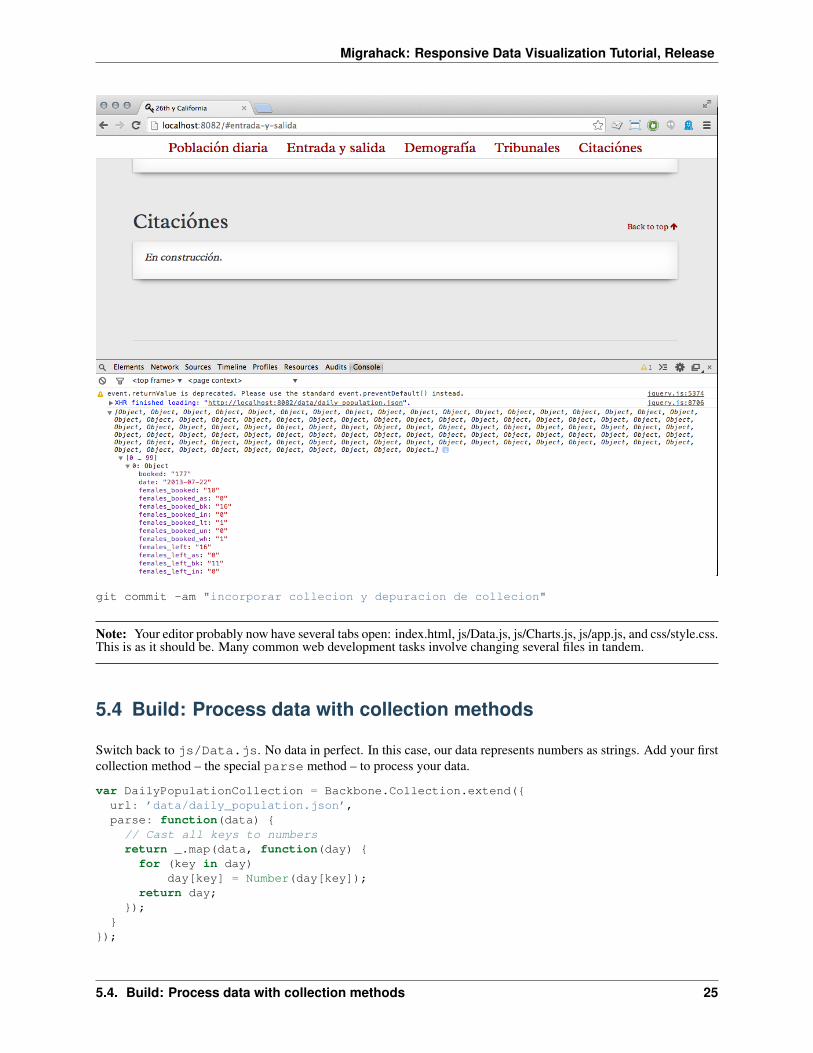
$(document).ready(function() {var population = new DailyPopulationCollection();population.on("sync", function() { console.log(this.toJSON()); });population.fetch();
});
You did three things on those three lines: First, you created a new instance of the daily population collection. Thenyou bound a function that listens for changes to the population collection and logs the contents of the collection toyour console. Finally, you fetched the population data. You should see something like this in your browser:
24 Chapter 5. Build: Getting set up
Migrahack: Responsive Data Visualization Tutorial, Release
git commit -am "incorporar collecion y depuracion de collecion"
Note: Your editor probably now have several tabs open: index.html, js/Data.js, js/Charts.js, js/app.js, and css/style.css.This is as it should be. Many common web development tasks involve changing several files in tandem.
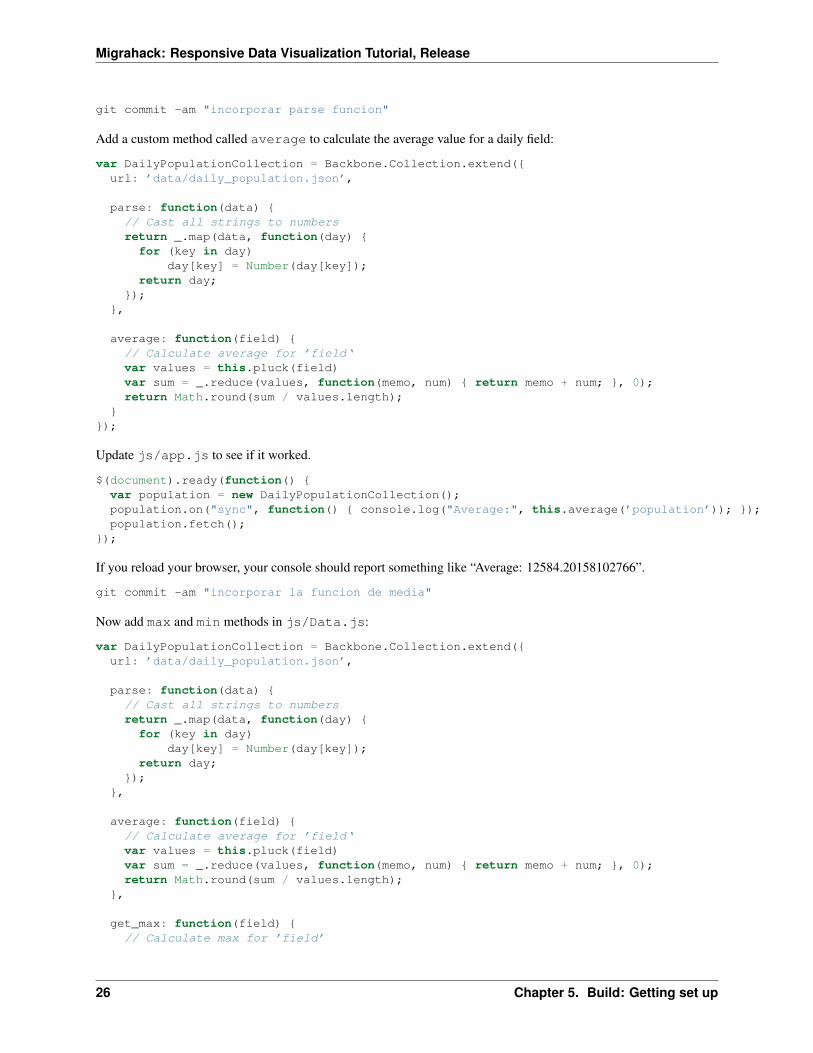
5.4 Build: Process data with collection methods
Switch back to js/Data.js. No data in perfect. In this case, our data represents numbers as strings. Add your firstcollection method – the special parse method – to process your data.
var DailyPopulationCollection = Backbone.Collection.extend({url: ’data/daily_population.json’,parse: function(data) {// Cast all keys to numbersreturn _.map(data, function(day) {for (key in day)
day[key] = Number(day[key]);return day;
});}
});
5.4. Build: Process data with collection methods 25
Migrahack: Responsive Data Visualization Tutorial, Release
git commit -am "incorporar parse funcion"
Add a custom method called average to calculate the average value for a daily field:
var DailyPopulationCollection = Backbone.Collection.extend({url: ’data/daily_population.json’,
parse: function(data) {// Cast all strings to numbersreturn _.map(data, function(day) {for (key in day)
day[key] = Number(day[key]);return day;
});},
average: function(field) {// Calculate average for ’field‘var values = this.pluck(field)var sum = _.reduce(values, function(memo, num) { return memo + num; }, 0);return Math.round(sum / values.length);
}});
Update js/app.js to see if it worked.
$(document).ready(function() {var population = new DailyPopulationCollection();population.on("sync", function() { console.log("Average:", this.average(’population’)); });population.fetch();
});
If you reload your browser, your console should report something like “Average: 12584.20158102766”.
git commit -am "incorporar la funcion de media"
Now add max and min methods in js/Data.js:
var DailyPopulationCollection = Backbone.Collection.extend({url: ’data/daily_population.json’,
parse: function(data) {// Cast all strings to numbersreturn _.map(data, function(day) {for (key in day)
day[key] = Number(day[key]);return day;
});},
average: function(field) {// Calculate average for ’field‘var values = this.pluck(field)var sum = _.reduce(values, function(memo, num) { return memo + num; }, 0);return Math.round(sum / values.length);
},
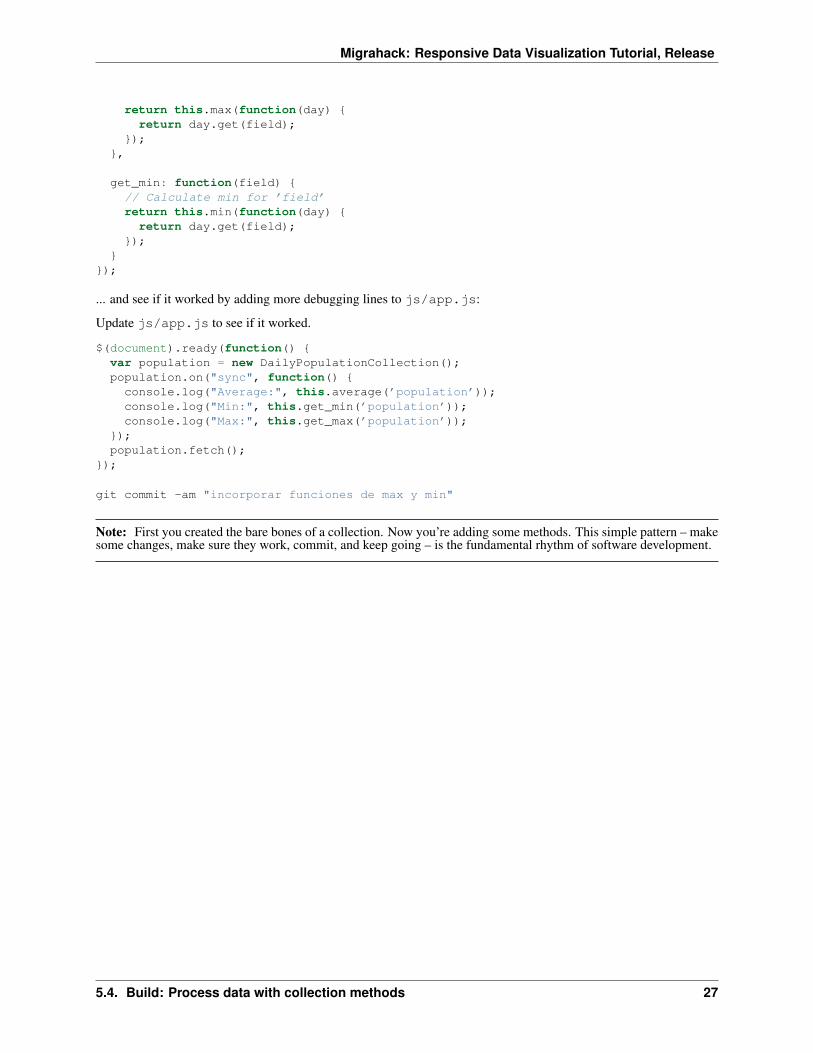
get_max: function(field) {// Calculate max for ’field’
26 Chapter 5. Build: Getting set up
Migrahack: Responsive Data Visualization Tutorial, Release
return this.max(function(day) {return day.get(field);
});},
get_min: function(field) {// Calculate min for ’field’return this.min(function(day) {
return day.get(field);});
}});
... and see if it worked by adding more debugging lines to js/app.js:
Update js/app.js to see if it worked.
$(document).ready(function() {var population = new DailyPopulationCollection();population.on("sync", function() {console.log("Average:", this.average(’population’));console.log("Min:", this.get_min(’population’));console.log("Max:", this.get_max(’population’));
});population.fetch();
});
git commit -am "incorporar funciones de max y min"
Note: First you created the bare bones of a collection. Now you’re adding some methods. This simple pattern – makesome changes, make sure they work, commit, and keep going – is the fundamental rhythm of software development.
5.4. Build: Process data with collection methods 27

Migrahack: Responsive Data Visualization Tutorial, Release
28 Chapter 5. Build: Getting set up
CHAPTER 6
Build: Make a table
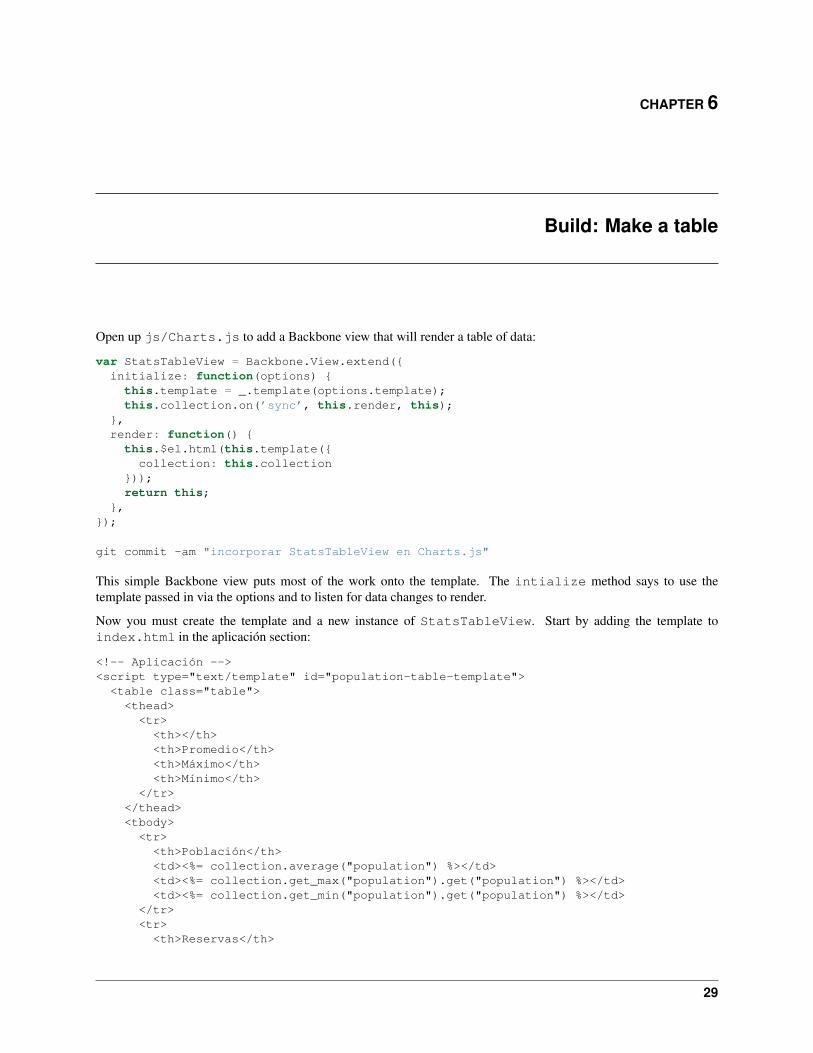
Open up js/Charts.js to add a Backbone view that will render a table of data:
var StatsTableView = Backbone.View.extend({initialize: function(options) {this.template = _.template(options.template);this.collection.on(’sync’, this.render, this);
},render: function() {this.$el.html(this.template({collection: this.collection
}));return this;
},});
git commit -am "incorporar StatsTableView en Charts.js"
This simple Backbone view puts most of the work onto the template. The intialize method says to use thetemplate passed in via the options and to listen for data changes to render.
Now you must create the template and a new instance of StatsTableView. Start by adding the template toindex.html in the aplicación section:
<!-- Aplicación --><script type="text/template" id="population-table-template">
<table class="table"><thead>
<tr><th></th><th>Promedio</th><th>Máximo</th><th>Mínimo</th>
</tr></thead><tbody>
<tr><th>Población</th><td><%= collection.average("population") %></td><td><%= collection.get_max("population").get("population") %></td><td><%= collection.get_min("population").get("population") %></td>
</tr><tr>
<th>Reservas</th>
29
Migrahack: Responsive Data Visualization Tutorial, Release
<td><%= collection.average("booked") %></td><td><%= collection.get_max("booked").get("booked") %></td><td><%= collection.get_min("booked").get("booked") %></td>
</tr><tr>
<th>Mutis</th><td><%= collection.average("left") %></td><td><%= collection.get_max("left").get("left") %></td><td><%= collection.get_min("left").get("left") %></td>
</tr></tbody>
</table></script><script src="js/Data.js"></script><script src="js/Charts.js"></script><script src="js/app.js"></script>
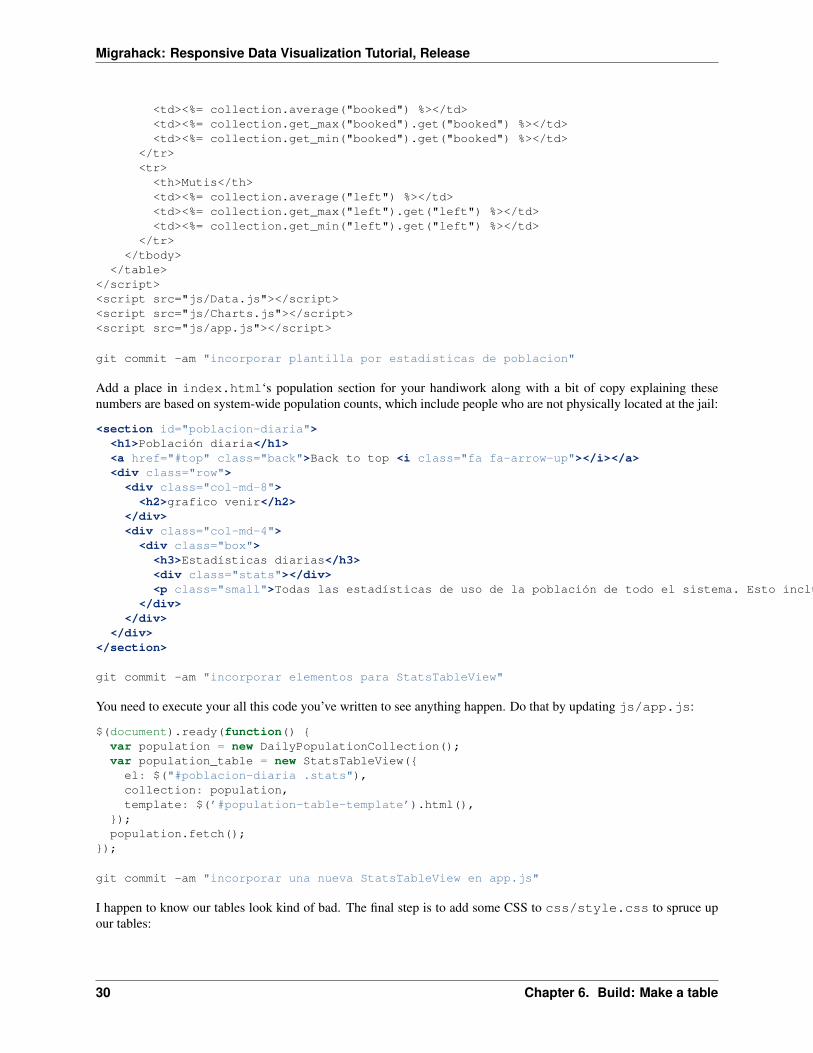
git commit -am "incorporar plantilla por estadisticas de poblacion"
Add a place in index.html‘s population section for your handiwork along with a bit of copy explaining thesenumbers are based on system-wide population counts, which include people who are not physically located at the jail:
<section id="poblacion-diaria"><h1>Población diaria</h1><a href="#top" class="back">Back to top <i class="fa fa-arrow-up"></i></a><div class="row"><div class="col-md-8"><h2>grafico venir</h2>
</div><div class="col-md-4">
<div class="box"><h3>Estadísticas diarias</h3><div class="stats"></div><p class="small">Todas las estadísticas de uso de la población de todo el sistema. Esto incluye prisioneros que no están alojados físicamente en la cárcel.</p>
</div></div>
</div></section>
git commit -am "incorporar elementos para StatsTableView"
You need to execute your all this code you’ve written to see anything happen. Do that by updating js/app.js:
$(document).ready(function() {var population = new DailyPopulationCollection();var population_table = new StatsTableView({el: $("#poblacion-diaria .stats"),collection: population,template: $(’#population-table-template’).html(),
});population.fetch();
});
git commit -am "incorporar una nueva StatsTableView en app.js"
I happen to know our tables look kind of bad. The final step is to add some CSS to css/style.css to spruce upour tables:
30 Chapter 6. Build: Make a table
Migrahack: Responsive Data Visualization Tutorial, Release
/* -- Su estilos -- */
.table {font-family: "Helvetica Neue", Helvetica, Arial, sans-serif;font-size: 14px;
}.table thead th,.table tbody td {
text-align: right;}
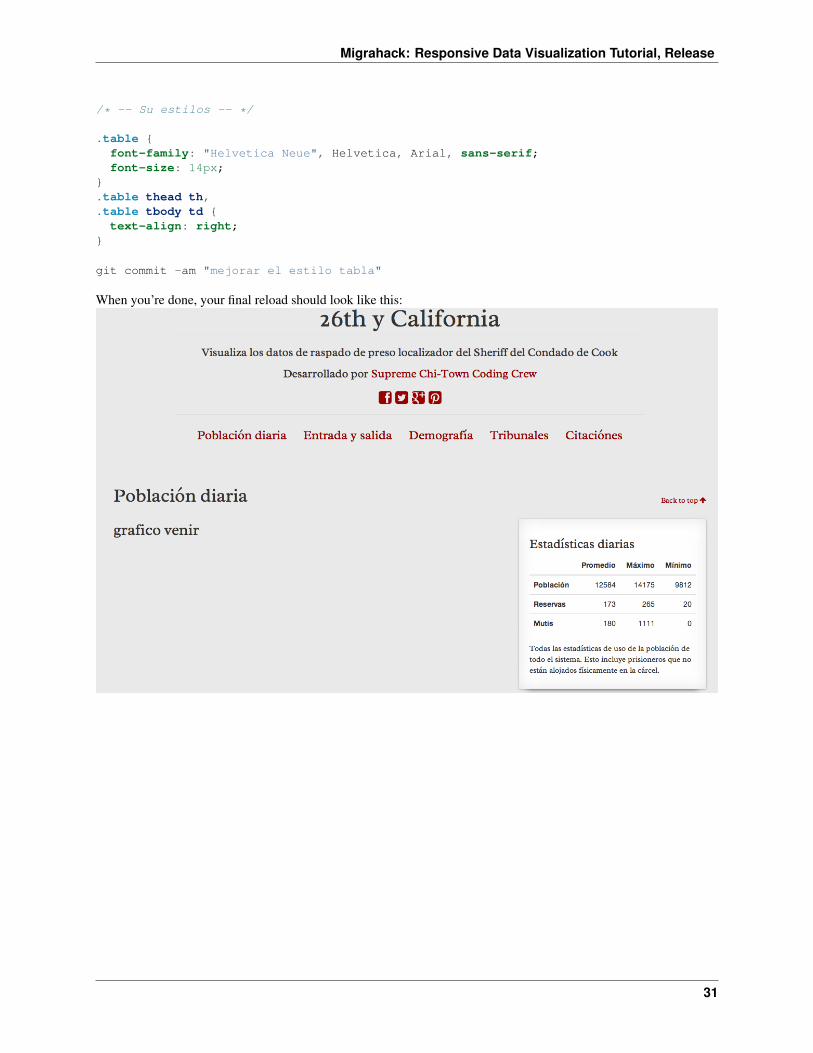
git commit -am "mejorar el estilo tabla"
When you’re done, your final reload should look like this:
31

Migrahack: Responsive Data Visualization Tutorial, Release
32 Chapter 6. Build: Make a table
CHAPTER 7
Break: Taking stock
You’ve now set up a project. You’ve created a Backbone collection to manage some data. You’ve added methods tothe collection to calculate summary values. You’ve created a Backbone view that listens for the collection to changeand renders a table of summary values.
33

Migrahack: Responsive Data Visualization Tutorial, Release
34 Chapter 7. Break: Taking stock
CHAPTER 8
Build: Make a time-series bar chart
Buckle your seatbelt, it’s finally time to make a chart with D3. You will be assisted in your efforts by the ChicagoTribune’s lightweight ChartView library.
8.1 A basic chart view
ChartView is intended to be extended, just like a regular Backbone View. Open up js/Charts.js and add asimple chart view:
var DailyPopulationChartView = ChartView.extend({draw: function() {this.$el.html(’¡Hola mundo!’);return this;
},});
git commit -am "incorporar DailyPopulationChartView"
When creating a ChartView, you must supply a collection. The ChartView automatically listens for changes to thecollection and re-renders when they occur.
All you need to do to make a ChartView work is to extend ChartView with your own chart class and specify adraw method. Then create a new instance with something like new MyChartView({el: $("#myel"),collection: mycollection}).
To make it work here, first add an empty <div class="chart"> to the poblacion-diaria section ofindex.html. This element will be your chart’s container.
<section id="poblacion-diaria"><h1>Población diaria</h1><a href="#top" class="back">Back to top <i class="fa fa-arrow-up"></i></a><div class="row"><div class="col-md-8"><div class="chart"></div>
</div><div class="col-md-4">
<div class="box"><h3>Estadísticas diarias</h3><div class="stats"></div><p class="small">Todas las estadísticas de uso de la población de todo el sistema. Esto incluye prisioneros que no están alojados físicamente en la cárcel.</p>
</div></div>
35
Migrahack: Responsive Data Visualization Tutorial, Release
</div></section>
git commit -am "incorporar elemento para DailyPopulationChartView"
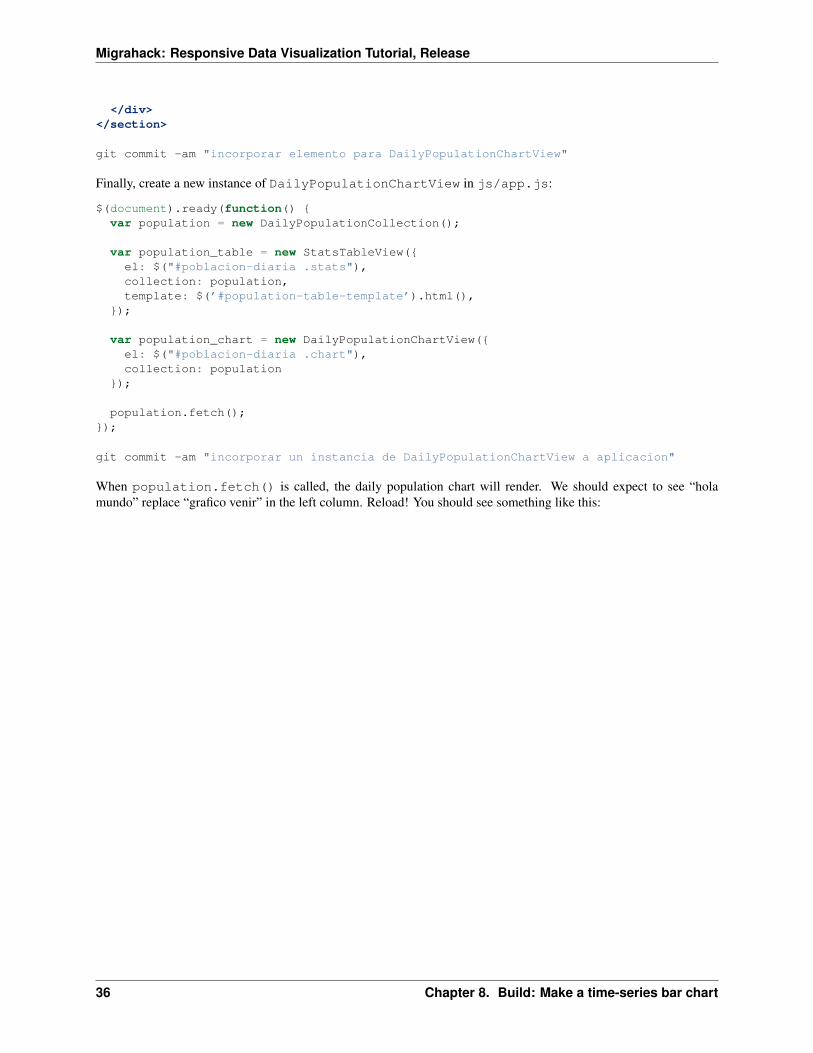
Finally, create a new instance of DailyPopulationChartView in js/app.js:
$(document).ready(function() {var population = new DailyPopulationCollection();
var population_table = new StatsTableView({el: $("#poblacion-diaria .stats"),collection: population,template: $(’#population-table-template’).html(),
});
var population_chart = new DailyPopulationChartView({el: $("#poblacion-diaria .chart"),collection: population
});
population.fetch();});
git commit -am "incorporar un instancia de DailyPopulationChartView a aplicacion"
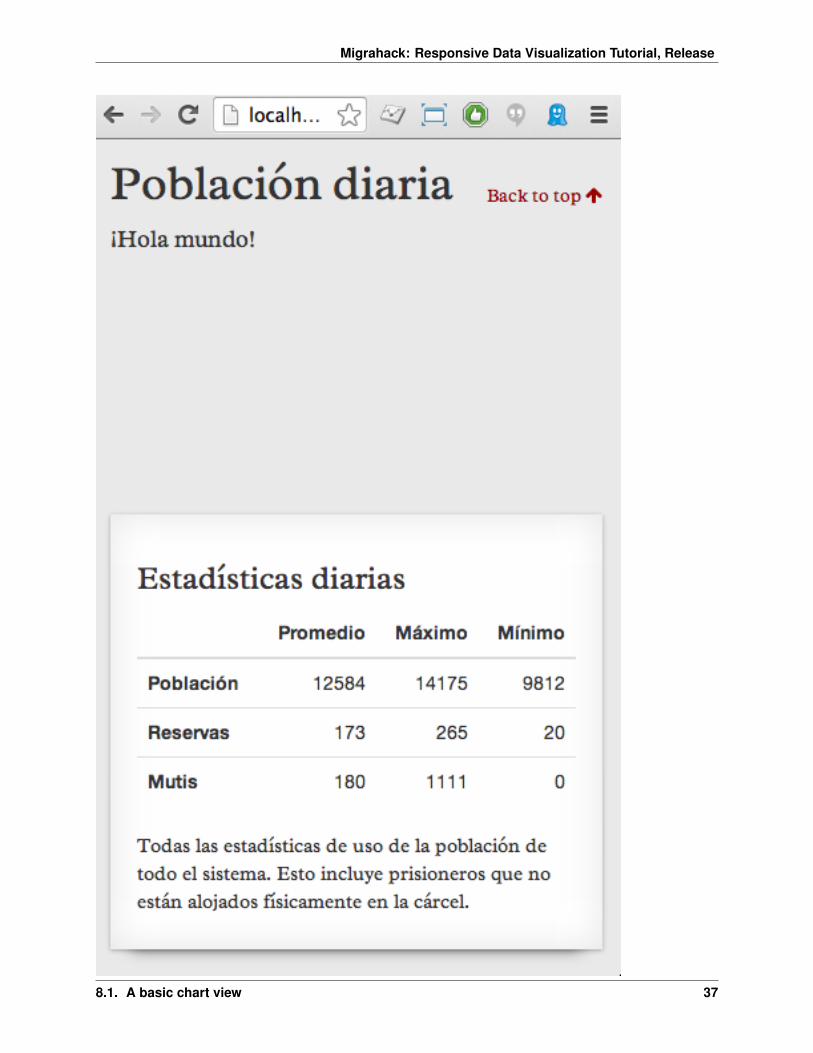
When population.fetch() is called, the daily population chart will render. We should expect to see “holamundo” replace “grafico venir” in the left column. Reload! You should see something like this:
36 Chapter 8. Build: Make a time-series bar chart
Migrahack: Responsive Data Visualization Tutorial, Release
8.1. A basic chart view 37
Migrahack: Responsive Data Visualization Tutorial, Release
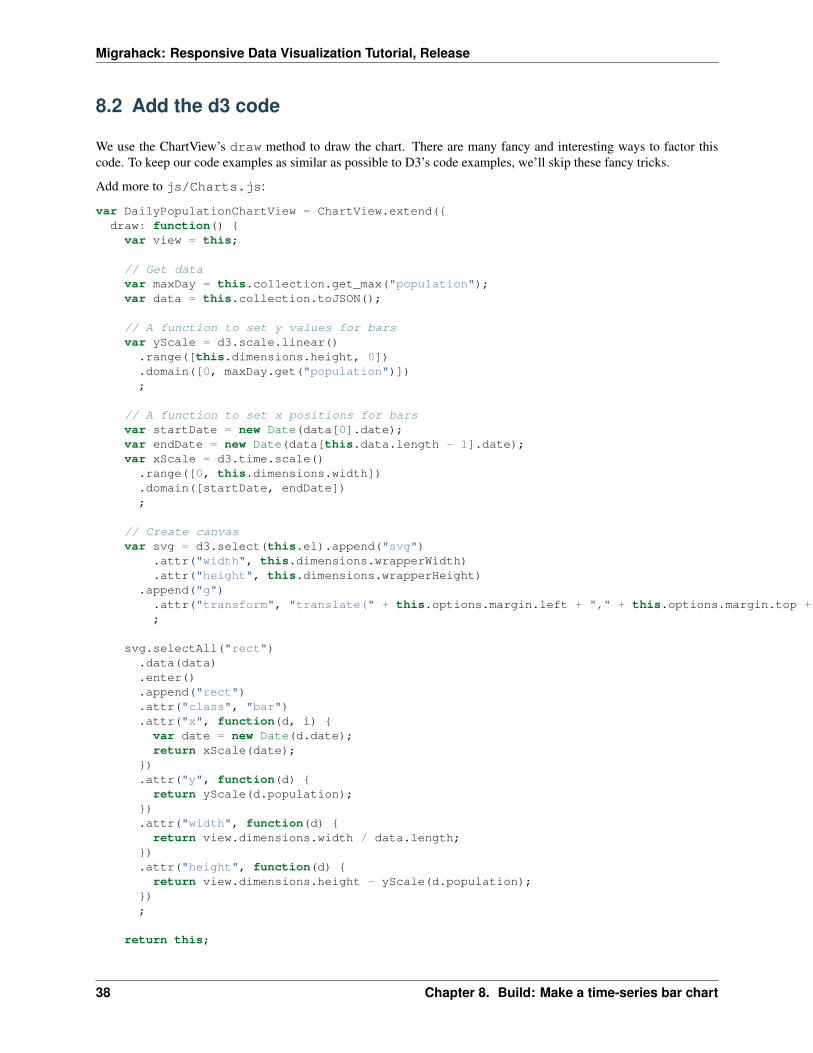
8.2 Add the d3 code
We use the ChartView’s draw method to draw the chart. There are many fancy and interesting ways to factor thiscode. To keep our code examples as similar as possible to D3’s code examples, we’ll skip these fancy tricks.
Add more to js/Charts.js:
var DailyPopulationChartView = ChartView.extend({draw: function() {var view = this;
// Get datavar maxDay = this.collection.get_max("population");var data = this.collection.toJSON();
// A function to set y values for barsvar yScale = d3.scale.linear()
.range([this.dimensions.height, 0])
.domain([0, maxDay.get("population")]);
// A function to set x positions for barsvar startDate = new Date(data[0].date);var endDate = new Date(data[this.data.length - 1].date);var xScale = d3.time.scale()
.range([0, this.dimensions.width])
.domain([startDate, endDate]);
// Create canvasvar svg = d3.select(this.el).append("svg")
.attr("width", this.dimensions.wrapperWidth)
.attr("height", this.dimensions.wrapperHeight).append("g")
.attr("transform", "translate(" + this.options.margin.left + "," + this.options.margin.top + ")");
svg.selectAll("rect").data(data).enter().append("rect").attr("class", "bar").attr("x", function(d, i) {
var date = new Date(d.date);return xScale(date);
}).attr("y", function(d) {
return yScale(d.population);}).attr("width", function(d) {
return view.dimensions.width / data.length;}).attr("height", function(d) {return view.dimensions.height - yScale(d.population);
});
return this;
38 Chapter 8. Build: Make a time-series bar chart
Migrahack: Responsive Data Visualization Tutorial, Release
},});
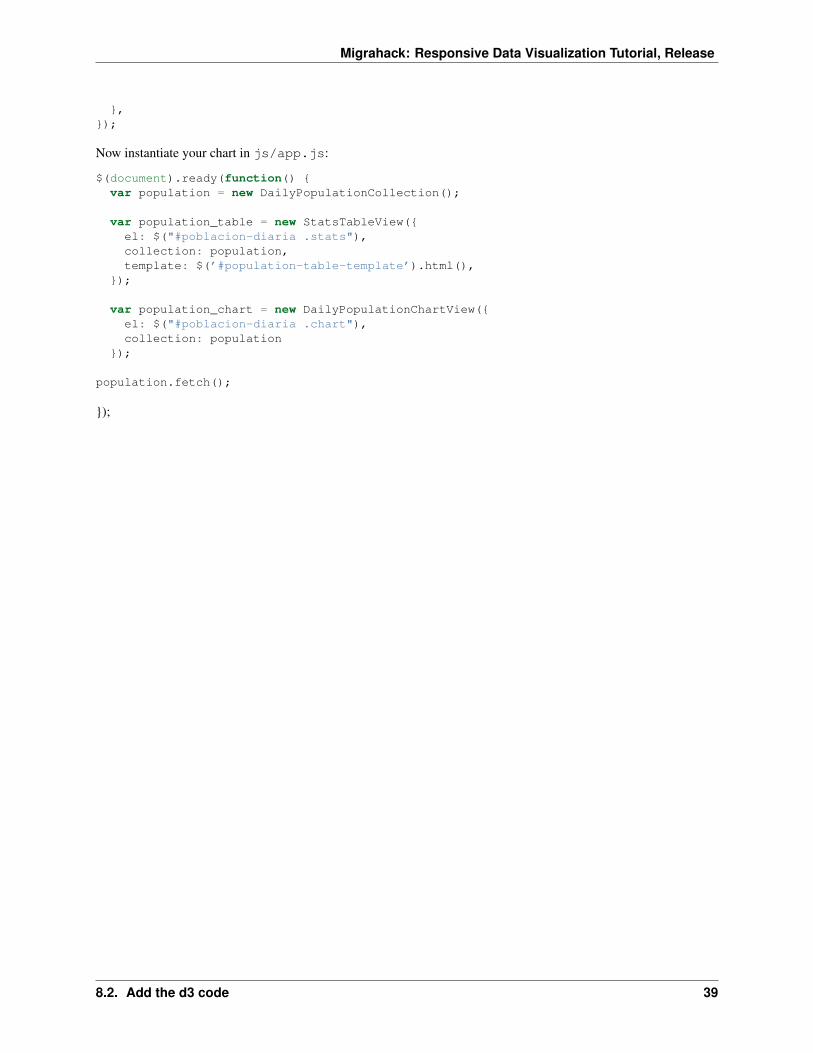
Now instantiate your chart in js/app.js:
$(document).ready(function() {var population = new DailyPopulationCollection();
var population_table = new StatsTableView({el: $("#poblacion-diaria .stats"),collection: population,template: $(’#population-table-template’).html(),
});
var population_chart = new DailyPopulationChartView({el: $("#poblacion-diaria .chart"),collection: population
});
population.fetch();
});
8.2. Add the d3 code 39