mighty river power limited annual report 2011
TRANSCRIPT

Mighty River Power Limited Annual Report 2011

CONTENTS
2 Performance Highlights 4 Letter from the Chair 8 Chief Executive’s Report14 Business Overview — Retail — Operations — Development — Our People and Our Communities — Financial Review32 Executive Management Team33 Performance Targets34 Board of Directors36 Corporate Governance38 Directors’ Interests40 Remuneration Report41 Directors’ Responsibility Statement42 Independent Auditor’s Report45 Financial Statements95 Five Year Financial Review96 Directory
Cover: Geothermal Maintenance Technician, Cathie Carr, at the Nga Awa Purua station, a joint venture between Mighty River Power and Tauhara North No.2 Trust.

2011 has been a year of quality and focus. Our results show a new quality and strength in earnings and shareholder returns. This quality is built on a clear strategy, on the calibre and commitment of our people, enduring commercial partnerships and involvement in our local communities. Our focus on growing value in Mighty River Power is creating a positive change in New Zealand’s energy mix and opening up new opportunities – for high-value skills, informed capital and growth for our economy.

2 Mighty River Power Limited Annual Report 2011
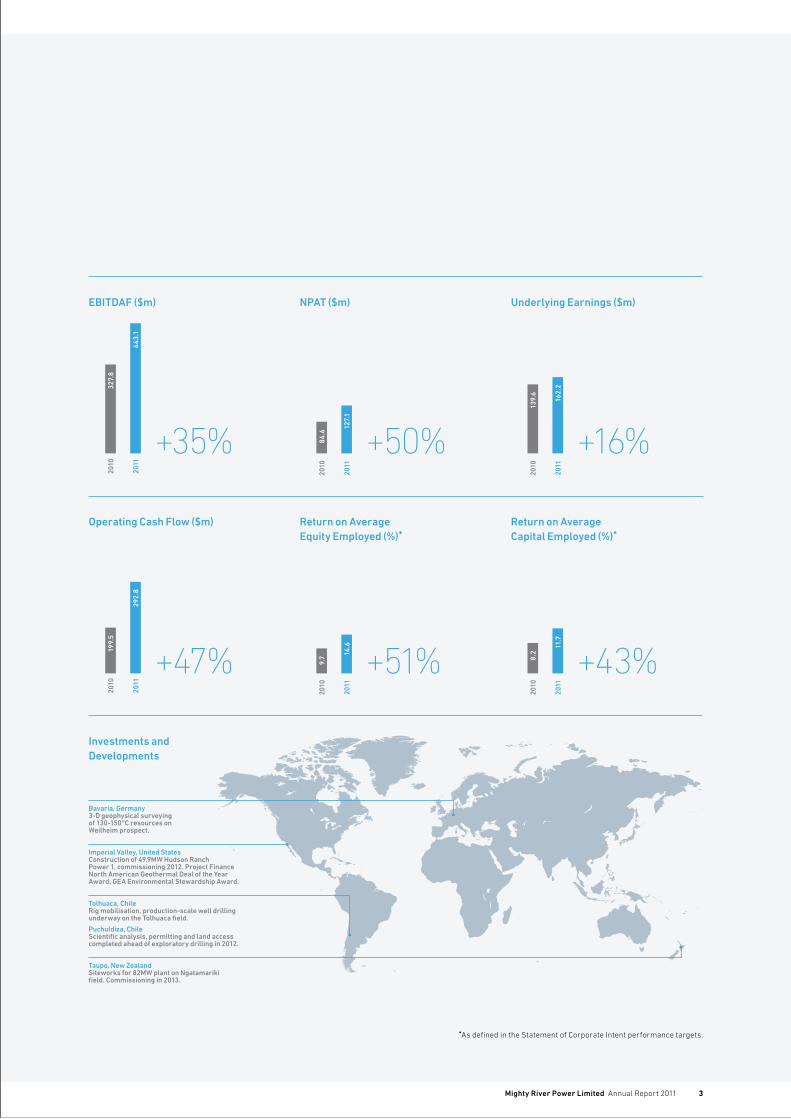
Performance Highlights
$110.4mDividends for the year, up $24 million or 28%. Interim dividend of $64.7 million and final dividend of $45.7 million.
1.5%Increase in residential electricity sales in a highly competitive market. Weighted average price for residential and commercial sales increased 7.7% from $102/MWh to $110/MWh.
$466mInvestment committed to new 82MW Ngatamariki geothermal plant near Taupo to be commissioned in mid 2013.
11.4%Total Shareholder Return in FY2011, reflecting a 16% lift in underlying earnings, and growth in the Company’s value.
96.5%World-leading availability of 140MW Nga Awa Purua geothermal plant in first full year of operation.
96%Generation from renewable sources – with hydro output increasing 17% to 4,368GWh and geothermal up 40% to 2,192GWh. Gas generation was down 45% to 273GWh due to lower wholesale prices.
6,833GWhRecord total electricity generation, up 17% on 2010, with increased contribution from new geothermal plant and better hydro conditions.
US$160mDeployed to international geothermal investment at year-end from current US$250 million commitment to GeoGlobal Energy (GGE) Fund. Projects across eight reservoirs in the US, Chile and Germany.
BBB+/stableStandard & Poor’s credit rating. Successful refinancing, including US private placement during the year – average debt maturity extended from 5.4 to 6.4 years at 30 June 2011.
Mighty River Power Limited Annual Report 2011 3
Bavaria, Germany3-D geophysical surveying of 130-150°C resources on Weilheim prospect.
Imperial Valley, United StatesConstruction of 49.9MW Hudson Ranch Power 1, commissioning 2012. Project Finance North American Geothermal Deal of the Year Award, GEA Environmental Stewardship Award.
Tolhuaca, ChileRig mobilisation, production-scale well drilling underway on the Tolhuaca field.
Puchuldiza, ChileScientific analysis, permitting and land access completed ahead of exploratory drilling in 2012.
Taupo, New ZealandSiteworks for 82MW plant on Ngatamariki field. Commissioning in 2013.
Operating Cash Flow ($m) Return on Average Equity Employed (%)*
*As defined in the Statement of Corporate Intent performance targets.
Return on Average Capital Employed (%)*
Underlying Earnings ($m)
199.
520
10
292.
820
11
9.7
2010
14.6
2011
8.2
2010
11.7
2011
EBITDAF ($m) NPAT ($m)
2010
139.
6
2011
162.
2
2010
327.
8
2011
443.
1
2010
84.6
2011
127.
1
Investments and Developments
+35%
+47%
+50%
+51%
+16%
+43%

4 Mighty River Power Limited Annual Report 2011
Joan Withers, Chair

Mighty River Power Limited Annual Report 2011 5
2011 has seen a new level of interest in Mighty River Power, and a new perspective on our Company.
As Chair, I welcome the focus on what I regard as one of New Zealand’s great success stories. The interest and scrutiny that has come with the Government’s consideration of the mixed ownership model for Mighty River Power is healthy.
Under Crown ownership Mighty River Power has a track record of domestic growth and performance that stands up against this country’s very best commercial entities. The commercial pedigree is enviable, consistently delivering both very good returns and growth in shareholder value. This is reflected in the strong increase in earnings and a Total Shareholder Return of 11.4% in FY2011.
In a period of historically soft wholesale electricity prices and an unprecedented level of competition in the retail electricity market, the quality of our results speaks of a company in very good shape.
As announced to the market, operating earnings for the period of $443.1 million were in line with market guidance for the year (of $435-450 million) and represent a 35% increase on the 2010 EBITDAF. Underlying earnings were up 16% from $139.6 million to $162.2 million, despite significant increases in
depreciation and interest charges this year. Mighty River Power’s after-tax profit was up 50% to $127.1 million.
The Board has approved a final dividend of $45.7 million to be paid on September 30, following the $64.7 million interim dividend paid in March. This takes total dividends paid to our Shareholder from FY2011 earnings to $110.4 million, up 28% on 2010.
Looking beyond the numbers, you will see the evidence of a clear strategy, efficient use of capital and a management team with an unwavering focus on Mighty River Power’s competitive strengths to deliver sustained growth.
Mighty River Power’s results in 2011 are a product of the strategic journey and evolution from the single-river hydro company that was formed in April 1999. The Company has grown and diversified its electricity generation portfolio in New Zealand faster than any other during this time. What sets that investment apart, and truly differentiates Mighty River Power, is the focus on geothermal.
Under the current capital structure, as a State-Owned Enterprise, the decisions taken to deploy more than $1 billion over the past five years on new domestic geothermal developments have been hugely influential in driving the sustained growth and evolution of
Mighty River Power. Our commitment of a further $466 million this year to a new geothermal power station on the Ngatamariki steam field near Taupo is another important milestone.
Alongside our original core hydro generation assets on the Waikato River, we have reconfigured and expanded our gas-fired capacity in Auckland into a flexible mode. The addition of 2,200GWh of annual base-load geothermal production – complemented by growth in our retail sales – has fundamentally strengthened the Company and our earnings profile. This investment has enabled a step-change in the Company’s profitability.
Today, Mighty River Power stands out as the only predominantly renewable energy company in New Zealand with a significant geothermal business. Renewables are well over 90% of total output in a generation business that has a solid and growing earnings base, with further potential to improve our competitive position.
The contribution from geothermal, a premium renewable source, now makes up about a third of our total generation portfolio and will grow to around 40% with the commissioning of the Ngatamariki plant in 2013.
This strength in geothermal is also a strength for New Zealand. Mighty River Power’s investment in the sustainable use of this country’s geothermal resource has significantly reduced the requirement for New Zealand to burn coal. This has created some pressure in the wholesale market on more costly and carbon-intensive generation operated by other companies.
A strong transmission grid is a vital foundation for competition in the wholesale and retail markets. On this front, we were pleased to see Transpower’s progress on the North Island Grid Upgrade Project (NIGUP) and new HVDC inter-island link during the year.The consequences of a weak or under-invested grid, and the
Letter from the Chair
Looking beyond the numbers, you will see the evidence of a clear strategy, efficient use of capital and a management team with an unwavering focus on Mighty River Power’s competitive strengths to deliver sustained growth.

6 Mighty River Power Limited Annual Report 2011
subsequent behaviour of other market participants during a grid outage, were illustrated by the events of March 26 (determined to be an Undesirable Trading Situation by the Electricity Authority). Mighty River Power and other market participants were initially exposed to prices of around $20,000/MWh – more than 200 times prevailing prices – for capacity from Genesis Energy’s modern and old plants at Huntly.
With the Authority’s ruling and decision to reset prices to $3,200/MWh in Auckland currently subject to legal challenge, we have identified in a note to our accounts that, should the Courts overturn the Authority’s decision, it would have a one-off future EBITDAF impact of $24 million. However, we believe there is clear evidence supporting the ruling, which sets an important precedent in terms of market behaviour. A sustainable and competitive electricity market must encourage and allow customers and retailers to effectively manage their risk exposure to the wholesale market. Market solutions, including the effectiveness of the market for risk management products, can break down in situations where a market squeeze can be applied by one or two generators, such as during a period of restricted transmission capacity. Strong and effective regulations are essential to preserve well-functioning markets and to ensure investor and market participant confidence.
New Zealand’s renewable energy is among the best in the world. To attract the investment required to ensure we make the best use of this resource, and create wealth for all New Zealanders, our electricity market needs to be seen as well-regulated with price predictability.
The perception of geothermal as a premium renewable is growing internationally because of its base-load characteristics. Globally, the opportunities for geothermal growth
are far outpacing the near-term opportunities here in New Zealand because of the currently flat demand profile for electricity in New Zealand. This is a niche where we have rare competencies and which also offers superior returns on capital to projects available locally.
In order to capitalise on our unique skills and capture the high growth potential available to the Company, we have committed a total of US$250 million to the GeoGlobal Energy (GGE) Fund.
The investments to date through GGE have been in developments in the US, Chile and Germany. As outlined in this Report, we have seen significant progress over the year on a number of these projects – the first of which will come to the market in 2012. This is an exciting space where equity capital will be a key factor in further tapping this global growth opportunity for New Zealand.
We have enjoyed strong Shareholder support for our continued growth, and we have to date committed more than $1.5 billion to geothermal investment, including Ngatamariki and offshore investments through GGE. But the limitations of debt-funding this pace of growth have been apparent with the Company under negative outlook from Standard & Poor’s for much of the past financial year – until the completion of significant debt refinancing and return to the BBB+/stable rating. Standard & Poor’s has also indicated that further investment without equity capital could lead to a downgrade in the Company’s rating.
We are immensely proud of what we have achieved in 2011. These results show a quality of performance and the outstanding potential of Mighty River Power.
This is the only energy company recognised two years running as a finalist in both the Overall Energy Company and Energy Retailer of the Year categories at the Deloitte Energy Excellence Awards. We were recognised
as Overall Energy Company of the Year at the inaugural 2010 Awards, where we also won Project of the Year for 2010 with our Nga Awa Purua geothermal plant, and at the 2011 Awards our retail brand Mercury Energy was named Energy Retailer of the Year.
My thanks to the Board, our Chief Executive Doug Heffernan and his Management team, and our people right across Mighty River Power for a job well done.
We are going into the new financial year with a lot of confidence and growth opportunities in front of the Company. However, it is clear that the extent to which we can embrace this growth potential with equity investments will be influenced by policy decisions by our Shareholder – and also our management continuing to demonstrate success.
We have a Board of Directors who are focused on taking Mighty River Power forward. They share the commercial foresight and confidence that has been a hallmark of our Company over the past 10 years and has enabled the important re-shaping of Mighty River Power through to today.
Together, Board and Management are intent on using our strength and our global leadership in geothermal to grow value in Mighty River Power. This will create unique opportunities for growth for our economy and it will make the best use of capital and leverage the capabilities of our people.
As we work with the Government and the Shareholding Ministers as they consider the mixed ownership model for Mighty River Power, and the opportunities for growth that may provide for the Company, we will be sharply focused on building on the foundation of our 2011 performance.
JOAN WITHERSChair

Mighty River Power Limited Annual Report 2011 7
Lake Taupo and the town’s commercial centre alongside the outlet to the Waikato River and hydro system.

8 Mighty River Power Limited Annual Report 2011
Doug Heffernan, Chief Executive

Mighty River Power Limited Annual Report 2011 9
FY2011 provides a clear gauge of how this Company can perform, even in a tough trading environment. Our results also confirm geothermal is a ‘game changer’ for Mighty River Power and for New Zealand.
After a period of sustained growth and investment, with the completion of the 140MW Nga Awa Purua plant in April last year, this year was always going to be a good measure of the success of the geothermal growth story – particularly in the context of the subdued wholesale electricity prices which prevailed during the year, with weak electricity demand, and an intensely competitive retail market.
Solid earnings baseOur performance in FY2011 and other important milestones in our domestic and international growth plans have also laid the platform for high-quality earnings in years to come.
Electricity generation for the year was up 17% on the previous year to 6,833GWh, with the first full year of production from the Nga Awa Purua geothermal plant and above-average hydro production due to wetter conditions. Gas generation was down by 45% due to the lower wholesale market prices and the reduced need to use gas to manage our portfolio risks given the strong hydro and geothermal production. This underscores the flexibility of our hydro and multiple gas-powered units to respond quickly and effectively to changing market and portfolio conditions, both to manage portfolio risk and to capture market opportunities.
There were two factors that were key to this year’s results. Firstly, the contribution of Nga Awa Purua with world-leading 96.5% availability in its first full year of operation was very significant, providing more than half of the 17% generation growth in FY2011.
Secondly, a strong sales performance. Total sales to residential and commercial customers (excluding
very large commercial and industrial) were down 1.7% by volume. A fall in commercial sales was partially offset by an increase in residential sales, which were up 1.5% even though customer numbers at year-end were down from 412,000 to 392,000.
The weighted average price (Fixed Price Variable Volume) for electricity sales to commercial and residential customers increased 7.7% from $102/MWh in 2010 to $110/MWh, partly reflecting the estimated impact on price of the
ETS (Emissions Trading Scheme) introduced in July 2010.
Together these contributed to a 5.4% improvement in sales from $1,105 million to $1,164 million (wholesale and retail sales and other income, less lines charges).
What shows through in sales is the value of our decade-long commitment to investment in geothermal generation in New Zealand, balanced by a strong expansion in the scale and quality of our retail base in advance of bringing those projects to market.
While the lion’s share of our growth capital since 2000 has been focused on geothermal, the expansion and reconfiguration of our multi-unit gas-fired Southdown plant has
meant we now have new base-load generation that is complementary within a more diverse, resilient and flexible generation portfolio. A significant proportion of Mighty River Power’s performance is now not influenced by the variability of rainfall in the Waikato River catchment.
Alongside the growth and diversification of our generation base, we have continued to develop our retail sales operations to both commercial and residential customers under the Mercury Energy, Bosco Connect
and Tiny Mighty Power brands. The expansion of our customer base over the previous two years, ahead of our additional generation coming on stream, has allowed a strong focus on the quality of our customer base, tailoring our offers to specific segments, and on innovative products.
Our three-year fixed-price offering through Mercury Energy was groundbreaking for the industry, and has proved very popular with customers. Like fixed-rate mortgages, this product provides price certainty for residential customers, insuring against the prospect of prices rising annually. While retail customers in increasing numbers took a longer view, choosing to lock-in price, we
Chief Executive’s Report
What shows through in sales is the value of our decade-long commitment to investment in geothermal generation in New Zealand, balanced by a strong expansion in the scale and quality of our retail base in advance of bringing those projects to market.

10 Mighty River Power Limited Annual Report 2011
saw an increasing number of larger commercial and industrial electricity users choosing exposure to the half-hourly spot market, in response to the softer prices in the wholesale market over much of the last year.
The market changes over the last few years have been very significant with new base-load geothermal taking market share from the more expensive coal and gas plants. At the same time, some of our competitors had fuel overhangs from high take-or-pay contracts for gas and coal which caused ‘must run’ behaviour from thermal generators – and therefore resulted in low wholesale prices even during normal hydro conditions.
During the year we concluded a dry-year ‘swaption’ contract with Genesis Energy starting in 2012 for a five-year term. This means we can call on thermal capacity to reduce portfolio risk should certain market conditions prevail, such as poor hydro storage. Moves in the industry, such as the commissioning of gas storage this year, dry-year swaption contracts, and the retirement of some of the ageing and high-cost Huntly units will, we believe, lead to firmer wholesale prices as the final stage of this market dynamic beds in and electricity demand recovers.
Further investment in new capacity is likely to be deferred until demand
conditions improve and prices are at levels that will support investment. Domestic developmentFrom a broader economic and environmental perspective, the increasing contribution from geothermal base-load evident in the Ministry of Economic Development’s data has enabled better use of our hydro in the more valuable peaking role where it is well-suited.
Geothermal is now this country’s third-most important fuel source after hydro and gas, displacing coal and accounting for more than 13% of all electricity generation – around three times that of wind during the year in review.
We have taken further steps with geothermal investment during the year, at home and offshore. A new project on the Ngatamariki steam field, along with our international geothermal developments, will allow us to continue to build on the core competency we have in geothermal.
Our commitment to a new 82MW plant at Ngatamariki near Taupo, reflects our confidence in the quality of this project and our forward- looking view of the wholesale market dynamics. We are forecasting a positive contribution to earnings from FY2014.
The $466 million Ngatamariki
development follows the commissioning of Kawerau in 2008 and Nga Awa Purua in 2010 – and will lift the total geothermal capacity under our operation above 460MW – and to some 40% of our production.
While the plant will be 100%-owned by Mighty River Power, Tauhara North No.2 Trust – our joint venture partner in the Rotokawa and Nga Awa Purua plants – has been important in bringing the project to fruition, playing a key role in a consenting process that garnered significant local support and resulted in an efficient outcome.
During the year, we also continued to investigate and progress future options for geothermal and wind development.
Following the end of the financial year, and after a three-year consenting process, we received a final decision from the Board of Inquiry to grant resource consents for a 60-turbine wind project at Turitea, near Palmerston North. We also submitted a consent application for a project on the Puketoi range.
We have previously indicated that New Zealand’s recent weak electricity demand growth conditions mean that consented projects are likely to come to the market later than originally planned. However, the multi-year lead times to research
GW
h
6000
5000
8000
7000
4000
3000
2000
1000
0
Total generationElectricity sales*
Sales volume built ahead of geothermal generation capacity coming online
*(excluding Spot and Contracts for Di�erence)
Residential FPVV
GW
h
6000
5000
8000
7000
4000
3000
2000
1000
0
Commercial FPVV Geothermal Hydro Gas Other
5,148
FY2007
5,291
FY2008
5,954
FY2009
5,812
FY2010
6,833
FY2011FY2007
3,912
FY2008
4,002
FY2009
4,316
FY2010
4,857
FY2011
4,776

Mighty River Power Limited Annual Report 2011 11
the international market. We have seen further impetus in
countries looking to develop their domestic geothermal opportunities, and Mighty River Power has become a sought-after partner. This growth in geothermal development internationally is significantly outpacing the relatively small domestic growth that is possible in New Zealand, particularly with the current weak demand environment.
Mighty River Power’s international investments offer growth opportunities and targets returns that are superior to new domestic projects. The initial projects and countries where we have chosen to invest reflect attractive local legal frameworks, political and market risks – for example, with long-term off-take contracts that reduce investment risk and are not available to new generation investments in New Zealand.
Through our investment in the GeoGlobal Energy (GGE) Fund and related partnerships, we now have investments spanning eight reservoirs in the US, Chile and Germany and our strategy is seeing substantial progress.
The commissioning of the 49.9MW Hudson Ranch Power 1 project in the Imperial Valley of Southern California, (a project with three shareholders: Hannon Armstrong Capital LLC, Catalyst Geothermal LLC, and the GGE Fund) is a key milestone in the first half of 2012. During the year this project won the Project Finance North American Geothermal Deal of the Year Award from Euromoney Magazine, and more recently was awarded the Environmental Stewardship Award by the US Geothermal Energy Association. The large high-temperature Imperial Valley resource presents further development potential.
At the same time, as we signalled last year, we have now moved to the next phase of development of the Tolhuaca geothermal field in Chile with the start of a fuel-proving multi-
well drilling programme. Severe winter conditions have delayed this programme with completion now expected in the first half of 2012. In Germany, 3-D geophysical surveys are well-advanced on the Weilheim prospect in Bavaria as part of a strategy to develop low-temperature geothermal resources under the German Government’s renewable energy policy.
Team and community The level of growth we have achieved, the quality of our earnings and the value of our physical assets, is founded on the calibre of our people and the inter-relationship we have with key partners in our operating communities. Our business model is built on a partnership approach, both domestically and internationally.
We believe this model excels in creating long-term sustainable value from the responsible intergenerational management of natural resources that are the fuel for electricity generation, for the benefit of our partners and their communities, our shareholders and our customers.
A good example is our domestic geothermal growth that is a marriage of capabilities – Maori as landowners, together with our geothermal competencies, and a joint respect for the need to ensure sustainable use of these resources.
Within Mighty River Power we have a culture that embraces this partnership approach and ensures it is owned by our people at all levels in the business. Our results demonstrate the value of a genuine focus on profit with a purpose – in the way that we engage with our communities, our focus on sustainable use of resources, and how we deliver product innovation and care for our customers.
The pride we have within the Company comes from a shared recognition of team and individual effort along with the holistic
sites and secure consents means it is vital that we have a longer- term view and continue to prepare opportunities through geothermal exploration, wind monitoring and securing resource consents.
This will ensure that we are ready to commit to projects quickly to support the economy as economic growth and electricity demand recover.
International geothermalThe scale of Mighty River Power’s domestic geothermal business places us among the world’s top 10 global geothermal companies, and we have continued to build our reputation in this global niche in 2011.
Geothermal represents only about 0.3% of generation globally, but is growing strongly as many countries look to expand their domestic electricity generation from renewable sources, and incentivise this development option. Mighty River Power identified this opportunity some years ago and targeted the niche geothermal market, recognising the relatively limited competition and the rare competencies that the Company had built in the domestic market.
To date we have committed capital of US$250 million through the GeoGlobal Energy (GGE) Fund, to secure and develop geothermal projects offshore. At year-end, a total of US$160 million had been deployed to existing projects, with the balance expected to be deployed during FY2012. The international strategy is therefore not opportunity constrained, but for Mighty River Power to participate further will require additional equity commitments in the medium-term. The structure of the investment through the GGE Fund does allow additional investor participation should this prove value enhancing. Our 29% ownership interest and participation in the GGE management company ensures effective application of our skills and experience to

12 Mighty River Power Limited Annual Report 2011
approach that has contributed to a very good financial performance.
We continue to achieve strong engagement across our Group and this year we launched a comprehensive development programme to further strengthen our leadership capability and succession within the Company. We are rolling out a new performance management framework to support our strategic goal of delivering sustained growth in shareholder value.
Alongside this, we continued to make progress on our priority of ensuring a world-class health and safety culture. Our LTIFR (Lost Time Injury Frequency Rate) improved to 0.26 per 100,000 hours, outperforming our Statement of Corporate Intent, and we remain committed to further improvement.
We have a close association with the communities in which we operate, and mutual interest in, for example, the management of the Waikato River catchment, not only to generate electricity, but also to meet the needs of other river users and the Waikato Regional Council. The establishment of the Waikato River Authority was an important step this year in making progress on the vision for a healthy and well-managed river.
We all take a lot of personal pride in events such as the 2010 FISA World Rowing Championships that showcased the Mighty River Domain and Lake Karapiro in November 2010 to an international audience. We were proud to sponsor the more than 600 volunteers who supported the event, bringing world attention to the quality of New Zealand’s rowing talent and also the environmental values of this very special setting.
We recognise our role in our communities through the support we provide for events and vital services in our communities, such as the Taupo Coastguard, Ironman New Zealand Volunteer Crew in Taupo, Waikato River Trails, iwi-related activities and
cultural events, along with Mercury Energy’s long-standing support for Starship Children’s Hospital and the Starship Foundation. During the year, Mighty River Power joined with others in the industry to offer assistance in the wake of the Christchurch earthquakes – working directly with local lines company, Orion, in the days following the tragic February 22 event.
OutlookWe have demonstrated the value, and importance to the future, of the evolution of the Company through geothermal.
We are seeing more and more opportunities opening up to take this knowledge and our skills to the world, and at home our growth in geothermal continues with ground works for another major project underway at Ngatamariki as our Report goes to print.
We see this project very much as the last in a period of rapid growth for the Company in New Zealand that has been faster, in both retail and generation, than any of our domestic competitors. In the coming years, slower growth is expected as the market absorbs the extra generation capacity and awaits a more robust economic recovery.
We will continue to explore geothermal options with our existing and prospective Maori land trust partners and will prepare wind options to meet the longer-term electricity
demand needs of the country. There will be growth in the
medium-term domestically from these opportunities for the Company and its partners. However, it is the potential to expand our geothermal influence into offshore markets, where our skills and experience are also highly valued, that offers the most growth potential in the near-term.
Our 2011 Annual Report shows a company in good heart and with great strength, thanks to our team at Mighty River Power, our partners, and the many people who stand alongside us and behind these results.
DOUG HEFFERNANChief Executive
Within Mighty River Power we have a culture that embraces this partnership approach and ensures it is owned by our people at all levels in the business.

Mighty River Power Limited Annual Report 2011 13
Geothermal output, 32% of total electricity generation in FY2011.

14 Mighty River Power Limited Annual Report 2011
We broke new ground in the industry during the year with the successful launch of a three-year fixed-price offer for residential customers. James Munro, General Manager Retail & Corporate Affairs

Mighty River Power Limited Annual Report 2011 15
The value of strong retail brands and a healthy customer base was clearly evident in 2011, as our retail businesses continued to lead the way in product innovation and customer engagement in the face of intense competition.
After a period of strong growth over the previous two years, a focus on customer quality in the highly-competitive environment saw residential sales volumes increase by 1.5%, despite a fall in customer numbers of 4.9% from 412,000 to 392,000. An improved customer mix and increased presence in the South Island resulted in a 7.7% lift in the weighted average price (Fixed Price Variable Volume) achieved over the year.
Mercury Energy In response to high levels of customer switching, Mercury Energy’s focus is on retaining and building a greater level of loyalty among valued customers. By ensuring our customers feel they are better off with Mercury, we are able to balance market share and business performance objectives.
We broke new ground in the industry during the year with the successful launch of a three-year fixed-price offer for residential customers. More than 73,000, predominantly higher-consumption homes, signed up to this offer within the financial year. Initiatives such as the Star Supporters Club, Movie Club and Perks have also gained momentum, with more than 61,000 customers now members. Offers such as the three-year fixed product have proved to be effective in retaining customers, while club members show a high level of advocacy for Mercury.
Any review of the year must acknowledge the impact of the tragic earthquake in Christchurch in February, which shocked and saddened our people and all New Zealanders. Customers, friends and family have had their lives changed forever. We will continue to provide any direct assistance we can to industry partners, and work with
local electricity network company, Orion, CERA (Canterbury Earthquake Recovery Authority) and other support agencies to assist our customers.
Improved debt management helped counteract upward pressure on operating costs from high market churn. With the exception of provisioning as a consequence of the Christchurch earthquake, debt-related costs as a percentage of sales dropped for the third year running, despite weak economic conditions and high churn otherwise driving growth in industry-wide finalised debt.
Our GLO-BUG prepay solution continues to be an important tool in managing debt, as it gives those customers who struggle to pay a monthly bill a better understanding of, and control over, their energy spend. Mercury continues to work with community agencies and directly with customers who need support managing their energy budgets.
We were proud to see the great work of our people recognised at this year’s Deloitte Energy Excellence Awards, where Mercury Energy was named Energy Retailer of the Year, after being a finalist in 2010. To achieve this award in such a highly competitive industry is both an honour and confirmation of the strength and dedication of our team at Mercury Energy. We were particularly proud that Helen Amituana’i, our Community Relations Manager, received well-deserved recognition in being named a finalist in the Energy Executive of the Year category, reflecting the importance the Company places on working with the community.
Bosco ConnectThrough our Tiny Mighty Power and Bosco brands, we expanded our retail presence in provincial New Zealand towns over the year and maintained our pre-eminent position in the speciality Auckland apartment market. Bosco Connect had grown its customer base to more than 20,000 customers at the
year-end, through expansion from its Auckland base into the Wellington apartment market, and Tiny Mighty Power extending from its successful beginnings in the Waikato and entering into the Wairarapa, Marlborough and North Canterbury regions.
Testament to the strong growth of the business, Bosco Connect General Manager, Bryan Dobson, was also recognised at the 2011 Deloitte Energy Excellence Awards as a finalist in the Young Energy Executive of the Year category.
Metrix Our metering business, Metrix, is ahead of schedule in its deployment of smart meters in the Auckland region, with more than 260,000 meters installed by the end of the financial year and completion of this initial deployment phase of the project expected by November 2011.
Metrix’s network of smart meters is an important strategic platform in New Zealand’s largest electricity market. It offers significant commercial value as the implementation of new technologies and services based on smart grids grows, along with demand for data from retailers, lines companies and consumers to better manage electricity use. The network will provide retailers with a consistent service model for delivering new and innovative services to customers.
Electronic metering services are now a material part of the Metrix business, contributing one-quarter of total revenues during the year, delivering 1.5 million monthly electronic reads to retailers, predominantly Mercury, and 4.7 million daily electronic reads in support of the GLO-BUG product. Revenues from the new electronic business platform will continue to grow rapidly over the next few years and transition to represent the great majority of the business’ income, with significant productivity and security uplift for the industry and consumers.
Business OverviewRetail

16 Mighty River Power Limited Annual Report 2011
STRONG, HEALTHY RETAIL BASEMighty River Power has a 20% share of the retail electricity market through its brands: 2011 Energy Retailer of the Year, Mercury Energy, which has a strong national presence, along with Bosco Connect in the city apartment market and Tiny Mighty Power, focused on provincial towns. The expansion of our customer base, ahead of the Company’s new geothermal generation coming online, has allowed a strong focus on the quality of our customer base, tailoring of offers to specific segments, and on innovative products.

Mighty River Power Limited Annual Report 2011 17
Dunedin, a core market for Mercury Energy.

18 Mighty River Power Limited Annual Report 2011
Record electricity generation of 6,833GWh provided a foundation for the Company’s strong earnings in FY2011. Total production was up 17% from 5,812GWh the previous year.
This increase has highlighted a stronger earnings base in a more flexible portfolio with a firm production of more than 6,000GWh and total capacity now in excess of 8,000GWh per annum. In a year of flat national electricity demand, our performance resulted in a lift in our national electricity generation market share of 2.5% to approximately 17.5%. Mighty River Power’s additional hydro and geothermal generation has driven a positive change in this country’s energy mix. Our displacement of thermal generation has reduced emissions by displacing more than 1 million tonnes of C02e (carbon dioxide equivalent) over the year, building on the improvements in previous years.
Operational excellenceWhile there were normal challenges during the year with plant outages, our focus on operational excellence has seen important gains in plant availability and was key to achieving an outstanding 96.5% availability in the new Nga Awa Purua plant. Total geothermal output was up 40% from 1,562GWh to 2,192GWh of base-load generation, providing considerable additional robustness in our portfolio alongside the Company’s core hydro generation assets.
Mighty River Power benefited from above-average rainfall in the Lake Taupo and Waikato River catchments, with hydro production up 17% to 4,368GWh. The High Flow Management Plan was implemented three times during the year with the Waikato Regional Council as Flood Manager, and we had very high levels of spill at 411GWh – equivalent to 10% of annual hydro production. The spill was driven by the rapidity and intensity of rain events and a significant flow through the Waikato River tributaries downstream of Lake Taupo for which there is no effective storage.
Positive national hydrology combined with a flat demand environment resulted in weak wholesale prices – averaging $48/MWh compared with $56/MWh in FY2010. With the low wholesale prices and a reduced need to cover portfolio risk, production from our multiple gas-fired units at Southdown was correspondingly down by 45% from 504GWh to 273GWh, its lowest-ever annual production. We extended a significant and flexible gas supply contract through to December 2015, providing ongoing optionality from this key station.
Another key feature of our portfolio in 2011 was the increase in buy and sell CFDs (Contracts for Difference), partially due to the Virtual Asset Swap with Meridian Energy which took effect from 1 January 2011. Other significant transactions during the year included a 13-year off-take transaction with a merchant generator, also indexed to the ASX electricity futures market, and a five-year contract with Genesis Energy to provide additional portfolio support against dry-year hydrology risk and to capture wholesale market opportunities. We understand several generator-retailers have adopted such products, though we are yet to see sizeable participation from end-users as a risk management tool to limit their exposure to wholesale price outcomes in dry periods. We also look forward to demand-side participation in the significantly-evolved ASX electricity futures market since their involvement is essential to increase liquidity.
We undertook New Zealand’s first long-term carbon tender, securing two further carbon procurement agreements, totalling 240,000 units. We now hold five long-term agreements, three of which are in the Lake Taupo area and directly assist with the reduction of nitrogen entering Lake Taupo and the Waikato River. We continue to work with landowners to procure more long-term carbon, though a key issue for vendors is the perception of uncertainty related to
the Emissions Trading Scheme. During the year the Nga Awa Purua joint venture negotiated to sell 409,000 PRE (Projects to Reduce Emissions) credits, realising $7 million for the Company early in FY2012.
The year saw a continued focus on our core activities, with enhancements to the efficiency of hydro generation across some of our 39 units and increases in thermal availability through routine maintenance innovations. We divested our last landfill generation investment to ensure focus on our core business and business lines with significant growth potential. Early this year, we combined all generation operating functions into Operations and undertook a number of initiatives to capture benefits from that consolidation. We are committed to our partnerships, communities and resources and, together with our partners, maximising sustainable opportunities from our assets and fuel systems.
Extensive engagement on national and regional water policy has been a feature of the year. The Land and Water Forum process has contributed to a broader mutual understanding of the many groups interested in the sustainable future of the country’s precious water resources. Variation 6 of the Waikato Regional Plan, concerning water allocation, was heard in the Environment Court and we look forward to the outcome of that process towards the end of 2011.
Asset reinvestmentAs reported at the half year, we have signed an $18 million contract with Alstom for the design through commissioning of an upgrade and efficiency improvement for four generator units at Arapuni over the next two years. Other refurbishments are underway as part of a total capital spend of more than $500 million over the next decade.
Two new production wells were drilled in the Rotokawa field, while a planned new well at Kawarau was deferred until FY2012.
Business OverviewOperations

Mighty River Power Limited Annual Report 2011 19
Our focus on operational excellence has seen important gains in plant availability and was key to achieving an outstanding 96.5% availability in the new Nga Awa Purua plant. Fraser Whineray, General Manager Operations
20 Mighty River Power Limited Annual Report 2011
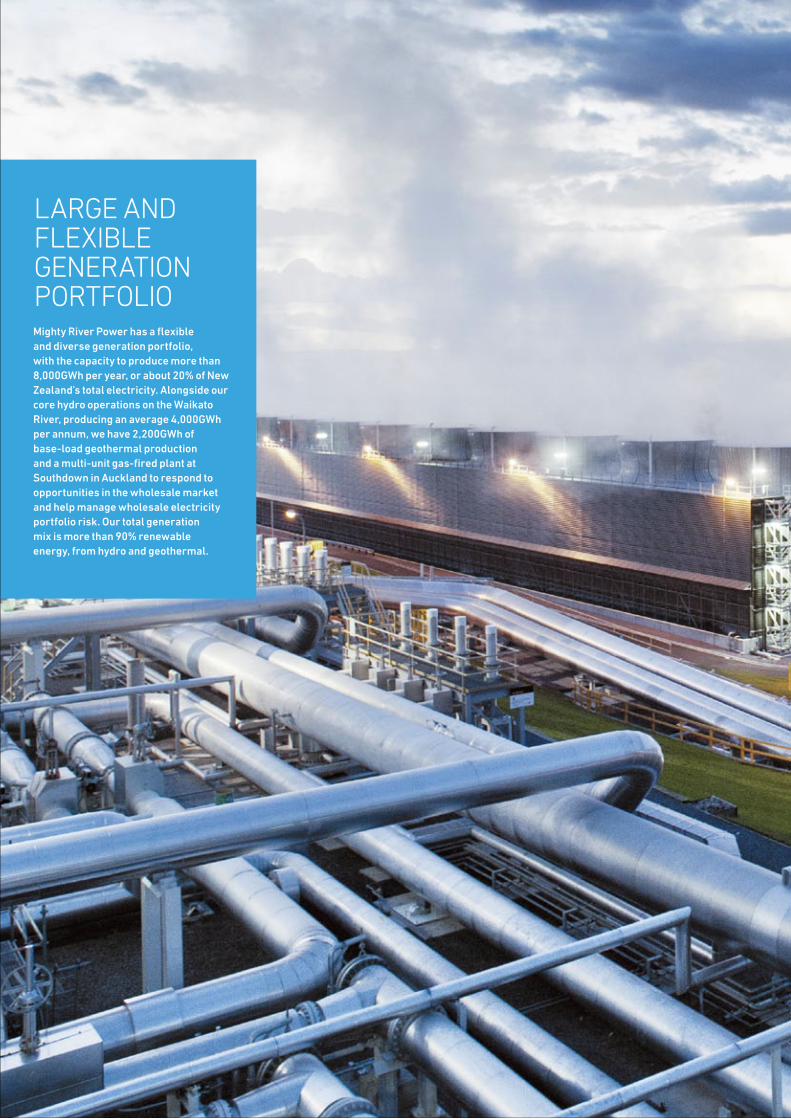
LARGE AND FLEXIBLE GENERATION PORTFOLIOMighty River Power has a flexible and diverse generation portfolio, with the capacity to produce more than 8,000GWh per year, or about 20% of New Zealand’s total electricity. Alongside our core hydro operations on the Waikato River, producing an average 4,000GWh per annum, we have 2,200GWh of base-load geothermal production and a multi-unit gas-fired plant at Southdown in Auckland to respond to opportunities in the wholesale market and help manage wholesale electricity portfolio risk. Our total generation mix is more than 90% renewable energy, from hydro and geothermal.

Mighty River Power Limited Annual Report 2011 21
140MW Nga Awa Purua geothermal station, near Taupo.

22 Mighty River Power Limited Annual Report 2011
The commitment to a new 82MW plant on the Ngatamariki steam field near Taupo was an important further milestone during 2011 in our geothermal growth. Mark Trigg, General Manager Development

Mighty River Power Limited Annual Report 2011 23
Business OverviewDevelopmentGeneration growth and fuel diversification in recent years has underpinned Mighty River Power’s operational performance and financial results for 2011.
Notably, this year was the first for some time that we have not had a major construction project underway in New Zealand. But Ngatamariki was committed to in June and significant progress was made on offshore projects through our investment in the GeoGlobal Energy (GGE) Fund and our involvement in the GGE LLC management company.
Geothermal has been a major contributor both domestically and off-shore and will continue to provide a core growth focus for the Company in the foreseeable future. However, domestically, fuel diversity continues to be important going forward and our investment into wind development options is expected to play an important strategic role in our generation portfolio in the future.
New Zealand Following several years’ work, the commitment to a new 82MW plant on the Ngatamariki steam field near Taupo was an important further milestone during 2011 in our geothermal growth. This project is forecast to be fully operational in mid 2013, contributing positively to earnings in FY2014.
A key foundation of our geothermal development in New Zealand has been our commercial partnerships with Maori land trusts – enabling their direct economic participation in wealth creation – and we are actively working with landowners on a number of potential new fields to assess future opportunities.
Our geothermal development team has industry-leading experience and technical capability not only in exploration, evaluation and construction, but also in achieving sustainable management of geothermal resources. Recognising that geothermal fuel supplies are dynamic systems, these core skills are vital in ensuring we make sound investment decisions and provide robust management processes
that respect and preserve the taonga that is the resource.
To complement our base-load geothermal developments, we have identified three world-class wind sites that are in various stages of development. Following the end of the financial year, and after a three-year process, Mighty River Power received the Board of Inquiry decision to grant final resource consents for a 60-turbine development at Turitea, near Palmerston North. This decision provides a generation development option on one of New Zealand’s best wind sites.
Acknowledging the long lead-times for such projects, we have lodged a resource consent application for a wind project on the Puketoi Range that is geographically close to the Turitea development, and would create some critical mass for our investments in that area. The Puketoi application follows extensive discussion with local landowners and the wider community, and includes a proposed transmission connection to the national grid that has the support of the landowners on the proposed line route. In addition, we are advancing options for a development at Cape Campbell in Marlborough.
All of these projects offer high- quality wind generation potential to meet future growth in electricity demand. However, given the zero demand growth experienced over the past three years, we anticipate that, like other developments, the time for commercial operation of these projects has been pushed out a number of years. Our current assessment indicates viability in the second half of this decade.
InternationalWith increasing interest in geothermal internationally, fuelled by fears around nuclear generation in the wake of the Fukushima disaster, opportunities for growth are significant for the Company given our expertise in what is a small market by global standards. These opportunities allow Mighty River Power to leverage its strategic capabilities and provide risk diversification
to its development portfolio.Our investment in the GGE Fund to
date reflects a carefully risk-assessed and prudent approach to growth opportunities. We have targeted markets where demand is not a limitation, where the resources are as good as or better than New Zealand (US and Chile), strong incentives to displace fossil and nuclear fuel are offered (Germany), and sovereign risk is relatively low. The financial commitment is comparable to a single domestic development and we are seeking validation that the strategy is successful before considering a higher level of commitment.
On the Tolhuaca field in southern Chile, GGE has now moved to a production-scale, multi-well drilling programme to confirm the size, enthalpy and permeability of the resource. Further north on the Puchuldiza field in Chile, GGE has also been progressing scientific analysis, permitting and land access for exploratory drilling. In Germany, GGE is now well-advanced with development opportunities in Bavaria on the Weilheim prospect, which has low-temperature (130-150°C) geothermal resources and is being developed under the German Government’s renewable energy policy, targeting displacement of fossil and nuclear energy.
The 49.9MW Hudson Ranch Power 1 project in Southern California’s Imperial Valley is the Fund’s first major investment in an international construction project. Employing the same technology as our Kawerau and Nga Awa Purua plants in New Zealand, Mighty River Power people have been involved in many stages of the project, from investment strategy, right through to project delivery. Commissioning is scheduled for the first half of 2012.
International geothermal development provides Mighty River Power with a platform for considerable growth. In each of the markets where GGE currently operates, we see significant opportunities for further equity investment. However, we will maintain our current prudent and careful approach to building on that opportunity.

24 Mighty River Power Limited Annual Report 2011
RARE COMPETENCIES IN GLOBAL NICHEMighty River Power is a world leader in geothermal energy development, construction and operations – and is applying this globally-rare expertise and experience to tap international growth opportunities, which are not constrained by electricity demand in New Zealand. The Company’s current commitment of US$250 million through an investment in the GeoGlobal Energy (GGE) Fund, involves projects across eight reservoirs in the US, Chile and Germany. The first major project, Hudson Ranch Power 1, a 49.9MW plant in the Imperial Valley of Southern California will be commissioned in 2012.

Mighty River Power Limited Annual Report 2011 25
Hudson Ranch Power 1 project under construction, Southern California.

26 Mighty River Power Limited Annual Report 2011
Our continued commercial success is underpinned by the capability and performance of our employees. Through our people, our partnerships and with the support of our communities, we grow value in Mighty River Power and create new opportunities – for employment, our partners and economic growth.
PeopleRegular surveys of our 800 employees help us target initiatives to further strengthen our culture. More than 90% of our employees contributed to our most recent employee engagement survey, which showed positive shifts across all key measures over the previous survey.
As part of our continued focus on building leadership capabilities, a comprehensive Leadership Development Framework was launched in 2011. Employees at all levels now have the opportunity to take part in targeted programmes, with participation to date exceeding our targets.
In the past year we have designed a new approach to Performance Management, which will be implemented over the next 12 months. This new framework gives employees a clear view of performance expectations and any subsequent outcomes. Our focus on increasing employee engagement will continue in 2012, along with further building leadership and driving a high-performance culture across Mighty River Power.
Health & SafetyThe health, safety and well-being of our people is an absolute priority. For us, outstanding business performance includes outstanding health and safety performance. Our Health & Safety performance indicators for the year improved over the previous period, particularly those relating to contractors. Lost Time Injury Frequency Rate (LTIFR) improved from 0.47 to 0.26, while
Total Recordable Injury Frequency Rate (TRIFR) improved from 1.98 to 1.06 per 100,000 hours worked (for employees and contractors). The total number of hours worked and the overall risk exposures were at a lower level than previous years due to the lower level of project work and the risk management procedures in place.
A newly-appointed Health & Safety Manager with Company-wide responsibility will support managers across the business in driving further improvements to our processes and policies, reporting and consultation.
Following one serious harm incident and one serious near-miss incident during the year, thorough reviews of our Health & Safety processes were conducted and changes made to operational procedures.
Health & Safety FY2011 FY2010
Lost Time Injuries
Employees 4 3
Contractors 1 5
Medical Treatment Incidents
Employees 6 14
Contractors 9 20
Lost Time Injury Frequency Rate (LTIFR)
Per 100,000 hours worked employees and contractors 0.26 0.47
Total Recordable Injury Frequency Rate (TRIFR)
Per 100,000 hours worked employees and contractors 1.06 1.98
Partnerships and RelationshipsDeveloping and maintaining strong relationships with organisations, groups and individuals who share an interest in what we do, and the natural resources that we harness for our business, is vital. This close understanding with key stakeholders is critical to building a sustainable business with long-term operational success.
We continue to work in partnership with Maori land trusts across a range of geothermal resources, and we continue to explore opportunities for future development options and
expanding economic participation. In the Waikato River catchment, our interests around water quality, guardianship with kaitiaki and contributing to the protection and enhancement of the river, are closely aligned with local iwi.
CommunityBeing an active and contributing member of the communities in which we operate is important to us.
During the year we partnered with Rowing New Zealand to deliver the 2010 World Rowing Championships at Mighty River Domain, Lake Karapiro. As well as being a premier sponsor, we supported the Karapiro Crew – the volunteer team of more than 600 mainly local people who helped make the event a success.
We worked with organisers to deliver optimal water levels and flow conditions for the competition. We took significant pride in this event – with our people, stakeholders and the thousands of visitors and a worldwide audience able to enjoy the record success of the New Zealand crews in a special setting.
Along with many other initiatives where we provide sponsorship support, Mercury Energy continues its relationship with The Starship Foundation. Increased membership of the Mercury Energy Star Supporters’ Club led to customers donating around $550,000 during the year through their monthly electricity bills. Our customer and Company donations allowed the Starship Foundation to purchase much-needed heart equipment and transport systems used in air ambulance services.
Business OverviewOur People and Our Communities

Mighty River Power Limited Annual Report 2011 27
Our focus on increasing employee engagement will continue in 2012, along with further building leadership and driving a high-performance culture across Mighty River Power. Bridget O'Shannessey, General Manager Human Resources

28 Mighty River Power Limited Annual Report 2011
ENDURING COMMERCIAL PARTNERSHIPSMighty River Power has a track record of driving growth in shareholder value with a genuine focus on the long-term. A key foundation has been the support from our operating communities and enduring commercial partnerships with Maori landowners, through aligned economic, environmental, social and cultural interests. The quality of our earnings and the value of our physical assets comes from the intergenerational management of natural resources and the way we engage with and give back to our local communities – from our support for Starship Children’s Hospital to fostering New Zealand’s world-leading rowing talent.

Mighty River Power Limited Annual Report 2011 29
2010 World Rowing Championships, Lake Karapiro.

30 Mighty River Power Limited Annual Report 2011
Strong growth in operating earnings (EBITDAF) in FY2011, including effective operating cost containment, was key to this year’s financial results – highlighting a step-change in Mighty River Power’s performance. Together with increases in debt headroom and tenor and business-wide efficiency gains during the year, we have an excellent platform to drive future earnings and improvement in shareholder returns.
The Company recognised additional asset revaluations of $412 million for the year, taking total asset revaluations to almost $3 billion over the Company’s life, with $193 million of the uplift in 2011 attributable to the geothermal stations. These revaluations, along with across-the-board improvements in financial performance, demonstrate the real value created by the Company’s investment and operating strategies during recent years. Total Shareholder Return, based on independent equity valuations by PricewaterhouseCoopers, lifted in 2011 to 11.4%, reflecting the increase in the commercial value of equity during the year along with dividends paid, exceeding the SCI target of 10.2%.
Financial highlightsEarnings before interest, tax, depreciation and amortisation (EBITDAF) for the year ended 30 June 2011 were $443.1 million, up from $327.8 million the previous year, with the lift attributable to additional generation from our investment in the new geothermal plant (Nga Awa Purua) and above-average hydro production, together with the strong end-user sales in both residential and commercial, despite vigorous competition in these segments. The compound annualised growth rate of EBITDAF of 7.8% over the past five years reflects the ongoing improvement in financial performance of the Company.
Underlying earnings were up 16% from $139.6 million to $162.2 million, even after a $46.7 million increase in depreciation and amortisation – relating to the full-year impact of the new Nga Awa Purua plant, last year’s asset revaluations of
$371 million and lower amortisations in 2010. Interest costs were also higher due to higher average debt levels, lower interest capitalisation and rising effective interest rates due to long-term swap arrangements already in place.
Net profit after tax (NPAT) was up 50% from $84.6 million to $127.3 million. Impairments for the year fell from $31.4 million (reflecting the exit from the upstream gas business in FY2010) to $19.8 million, with the majority this year being attributed to a geothermal well. Unfavourable adjustments relate to mostly pre-tax fair value movements of $29 million, most of which were interest-related. International Financial Reporting Standards are increasingly making the preparation of accounts more challenging, particularly in the area of hedge accounting for derivatives. Substantial notes are provided in these accounts to assist the reader with the valuation intricacies of these financial instruments.
Core operating costs rose just 1.4% for the year, from $229.7 million to $232.8 million, reflecting the focus on cost containment across the business despite the first full year’s operating costs from Nga Awa Purua and increased sales and marketing costs due to the highly-competitive retail market.
Following the investments in new geothermal plants at Kawerau and Nga Awa Purua from FY2007 to FY2010, with no major domestic projects under construction this year, capital expenditure fell to $220 million, the lowest level in the past four years. Of this total, $85 million was attributable to investments in international geothermal projects and more than $70 million related to expenditure at Ngatamariki and on metering and other generation development. Reinvestment (stay in business) capital expenditure in FY2011 was $57 million, but is expected to increase to $90 million in FY2012, due to a focus on refurbishment of hydro assets and a planned refresh of Mercury Energy’s information systems.
RefinancingWe successfully completed a significant debt refinancing programme during the year with $510 million of new facilities negotiated, including the Company’s first US private placement of NZ$260 million equivalent – with the average debt maturity extended from 5.4 years to 6.4 years.
Standard & Poor’s reaffirmed the Company’s long-term credit rating as BBB+/stable after lifting the negative outlook which had been in place since May 2010. The outlook revision reflected the view that Mighty River Power’s financial flexibility has improved, and that near-term pressure on the Company’s credit metrics had subsided. Following the Company’s announcement to commence construction of the Ngatamariki station, Standard & Poor’s noted there was limited tolerance at the current rating level for any additional debt-funded projects. The Company confirmed its commitment to a stand-alone credit rating in the BBB range in its 2012 Statement of Corporate Intent.
At year-end, the Company had total debt facilities of more than $1.3 billion, with available headroom of more than $300 million. This has been significant in enabling the Company to fund our new Ngatamariki geothermal plant – a $466 million investment – from the balance sheet between now and 2013 and to meet the Company’s US$250 million commitment to the GeoGlobal Energy Fund. The Ngatamariki project cost includes all expenditure to date and capitalised interest during construction as well as a significant contingency allowance for steam field development either during construction or in the first five years after commissioning.
Our external reporting practices adhere to continuous disclosure processes and State-Owned Enterprise requirements, and are largely in line with listed company practices. Any transition to a mixed ownership model, should our Shareholders decide to proceed down this path, would not present any businesses continuity issues.
Business OverviewFinancial Review

Mighty River Power Limited Annual Report 2011 31
The Company recognised additional asset revaluations of $412 million for the year, taking total asset revaluations to almost $3 billion over the Company’s life, with $193 million of the uplift in 2011 attributable to the geothermal stations. William Meek, Chief Financial Officer

32 Mighty River Power Limited Annual Report 2011
DR DOUG HEFFERNAN Chief Executive
Doug Heffernan has been Chief Executive of Mighty River Power since the Company was formed in December 1998. Over the past decade, he has led the Company through a period of sustained growth and evolution from its initial beginnings as hydro-focused to a diversified electricity generator and retailer in New Zealand, with a growing international geothermal business. Doug is a Director of the Tuaropaki Power Company and of GeoGlobal Energy LLC, and Chairman of the Rotokawa Joint Venture. Prior to his current position, Doug was Chief Executive of Power New Zealand from 1991 to 1997. He has a PhD in Engineering from the University of Canterbury.
JAMES MUNRO General Manager Retail & Corporate Affairs
James is responsible for growing the value of Mighty River Power’s retail and metering businesses. He also manages the Company’s Corporate Communications and Legal functions. James joined the Company with a broad range of commercial experience, having started his career as an accountant and with a background split between media, finance and banking. Previously, he has worked for companies such as The Economist in London, TVNZ and St George Bank.
FRASER WHINERAY General Manager Operations
Fraser is responsible for maximising the performance of all of Mighty River Power’s generation operations and trading activities. He joined Mighty River Power in 2008 from Carter
Holt Harvey, where he was Director Operational Improvement. Prior to that he held a number of senior roles in the dairy industry and also spent five years with Credit Suisse First Boston in New Zealand and abroad. He has considerable experience in performance management, strategy, mergers and acquisitions, and international business. Fraser is a non-executive director of Opus International Consultants. He has a Bachelor of Chemical and Process Engineering from the University of Canterbury and a Master of Business Administration from Cambridge University.
MARK TRIGG General Manager Development
Mark is responsible for driving Mighty River Power’s generation development and growth strategy, both within New Zealand and internationally. He joined the Company in February 2010 following 14 years’ experience in the New Zealand electricity sector where he has held a number of senior executive roles. He brings a range of experience in operations, business development, trading and risk management, and strategy development. Prior to his career in the energy sector Mark worked in the financial markets sector in trading and sales roles. He has a Bachelor of Chemical and Materials Engineering from the University of Auckland.
BRIDGET O’SHANNESSEY General Manager Human Resources
Bridget leads Mighty River Power’s Human Resources team supporting the Company’s 800 employees across all business units. She took up her position in January 2010 following 15 years’ experience as a senior executive with a number of New Zealand and international organisations, working
predominantly in the human resources field. Previous positions include General Manager People, Culture & Corporate Relations for Bank of New Zealand, Director Human Resources for Hewlett-Packard & Compaq Computers and General Manager Human Resources for Carter Holt Harvey. Bridget brings a range of experience in organisational design, cultural transformation, mergers and acquisitions, and change management.
WILLIAM MEEK Chief Financial Officer
William leads both the finance and information services teams with a focus on financial and management reporting, treasury operations and process improvement. William was previously responsible for developing the Company’s generation investment strategy and enterprise risk functions. He has 15 years’ industry experience in areas such as risk management, development, wholesale markets and forecasting.
NEIL WILLIAMS Vice President Strategy Mighty River Power (US) LLC
Neil has been based in Washington DC since May 2010 working with GGE LLC, the management company for the GGE Fund. Prior to that he led the development of the International Geothermal Strategy from late 2007. He has previously headed our trading function and led regulatory strategy, and has over 16 years’ experience in the New Zealand electricity industry across retailing, distribution and trading.
ExecutiveManagement Team

Mighty River Power Limited Annual Report 2011 33
Performance TargetsPerformance Targets 2011 2011 Achieved/ Actual Target Not Achieved
Financial Performance Targets
Return on equity employed (%) 14.6 12.5 √
Return on total capital employed (%) 11.7 10.2 √
Total equity/total assets (%) 54.1 53.1 √
Free funds from operations/interest expense (%) 4.8 4.2 √
Free funds from operations/average debt (%) 31.8 23.7 √
Non-financial Performance Targets
Retail market share (%) 20.1 21.0 X1
Level of customer dissatisfaction lower than industry average Yes Yes √
Retain a ranking in the top two of the five major energy retailers in Consumer New Zealand survey of electricity suppliers’ performance Yes Yes √
Comply fully with Electricity Commission Guidelines for medically dependent and vulnerable customers Yes Yes √
Compliance orders by regulatory authorities None None √
Optimisation of power plant reliability: — plant availability (%) 89.2 91.0 X2 — forced outage factor (%) 3.1 <1.7 X2
Maintain the Group’s Enviro-Mark diamond status Yes Yes √
Lost time accidents – frequency rate per 100,000 hours worked 0.26 <0.4 √
1 Below target due to a focus on sales
volumes rather than customer numbers.
2 Below target due to planned and unplanned
maintenance activity on the Waikato Hydro System,
including flooding at Maraetai 2 Station. Extensive
hydro unit redundancy meant reduced availability
had minimal impact on financial performance.

34 Mighty River Power Limited Annual Report 2011
JOAN WITHERS Chair
Joan Withers was appointed a Director of Mighty River Power in August 2009. Joan is highly regarded as a Chair and Director across New Zealand business. She is the current Chair of Auckland International Airport, Deputy Chair of Television New Zealand, a Director of The Treasury Advisory Board, and a Trustee of the Sweet Louise and the Tindall Foundations. Joan has more than 20 years’ experience at a senior executive level in the New Zealand media industry, including serving as Chief Executive Officer of Fairfax New Zealand Ltd and the Radio Network of New Zealand. Joan is author of the book “A Girl’s Guide to Business”.
TREVOR JANES Deputy Chair
Trevor Janes joined the Mighty River Power Board in June 2005. He is Chair of the Public Trust, Deputy Chair of NZX-listed Abano Healthcare, a Director of ProCare Health Ltd and LPF Group. Trevor is also a Member of the MFAT Overseas Development Assistance Advisory Board and of the NZ Post Network Access Committee. He is a Chartered Accountant and Fellow of the Institute of Directors and of the Institute of Financial Professionals NZ Inc, and a member of the CFA Institute (USA) and the UK Society of Investment Professionals.
DR MICHAEL ALLEN Director
Michael Allen was appointed a Director of Mighty River Power in November 2009. With a background in engineering, he has 25 years’ experience in the management, promotion and marketing of international geothermal engineering consulting. He has been involved in more than 20 geothermal developments in 12 countries and has undertaken project
consultancy in South East Asia, Africa, Japan, and Central and South America, and has been active in brokering finance from banking and private equity sources for more than 50 projects internationally. Michael is also Chair of ReEx Capital Asia (Singapore), a Director of Mid Century Design and Trustee of Allen Hanley Trust.
PRUE FLACKS Director
Prue Flacks joined the Mighty River Power board as a Director in May 2010. She is a barrister and solicitor with extensive specialist experience in commercial law and, in particular, banking and finance and securities law. Prue is a consultant to Russell McVeagh, where she was a partner for 20 years. She is a Director Designate of Chorus Ltd and has also been a Director of Bank of New Zealand Ltd since 2009 and is a trustee of the Victoria University of Wellington Foundation.
JON HARTLEY Director
Jon Hartley was appointed a Director of Mighty River Power in November 2009. He is a Deputy Chair of ASB Bank Ltd, ASB Life Ltd and VisionFund International Ltd, a Director Designate of Chorus Ltd, and a Director of VisionFund Cambodia Ltd, Mission Residential Care Ltd and Trango Capital Ltd. He is also a Trustee of World Vision New Zealand and Wellington City Mission. Jon is a Chartered Accountant and a Fellow of the Australian Institute of Directors. He has lived and worked in several countries and held senior executive and non-executive roles across a diverse range of commercial and not-for-profit organisations.
PAREKāWHIA MCLEAN Director
Parekāwhia McLean was appointed a Director of Mighty River Power in November 2010. She has over 20 years’
experience in public policy and senior public sector management. Parekāwhia is Chief Executive of Waikato Tainui, a Director of Mauriora-ki-te-Ao/Living Universe and Trustee for the Waimarino Trust. She is also a member of the NZ Institute of Public Administration and the Maori Women’s Welfare League.
SANDY MAIER Director
Sandy Maier has been a Director of Mighty River Power since April 2002 and is Chair of its Human Resources Committee. Sandy has served as an independent director for more than 20 years. Prior to these governance
Board of Directors

Mighty River Power Limited Annual Report 2011 35
roles, Sandy worked in a number of international senior banking positions for 15 years. He currently has his own consulting firm specialising in corporate strategy and governance, and financial and human resource issues.
TANIA SIMPSON Director
Tania Simpson became a Director of Mighty River Power in November 2001, making her the longest-serving member of the current Board. Tania is the founding Director of Maori policy adviser, Kowhai Consulting Ltd. She has previously held management positions in Housing Corporation, Ministry of
Maori Development and Office of Treaty Settlements and has worked on social policy, economic development and Treaty-related matters. She is of Ngati Maniapoto and Ngati Manu descent and lives in the Maniapoto district. Tania is a Member of the Waitangi Tribunal, a Director of Oceania Group Ltd, Landcare Research NZ Ltd, and a Trustee of the Kowhai Trust and Tui Trust.
KEITH SMITH Director
Keith Smith was appointed a Director of Mighty River Power in May 2009 and is Chair of its Risk Assurance and Audit Committee. Keith brings considerable
experience and governance expertise to the Board. He is Chair of a number of companies including Tourism Holdings Ltd and Goodman (NZ), and is Deputy Chair of The Warehouse Group Ltd. Keith is a Director of PGG Wrightson and various private companies. He was previously Deputy Chair of Genesis Power (1999-2006), and a past President of the New Zealand Institute of Chartered Accountants.

36 Mighty River Power Limited Annual Report 2011
Corporate GovernanceThe Board of Mighty River Power is guided by best practice corporate governance and adheres to a comprehensive Board Charter. As a State-Owned Enterprise, Mighty River Power operates under a corporate governance framework consisting of its legal requirements (such as the Companies Act 1993 and the State-Owned Enterprises Act 1986) and formal and informal practices adopted by the Board. Although Mighty River Power is a State-Owned Enterprise it received no direct financial assistance from the Government. The Company made no financial or in-kind donations to any political parties, politicians or related institutions.
Role of the BoardThe Board is responsible for the overall direction of Mighty River Power’s business and other activities on behalf of shareholding Ministers. The Company’s principal objectives are to operate as a successful business and to be:• Asprofitableandefficient
as comparable businesses not owned by the Crown;
• Agoodemployer;• Anorganisationthatdisplays
an informed sense of social responsibility by having regard for the interests of the communities in which the Company operates and by supporting these communities when able to do so;
• Aleaderinachievingsustainabledevelopment, of our business and for the communities in which the Company operates, through world’s best management of generation resources.
Board MembershipThe Board is made up of nine non-executive Directors. Their profiles can be read on pages 34-35.
Board Committees To assist Directors to carry out their duties, the Board has two standing committees. Other ad hoc committees may be formed from time to time.
Risk Assurance and Audit CommitteeThe Risk Assurance and Audit Committee was chaired by Trevor Janes until 30 April 2011, then by Keith Smith until 30 June 2011. The Committee’s role is to provide assurance to the Board that risks and threats to the business are being managed properly. The Committee also reviews the performances of internal and external auditors. Internal audit is outsourced to Deloitte. All Directors are invited to attend the Risk Assurance and Audit Committee meetings and are provided with copies of meeting minutes and any reports received by the committee.
Human Resources CommitteeThe Human Resources Committee is chaired by Sandy Maier. The Committee’s primary role is to consider organisational matters and remuneration policies concerning the Company’s employees and assure the Board of the Company’s development of people capabilities and competencies. Board Performance ReviewEach year, the Board evaluates the performance of the Board as a whole and of the Chair. This is done using a variety of techniques including external consultants, questionnaires and Board discussion. The Chair’s performance is reviewed by all Directors and is then discussed with the Chair. In the 2011 financial year, senior management also took part in the process of Board evaluation.
PlanningThe Board held a strategic planning session and other review sessions this year. It also approved the Company’s draft Statement of
Corporate Intent for shareholder approval, business plan, and budgets as part of its normal functions.
Risk ManagementIt is a Board responsibility to identify and control the Company’s business risks. Major policies, which are subject to the Board’s approval and review, include: capital investment; treasury; electricity trading and risk management; accounting and financial; insurance and delegated authority limits. As part of managing its broader risk profile, the Board recognises the importance of full compliance with laws controlling environmental activities, management of natural resources, health and safety in employment, working conditions within buildings, and customer health and safety. The Board monitors the Company’s compliance with relevant statutes through the regular reports it receives from management.
Auditor IndependenceThe Board’s policy on auditor independence from management places responsibility for managing the relationship with the Risk Assurance and Audit Committee. During the year, the Board reviewed the Company’s relationship with the auditor of its financial statements, Brent Penrose of Ernst & Young, on behalf of the Auditor-General. This review confirmed the present audit arrangements and noted no need to change them. The Risk Assurance and Audit Committee also reviewed the scope of services provided to Mighty River Power by Brent Penrose of Ernst & Young. This review confirmed no issues around auditor independence.
Corporate GovernanceThe Board of Directors has responsibility for ensuring the Company has effective policies in place to manage its risks. The Board decides the level
Corporate Governance

Mighty River Power Limited Annual Report 2011 37
and nature of the risks which are acceptable to the Company. The Chief Executive has overall responsibility for the day-to-day running of the Company and the day-to-day management of normal business risk.
Statement of Corporate IntentIn accordance with its obligations under the State-Owned Enterprises Act, the Company publishes an annual Statement of Corporate Intent as approved by its shareholders, which communicates the goals and strategies of the Company and outlines its expected performance. This document also contributes to Mighty River Power’s disclosure obligations.
Compliance with Security Commission GuidelinesMighty River Power complies fully with the Security Commission Principles for Corporate Governance. A summary of our compliance with these principles may be found on the Mighty River Power website.
Indemnity and InsuranceMighty River Power Limited has resolved to indemnify Directors and employees for any costs or liabilities referred to in Section 162 (3) and 162 (4) of the Companies Act 1993. The Company has arranged insurance for those Directors and employees in respect of any liability or costs referred to in Section 162 (5) of the Companies Act 1993.
Loans to DirectorsThere were no loans by the Group to Directors.
Directors’ use of Information There were no notices from Directors of the Group requesting to use Company information received in their capacity as Directors that would not otherwise have been available to them.
Corporate ResponsibilityThe Board accepts the Company’s position that corporate responsibility is part of the fabric of Mighty River Power. This is part of the Company’s everyday approach to good business practices. More detail on the Company’s approach to corporate responsibility can be read in the body of this report and on the Company website.
Code of EthicsMighty River Power’s Directors comply with a Code of Ethics setting out the ethical and behavioural standards expected Company-wide. The Code of Ethics covers Directors’ obligations in performance of their duties. A copy of this document is available on the Company website.

38 Mighty River Power Limited Annual Report 2011
Directors’ InterestsDisclosures of Directors’ InterestsThe general disclosures of interest made by the Directors of Mighty River Power Limited pursuant to Section 140 (2) of the Companies Act 1993 are shown in the table below. There were no declarations of interests made pursuant to Section 140 (1) of the Companies Act 1993 that were entered in the interests register of Mighty River Power Limited or its subsidiaries for the reporting period. No Director of Mighty River Power Limited is a shareholder of Mighty River Power Limited or any of its subsidiaries. Mighty River Power Limited has resolved to indemnify Directors and employees for any costs or liabilities referred to in Section 162 (3) and 162 (4) of the Companies Act 1993. The Company has arranged insurance for those Directors and employees in respect of any liability or costs referred to in Section 162 (5) of the Companies Act 1993.
Director Position Company
Joan Withers (Chair) Chair Auckland International Airport Limited
Deputy Chair Television New Zealand Limited
Director The Treasury Advisory Board
Trustee Sweet Louise Foundation
Trustee The Tindall Foundation
Trustee Pure Advantage
Trevor Janes (Deputy Chair) Chair Public Trust
Deputy Chair and Audit Committee Chair Abano Healthcare Group Limited
Director ProCare Health Limited
Director and Shareholder LPF Group Limited and various subsidiary and associated companies
Member MFAT Overseas Development Assistance Advisory Board
Member NZ Post Network Access Committee
Chair GGE Investment Committee
Member ACC (Ceased)
Sandy Maier Chair Geon Group Limited and subsidiaries
Chair Click Clack Limited
Chair Learning Media Limited
Chair Pathfinder Asset Management Limited
Chair Radius Properties Limited
Director Fronde Systems Group Limited
Director McConnell Limited and subsidiaries
Director Ngai Tahu Holdings Corporation Limited
Director Perpetual Capital Management Limited
Director Taranaki Investment Management Limited
Director and Shareholder Ultimate Care Group Limited and subsidiaries
Director and Shareholder Maier Limited
Director and Shareholder Tilda Holdings Limited
Principal New Zealand Equity Partners
Shareholder Directions Understanding Governance Limited
Shareholder Escalator Advertising Limited
Shareholder Lincoln Capital
Chief Executive Officer South Canterbury Finance Limited (Ceased)
Southbury Corporation Limited (Ceased)
Oyster Bay Marlborough Vineyards Limited (Ceased)
Tania Simpson Director Landcare Research New Zealand Limited
Director and Shareholder Kowhai Consulting Limited
Director and Shareholder Oceania Group Limited
Trustee Kowhai Trust
Trustee Tui Trust
Trustee Radio Maniapoto

Mighty River Power Limited Annual Report 2011 39
Trustee Waikato Endowed Colleges Trust
Member Waitangi Tribunal
Keith Smith Chair Healthcare Holdings Limited
Chair Enterprise Motor Group Ltd and various subsidiary and associated companies
Chair H J Asmuss & Co Limited
Chair Mobile Surgical Services Limited and various subsidiary and associated companies
Chair Tourism Holdings Limited
Chair Goodman (NZ) Limited and subsidiaries
Deputy Chair The Warehouse Group Limited and subsidiaries
Director PGG Wrightson Limited and subsidiaries
Director Community Financial Services Limited
Director Electronic Navigation Limited and various subsidiary and associated companies
Director K One W One Limited and various subsidiary and associated companies
Director The Ascot Hospital & Clinics Limited and subsidiaries
Director and Shareholder New Zealand Farming Systems Uruguay Limited (Ceased)
Director and Shareholder Harpers Gold Limited and subsidiaries
Trustee Cornwall Park Trust Board
Trustee Sir John Logan Campbell Residuary Estate
Dr Michael Allen Chair and Shareholder ReEx Capital Asia Limited (Singapore)
Director and Shareholder Mid Century Design Limited
Trustee Allen Hanley Trust
Member GGE Investment Committee
Jon Hartley Deputy Chair ASB Bank Ltd & ASB Group (Life) Ltd
Director VisionFund International Limited
Director VisionFund Cambodia Limited
Director Mission Residential Care Limited
Director and Shareholder Trustee Trango Capital Limited
Trustee World Vision New Zealand
Trustee Wellington City Mission
Trustee Hartley Family Trust
Trustee Yorkshire Trust (Family Trust)
Advisory Group Member TR Group Ltd
Prue Flacks Director Bank of New Zealand Limited
Director BBull Family Trust Limited
Director Planboe Limited
Trustee Victoria University Foundation
Member GGE Investment Committee
Joanne (Parekāwhia) Mclean Director Mauriora-ki-te-Ao/Living Universe Limited
Trustee Waimarino Trust
Board Member Te Mangai Paho – Maori Broadcasting Funding Agency
Chief Executive Officer Waikato-Tainui
Diana Crossan Chair Whai Rawa Fund Limited
Chair Orangi Kaupapa Trust
Chair Refugees in Business, Wellington
Director Future New Zealand Limited
Retired 01.11.10

40 Mighty River Power Limited Annual Report 2011
Remuneration PhilosophyMighty River Power’s remuneration strategy aims to attract, retain and motivate high calibre employees at all levels of the organisation, and so drive performance and growth in shareholder value and return. The remuneration strategy is underpinned by a philosophy of pay for performance and market-competitive Total Remuneration.
Executive RemunerationThe Company’s Total Remuneration policy for its executives provides the opportunity for them to be paid in the upper quartile for equivalent market-matched roles. In determining an executive’s Total Remuneration, external benchmarking is undertaken to ensure comparability and competition along with consideration of an individual’s performance, skills, expertise and experiences. Executive Total Remuneration is made up of three components; Fixed Remuneration, Short-Term Performance Incentives and Long-Term Performance Incentives.
Fixed RemunerationFixed Remuneration consists of base salary and benefits. The Company’s policy is to pay Fixed Remuneration comparable to the market median.
Short-Term Performance IncentivesShort-Term Performance Incentives are at-risk payments aligned to annual performance scorecards. The scorecards define targets and objectives in the areas of Finance, Operational Excellence, Reputation and People and link directly to the Company’s business plans. The Short-Term Performance Incentive remuneration targets are expressed as a percentage of base salary and are set and evaluated annually.
Long-Term Performance IncentivesLong-Term Performance Incentives are cash-based payments aligned to performance targets incentivising the enhancement of long-term shareholder value measured against multi-year targets. The Long-Term Performance Incentives remuneration target is a percentage of base salary. A payment is only made when the targets are achieved. In future this will be at the conclusion of the multi-year performance period.The Company’s Human Resources Remuneration Committee reviews and approves annual performance appraisals for executives and is provided with external market analysis information and trends.
Chief Executive RemunerationThe Chief Executive’s Total Remuneration in the 2011 financial year was $1,769,342 (2010 financial year $1,317,469).
Fixed RemunerationThe Chief Executive’s Fixed Remuneration for the 2011 financial year was $962,069 ($934,125 in 2010). The increase in Fixed Remuneration was due to April 2011 legislative changes regarding annual leave rate calculations.
Short-Term Performance Incentive A short-term incentive payment of $163,940 ($170,011 in 2010) was made to the Chief Executive for performance in the 2010 financial year.
Chief Executive’s Short-Term Performance Incentive
Weight
Financial; performance against plan & Total Shareholder Return 40%
Operational Excellence; performance against business plan & objectives 20%
Reputation; relationship enhancement & leadership 25%
People; culture, Health & Safety, talent & succession 15%
Remuneration Report
Long-Term Performance IncentiveA payment of $643,333 ($213,333 in 2010) was made during the 2011 financial year under the Chief Executive’s contracted Long-Term Performance Incentive plan. This payment was based on performance over the 2009-2010 financial years.
Chief Executive’s Long-Term Performance Incentive
Weight
Domestic; creating future domestic growth opportunities 30%
International; securing international geothermal investments 70%
Employees RemunerationThe Group paid remuneration in excess of $100,000 including benefits to 243 employees (not including Directors or Chief Executive) during the year in the following bands:
Remuneration Bands Year ended 30 June 2011
$100,001 - $110,000 65
$110,001 - $120,000 42
$120,001 - $130,000 33
$130,001 - $140,000 20
$140,001 - $150,000 16
$150,001 - $160,000 13
$160,001 - $170,000 8
$170,001 - $180,000 7
$180,001 - $190,000 3
$190,001 - $200,000 2
$200,001 - $210,000 8
$210,001 - $220,000 4
$230,001 - $240,000 4
$240,001 - $250,000 2
$260,001 - $270,000 4
$270,001 - $280,000 1
$280,001 - $290,000 1
$300,001 - $310,000 1
$320,001 - $330,000 1
$350,001 - $360,000 2
$400,001 - $410,000 2
$430,001 - $440,000 2
$440,001 - $450,000 1
$520,001 - $530,000 1

Mighty River Power Limited Annual Report 2011 41
The Directors are responsible for ensuring that the financial statements comply with generally accepted accounting practices and represent a true and fair view of Mighty River Power Limited’s financial position as at 30 June 2011, and of the financial performance and cash flows for the current financial year.
The Directors consider that the Group and Company’s financial statements have been prepared using the appropriate accounting policies, that these have been consistently applied and are supported by reasonable judgements and estimates, and that all relevant financial and accounting standards have been followed.
The Directors believe that proper accounting records have been kept which allow for the determination of the Group and Company’s financial position with reasonable accuracy, and that the financial statements themselves comply with the Financial Reporting Act 1993 and the Companies Act 1993.
The Directors consider that they have taken adequate steps to safeguard the Group and Company’s assets and to prevent and, where necessary, detect fraud and any other irregularities.
The Auditor-General is required to be the Company’s auditor, and has appointed Mr Brent Penrose of Ernst & Young to undertake the audit on her behalf.
The Directors are pleased to present Mighty River Power Limited’s annual report and financial statements for the year ended 30 June 2011.
Events Subsequent to Balance Date The Directors are not aware of any circumstances since the end of the year that have significantly or may significantly affect the operations of the Group.
Annual Report Certificate This Annual Report is dated 30 August, 2011 and is signed on behalf of theBoard by:
JOAN WITHERSChair30 August 2011
TREVOR JANES Deputy Chair 30 August 2011
Directors’ Responsibility Statement
Directors’ RemunerationThe following people held office as Director during the year to 30 June 2011 and received the following remuneration during the period:
Joan Withers (Chair) $97,056
Trevor Janes (Deputy Chair) $65,513
Michael Allen $48,528
Prue Flacks $48,528
Jon Hartley $48,528
Parekāwhia McLean (appointed 1 November 2010) $32,352
Sandy Maier $48,528
Tania Simpson $48,528
Keith Smith $48,528
Diana Crossan (resigned 1 November 2010) $16,176
42 Mighty River Power Limited Annual Report 2011
TO THE READERS OF MIGHTY RIVER POWER LIMITED AND GROUP’S FINANCIAL STATEMENTS FOR THE YEAR ENDED 30 JUNE 2011
The Auditor-General is the auditor of Mighty River Power Limited (the Company) and Group. The Auditor-General has appointed me, Brent Penrose, using the staff and resources of Ernst & Young to carry out the audit of the financial statements of the Company and Group, on her behalf.
We have audited the financial statements of the Company and Group on pages 46 to 94, that comprise the balance sheet as at 30 June 2011, the income statement, statement of comprehensive income, statement of changes in equity, and cash flow statement for the year ended on that date, and the notes to the financial statements that include accounting policies and other explanatory information.
Opinion on the Financial Statements In our opinion the financial statements of the Company and Group on pages 46 to 94:• complywithgenerallyacceptedaccountingpracticeinNewZealand;• complywithInternationalFinancialReportingStandards;and• giveatrueandfairviewoftheCompanyandGroup’s: • financialpositionasat30June2011;and • financialperformanceandcashflowsfortheyearendedonthatdate.
Opinion on other Legal RequirementsIn accordance with the Financial Reporting Act 1993 we report that, in our opinion, proper accounting records have been kept by the Company and Group as far as appears from an examination of those records.
Our audit was completed on 30 August 2011. This is the date at which our opinion is expressed.
The basis of our opinion is explained below. In addition, we outline the responsibilities of the Board of Directors and our responsibilities, and explain our independence.
Basis of OpinionWe carried out our audit in accordance with the Auditor-General’s Auditing Standards, which incorporate the International Standards on Auditing (New Zealand). Those standards require that we comply with ethical requirements and plan and carry out our audit to obtain reasonable assurance about whether the financial statements are free from material misstatement.
Material misstatements are differences or omissions of amounts and disclosures that would affect a reader’s overall understanding of the financial statements. If we had found material misstatements that were not corrected, we would have referred to them in our opinion.
An audit involves carrying out procedures to obtain audit evidence about the amounts and disclosures in the financial statements. The procedures selected depend on our judgement, including our assessment of risks of material misstatement of the financial statements whether due to fraud or error. In making those risk assessments, we consider internal control relevant to the preparation of the Company and Group’s financial statements that give a true and fair view of the matters to which they relate. We consider internal control in order to design audit procedures that are appropriate in the circumstances but not for the purpose of expressing an opinion on the effectiveness of the Company and Group’s internal control.
An audit also involves evaluating:• theappropriatenessofaccountingpoliciesusedandwhethertheyhavebeenconsistentlyapplied;• thereasonablenessofthesignificantaccountingestimatesandjudgementsmadebytheBoardofDirectors;• theadequacyofalldisclosuresinthefinancialstatements;and• theoverallpresentationofthefinancialstatements.
Independent Auditor’s Report
Chartered Accountants

Mighty River Power Limited Annual Report 2011 43
We did not examine every transaction, nor do we guarantee complete accuracy of the financial statements. In accordance with the Financial Reporting Act 1993, we report that we have obtained all the information and explanations we have required. We believe we have obtained sufficient and appropriate audit evidence to provide a basis for our audit opinion.
Responsibilities of the Board of DirectorsThe Board of Directors is responsible for preparing financial statements that:• complywithgenerallyacceptedaccountingpracticeinNewZealand;and•giveatrueandfairviewoftheCompanyandGroup’sfinancialposition,financialperformanceandcashflows.
The Board of Directors is also responsible for such internal control as it determines is necessary to enable the preparation of financial statements that are free from material misstatement, whether due to fraud or error.
The Board of Directors’ responsibilities arise from the State-Owned Enterprises Act 1986 and the Financial Reporting Act 1993.
Responsibilities of the AuditorWe are responsible for expressing an independent opinion on the financial statements and reporting that opinion to you based on our audit. Our responsibility arises from section 15 of the Public Audit Act 2001 and section 19 (1) of the State-Owned Enterprises Act 1986.
IndependenceWhen carrying out the audit we followed the independence requirements of the Auditor-General, which incorporate the independence requirements of the New Zealand Institute of Chartered Accountants.
In addition to the audit, we have carried out an assignment in the area of agreed upon procedures which is compatible with these independence requirements. Other than the audit and this assignment, we have no relationship with or interests in the Company or any of its subsidiaries.
BRENT PENROSEErnst & YoungOn behalf of the Auditor-GeneralAuckland, New Zealand

44 Mighty River Power Limited Annual Report 2011

Mighty River Power Limited Annual Report 2011 45
Financial Statements 46 Income Statement47 Statement of Comprehensive Income48 Statement of Changes in Equity50 Balance Sheet 51 Cash Flow Statement52 Notes to the Financial Statements

46 Mighty River Power Limited Annual Report 2011
Group Group Company Company Note 2011 2010 2011 2010 $000 $000 $000 $000
Sales 1,546,740 1,485,088 1,421,536 1,405,208
Less line charges (404,031) (403,286) (395,552) (399,383)
Other revenue 21,172 22,773 22,580 25,998
Total revenue 1,163,881 1,104,575 1,048,564 1,031,823
Energy costs 445,971 500,737 446,344 500,737
Other direct cost of sales, including metering 42,025 46,384 25,319 37,529
Employee compensation and benefits 74,599 74,723 68,751 72,297
Maintenance expenses 55,866 57,958 41,545 41,631
Sales and marketing 19,458 16,505 18,979 16,208
Contractors’ fees 11,268 12,849 10,919 15,487
Professional services 15,051 11,167 11,321 11,108
Other expenses 56,590 56,464 69,090 49,419
Total expenses 720,828 776,787 692,268 744,416
Earnings before net interest expense, income tax, depreciation,
amortisation and financial instruments (EBITDAF) 443,053 327,788 356,296 287,407
Depreciation and amortisation 4 (145,404) (98,707) (99,842) (67,636)
Change in the fair value of financial instruments 25 (25,621) 8,081 (26,739) 7,973
Impaired assets 4 (19,786) (31,373) (56,823) (8,908)
Equity accounted earnings of associate companies 16 2,069 (11,703) - -
Equity accounted earnings of interest in jointly controlled entities 18 2,935 (21,992) - -
Earnings before net interest expense and income tax (EBIT) 257,246 172,094 172,892 218,836
Interest expense 4 (74,629) (34,394) (72,230) (34,104)
Interest income 2,843 3,653 719 4,180
Net interest expense (71,786) (30,741) (71,511) (29,924)
Profit before income tax 185,460 141,353 101,381 188,912
Income tax expense 5 (58,387) (56,739) (46,469) (60,068)
Net profit for the year 127,073 84,614 54,912 128,844
Net profit for the period is attributable to:
Owners of the parent 127,087 84,647 54,912 128,844
Non-controlling interests (14) (33) - -
127,073 84,614 54,912 128,844
Income StatementFor the year ended 30 June 2011
The accompanying notes form an integral part of these financial statements.

Mighty River Power Limited Annual Report 2011 47
Group Group Company Company Note 2011 2010 2011 2010 $000 $000 $000 $000
Net profit for the year 127,073 84,614 54,912 128,844
Other comprehensive income
Fair value revaluation of hydro and co-generation assets 11 219,000 287,000 219,000 287,000
Fair value revaluation of other generation assets 11 193,250 85,048 - -
Fair value revaluation of office land and buildings 11 - (950) - (950)
Equity accounted share of movements in associates’ reserves 16 (3,065) 19,865 - -
Release of the available for sale investment
reserve to the income statement - 3,097 - 3,097
Movement in available for sale investment reserve (858) - (858) -
Retained losses acquired on amalgamation - - - (11,062)
Movements in foreign currency translation reserve (31,146) 610 - -
Cash flow hedges gain/(loss) taken to or released from equity (107,445) (89,281) (88,517) (82,851)
Income tax on items of other comprehensive income 5 (91,184) (85,041) (38,888) (62,173)
Impact of tax rate change 6,797 48,216 3,305 41,733
Other comprehensive income for the year, net of taxation 185,349 268,564 94,042 174,794
Total comprehensive income for the year 312,422 353,178 148,954 303,638
Total comprehensive income for the year is attributable to:
Owners of the parent 312,436 353,211 148,954 303,638
Non-controlling interests (14) (33) - -
312,422 353,178 148,954 303,638
Statement of Comprehensive IncomeFor the year ended 30 June 2011
The accompanying notes form an integral part of these financial statements.

48 Mighty River Power Limited Annual Report 2011
Available Foreign for sale currency Asset Cash flow Non- Issued Retained investment translation revaluation hedge controlling Total capital earnings reserve reserve reserve reserve interest equity $000 $000 $000 $000 $000 $000 $000 $000
Group
Balance as at 1 July 2009 377,561 709,461 (2,168) 15 1,534,035 2,696 - 2,621,600
Fair value revaluation of hydro and co-generation
assets, net of taxation - - - - 200,900 - - 200,900
Fair value revaluation of other generation
assets, net of taxation - - - - 60,250 - - 60,250
Fair value revaluation of office land and
buildings, net of taxation - - - - (950) - - (950)
Equity accounted share of movements
in associate’s reserves - - - - 21,020 (1,155) - 19,865
Release of reserve to the income statement, net of taxation - - 2,168 - - - - 2,168
Movements in foreign currency translation reserve - - - 610 - - - 610
Cash flow hedges gain/(loss) taken to or released
from equity, net of taxation - - - - - (62,495) - (62,495)
Release of asset revaluation reserve for assets
taken out of service, net of taxation - 158 - - (158) - - -
Impact of tax rate change - - - - 50,652 (2,436) - 48,216
Other comprehensive income - 158 2,168 610 331,714 (66,086) - 268,564
Net profit for the year - 84,647 - - - - (33) 84,614
Total comprehensive income - 84,805 2,168 610 331,714 (66,086) (33) 353,178
Non-controlling interest - - - - - - 192 192
Dividend - (286,000) - - - - - (286,000)
Balance as at 30 June 2010 377,561 508,266 - 625 1,865,749 (63,390) 159 2,688,970
Balance as at 1 July 2010 377,561 508,266 - 625 1,865,749 (63,390) 159 2,688,970
Fair value revaluation of hydro and co-generation
assets, net of taxation - - - - 153,300 - - 153,300
Fair value revaluation of other generation
assets, net of taxation - - - - 135,275 - - 135,275
Equity accounted share of movements
in associate’s reserves - - - - (3,075) 10 - (3,065)
Net loss on available for sale investment reserve - - (600) - - - - (600)
Movements in foreign currency translation reserve - - - (31,146) - - - (31,146)
Cash flow hedges gain/(loss) taken to or released
from equity, net of taxation - - - - - (75,212) - (75,212)
Impact of tax rate change - - (17) - 8,245 (1,431) - 6,797
Other comprehensive income - - (617) (31,146) 293,745 (76,633) - 185,349
Net profit for the year - 127,087 - - - - (14) 127,073
Total comprehensive income - 127,087 (617) (31,146) 293,745 (76,633) (14) 312,422
Non-controlling interest - - - - - - 150 150
Dividend - (95,000) - - - - - (95,000)
Balance as at 30 June 2011 377,561 540,353 (617) (30,521) 2,159,494 (140,023) 295 2,906,542
Statement of Changes in EquityFor the year ended 30 June 2011
The accompanying notes form an integral part of these financial statements.

Mighty River Power Limited Annual Report 2011 49
Available Foreign for sale currency Asset Cash flow Issued Retained investment translation revaluation hedge Total capital earnings reserve reserve reserve reserve equity $000 $000 $000 $000 $000 $000 $000
Company
Balance as at 1 July 2009 377,561 779,586 (2,168) - 1,341,149 3,464 2,499,592
Fair value revaluation of hydro and co-generation
assets, net of taxation - - - - 200,900 - 200,900
Fair value revaluation of office land and
buildings, net of taxation - - - - (950) - (950)
Release of reserve to the income statement, net of taxation - - 2,168 - - - 2,168
Cash flow hedges gain/(loss) taken to or released
from equity, net of taxation - - - - - (57,995) (57,995)
Retained losses acquired on amalgamation - (11,062) - - - - (11,062)
Release of asset revaluation reserve for assets
taken out of service, net of taxation - 158 - - (158) - -
Impact of tax rate change - - - - 44,031 (2,298) 41,733
Other comprehensive income - (10,904) 2,168 - 243,823 (60,293) 174,794
Net profit for the year - 128,844 - - - - 128,844
Total comprehensive income - 117,940 2,168 - 243,823 (60,293) 303,638
Dividend - (286,000) - - - - (286,000)
Balance as at 30 June 2010 377,561 611,526 - - 1,584,972 (56,829) 2,517,230
Balance as at 1 July 2010 377,561 611,526 - - 1,584,972 (56,829) 2,517,230
Fair value revaluation of hydro and co-generation
assets, net of taxation - - - - 153,300 - 153,300
Net loss on available for sale investment reserve - - (600) - - - (600)
Cash flow hedges gain/(loss) taken to or released
from equity, net of taxation - - - - - (61,963) (61,963)
Impact of tax rate change - - (17) - 4,380 (1,058) 3,305
Other comprehensive income - - (617) - 157,680 (63,021) 94,042
Net profit for the year - 54,912 - - - - 54,912
Total comprehensive income - 54,912 (617) - 157,680 (63,021) 148,954
Dividend - (95,000) - - - - (95,000)
Balance as at 30 June 2011 377,561 571,438 (617) - 1,742,652 (119,850) 2,571,184
Statement of Changes in EquityFor the year ended 30 June 2011
The accompanying notes form an integral part of these financial statements.

50 Mighty River Power Limited Annual Report 2011
Group Group Company Company 2011 2010 2011 2010 Note $000 $000 $000 $000
SHAREHOLDERS’ EQUITY
Issued capital 7 377,561 377,561 377,561 377,561
Reserves 2,528,686 2,311,250 2,193,623 2,139,669
Non controlling interest 295 159 - -
Total shareholders’ equity 2,906,542 2,688,970 2,571,184 2,517,230
ASSETS
CURRENT ASSETS
Cash and cash equivalents 8 28,722 7,905 3,758 2,224
Receivables 9 199,868 174,635 886,369 815,236
Inventories 10 23,015 20,226 17,970 15,462
Derivative financial instruments 25 36,871 35,476 43,412 34,534
Taxation receivable - - 2,571 -
Total current assets 288,476 238,242 954,080 867,456
NON-CURRENT ASSETS
Property, plant and equipment 11 4,749,506 4,307,547 3,495,519 3,303,787
Intangible assets 12 38,821 32,114 25,336 21,716
Emissions units 13 429 - 425 -
Available for sale financial assets 14 1,191 2,049 1,191 2,049
Investment in subsidiaries 15 - - 231,455 284,355
Investment and advances to associates 16 76,252 113,614 4,535 31,806
Investment in jointly controlled entities 18 98,970 111,926 - -
Advances 19 10,877 11,841 - -
Receivables 9 378 - 1,511 -
Derivative financial instruments 25 111,687 77,567 130,690 86,653
Total non-current assets 5,088,111 4,656,658 3,890,662 3,730,366
Total assets 5,376,587 4,894,900 4,844,742 4,597,822
LIABILITIES
CURRENT LIABILITIES
Payables and accruals 20 180,431 148,469 156,603 134,859
Provisions 21 4,200 2,673 230 211
Current portion loans 22 12,081 5,950 12,081 5,950
Derivative financial instruments 25 164,541 143,155 164,541 143,736
Taxation payable 4,271 10,596 - 13,965
Total current liabilities 365,524 310,843 333,455 298,721
NON-CURRENT LIABILITIES
Payables and accruals 20 21,298 - 21,298 -
Derivative financial instruments 25 234,481 132,685 237,988 133,927
Loans 22 973,400 972,808 973,400 972,808
Deferred tax 23 875,342 789,594 707,417 675,136
Total non-current liabilities 2,104,521 1,895,087 1,940,103 1,781,871
Total liabilities 2,470,045 2,205,930 2,273,558 2,080,592
NET ASSETS 2,906,542 2,688,970 2,571,184 2,517,230
For and on behalf of the Board of Directors who authorised the issue of the Financial Statements on 30 August 2011.
Balance SheetAs at 30 June 2011
The accompanying notes form an integral part of these financial statements.
JOAN WITHERSChair30 August 2011
TREVOR JANES Deputy Chair 30 August 2011
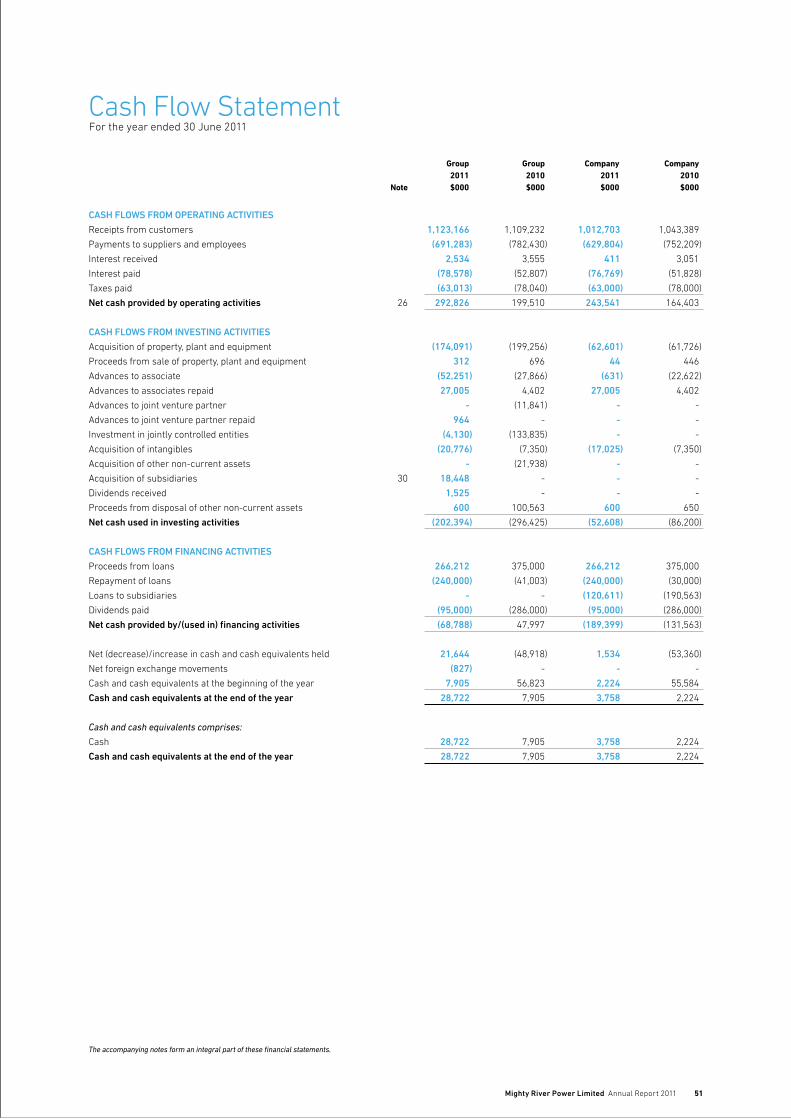
Mighty River Power Limited Annual Report 2011 51
Group Group Company Company 2011 2010 2011 2010 Note $000 $000 $000 $000
CASH FLOWS FROM OPERATING ACTIVITIES
Receipts from customers 1,123,166 1,109,232 1,012,703 1,043,389
Payments to suppliers and employees (691,283) (782,430) (629,804) (752,209)
Interest received 2,534 3,555 411 3,051
Interest paid (78,578) (52,807) (76,769) (51,828)
Taxes paid (63,013) (78,040) (63,000) (78,000)
Net cash provided by operating activities 26 292,826 199,510 243,541 164,403
CASH FLOWS FROM INVESTING ACTIVITIES
Acquisition of property, plant and equipment (174,091) (199,256) (62,601) (61,726)
Proceeds from sale of property, plant and equipment 312 696 44 446
Advances to associate (52,251) (27,866) (631) (22,622)
Advances to associates repaid 27,005 4,402 27,005 4,402
Advances to joint venture partner - (11,841) - -
Advances to joint venture partner repaid 964 - - -
Investment in jointly controlled entities (4,130) (133,835) - -
Acquisition of intangibles (20,776) (7,350) (17,025) (7,350)
Acquisition of other non-current assets - (21,938) - -
Acquisition of subsidiaries 30 18,448 - - -
Dividends received 1,525 - - -
Proceeds from disposal of other non-current assets 600 100,563 600 650
Net cash used in investing activities (202,394) (296,425) (52,608) (86,200)
CASH FLOWS FROM FINANCING ACTIVITIES
Proceeds from loans 266,212 375,000 266,212 375,000
Repayment of loans (240,000) (41,003) (240,000) (30,000)
Loans to subsidiaries - - (120,611) (190,563)
Dividends paid (95,000) (286,000) (95,000) (286,000)
Net cash provided by/(used in) financing activities (68,788) 47,997 (189,399) (131,563)
Net (decrease)/increase in cash and cash equivalents held 21,644 (48,918) 1,534 (53,360)
Net foreign exchange movements (827) - - -
Cash and cash equivalents at the beginning of the year 7,905 56,823 2,224 55,584
Cash and cash equivalents at the end of the year 28,722 7,905 3,758 2,224
Cash and cash equivalents comprises:
Cash 28,722 7,905 3,758 2,224
Cash and cash equivalents at the end of the year 28,722 7,905 3,758 2,224
Cash Flow StatementFor the year ended 30 June 2011
The accompanying notes form an integral part of these financial statements.
52 Mighty River Power Limited Annual Report 2011
NOTE 1. ACCOUNTING POLICIES
(1) Reporting entity
Mighty River Power Limited (the "Company") is a company incorporated in New Zealand, registered under the Companies Act 1993 and is an
issuer for the purposes of the Financial Reporting Act 1993. The consolidated financial statements have been prepared in accordance with the
Financial Reporting Act 1993 and the Companies Act 1993.
The consolidated financial statements are for Mighty River Power Limited Group (the “Group”). The consolidated financial statements comprise
the Company, its subsidiaries, associates and interests in jointly controlled assets and entities.
Mighty River Power Limited is wholly owned by Her Majesty the Queen in Right of New Zealand (the Crown). Consequently, the Company is
bound by the requirements of the State-Owned Enterprises Act 1986.
The liabilities of the Company are not guaranteed in any way by the Crown.
The Group’s principal activities are to invest in, develop and produce electricity from renewable and other energy sources and to sell energy
and energy related services and products to retail and wholesale customers.
(2) Basis of preparation
(a) Statement of compliance
These consolidated financial statements have been prepared in accordance with New Zealand Generally Accepted Accounting Practice ("NZ
GAAP"). They comply with New Zealand equivalents to International Financial Reporting Standards (“NZ IFRS”) as appropriate for profit-
oriented entities. These financial statements also comply with International Financial Reporting Standards (“IFRS”).
The accounting policies set out below have been applied consistently to both periods presented in these consolidated financial statements.
Certain comparative figures have been restated to conform with current year presentation.
The Group has adopted the following amended New Zealand Equivalents to International Reporting Standards as of 1 July 2010.
• NZIAS24(revised)–RelatedPartyDisclosures.Thisrevisedstandardsimplifiesthedefinitionofarelatedpartyandprovidesapartial
exemption from the disclosure requirements for government-related entities.
The group has elected not to early adopt the following standards which have been issued but are not yet effective:
• NZIAS28–InvestmentinAssociatesandJointVentures.ThisstandardsupersedesNZIAS28–InvestmentsinAssociatesasaresultof
the issue of NZ IFRS – 11 Joint Arrangements and NZ IFRS 12 – Disclosure of Interests in Other Entities. The standard, which prescribes the
accounting for investments in associates and sets out the requirements for the application of equity accounting, will be effective for periods
beginning on or after 1 January 2013. Management does not consider that this will have an impact on the financial statements.
• NZIFRS9–FinancialInstruments.ThisstandardispartoftheprojecttoreplaceNZIAS39–Financialinstruments:Recognitionand
Measurements. The standard, which will be effective for periods beginning on or after 1 January 2013, applies to financial assets, their
classification and measurement. Management have yet to determine the impact of this new standard on the financial statements.
• NZIFRS10–ConsolidatedFinancialStatements.Thisstandardestablishesanewcontrolmodelwhichbroadensthesituationwhenanentity
is considered to control another entity, including when acting as a manager may give control and the impact of potential voting rights and
when holding less than a majority interest may give control. Management does not consider that this will have any impact on the financial
statements. The standard will be effective for periods beginning on or after 1 January 2013.
• NZIFRS11–JointArrangements.Thisstandard,effectiveforperiodsbeginningonorafter1January2013,replacesNZIAS31–Interests
in Joint Ventures and removes the option to account for jointly controlled entities using proportionate consolidation, instead, accounting for a
joint arrangement is dependent on the nature of the rights and obligations arising from the arrangement. Joint operations that give a right to
the underlying assets and obligations themselves are accounted for by recognising the share of those assets and obligations. Joint ventures
that give rise to a right to the net assets are accounted for using the equity method. Management does not consider that this will have any
impact on the accounting for joint arrangements in the financial statements.
• NZIFRS12–DisclosureofInterestinOtherEntities.Thisstandardincludesnewdisclosuresaboutjudgementsmadebymanagementto
determine whether control exists, and to require summarised information about joint arrangements, associates and structured entities and
subsidiaries with non-controlling interests. The new standard will be effective for periods beginning on or after 1 January 2013.
• NZIFRS13–FairValueMeasurement.Thisstandarddoesnotchangewhenanentityisrequiredtousefairvaluebutprovidesguidanceon
how to determine fair value. It also expands the disclosure requirements about the assumptions made and the qualitative impact of those
assumptions on the fair value determined. This may result in more detailed disclosure around the valuation assumptions but should not
impact the reported fair values. The standard will be effective for periods beginning on or after 1 January 2013.
Notes to the Financial StatementsFor the year ended 30 June 2011
Mighty River Power Limited Annual Report 2011 53
(b) Basis of measurement
The NZ IFRS financial statements are prepared on the basis of historical cost with the exception of certain items for which specific accounting
policies are identified, as noted below.
(c) Estimates and judgements
The preparation of financial statements requires Management to make judgements, estimates and assumptions that affect the application
of policies and the reported amounts of assets and liabilities, income and expenses. Actual results may differ from these estimates.
Estimates and underlying assumptions are reviewed on an ongoing basis. Revisions to accounting estimates are recognised in the period in
which the estimate is revised and in any future periods affected.
In particular, information about significant areas of estimation uncertainty and critical judgements in applying accounting policies that have
the most significant effect on the amount recognised in the financial statements are described below:
Generation plant and equipment
The Group’s generation assets are stated at fair value as determined by an independent valuer. The basis of the valuation is the net present
value of the future earnings of the assets, excluding any reduction for costs associated with restoration and environmental rehabilitation. The
major inputs and assumptions that are used in the valuation model that require judgement include the forecast of the future electricity price
path, sales volume forecasts, projected operational and capital expenditure profiles, capacity and life assumptions for each generation plant
and discount rates.
Retail revenue
Management has exercised judgement in determining estimated retail sales for unread gas and electricity meters at balance date. Specifically
this involves an estimate of consumption for each unread meter, based on the customer’s past consumption history. The estimated balance is
recorded in sales and as an accrual balance within receivables.
Restoration and environmental rehabilitation
Liabilities are estimated for the abandonment and site restoration of areas from which natural resources are extracted (see note 21).
Such estimates are valued at the present value of the expenditures expected to settle the obligation. Key assumptions have been made as
to the expected expenditures to remediate based on the expected life of the assets employed on the sites and an appropriate discount rate.
Valuation of Financial instruments
Energy contracts are valued by reference to the Group’s financial model for future electricity prices. Foreign exchange and interest rate
derivatives are valued based on quoted market prices. Detailed information about assumptions and risk factors relating to financial
instruments and their valuation are included in note 24.
Impairment of non-financial assets
Assets that have an indefinite useful life are not subject to amortisation and are tested annually for impairment. Other assets that are subject
to amortisation are reviewed for impairment whenever events or changes in circumstances indicate that the carrying amount may not be
recoverable. Evaluation and exploration assets are assessed for impairment when there is an indication that the carrying amount of the asset
may exceed its recoverable amount.
Deferred tax
In May 2010 the Government announced a decrease in the headline tax rate from 30% to 28% effective for the Group from 1st July 2011.
Management have calculated the impact of the tax rate change on deferred tax based on an estimate of the deferred tax liability as at 30 June
2011. The Government also announced that tax depreciation deductions for buildings would be disallowed effective the same date. As there is
no definition of a building in the Income Tax Act, Management have had to make an assessment of whether its generation assets, which have
historically been classified as buildings, have been appropriately classified or whether they would more appropriately be classified as plant
(see note 23 for further detail).
Undesirable trading situation
The Electricity Authority (EA) declared that an undesirable trading situation occurred on the 26th March 2011 and determined that final
prices should be reduced from the interim price level. In Auckland this would result in prices during the affected trading periods falling from
approximately $20,000/MWh to approximately $3,200/MWh. The EA decision has been appealed and the issuing of final prices has been
delayed. In the event that the decision is overturned, and the prices remain at the interim price level, EBITDAF could reduce by approximately
$24 million. The prices determined by the EA have been used as the best estimate of the revenue and cost impact resulting from the events
on the 26th March.
Notes to the Financial StatementsFor the year ended 30 June 2011
54 Mighty River Power Limited Annual Report 2011
(d) Functional and presentation currency
These financial statements are presented in New Zealand Dollars ($). The functional currency of Mighty River Power Limited and all its
subsidiaries, apart from Mighty Geothermal Power Limited and its direct subsidiaries and PT ECNZ Services Indonesia, is New Zealand
Dollars. The functional currency of PT ECNZ Services Indonesia and Mighty Geothermal Power Limited, and its subsidiaries except the
German subsidiaries, is the United States Dollar. The German subsidiaries have a functional currency of Euro. The financial statements
of these entities have been translated to the presentation currency for these Group Accounts. All financial information has been rounded
to the nearest thousand.
(3) Significant accounting policies
(a) Basis of consolidation
Subsidiaries
Subsidiaries are all those entities over which the Group has the power to govern the financial and operating policies so as to obtain benefits
from their activities. Subsidiaries are fully consolidated from the date on which control is obtained by the Group and cease to be consolidated
from the date on which control is transferred out of the Group. The acquisition of subsidiaries is accounted for using the acquisition method
of accounting. The acquisition method of accounting involves recognising at acquisition date, separately from goodwill, the identifiable assets
acquired, the liabilities assumed and any non-controlling interest in the acquiree. The identifiable assets acquired and the liabilities assumed
are measured at their acquisition date fair values. The difference between these items and the fair value of consideration (including the fair
value of any pre-existing investment in the acquiree) is goodwill or discount on acquisition.
All material inter-company transactions, balances and unrealised profits and losses arising from transactions between Group companies are
eliminated on consolidation.
Non-controlling interests are allocated their share of net profit after tax in the statement of comprehensive income and are presented within
equity in the consolidated balance sheet separately from the equity of the owners of the parent.
A change in ownership interest of a subsidiary that does not result in the loss of control, is accounted for as an equity transaction. If the Group
loses control over a subsidiary, it derecognises the assets and liabilities of the subsidiary, the carrying amount of any non-controlling interest
and the cumulative foreign currency translation differences recorded in reserves if any. Further, the Group will recognise the fair value of any
consideration received, the fair value of any investment retained, with any surplus or deficit recognised in profit or loss. The parent’s share of
components previously recognised in other comprehensive income will also be reclassified to profit or loss.
Associates
Associates are those entities in which the Company holds an equity interest and over which the Company has the capacity to significantly affect
but not unilaterally determine the operating and/or financial policy decisions. Investments in associates are accounted for by the equity method
of accounting and are initially recognised at cost. The Group’s investments in associates include goodwill identified on acquisition.
The Group and Company’s share of its associates’ post acquisition profits or losses is recognised in the income statement, and its share of post
acquisition movements in reserves is recognised in reserves. The cumulative post acquisition movements are adjusted against the carrying
amount of the investment.
Provision is made for any impairment in the value of investments in associates where the estimated recoverable amount is less than the
carrying value.
Unrealised gains on transactions between the Group and its associates are eliminated to the extent of the Group’s interest in the associates.
Unrealised losses are also eliminated unless the transaction provides evidence of an impairment of the asset transferred.
Jointly controlled assets
Jointly controlled assets are joint arrangements in which the Group jointly controls or owns one or more assets and is consequently entitled
to a share of the future economic benefit through its share of the jointly controlled asset. The Group’s interests in jointly controlled assets
are accounted for by recognising its share of the jointly controlled assets, liabilities incurred jointly, income and expenses in the consolidated
financial statements.
Jointly controlled entities
A jointly controlled entity is a joint venture that involves the establishment of a corporation, partnership or other entity in which each venturer
has an interest. The entity operates in the same way as other entities, except that a contractual arrangement between the venturers establishes
joint control over the economic activity of the entity. The Group’s interests in jointly controlled entities, similar to its interest in associates are
accounted for using the equity method.
Where an entity becomes or ceases to be a Group entity during the year, the results of that entity are included in the net profit of the Group from
the date of acquisition or up to the date of disposal.
Notes to the Financial StatementsFor the year ended 30 June 2011

Mighty River Power Limited Annual Report 2011 55
(b) Property, plant and equipment
Owned assets
Generation assets, which include freehold land and buildings and generation plant and equipment, are measured at fair value based on periodical
valuations by third party valuation experts, less accumulated depreciation and less any impairment recognised after the date of the revaluation. The
underlying assumptions are reviewed for reasonableness on an annual basis to ensure that recorded value is not materially different to fair value.
Costs incurred in obtaining resource consents are capitalised and recognised as a non-current asset where it is probable they will give rise to future
economic benefit. These costs are amortised over the life of the consent on a straight-line basis.
Office land and buildings are measured at fair value based on periodical valuations as determined by third party valuation experts, less accumulated
depreciation on buildings and less any impairment losses since the last revaluation.
Any surplus on revaluation of an individual item of property, plant and equipment is transferred directly to the asset revaluation reserve unless
it offsets a previous decrease in value recognised in the income statement, in which case it is recognised in the income statement. A deficit on
revaluation of an individual item of property, plant and equipment is recognised in the income statement in the period it arises where it exceeds any
surplus previously transferred to the asset revaluation reserve. Any accumulated depreciation at the date of the revaluation is eliminated against the
gross carrying amount of the asset and the net amount is restated to the revalued amount of the asset. Additions to property, plant and equipment
stated at valuation subsequent to the most recent valuation are recorded at cost.
All other items of property, plant and equipment are recorded at cost.
The cost of property, plant and equipment purchased comprises the consideration given to acquire the assets plus other directly attributable costs
incurred in bringing the assets to the location and condition necessary for their intended service.
The cost of property, plant and equipment constructed by the Group, including capital work in progress, includes the cost of all materials used in
construction, direct labour specifically associated and an appropriate proportion of variable and fixed overheads. Financing costs attributable to a
project are capitalised at the Group’s specific project finance interest rate, where these meet certain time and monetary materiality limits. Costs
cease to be capitalised as soon as an asset is ready for productive use.
Where appropriate, the cost of property, plant and equipment includes site preparation costs, installation costs, and the cost of obtaining resource consents.
Provision is made for any impairment in the value of property, plant and equipment where the estimated recoverable amount is less than the
carrying value.
The cost of improvements to leasehold property is capitalised and amortised over the estimated useful life of the improvements, or over the
unexpired portion of the lease, whichever is shorter.
Capitalised leased assets are depreciated over the shorter of their estimated useful lives or the lease term.
Depreciation
Depreciation is provided on a straight-line basis on all property, plant and equipment other than freehold land, capital work in progress and
exploration and evaluation assets, so as to write down the assets to their estimated residual value over their expected useful lives.
The annual depreciation rates are as follows:
2011 2010
Office land and buildings 1-20% 1-20%
Generation assets:
•Hydroandco-generation 1-15% 1-15%
•Othergeneration 5-10% 5-10%
Meters 3-33% 3-33%
Computer hardware and tangible software 15-33% 15-33%
Other plant and equipment 4-50% 4-33%
Motor vehicles 20-33% 2 0-33%
Distinction between capital and revenue expenditure
Capital expenditure is defined as all expenditure on the purchase or creation of a new asset, and any expenditure that results in a significant
improvement to the original functionality of an existing asset.
Notes to the Financial StatementsFor the year ended 30 June 2011
56 Mighty River Power Limited Annual Report 2011
Revenue expenditure is defined as expenditure that restores an asset to its original operating capability and all expenditure incurred in
maintaining and operating the business.
(c) Exploration and evaluation expenditure
Exploration and evaluation expenditure incurred by the Group is accounted for using the successful effort method.
Exploration expenditure, which includes geological, geochemical and geophysical costs, is recognised in the income statement in the period
incurred except where future benefits are expected to exceed such expenditure in which case it is included in capital work in progress.
Land access rights for exploration activities are amortised over the life of the right.
Exploratory drilling costs are initially deferred and are subject to regular review to confirm the ability to develop or otherwise extract value
from expenditure. If an exploratory field is appraised as unsuccessful, such costs are charged to the income statement.
(d) Government grants – asset related
Government grants received to support capital expenditure programmes are offset against the cost of the related asset once all conditions for
the retention of the grant have been satisfied. Where conditions for retention are yet to be satisfied the grant will be temporarily be recognised
as deferred income on the balance sheet.
(e) Rehabilitation costs
Estimations are made for the expected cost of environmental rehabilitation of commercial sites that require some level of reinstatement
resulting from present operations. Any liability is recognised when an exposure is identified and the rehabilitation costs can be reasonably
estimated. Any changes in the estimated liability is accounted for in accordance with NZ IFRIC 1.
(f) Insurance
The Group’s property, plant and equipment is predominantly concentrated at power station locations which have the potential to sustain major
losses through damage to plant and resultant consequential costs.
To minimise the financial impact of such exposures, the major portion of the assessed risk is transferred to insurance companies by taking
out insurance policies with appropriate counterparties. Any uninsured loss is expensed to the income statement in the year in which the loss
is incurred.
(g) Intangible assets
Goodwill
Goodwill on acquisition is initially measured at cost being the excess of the cost of the business combination over the acquirer’s interest in
the net fair value of the identifiable assets, liabilities and contingent liabilities. Following initial recognition, goodwill is measured at cost less
any accumulated impairment losses. Goodwill on acquisitions of subsidiaries is included in intangible assets. Goodwill on acquisitions of
associates is included in investments in associates. Goodwill is tested annually for impairment.
Software
Acquired computer software licenses are capitalised on the basis of the costs incurred to acquire and bring to use the specific software.
These costs are amortised over their estimated useful lives of 2011: between 2.5 - 5 years (2010: between 2.5 - 5 years). As these assets are
deemed to have a finite life, impairment testing will only be performed when there is an indication that the intangible asset may be impaired.
Rights
Rights, including land access rights acquired to further the Group’s development programme, are stated at cost less accumulated
amortisation and any accumulated impairment losses. Rights, which have a finite life, are amortised over the life of the rights 2011:
between 3 and 11 years (2010: between 3 and 11 years). Testing for impairment will only arise when there is an indication that the asset
may be impaired.
(h) Emission units and emissions obligations
Emission units that have been allocated by the Government under the Projects to Reduce Emissions scheme are recorded at nominal value
(nil value). Purchased emission units are recorded at cost (purchase price). Emission units, whether allocated or purchased, are recorded as
intangible assets. Emissions units are not revalued subsequent to initial recognition.
Emissions units received as consideration for sales to compensate for emission obligations are initially measured at fair value and recognised
as revenue in the income statement and as an intangible asset in the Balance Sheet upon receipt. This fair value becomes the cost of the unit
for the purposes of initial and subsequent measurement of the intangible asset.
Notes to the Financial StatementsFor the year ended 30 June 2011
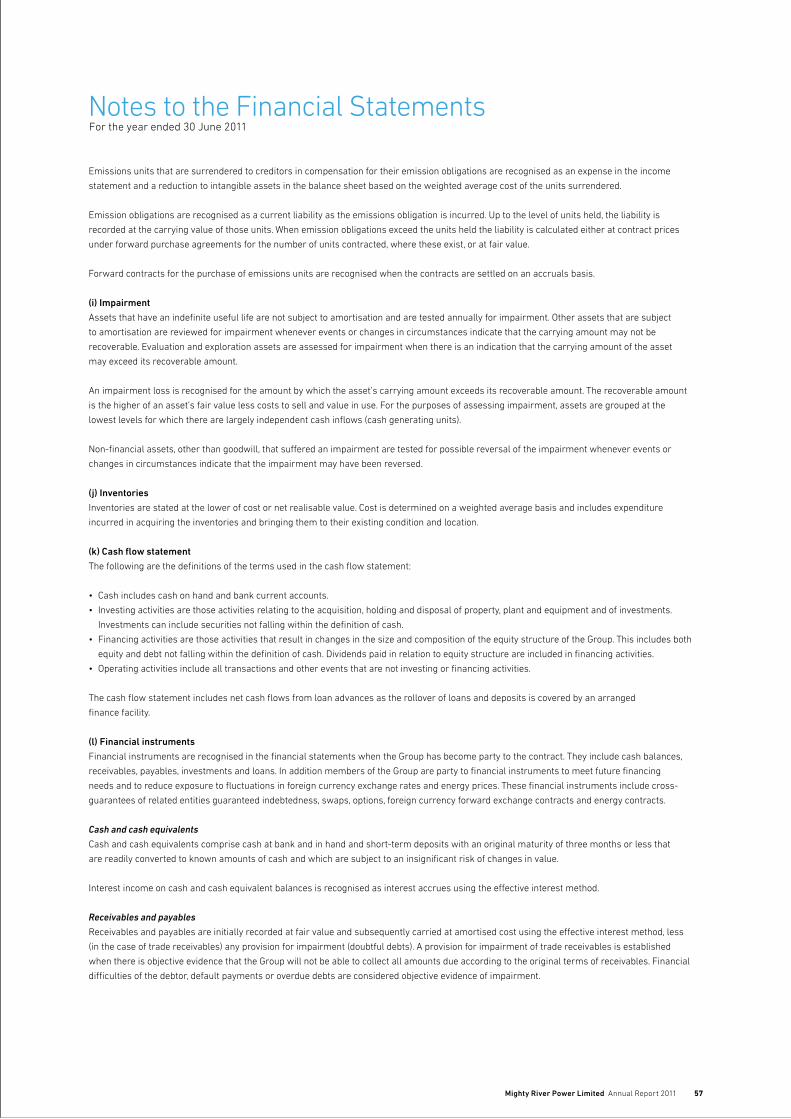
Mighty River Power Limited Annual Report 2011 57
Emissions units that are surrendered to creditors in compensation for their emission obligations are recognised as an expense in the income
statement and a reduction to intangible assets in the balance sheet based on the weighted average cost of the units surrendered.
Emission obligations are recognised as a current liability as the emissions obligation is incurred. Up to the level of units held, the liability is
recorded at the carrying value of those units. When emission obligations exceed the units held the liability is calculated either at contract prices
under forward purchase agreements for the number of units contracted, where these exist, or at fair value.
Forward contracts for the purchase of emissions units are recognised when the contracts are settled on an accruals basis.
(i) Impairment
Assets that have an indefinite useful life are not subject to amortisation and are tested annually for impairment. Other assets that are subject
to amortisation are reviewed for impairment whenever events or changes in circumstances indicate that the carrying amount may not be
recoverable. Evaluation and exploration assets are assessed for impairment when there is an indication that the carrying amount of the asset
may exceed its recoverable amount.
An impairment loss is recognised for the amount by which the asset’s carrying amount exceeds its recoverable amount. The recoverable amount
is the higher of an asset’s fair value less costs to sell and value in use. For the purposes of assessing impairment, assets are grouped at the
lowest levels for which there are largely independent cash inflows (cash generating units).
Non-financial assets, other than goodwill, that suffered an impairment are tested for possible reversal of the impairment whenever events or
changes in circumstances indicate that the impairment may have been reversed.
(j) Inventories
Inventories are stated at the lower of cost or net realisable value. Cost is determined on a weighted average basis and includes expenditure
incurred in acquiring the inventories and bringing them to their existing condition and location.
(k) Cash flow statement
The following are the definitions of the terms used in the cash flow statement:
• Cashincludescashonhandandbankcurrentaccounts.
• Investingactivitiesarethoseactivitiesrelatingtotheacquisition,holdinganddisposalofproperty,plantandequipmentandofinvestments.
Investments can include securities not falling within the definition of cash.
• FinancingactivitiesarethoseactivitiesthatresultinchangesinthesizeandcompositionoftheequitystructureoftheGroup.Thisincludesboth
equity and debt not falling within the definition of cash. Dividends paid in relation to equity structure are included in financing activities.
• Operatingactivitiesincludealltransactionsandothereventsthatarenotinvestingorfinancingactivities.
The cash flow statement includes net cash flows from loan advances as the rollover of loans and deposits is covered by an arranged
finance facility.
(l) Financial instruments
Financial instruments are recognised in the financial statements when the Group has become party to the contract. They include cash balances,
receivables, payables, investments and loans. In addition members of the Group are party to financial instruments to meet future financing
needs and to reduce exposure to fluctuations in foreign currency exchange rates and energy prices. These financial instruments include cross-
guarantees of related entities guaranteed indebtedness, swaps, options, foreign currency forward exchange contracts and energy contracts.
Cash and cash equivalents
Cash and cash equivalents comprise cash at bank and in hand and short-term deposits with an original maturity of three months or less that
are readily converted to known amounts of cash and which are subject to an insignificant risk of changes in value.
Interest income on cash and cash equivalent balances is recognised as interest accrues using the effective interest method.
Receivables and payables
Receivables and payables are initially recorded at fair value and subsequently carried at amortised cost using the effective interest method, less
(in the case of trade receivables) any provision for impairment (doubtful debts). A provision for impairment of trade receivables is established
when there is objective evidence that the Group will not be able to collect all amounts due according to the original terms of receivables. Financial
difficulties of the debtor, default payments or overdue debts are considered objective evidence of impairment.
Notes to the Financial StatementsFor the year ended 30 June 2011

58 Mighty River Power Limited Annual Report 2011
Investments
The Group classifies its investments in the following categories: financial assets held at fair value through the income statement, held to
maturity investments and available for sale financial assets. The classification depends on the purpose for which the investments were acquired.
Management determines the initial classification of its investments upon acquisition.
Realised and unrealised gains and losses on investments classified as financial assets at fair value through the income statement are included
in the income statement in the period in which they arise. Investments classified as available for sale are held at fair value and any related
unrealised gains and losses are recognised in equity until the investment is derecognised or until the investment is determined to be impaired,
at which time the cumulative gain or loss is recognised in the income statement. Held to maturity investments are carried at amortised cost.
Loans
Loans are initially recorded at fair value net of transaction costs incurred. Loans are subsequently stated at amortised cost; any difference
between the proceeds (net of transaction costs) and the redemption value is recognised in the income statement over the period of the loan using
the effective interest method. Borrowing costs are expensed to the income statement unless they relate to qualifying assets in which case they
are capitalised to capital work in progress.
Foreign exchange and interest rate derivatives
The Group enters various financial instruments for the purpose of reducing its exposure to fluctuations in interest rates and foreign exchange
rates. These are classified as financial instruments at fair value through the income statement.
Derivative contracts are classified as held for trading and are initially recognised at fair value on the date a derivative contract is entered into and
are subsequently re-measured to fair value. The method of recognising the resulting gain or loss depends on whether the derivative is recognised
as a hedging instrument, and if so, the type of hedge. The Group designates certain derivatives as either: a) hedges of the fair value of recognised
assets and liabilities or a firm commitment (fair value hedge); or b) hedges of highly probable forecast transactions or variable interest cash
flows on recognised liabilities (cash flow hedge).
Changes in the fair value of derivatives that are designated and qualify as fair value hedges are recorded in the income statement, together with
any changes in the fair value of the hedged asset or liability that are attributable to the hedged risk.
The effective portion of changes in the fair value of derivatives that are designated and qualify as cash flow hedges are recognised in equity. The
gain or loss relating to the ineffective portion is recognised immediately in the income statement. Ineffectiveness arises where the movement in
the fair value of the derivative instrument does not perfectly offset the movement in the fair value or cash flows of the hedged item.
Amounts included in equity are reallocated to the income statement in the periods when the hedged item will affect profit or loss. However, when
the forecast transaction that is hedged results in the recognition of a non-financial asset or a liability, the gains and losses previously deferred in
equity are transferred and included in the initial measurement of the asset or liability.
Any gains or losses on derivatives that do not qualify for hedge accounting are recognised immediately in the income statement.
Energy contracts
The Group has entered into a number of contracts to manage its exposure to price fluctuations on the electricity spot market. These contracts
are in the form of power supply agreements, contracts for difference and option based instruments. They are not undertaken for speculative
purposes. These energy contracts establish the price at which future specified quantities of electricity are purchased, sold or otherwise
exchanged. These contracts are classified as financial instruments at fair value through the income statement.
Energy contracts are a form of derivative and are accounted for on the same basis as other derivatives described above.
The fair value of energy contracts is based on the net present value of anticipated cash flows from each contract. Management’s internal view
of forward prices is determined by a demand supply based fundamental model which takes account of current hydrological conditions, future
inflows, an assessment of thermal fuel costs, anticipated demand and supply conditions and future committed generation capacity. Where
external market prices are not available, the Group estimates fair values of derivative financial instruments using internally generated future
price paths, the instrument is fair valued at inception and the difference arising between the estimated fair value and its cost (nil) is a valuation
inception adjustment.
(m) Foreign currencies
Transactions in foreign currencies are recognised in the functional currency of the relevant operating unit.
Foreign currency transactions are translated to the functional currency using the spot rate on the transaction date. At balance date monetary
assets and liabilities denominated in foreign currencies are translated at the closing rate. Exchange variations arising from these translations
and the settlement of these items are recognised in the income statement, except when deferred in equity as qualifying cash flow hedges.
Notes to the Financial StatementsFor the year ended 30 June 2011
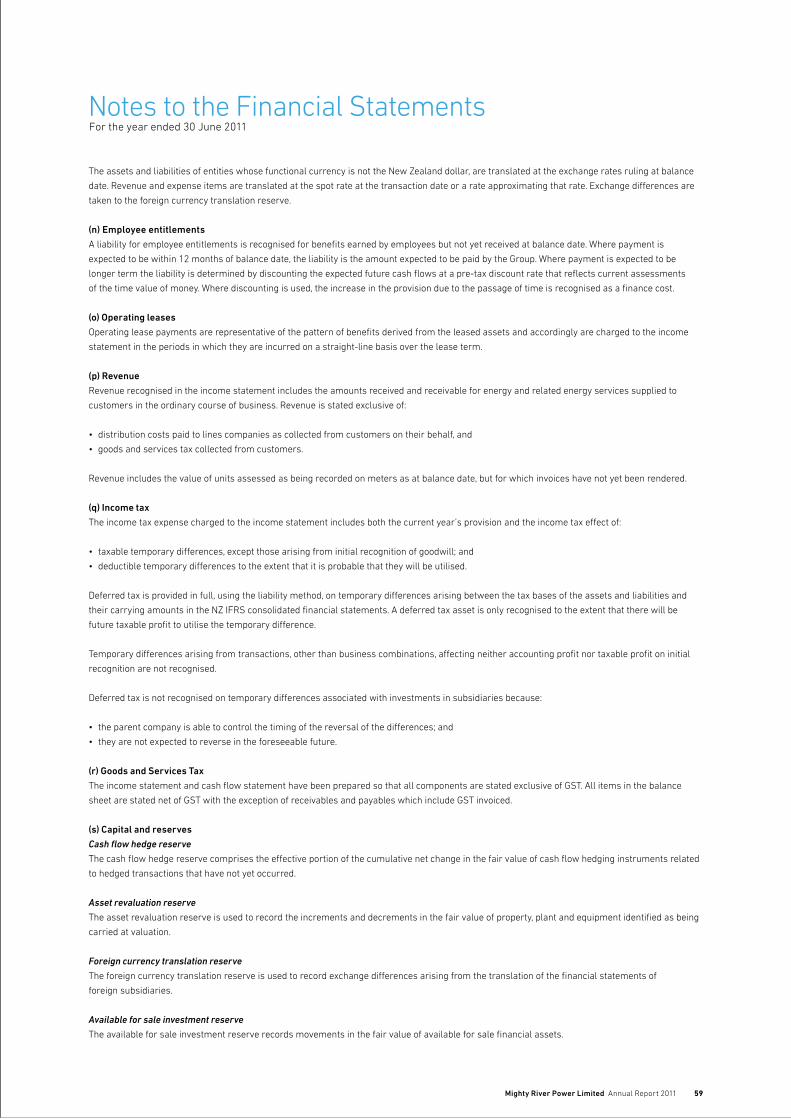
Mighty River Power Limited Annual Report 2011 59
The assets and liabilities of entities whose functional currency is not the New Zealand dollar, are translated at the exchange rates ruling at balance
date. Revenue and expense items are translated at the spot rate at the transaction date or a rate approximating that rate. Exchange differences are
taken to the foreign currency translation reserve.
(n) Employee entitlements
A liability for employee entitlements is recognised for benefits earned by employees but not yet received at balance date. Where payment is
expected to be within 12 months of balance date, the liability is the amount expected to be paid by the Group. Where payment is expected to be
longer term the liability is determined by discounting the expected future cash flows at a pre-tax discount rate that reflects current assessments
of the time value of money. Where discounting is used, the increase in the provision due to the passage of time is recognised as a finance cost.
(o) Operating leases
Operating lease payments are representative of the pattern of benefits derived from the leased assets and accordingly are charged to the income
statement in the periods in which they are incurred on a straight-line basis over the lease term.
(p) Revenue
Revenue recognised in the income statement includes the amounts received and receivable for energy and related energy services supplied to
customers in the ordinary course of business. Revenue is stated exclusive of:
• distributioncostspaidtolinescompaniesascollectedfromcustomersontheirbehalf,and
• goodsandservicestaxcollectedfromcustomers.
Revenue includes the value of units assessed as being recorded on meters as at balance date, but for which invoices have not yet been rendered.
(q) Income tax
The income tax expense charged to the income statement includes both the current year’s provision and the income tax effect of:
• taxabletemporarydifferences,exceptthosearisingfrominitialrecognitionofgoodwill;and
• deductibletemporarydifferencestotheextentthatitisprobablethattheywillbeutilised.
Deferred tax is provided in full, using the liability method, on temporary differences arising between the tax bases of the assets and liabilities and
their carrying amounts in the NZ IFRS consolidated financial statements. A deferred tax asset is only recognised to the extent that there will be
future taxable profit to utilise the temporary difference.
Temporary differences arising from transactions, other than business combinations, affecting neither accounting profit nor taxable profit on initial
recognition are not recognised.
Deferred tax is not recognised on temporary differences associated with investments in subsidiaries because:
• theparentcompanyisabletocontrolthetimingofthereversalofthedifferences;and
• theyarenotexpectedtoreverseintheforeseeablefuture.
(r) Goods and Services Tax
The income statement and cash flow statement have been prepared so that all components are stated exclusive of GST. All items in the balance
sheet are stated net of GST with the exception of receivables and payables which include GST invoiced.
(s) Capital and reserves
Cash flow hedge reserve
The cash flow hedge reserve comprises the effective portion of the cumulative net change in the fair value of cash flow hedging instruments related
to hedged transactions that have not yet occurred.
Asset revaluation reserve
The asset revaluation reserve is used to record the increments and decrements in the fair value of property, plant and equipment identified as being
carried at valuation.
Foreign currency translation reserve
The foreign currency translation reserve is used to record exchange differences arising from the translation of the financial statements of
foreign subsidiaries.
Available for sale investment reserve
The available for sale investment reserve records movements in the fair value of available for sale financial assets.
Notes to the Financial StatementsFor the year ended 30 June 2011

60 Mighty River Power Limited Annual Report 2011
(t) Segment reporting
Operating segments are reported in a manner consistent with the internal reporting provided to the chief operating decision-maker. The chief
operating decision-maker, who is responsible for allocating resources and assessing performance of the operating segments, has been identified
as the Chief Executive.
(u) Related parties
The Group considers its related parties to be key management personnel, its subsidiaries, associates, jointly controlled assets and jointly
controlled entities.
Key management personnel are those people with responsibility and authority for planning directing and controlling the activities of the entity.
Key management personnel for the Group are considered to be the Directors and Senior Management.
NOTE 2. UNDERLYING EARNINGS
Underlying earnings after tax is presented to enable stakeholders to make an assessment and comparison of underlying earnings after removing
significant one-off items and the change in the fair value of financial instruments.
Group Group Company Company 2011 2010 2011 2010 $000 $000 $000 $000
Net profit for the year 127,073 84,614 54,912 128,844
Change in the fair value of financial instruments 25,621 (8,081) 26,739 (7,973)
Change in the fair value of financial instruments of associate entities 1,429 17,534 - -
Change in the fair value of financial instruments of jointly controlled entities 1,962 21,337 - -
Impaired assets 19,786 31,373 56,823 8,908
Adjustments before income tax expense 48,798 62,163 83,562 935
Income tax expense on taxable adjustments (12,874) (10,002) (8,022) 1,966
Impact of deferred tax rate change through the income statement (823) (7,067) (647) (5,292)
Deferred tax impact of removal of building depreciation - 9,846 - 6,000
Adjustments after income tax expense 35,101 54,940 74,893 3,609
Underlying earnings after tax 162,174 139,554 129,805 132,453
Tax has been applied on all taxable adjustments at 30%.
NOTE 3. SEGMENT REPORTING
Identification of reportable segments
The operating segments are identified by Management based on the nature of the products and services provided. Discrete financial information
about each of these operating businesses is reported to the chief operating decision-maker on at least a monthly basis.
Operating segments are aggregated into reportable segments only if they share similar economic characteristics.
Types of products and services
Wholesale
The wholesale segment encompasses activity associated with the production of energy from all power stations, the purchase of energy related
products and services, the sale of power to the retail segment, generation development activities together with activities such as risk and asset
management. The wholesale segment is exposed to volatility in wholesale prices which may result in significant fluctuations in segmental results
from year to year.
Notes to the Financial StatementsFor the year ended 30 June 2011

Mighty River Power Limited Annual Report 2011 61
Retail
The retail segment encompasses activity associated with the purchase of power from the wholesale segment and the subsequent sale of energy
and energy related services and products to customers. The retail segment is also exposed to fluctuation in wholesale prices relating to energy
purchases, electricity sales at spot and the settlement of electricity price derivatives. The results of wholesale price volatility will have a partially
offsetting impact between the wholesale and retail segments.
Other Segments
Other operating segments that are not considered to be reporting segments are grouped together in the "Other Segments" column. Activities include
metering, upstream gas, international geothermal development and other corporate support activities.
Accounting Policies and inter-segment transactions
The accounting policies used by the Group in reporting segments are the same as those contained in note 1 to the financial statements and in the
prior period. The Chief Executive assesses the performance of the operating segments on a measure of EBITDAF. Segment EBITDAF represents
profit earned by each segment exclusive of any allocation of central administration costs, share of profits of associates, change in fair value of
financial instruments, depreciation and amortisation, impairment of exploration expenditure, finance costs and income tax expense.
Transactions between segments are carried out on an arm’s length basis.
Group Other Wholesale Retail segments Total $000 $000 $000 $000
June 2011
Total segment revenue 905,867 750,734 37,894 1,694,495
Inter-segment revenue (500,069) - (30,545) (530,614)
Revenue from external customers 405,798 750,734 7,349 1,163,881
Segment EBITDAF 336,483 133,661 (27,091) 443,053
Depreciation and amortisation 119,794 5,490 20,120 145,404
Impaired assets 15,867 - 3,919 19,786
Additions to non-current assets excluding financial instruments 74,602 4,375 141,116 220,093
Segment Assets 4,836,993 208,836 330,758 5,376,587
Other Group Wholesale Retail segments Total $000 $000 $000 $000
June 2010
Total segment revenue 855,065 720,601 37,482 1,613,148
Inter-segment revenue (476,361) - (32,212) (508,573)
Revenue from external customers 378,704 720,601 5,270 1,104,575
Segment EBITDAF 229,848 126,163 (28,228) 327,783
Depreciation and amortisation 99,415 2,928 (3,636) 98,707
Impaired assets 10,027 1,421 19,925 31,373
Additions to non-current assets excluding financial instruments 175,362 8,270 204,421 388,053
Segment Assets 4,442,078 169,890 282,932 4,894,900
Notes to the Financial StatementsFor the year ended 30 June 2011

62 Mighty River Power Limited Annual Report 2011
Reconciliation of segment revenue to the income statement Group Group 2011 2010 $000 $000
Total segment revenue 1,694,495 1,613,148
Inter-segment sales elimination (530,614) (508,573)
Total revenue per the income statement 1,163,881 1,104,575
Revenue from external customers by geographic locations is detailed below.
Revenue is attributed to geographic locations based on the location of the customers.
New Zealand 1,163,881 1,104,575
Other foreign countries - -
1,163,881 1,104,575
Reconciliation of segment assets to total assets Group Group 2011 2010 $000 $000
Segment assets 5,376,587 4,894,900
Current tax assets - -
Total assets 5,376,587 4,894,900
The analysis of the location of non-current assets excluding financial instruments is as follows:
New Zealand 4,804,664 4,427,051
Other foreign countries 171,382 152,040
4,976,046 4,579,091
Notes to the Financial StatementsFor the year ended 30 June 2011

Mighty River Power Limited Annual Report 2011 63
NOTE 4. PROFIT BEFORE INCOME TAX
Group Group Company Company Note 2011 2010 2011 2010 $000 $000 $000 $000
Auditing the financial statements 454 330 291 275
Total auditor’s remuneration 454 330 291 275
Donations 104 65 88 65
Rental and operating lease costs 4,067 3,832 3,688 3,487
Net (gain)/loss on sale of property, plant and equipment 727 56 794 (58)
Foreign currency exchange (gains)/losses 2,471 1,796 30,824 1,125
Interest charged 81,499 54,631 79,100 54,341
Interest capitalised to capital work in progress (6,870) (20,237) (6,870) (20,237)
Total interest expense 74,629 34,394 72,230 34,104
Depreciation 11 130,676 107,581 85,753 76,978
Amortisation of intangible assets 12 10,798 8,048 10,159 7,580
Amortisation of fair values and the release from cash flow
hedge reserve relating to forecast transactions that are
no longer expected to occur 25 3,930 (16,922) 3,930 (16,922)
Total depreciation and amorisation 145,404 98,707 99,842 67,636
Impaired property, plant and equipment 11 (11,476) (9,469) - (1,421)
Impaired exploration and development expenditure 11 (4,933) (16,396) (1,423) (1,979)
Impaired intangible asset 12 (2,500) - (2,500) -
Impaired investment in subsidiary 15 - - (52,900) -
Impaired investment in associate 16 (877) (410) - (410)
Impaired available for sale asset - (5,098) - (5,098)
Total impaired assets (19,786) (31,373) (56,823) (8,908)
Notes to the Financial StatementsFor the year ended 30 June 2011

64 Mighty River Power Limited Annual Report 2011
NOTE 5. INCOME TAX
Group Group Company Company 2011 2010 2011 2010 $000 $000 $000 $000
(i) Income tax expense
Profit before income tax 185,460 141,353 101,381 188,912
Prima facie income tax expense at 30% on the profit before tax (55,638) (42,406) (30,414) (56,674)
Increase/(decrease) in income tax due to:
•effectoftaxratechangeondeferredtax 823 7,067 647 5,292
•deferredtaximpactofremovalofbuildingtaxdepreciation - (9,846) - (6,000)
•shareofassociates’taxpaidearnings 621 (3,511) - -
•shareofjointlycontrolledentities’taxpaidearnings 881 (6,598) - -
•foreignentitiestaxlossesnotrecognisedfordeferredtax (3,792) - - -
•capitalloss (1,440) (2,246) (17,047) (2,246)
•otherdifferences 164 (704) 191 (162)
(Under)/over provision in prior period (6) 1,505 154 (278)
Income tax expense attributable to profit from ordinary activities (58,387) (56,739) (46,469) (60,068)
Represented by:
Current tax expense (69,935) (49,546) (62,612) (57,525)
Deferred tax recognised in the income statement 11,548 (7,193) 16,143 (2,543)
Total income tax expense (58,387) (56,739) (46,469) (60,068)
(ii) Income tax reported in other comprehensive income
Tax on movements in asset revaluation reserve (123,675) (110,898) (65,700) (86,100)
Tax on movements in cash flow hedge reserve 32,233 26,786 26,554 24,856
Tax on movements in available for sale investment reserve 258 (929) 258 (929)
Income tax reported in other comprehensive income (91,184) (85,041) (38,888) (62,173)
NOTE 6. DIVIDENDS PAID AND PROPOSED
Group Group Company Company 2011 2010 2011 2010 $000 $000 $000 $000
(i) Dividends declared and paid during the year
Final dividend for 2010: 8.03¢ (2009: 21.14¢) 30,300 79,800 30,300 79,800
Special dividend paid in 2011: nil (2010: 39.73¢) - 150,000 - 150,000
Interim dividend for 2011: 17.14¢ (2010: 14.89¢) 64,700 56,200 64,700 56,200
95,000 286,000 95,000 286,000
(ii) Dividends proposed
Final dividend for 2011: 12.10¢ (2010: 8.03¢) 45,700 30,300 45,700 30,300
After the reporting date the final dividend was approved for payment by the Board of Directors. This amount has not been recognised as a liability
as at 30 June 2011 but will be brought to account during the 2012 financial year.
Notes to the Financial StatementsFor the year ended 30 June 2011
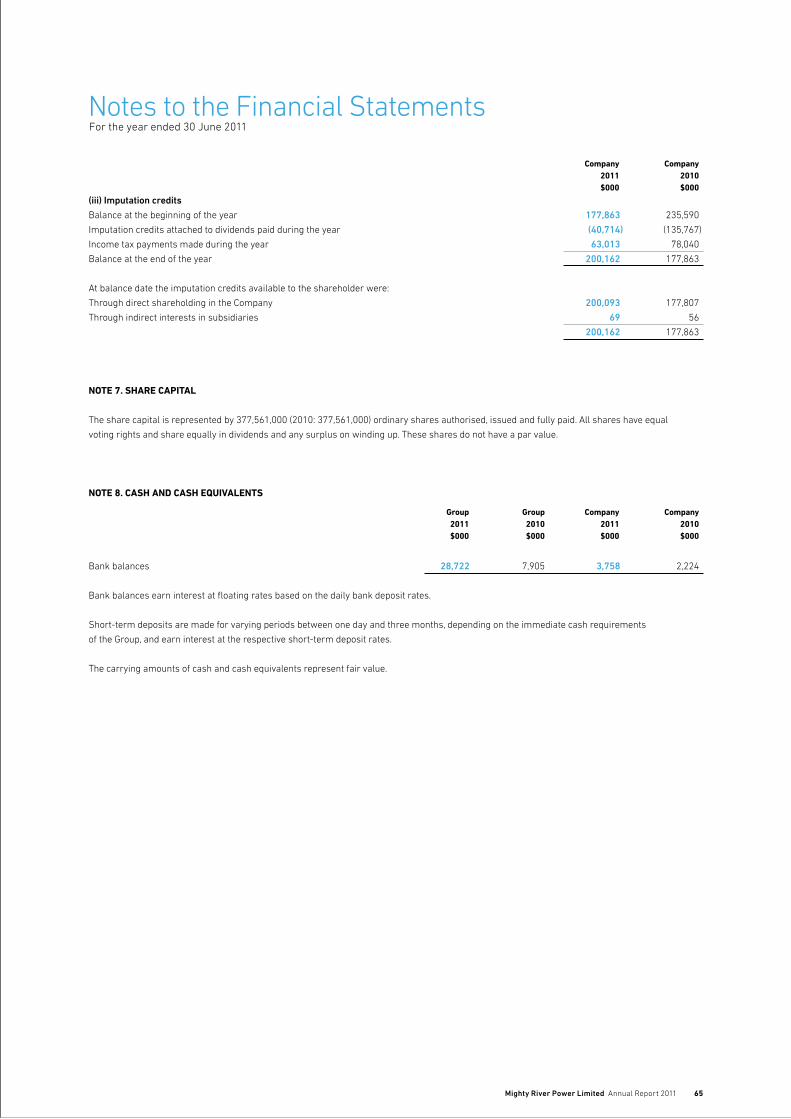
Mighty River Power Limited Annual Report 2011 65
Company Company 2011 2010 $000 $000
(iii) Imputation credits
Balance at the beginning of the year 177,863 235,590
Imputation credits attached to dividends paid during the year (40,714) (135,767)
Income tax payments made during the year 63,013 78,040
Balance at the end of the year 200,162 177,863
At balance date the imputation credits available to the shareholder were:
Through direct shareholding in the Company 200,093 177,807
Through indirect interests in subsidiaries 69 56
200,162 177,863
NOTE 7. SHARE CAPITAL
The share capital is represented by 377,561,000 (2010: 377,561,000) ordinary shares authorised, issued and fully paid. All shares have equal
voting rights and share equally in dividends and any surplus on winding up. These shares do not have a par value.
NOTE 8. CASH AND CASH EQUIVALENTS
Group Group Company Company 2011 2010 2011 2010 $000 $000 $000 $000
Bank balances 28,722 7,905 3,758 2,224
Bank balances earn interest at floating rates based on the daily bank deposit rates.
Short-term deposits are made for varying periods between one day and three months, depending on the immediate cash requirements
of the Group, and earn interest at the respective short-term deposit rates.
The carrying amounts of cash and cash equivalents represent fair value.
Notes to the Financial StatementsFor the year ended 30 June 2011

66 Mighty River Power Limited Annual Report 2011
NOTE 9. RECEIVABLES
Group Group Company Company 2011 2010 2011 2010 $000 $000 $000 $000
Trade receivables and accruals 198,854 171,730 181,311 159,558
Allowance for impairment loss (6,359) (3,085) (6,304) (3,035)
Net trade receivables and accruals 192,495 168,645 175,007 156,523
Prepayments 7,514 5,990 6,323 5,980
Related party receivables 237 - 706,550 652,733
200,246 174,635 887,880 815,236
Current 199,868 174,635 886,369 815,236
Non-current 378 - 1,511 -
200,246 174,635 887,880 815,236
Trade receivables are non-interest bearing and are generally on 30 day terms, except for the premium on the Nga Awa Purua outage option which
is receivable over 2 years. For terms and conditions of related party receivables refer to note 29.
Movements in the allowance for impairment loss were as follows:
Balance at the beginning of the year 3,085 2,769 3,035 2,744
Charge for the year 7,002 4,313 6,997 4,288
Amounts written off (3,728) (3,997) (3,728) (3,997)
Balance at the end of the year 6,359 3,085 6,304 3,035
Receivables past due but not considered impaired:
Less than one month past due 8,110 6,936 7,929 6,936
Two to three months past due* 513 930 468 930
Three to six months past due* 9 - - -
Later than six months past due* 328 210 328 210
8,960 8,076 8,725 8,076
*Old overdue balances that are subject to approved payment plans, with payments being made as scheduled, are not considered to be impaired.
NOTE 10. INVENTORIES
Group Group Company Company 2011 2010 2011 2010 $000 $000 $000 $000
Consumable stores 17,806 16,464 12,761 11,700
Meter stock 5,209 3,762 5,209 3,762
23,015 20,226 17,970 15,462
Consumable stores are held to service and repair operating plant. Meter stock is held in inventory until it is deployed into the field at which time
it is transferred into property, plant and equipment.
Notes to the Financial StatementsFor the year ended 30 June 2011

Mighty River Power Limited Annual Report 2011 67
NOTE 11. PROPERTY, PLANT AND EQUIPMENT
Group Computer Hydro hardware and co- Other Other Office and Capital generation generation plant and land and tangible work in assets at assets at equipment Meters buildings software Vehicles progress fair value fair value at cost at cost at fair value at cost at cost at cost Total $000 $000 $000 $000 $000 $000 $000 $000 $000
Balance at 1 July 2009
Cost or valuation 2,985,113 581,110 28,693 74,232 8,390 19,083 1,784 319,483 4,017,888
Accumulated depreciation (66,256) (23,726) (15,663) (36,901) (1,003) (13,450) (948) - (157,947)
Net book value 2,918,857 557,384 13,030 37,331 7,387 5,633 836 319,483 3,859,941
Year ended 30 June 2010
Opening net book value 2,918,857 557,384 13,030 37,331 7,387 5,633 836 319,483 3,859,941
Additions, including transfers from
capital work in progress 7,422 303,152 243 18,694 25 3,842 163 (126,572) 206,969
Increase in interest in jointly
controlled assets - 4,802 - - - - - - 4,802
Disposals (697) (390) (617) - - (9) (104) - (1,817)
Revaluation 287,000 85,048 - - (950) - - - 371,098
Impaired assets - (8,048) - (1,421) - - - - (9,469)
Impairment of exploration expenditure - - - - - - - (16,396) (16,396)
Depreciation charge for the year (62,829) (30,653) (1,922) (8,793) (465) (2,710) (209) - (107,581)
Closing net book value 3,149,753 911,295 10,734 45,811 5,997 6,756 686 176,515 4,307,547
Balance at 30 June 2010
Cost or valuation 3,149,753 911,921 28,121 91,291 5,997 23,153 1,559 176,515 4,388,310
Accumulated depreciation - (626) (17,387) (45,480) - (16,397) (873) - (80,763)
Net book value 3,149,753 911,295 10,734 45,811 5,997 6,756 686 176,515 4,307,547
Year ended 30 June 2011
Opening net book value 3,149,753 911,295 10,734 45,811 5,997 6,756 686 176,515 4,307,547
Additions, including transfers
from capital work in progress 13,058 56,802 11,908 25,846 1,001 10,147 305 24,293 143,360
Acquisition of subsidiaries - - 53 - - - - 41,461 41,514
Increase in interest in jointly controlled assets - 202 - - - - - - 202
Disposals (3) (3,021) (111) - (24) (84) (7) - (3,250)
Revaluation 219,000 193,250 - - - - - - 412,250
Impaired assets - (11,476) - - - - - - (11,476)
Impairment of exploration and
development expenditure - - - - - - - (4,933) (4,933)
Exchange difference - - (37) - - - - (4,995) (5,032)
Depreciation charge for the year (66,081) (44,658) (3,823) (10,754) (618) (4,521) (221) - (130,676)
Closing net book value 3,315,727 1,102,394 18,724 60,903 6,356 12,298 763 232,341 4,749,506
Balance at 30 June 2011
Cost or valuation 3,315,727 1,102,394 33,977 117,133 6,972 33,065 1,656 232,341 4,843,265
Accumulated depreciation - - (15,253) (56,230) (616) (20,767) (893) - (93,759)
Net book value 3,315,727 1,102,394 18,724 60,903 6,356 12,298 763 232,341 4,749,506
Notes to the Financial StatementsFor the year ended 30 June 2011

68 Mighty River Power Limited Annual Report 2011
Exploration work in progress
The Group is finalising its gas exploration project. Costs of $85 thousand (2010: $3.5 million ) associated with this project remain within
capital work in progress. This balance is expected to be recovered.
Impaired exploration and development expenditure
Impaired exploration expenditure during the year to 30 June 2011 was $3.5 million in the gas exploration cash generating unit (30 June 2010:
$14.4 million).
Management performed a review of development projects within capital work in progress to identify whether any indication for impairment exists.
Two projects were identified that were unlikely to proceed as they were no longer considered economic. An impairment charge was recognised
during the year to 30 June 2011 of $1.4 million which readjusts the asset to its recoverable value which is based on fair value less costs to sell
(2010: $2.0 million).
Company Computer Hydro hardware and co- Other Other Office and Capital generation generation plant and land and tangible work in assets at assets at equipment Meters buildings software Vehicles progress fair value fair value at cost at cost at fair value at cost at cost at cost Total $000 $000 $000 $000 $000 $000 $000 $000 $000
Balance at 1 July 2009
Cost or valuation 2,984,913 4,307 27,554 74,229 8,390 18,955 1,762 53,047 3,173,157
Accumulated depreciation (66,256) (1,781) (15,093) (36,901) (1,003) (13,398) (940) - (135,372)
Net book value 2,918,657 2,526 12,461 37,328 7,387 5,557 822 53,047 3,037,785
Year ended 30 June 2010
Opening net book value 2,918,657 2,526 12,461 37,328 7,387 5,557 822 53,047 3,037,785
Additions, including transfers
from capital work in progress 7,422 73 199 18,690 25 3,710 163 31,608 61,890
Acquired through amalgamation 200 - - - - - (104) - 96
Disposals (697) (334) (617) - - (8) - - (1,656)
Revaluation 287,000 - - - (950) - - - 286,050
Impaired assets - - - (1,421) - - - - (1,421)
Impairment exploration and
development expenditure - - - - - - - (1,979) (1,979)
Depreciation charge for the year (62,829) (235) (1,830) (8,793) (465) (2,618) (208) - (76,978)
Closing net book value 3,149,753 2,030 10,213 45,804 5,997 6,641 673 82,676 3,303,787
Balance at 30 June 2010
Cost or valuation 3,149,753 2,656 26,939 91,283 5,997 22,896 1,536 82,676 3,383,736
Accumulated depreciation - (626) (16,726) (45,479) - (16,255) (863) - (79,949)
Net book value 3,149,753 2,030 10,213 45,804 5,997 6,641 673 82,676 3,303,787
Year ended 30 June 2011
Opening net book value 3,149,753 2,030 10,213 45,804 5,997 6,641 673 82,676 3,303,787
Additions, including transfers from
capital work in progress 13,058 823 10,909 25,846 1,001 9,970 154 1,212 62,973
Disposals (3) (2,835) (109) - (24) (88) (6) - (3,065)
Revaluation 219,000 - - - - - - - 219,000
Impairment of exploration
and development expenditure - - - - - - - (1,423) (1,423)
Depreciation charge for the year (66,081) (2) (3,689) (10,754) (618) (4,408) (201) - (85,753)
Closing net book value 3,315,727 16 17,324 60,896 6,356 12,115 620 82,465 3,495,519
Balance at 30 June 2011
Cost or valuation 3,315,727 18 31,778 117,125 6,972 32,628 1,482 82,465 3,588,195
Accumulated depreciation - (2) (14,454) (56,229) (616) (20,513) (862) - (92,676)
Net book value 3,315,727 16 17,324 60,896 6,356 12,115 620 82,465 3,495,519
Notes to the Financial StatementsFor the year ended 30 June 2011
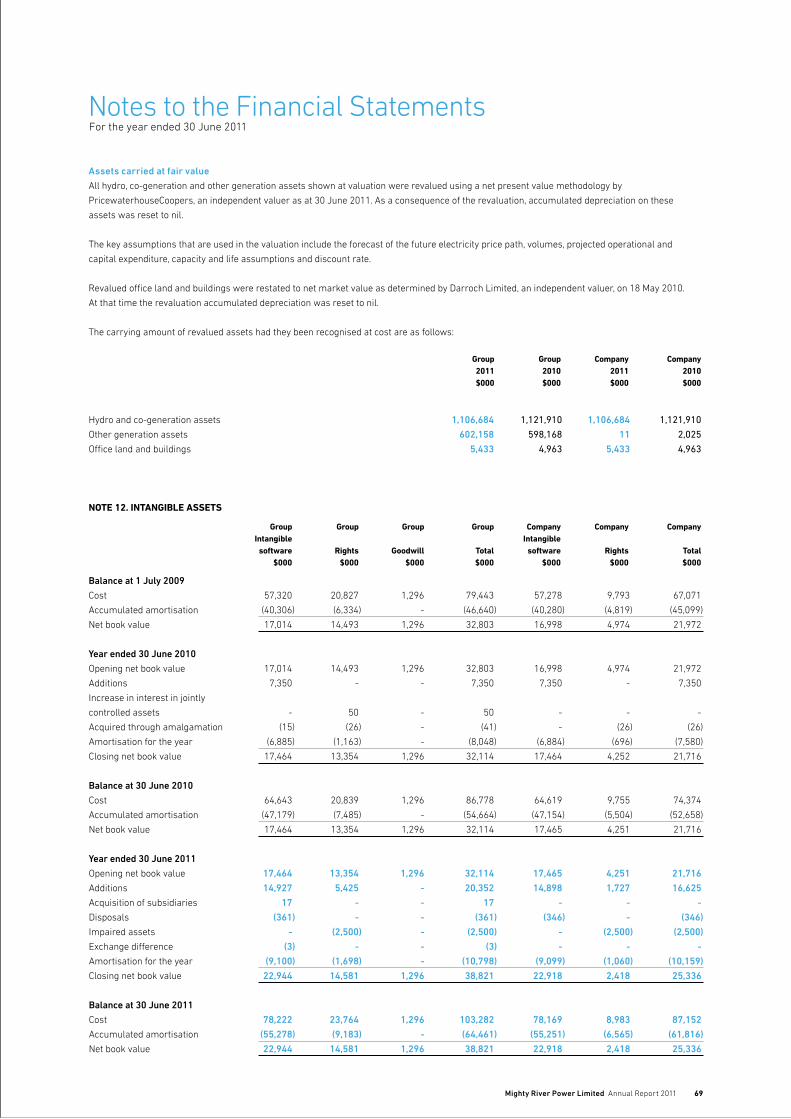
Mighty River Power Limited Annual Report 2011 69
Assets carried at fair value
All hydro, co-generation and other generation assets shown at valuation were revalued using a net present value methodology by
PricewaterhouseCoopers, an independent valuer as at 30 June 2011. As a consequence of the revaluation, accumulated depreciation on these
assets was reset to nil.
The key assumptions that are used in the valuation include the forecast of the future electricity price path, volumes, projected operational and
capital expenditure, capacity and life assumptions and discount rate.
Revalued office land and buildings were restated to net market value as determined by Darroch Limited, an independent valuer, on 18 May 2010.
At that time the revaluation accumulated depreciation was reset to nil.
The carrying amount of revalued assets had they been recognised at cost are as follows:
Group Group Company Company 2011 2010 2011 2010 $000 $000 $000 $000
Hydro and co-generation assets 1,106,684 1,121,910 1,106,684 1,121,910
Other generation assets 602,158 598,168 11 2,025
Office land and buildings 5,433 4,963 5,433 4,963
NOTE 12. INTANGIBLE ASSETS
Group Group Group Group Company Company Company Intangible Intangible software Rights Goodwill Total software Rights Total $000 $000 $000 $000 $000 $000 $000
Balance at 1 July 2009
Cost 57,320 20,827 1,296 79,443 57,278 9,793 67,071
Accumulated amortisation (40,306) (6,334) - (46,640) (40,280) (4,819) (45,099)
Net book value 17,014 14,493 1,296 32,803 16,998 4,974 21,972
Year ended 30 June 2010
Opening net book value 17,014 14,493 1,296 32,803 16,998 4,974 21,972
Additions 7,350 - - 7,350 7,350 - 7,350
Increase in interest in jointly
controlled assets - 50 - 50 - - -
Acquired through amalgamation (15) (26) - (41) - (26) (26)
Amortisation for the year (6,885) (1,163) - (8,048) (6,884) (696) (7,580)
Closing net book value 17,464 13,354 1,296 32,114 17,464 4,252 21,716
Balance at 30 June 2010
Cost 64,643 20,839 1,296 86,778 64,619 9,755 74,374
Accumulated amortisation (47,179) (7,485) - (54,664) (47,154) (5,504) (52,658)
Net book value 17,464 13,354 1,296 32,114 17,465 4,251 21,716
Year ended 30 June 2011
Opening net book value 17,464 13,354 1,296 32,114 17,465 4,251 21,716
Additions 14,927 5,425 - 20,352 14,898 1,727 16,625
Acquisition of subsidiaries 17 - - 17 - - -
Disposals (361) - - (361) (346) - (346)
Impaired assets - (2,500) - (2,500) - (2,500) (2,500)
Exchange difference (3) - - (3) - - -
Amortisation for the year (9,100) (1,698) - (10,798) (9,099) (1,060) (10,159)
Closing net book value 22,944 14,581 1,296 38,821 22,918 2,418 25,336
Balance at 30 June 2011
Cost 78,222 23,764 1,296 103,282 78,169 8,983 87,152
Accumulated amortisation (55,278) (9,183) - (64,461) (55,251) (6,565) (61,816)
Net book value 22,944 14,581 1,296 38,821 22,918 2,418 25,336
Notes to the Financial StatementsFor the year ended 30 June 2011

70 Mighty River Power Limited Annual Report 2011
All intangible assets except goodwill have been assessed as having a finite life. The costs of finite life intangible assets are amortised over the life
of the assets on a straight line basis.
If an indication of impairment arises for finite life intangible assets, the recoverable amount is estimated and an impairment loss is recognised
to the extent that the recoverable amount is lower than the carrying amount.
Goodwill acquired in a business combination is measured at cost less any accumulated impairment losses. Goodwill is not amortised but is subject
to impairment testing on an annual basis or whenever there is an indication of impairment.
For the purposes of impairment testing, all goodwill is allocated to one cash generating unit which is not a separately reportable segment. The
recoverable amount has been determined based on a value in use calculation using cash flow projections based on financial budgets approved
by management covering a five-year period. The pre-tax cash flow projections are discounted using a pre-tax discount rate of 12%.
Key assumptions in the value in use calculation include gross margin and the discount rate. Gross margin has been based on past performance
and Management’s expectations of market development. The discount rate reflects Management’s estimate of the time value of money and the
risks specific to the cash generation unit that are not already reflected in the cash flows.
No impairment charge has been recognised against goodwill as a result of the value in use calculation.
NOTE 13. EMISSIONS UNITS
Group Group Company Company 2011 2011 2011 2011 Units $000 Units $000
Balance at beginning of the year - - - -
Allocated units 416,000 - 416,000 -
Purchased units 50,463 1,018 21,213 425
Units received as consideration for sales - - - -
Units surrendered as consideration for purchases (56,025) - (56,025) -
Surrendered to the Crown (78,418) (589) (49,366) -
Balance at end of the year 332,020 429 331,822 425
The New Zealand emissions trading scheme sets out a transition period which runs from 1 July 2010 to the 31 December 2012. During the transition
period there is a requirement to surrender one New Zealand Unit (NZU) to the Crown for every two tonnes of emissions produced. After the transition
period one NZU will need to be surrendered for every one tonne of emissions produced.
The Group has agreements with the Crown under the Projects to Reduce Emissions (PRE) Scheme. These agreements result in the receipt of emission
units upon verification of emission reductions generated. The projects have been completed and the first units allocated under those agreements.
The Group has entered into several forward purchase agreements to acquire emissions units to be used to meet its obligations under the emissions trading
scheme. The cost of the acquisitions under these contracts are recognised when the units are acquired. Under these contracts the Company expects to
acquire 505 thousand emissions units over a 15 year period which will partially satisfy the Group’s obligations under the emissions trading scheme.
NOTE 14. AVAILABLE FOR SALE FINANCIAL ASSETS
Group Group Company Company 2011 2010 2011 2010 $000 $000 $000 $000
Shares — New Zealand listed 1,191 2,049 1,191 2,049
Available for sale financial assets consist of investments in ordinary shares, they therefore have no fixed maturity date or coupon rates.
The fair value has been determined by reference to published price quotations in an active market. An impairment has been recognised
through the income statement due to the decline in share price, refer note 4.
Notes to the Financial StatementsFor the year ended 30 June 2011
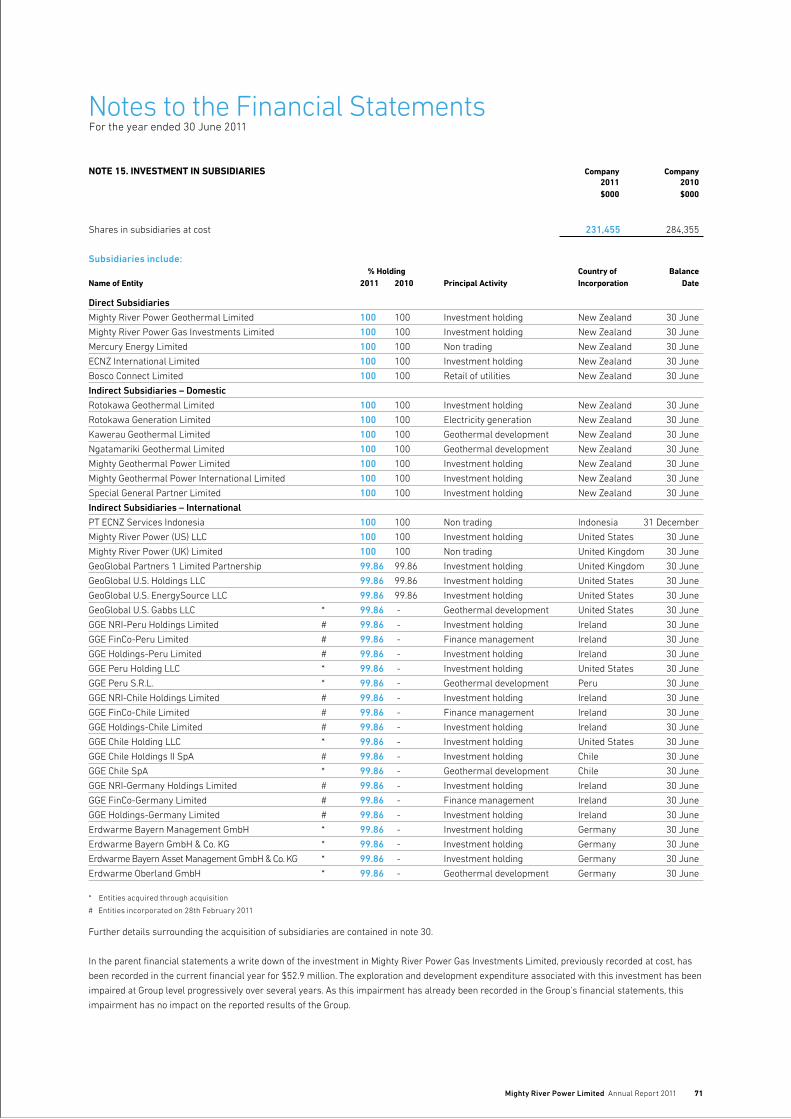
Mighty River Power Limited Annual Report 2011 71
NOTE 15. INVESTMENT IN SUBSIDIARIES Company Company 2011 2010 $000 $000
Shares in subsidiaries at cost 231,455 284,355
Subsidiaries include: % Holding Country of BalanceName of Entity 2011 2010 Principal Activity Incorporation Date
Direct Subsidiaries
Mighty River Power Geothermal Limited 100 100 Investment holding New Zealand 30 June
Mighty River Power Gas Investments Limited 100 100 Investment holding New Zealand 30 June
Mercury Energy Limited 100 100 Non trading New Zealand 30 June
ECNZ International Limited 100 100 Investment holding New Zealand 30 June
Bosco Connect Limited 100 100 Retail of utilities New Zealand 30 June
Indirect Subsidiaries – Domestic
Rotokawa Geothermal Limited 100 100 Investment holding New Zealand 30 June
Rotokawa Generation Limited 100 100 Electricity generation New Zealand 30 June
Kawerau Geothermal Limited 100 100 Geothermal development New Zealand 30 June
Ngatamariki Geothermal Limited 100 100 Geothermal development New Zealand 30 June
Mighty Geothermal Power Limited 100 100 Investment holding New Zealand 30 June
Mighty Geothermal Power International Limited 100 100 Investment holding New Zealand 30 June
Special General Partner Limited 100 100 Investment holding New Zealand 30 June
Indirect Subsidiaries – International
PT ECNZ Services Indonesia 100 100 Non trading Indonesia 31 December
Mighty River Power (US) LLC 100 100 Investment holding United States 30 June
Mighty River Power (UK) Limited 100 100 Non trading United Kingdom 30 June
GeoGlobal Partners 1 Limited Partnership 99.86 99.86 Investment holding United Kingdom 30 June
GeoGlobal U.S. Holdings LLC 99.86 99.86 Investment holding United States 30 June
GeoGlobal U.S. EnergySource LLC 99.86 99.86 Investment holding United States 30 June
GeoGlobal U.S. Gabbs LLC * 99.86 - Geothermal development United States 30 June
GGE NRI-Peru Holdings Limited # 99.86 - Investment holding Ireland 30 June
GGE FinCo-Peru Limited # 99.86 - Finance management Ireland 30 June
GGE Holdings-Peru Limited # 99.86 - Investment holding Ireland 30 June
GGE Peru Holding LLC * 99.86 - Investment holding United States 30 June
GGE Peru S.R.L. * 99.86 - Geothermal development Peru 30 June
GGE NRI-Chile Holdings Limited # 99.86 - Investment holding Ireland 30 June
GGE FinCo-Chile Limited # 99.86 - Finance management Ireland 30 June
GGE Holdings-Chile Limited # 99.86 - Investment holding Ireland 30 June
GGE Chile Holding LLC * 99.86 - Investment holding United States 30 June
GGE Chile Holdings II SpA # 99.86 - Investment holding Chile 30 June
GGE Chile SpA * 99.86 - Geothermal development Chile 30 June
GGE NRI-Germany Holdings Limited # 99.86 - Investment holding Ireland 30 June
GGE FinCo-Germany Limited # 99.86 - Finance management Ireland 30 June
GGE Holdings-Germany Limited # 99.86 - Investment holding Ireland 30 June
Erdwarme Bayern Management GmbH * 99.86 - Investment holding Germany 30 June
Erdwarme Bayern GmbH & Co. KG * 99.86 - Investment holding Germany 30 June
Erdwarme Bayern Asset Management GmbH & Co. KG * 99.86 - Investment holding Germany 30 June
Erdwarme Oberland GmbH * 99.86 - Geothermal development Germany 30 June
* Entities acquired through acquisition
# Entities incorporated on 28th February 2011
Further details surrounding the acquisition of subsidiaries are contained in note 30.
In the parent financial statements a write down of the investment in Mighty River Power Gas Investments Limited, previously recorded at cost, has
been recorded in the current financial year for $52.9 million. The exploration and development expenditure associated with this investment has been
impaired at Group level progressively over several years. As this impairment has already been recorded in the Group’s financial statements, this
impairment has no impact on the reported results of the Group.
Notes to the Financial StatementsFor the year ended 30 June 2011
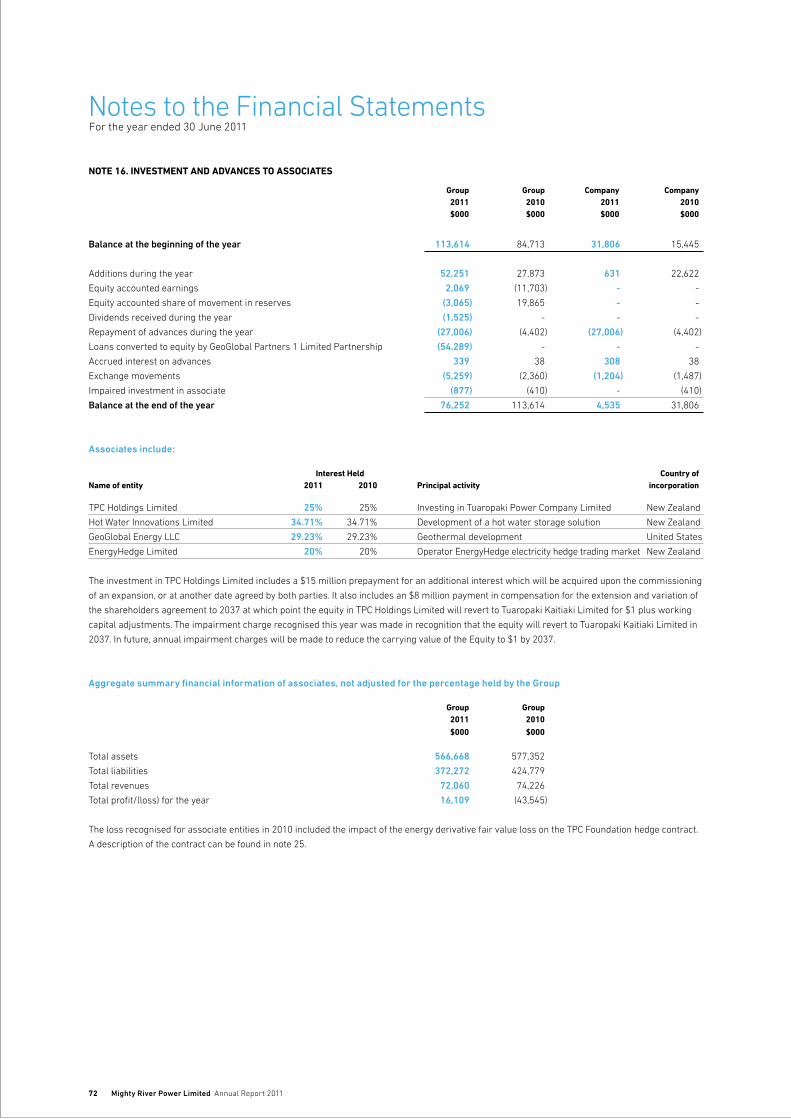
72 Mighty River Power Limited Annual Report 2011
NOTE 16. INVESTMENT AND ADVANCES TO ASSOCIATES
Group Group Company Company 2011 2010 2011 2010 $000 $000 $000 $000
Balance at the beginning of the year 113,614 84,713 31,806 15,445
Additions during the year 52,251 27,873 631 22,622
Equity accounted earnings 2,069 (11,703) - -
Equity accounted share of movement in reserves (3,065) 19,865 - -
Dividends received during the year (1,525) - - -
Repayment of advances during the year (27,006) (4,402) (27,006) (4,402)
Loans converted to equity by GeoGlobal Partners 1 Limited Partnership (54,289) - - -
Accrued interest on advances 339 38 308 38
Exchange movements (5,259) (2,360) (1,204) (1,487)
Impaired investment in associate (877) (410) - (410)
Balance at the end of the year 76,252 113,614 4,535 31,806
Associates include: Interest Held Country ofName of entity 2011 2010 Principal activity incorporation
TPC Holdings Limited 25% 25% Investing in Tuaropaki Power Company Limited New Zealand
Hot Water Innovations Limited 34.71% 34.71% Development of a hot water storage solution New Zealand
GeoGlobal Energy LLC 29.23% 29.23% Geothermal development United States
EnergyHedge Limited 20% 20% Operator EnergyHedge electricity hedge trading market New Zealand
The investment in TPC Holdings Limited includes a $15 million prepayment for an additional interest which will be acquired upon the commissioning
of an expansion, or at another date agreed by both parties. It also includes an $8 million payment in compensation for the extension and variation of
the shareholders agreement to 2037 at which point the equity in TPC Holdings Limited will revert to Tuaropaki Kaitiaki Limited for $1 plus working
capital adjustments. The impairment charge recognised this year was made in recognition that the equity will revert to Tuaropaki Kaitiaki Limited in
2037. In future, annual impairment charges will be made to reduce the carrying value of the Equity to $1 by 2037.
Aggregate summary financial information of associates, not adjusted for the percentage held by the Group
Group Group 2011 2010
$000 $000
Total assets 566,668 577,352
Total liabilities 372,272 424,779
Total revenues 72,060 74,226
Total profit/(loss) for the year 16,109 (43,545)
The loss recognised for associate entities in 2010 included the impact of the energy derivative fair value loss on the TPC Foundation hedge contract.
A description of the contract can be found in note 25.
Notes to the Financial StatementsFor the year ended 30 June 2011

Mighty River Power Limited Annual Report 2011 73
NOTE 17. INVESTMENT IN JOINTLY CONTROLLED ASSETS
Interest HeldName of joint venture 2011 2010 Principal activity
Rotokawa 74.68% 74.68% Steamfield operation
Nga Awa Purua 75% 75% Electricity generation
Tirohia 0% 50% Electricity generation
On the 31st July 2010 our interest in Tirohia joint venture was sold.
The joint venture partner in Rotokawa and Nga Awa Purua has notified their intention to exercise an option to acquire an additional 10% interest
in the joint ventures which would reduce the Group’s interest to 65%. Management anticipate this occurring in the next financial year and as a
consequence have recognised a reduction in the carrying value in the Group’s interest in the jointly controlled asset with an offsetting reduction
in the Group’s share of the asset revaluation reserve.
NOTE 18. INVESTMENTS IN JOINTLY CONTROLLED ENTITIES
Group Group Company Company 2011 2010 2011 2010 $000 $000 $000 $000
Balance at the beginning of the year 111,926 - - -
Additions during the year 4,130 134,020 - -
Equity accounted earnings 2,935 (21,992) - -
Exchange movements (20,021) (102) - -
Balance at the end of the year 98,970 111,926 - -
Jointly controlled entities include: Economic Interest Held Country ofName of entity 2011 2010 Principal activity incorporation
Energy Source LLC 20.27% 20% Investment holding United States
Hudson Ranch Holdings LLC 75% 75% Investment holding United States
The Group’s interest in the above jointly controlled entities is held by GeoGlobal U.S. EnergySource LLC.
Due to the nature of the contractual arrangement that surround these entities, which allows for a reduction in the Group’s economic interest once
prescribed preferred returns have been achieved, the share of movements in earnings and reserves has been calculated based on the Hypothetical
Liquidation at Book Value method. This method more closely aligns the recognition of earnings through time with the expected contractually agreed
economic outcomes compared to the recognition of earnings based on a strict percentage of ownership. The Hypothetical Liquidation at Book Value
method closely approximates the equity accounting method at balance date.
Aggregate summary financial information of jointly controlled entities, not adjusted for the percentage held by the Group
Group Group 2011 2010
$000 $000
Total assets 414,386 173,188
Total liabilities 258,686 36,881
Total revenues 1,942 309
Total profit/(loss) for the year (11,942) (28,761)
The losses of jointly controlled entities in the current year has arisen mainly due to an increase in the level of feasibility expenditure. The prior year
losses related mainly to fair market value movements on interest rate derivative contracts. These contracts have maturities between 2012 and 2027.
The shorter dated contracts are being used to fix the interest rate on the development project financing while the longer dated contracts cover the
post commissioning funding requirements. Hedge accounting has not been adopted for these contracts.
Notes to the Financial StatementsFor the year ended 30 June 2011

74 Mighty River Power Limited Annual Report 2011
NOTE 19. ADVANCES
Group Group Company Company 2011 2010 2011 2010 $000 $000 $000 $000
Loan to Rotokawa joint venture partner 10,877 11,841 - -
For terms and conditions of related party receivables refer to note 29.
NOTE 20. PAYABLES AND ACCRUALS
Group Group Company Company
2011 2010 2011 2010
$000 $000 $000 $000
Trade payables and accruals 189,733 140,745 169,888 128,225
Employee entitlements 6,582 5,308 6,191 5,251
Sundry creditors 2,790 2,416 1,822 1,383
Related party payables 2,624 - - -
201,729 148,469 177,901 134,859
Current 180,431 148,469 156,603 134,859
Non-current 21,298 - 21,298 -
201,729 148,469 177,901 134,859
Trade payables are non-interest bearing and are normally settled on 30 - 60 day terms, except for the premium on the Genesis swaption which is
payable over 5 years.
NOTE 21. PROVISIONS
Group Group Company Company 2011 2010 2011 2010 $000 $000 $000 $000
Balance at the beginning of the year 2,673 2,058 211 -
Provisions made during the year 1,215 366 - -
Provisions acquired on amalgamation - - - 211
Unwind of discount rate 312 249 19 -
Balance at the end of the year 4,200 2,673 230 211
Provisions have been recognised for the abandonment and subsequent restoration of areas from which geothermal resources have been extracted.
The timing of expected cash out-flows required to settle the above provision is uncertain and will depend on the extent of the geothermal steam
resource for the well and the field.
Notes to the Financial StatementsFor the year ended 30 June 2011
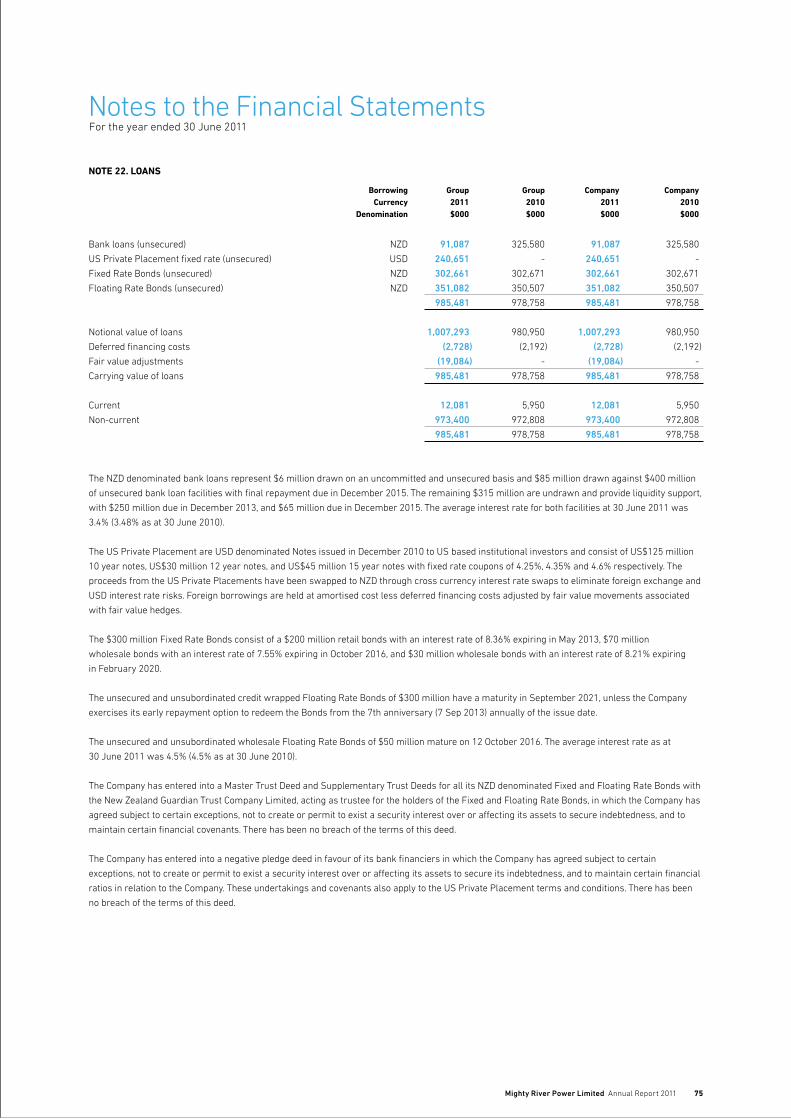
Mighty River Power Limited Annual Report 2011 75
Notes to the Financial StatementsFor the year ended 30 June 2011
NOTE 22. LOANS
Borrowing Group Group Company Company Currency 2011 2010 2011 2010 Denomination $000 $000 $000 $000
Bank loans (unsecured) NZD 91,087 325,580 91,087 325,580
US Private Placement fixed rate (unsecured) USD 240,651 - 240,651 -
Fixed Rate Bonds (unsecured) NZD 302,661 302,671 302,661 302,671
Floating Rate Bonds (unsecured) NZD 351,082 350,507 351,082 350,507
985,481 978,758 985,481 978,758
Notional value of loans 1,007,293 980,950 1,007,293 980,950
Deferred financing costs (2,728) (2,192) (2,728) (2,192)
Fair value adjustments (19,084) - (19,084) -
Carrying value of loans 985,481 978,758 985,481 978,758
Current 12,081 5,950 12,081 5,950
Non-current 973,400 972,808 973,400 972,808
985,481 978,758 985,481 978,758
The NZD denominated bank loans represent $6 million drawn on an uncommitted and unsecured basis and $85 million drawn against $400 million
of unsecured bank loan facilities with final repayment due in December 2015. The remaining $315 million are undrawn and provide liquidity support,
with $250 million due in December 2013, and $65 million due in December 2015. The average interest rate for both facilities at 30 June 2011 was
3.4% (3.48% as at 30 June 2010).
The US Private Placement are USD denominated Notes issued in December 2010 to US based institutional investors and consist of US$125 million
10 year notes, US$30 million 12 year notes, and US$45 million 15 year notes with fixed rate coupons of 4.25%, 4.35% and 4.6% respectively. The
proceeds from the US Private Placements have been swapped to NZD through cross currency interest rate swaps to eliminate foreign exchange and
USD interest rate risks. Foreign borrowings are held at amortised cost less deferred financing costs adjusted by fair value movements associated
with fair value hedges.
The $300 million Fixed Rate Bonds consist of a $200 million retail bonds with an interest rate of 8.36% expiring in May 2013, $70 million
wholesale bonds with an interest rate of 7.55% expiring in October 2016, and $30 million wholesale bonds with an interest rate of 8.21% expiring
in February 2020.
The unsecured and unsubordinated credit wrapped Floating Rate Bonds of $300 million have a maturity in September 2021, unless the Company
exercises its early repayment option to redeem the Bonds from the 7th anniversary (7 Sep 2013) annually of the issue date.
The unsecured and unsubordinated wholesale Floating Rate Bonds of $50 million mature on 12 October 2016. The average interest rate as at
30 June 2011 was 4.5% (4.5% as at 30 June 2010).
The Company has entered into a Master Trust Deed and Supplementary Trust Deeds for all its NZD denominated Fixed and Floating Rate Bonds with
the New Zealand Guardian Trust Company Limited, acting as trustee for the holders of the Fixed and Floating Rate Bonds, in which the Company has
agreed subject to certain exceptions, not to create or permit to exist a security interest over or affecting its assets to secure indebtedness, and to
maintain certain financial covenants. There has been no breach of the terms of this deed.
The Company has entered into a negative pledge deed in favour of its bank financiers in which the Company has agreed subject to certain
exceptions, not to create or permit to exist a security interest over or affecting its assets to secure its indebtedness, and to maintain certain financial
ratios in relation to the Company. These undertakings and covenants also apply to the US Private Placement terms and conditions. There has been
no breach of the terms of this deed.

76 Mighty River Power Limited Annual Report 2011
NOTE 23. DEFERRED TAX
(i) Recognised deferred tax assets and liabilities Assets Assets Liabilities Liabilities Net Net 2011 2010 2011 2010 2011 2010 $000 $000 $000 $000 $000 $000
Group
Property, plant and equipment - - (950,204) (838,140) (950,204) (838,140)
Financial instruments 92,900 68,457 (21,321) (22,505) 71,579 45,952
Employee benefits and other provisions 1,163 1,498 - - 1,163 1,498
Other 2,290 1,307 (170) (211) 2,120 1,096
96,353 71,262 (971,695) (860,856) (875,342) (789,594)
Company
Property, plant and equipment - - (775,163) (721,721) (775,163) (721,721)
Financial instruments 86,308 63,831 (21,570) (19,639) 64,738 44,192
Employee benefits and other provisions 1,132 1,481 - - 1,132 1,481
Other 2,046 1,123 (170) (211) 1,876 912
89,486 66,435 (796,903) (741,571) (707,417) (675,136)
(ii) The movement in deferred tax Property, plant and Financial Employee equipment instruments entitlements Other Total $000 $000 $000 $000 $000
Group
Balance as at 1 July 2009 (776,760) 31,231 1,157 448 (743,924)
Charged/(credited) to the income statement (12,417) (2,940) 357 739 (14,261)
Charged/(credited) to equity (107,676) 20,436 - - (87,240)
Balance transferred to JV partner 547 - - - 547
Change in tax rate recognised in the income statement 7,514 (339) (16) (91) 7,068
Change in tax rate recognised in equity 50,652 (2,436) - - 48,216
Balance as at 30 June 2010 (838,140) 45,952 1,498 1,096 (789,594)
Balance as at 1 July 2010 (838,140) 45,952 1,498 1,096 (789,594)
Charged/(credited) to the income statement 2,743 7,177 (269) 1,074 10,725
Charged/(credited) to equity (125,040) 20,782 - - (104,258)
Balance transferred to JV partner 165 - - - 165
Change in tax rate recognised in the income statement 1,826 (822) (67) (54) 823
Change in tax rate recognised in equity 8,245 (1,448) - - 6,797
Balance as at 30 June 2011 (950,201) 71,581 1,162 2,116 (875,342)
Notes to the Financial StatementsFor the year ended 30 June 2011

Mighty River Power Limited Annual Report 2011 77
Property, plant and Financial Employee equipment instruments entitlements Other Total $000 $000 $000 $000 $000
Company
Balance as at 1 July 2009 (685,980) 31,231 1,007 355 (653,387)
Charged/(credited) to the income statement (5,861) (2,940) 340 626 (7,835)
Charged/(credited) to equity (82,877) 18,539 - - (64,338)
Balances transferred 3,246 - 140 13 3,399
Change in tax rate recognised in the income statement 5,720 (339) (6) (83) 5,292
Change in tax rate recognised in equity 44,031 (2,298) - - 41,733
Balance as at 30 June 2010 (721,721) 44,193 1,481 911 (675,136)
Balance as at 1 July 2010 (721,721) 44,193 1,481 911 (675,136)
Charged/(credited) to the income statement 7,264 7,511 (284) 1,005 15,496
Charged/(credited) to equity (67,065) 15,014 - - (52,051)
Balances transferred 322 - - - 322
Change in tax rate recognised in the income statement 1,660 (905) (64) (44) 647
Change in tax rate recognised in equity 4,380 (1,075) - - 3,305
Balance as at 30 June 2011 (775,160) 64,738 1,133 1,872 (707,417)
In May 2010 the government announced a change in the headline Company tax rate from 30% to 28%. This change will be effective for the Group
from 1 July 2011. An adjustment has been made to deferred tax in relation to temporary differences that reverse after that date.
The government also announced the removal of tax deprecation deductions on buildings from the same date. As a result an adjustment to deferred
tax has been made relating to office and other buildings. While it is Management’s view that powerhouse assets should not be captured, they accept
that there is a potential risk that a portion of the asset may be considered by the Inland Revenue to be a building for tax purposes. The balance would
more appropriately be identified as plant. Consequently, as a prudent measure, a deferred tax liability has also been recognised for a portion of the
powerhouse assets. Deferred tax has been increased by $9.8 million as a result of this announcement. In the unlikely event that all powerhouse
assets were deemed to be buildings by the Inland Revenue an additional deferred tax liability of $21.3 million would also need to be recognised.
Property, plant and equipment is held on capital account for income tax purposes. Where assets are revalued, with no similar adjustment to the
tax base, a taxable temporary difference is created that is recognised in deferred tax. The deferred tax liability on these revaluations is unlikely
to crystallise under existing income tax legislation.
NOTE 24. FINANCIAL RISK MANAGEMENT
The Group’s principal financial instruments comprise receivables, payables, cash and short-term deposits, debt, available for sale investments
and derivatives.
Exposure to price, credit, foreign exchange, liquidity and interest rate risks arises in the normal course of the Group’s business. The Group’s
overall risk management programme focuses on the unpredictability of financial markets and seeks to proactively manage these risks with
the aim of protecting shareholder wealth. The Group uses derivative financial instruments to hedge these exposures.
Risk management is carried out by a central Treasury function (Treasury) for interest rate and foreign exchange exposures. Risk management
activities in respect of electricity exposures are undertaken by the Generation Group (Generation). Both Treasury and Generation operate under
policies approved by the Board of Directors.
Notes to the Financial StatementsFor the year ended 30 June 2011

78 Mighty River Power Limited Annual Report 2011
Price Risk – Energy Contracts
The Group enters into energy contracts that establish a fixed price at which future specified quantities of electricity are purchased, sold
or otherwise exchanged. The Group’s exposure to spot electricity prices is limited by the Board approved Market and Credit Risk Policy.
On maturity of the energy contracts, any difference between the contract price and the spot market price is settled between the parties.
Settlement occurs irrespective of the amount of electricity actually supplied or consumed.
At balance date, the principal value of energy contracts, including both buy and sell contracts, some with terms of up to 15 years, were:
Group Group Company Company 2011 2010 2011 2010 $000 $000 $000 $000
Energy contracts 3,408,191 1,729,586 3,325,934 2,059,968
The significant movement from last year relates mainly to the inclusion of the Meridian Virtual Asset Swap.
Sensitivity analysis
The following table summarises the impact of increases and decreases in the relevant electricity forward prices on the Group and Company’s post
tax profit for the year and on other components of equity. The sensitivity analysis is based on an assessment of the reasonably possible movements
in forward price, with all other variables held constant.
Impact on post tax profit Direct impact on equity 2011 2010 2011 2010 $000 $000 $000 $000
Group
Electricity forward price increased by 10% 7,613 13,749 (45,737) (52,695)
Electricity forward price decreased by 10% (7,319) (13,749) 45,737 52,695
Parent or Company
Electricity forward price increased by 10% 7,596 13,749 (39,247) (34,055)
Electricity forward price decreased by 10% (7,303) (13,749) 39,247 34,055
Credit Risk
To the extent that the Group has a receivable from another party there is a credit risk in the event of non-performance by that counterparty.
Financial instruments that potentially subject the Group to credit risk principally consist of bank balances, receivables, investments and derivative
financial instruments.
The Group manages its exposure to credit risk under policies approved by the Board of Directors. The Group performs credit evaluations on all
electricity customers and normally requires a bond from customers who have yet to establish a suitable credit history. Customer bonds of $1.9
million are held in a separate bank account (2010: $1.6 million).
It is the Group’s policy to only enter into derivative transactions with banks that it has signed an ISDA master agreement with, and which have a
minimum long-term Standard & Poor’s (or Moody’s equivalent) credit rating of A- or higher. The Group monitors the credit quality of the major
counterparties to its derivative financial instruments and does not anticipate non-performance by them.
With respect to energy contracts, the Group has potential credit risk exposure to the counterparty dependent on the spot market price at settlement,
although it does not anticipate any non performance of any obligations which may exist on maturity of these contracts. Credit risk in relation to these
counterparties is managed in accordance with the Market and Credit Risk Policy.
Notes to the Financial StatementsFor the year ended 30 June 2011

Mighty River Power Limited Annual Report 2011 79
In the event of a failure by a retailer to settle its obligations to the Energy Clearing House, following the exhaustion of its prudential security,
a proportionate share of the shortfall will be assumed by all generator class market participants. The Group consequently will be impacted
in the event that this occurs.
The carrying amounts of financial assets recognised in the balance sheet best represent the Group’s maximum exposure to credit risk at the
reporting date without taking account of any collateral held by way of customer bonds.
Included in receivables are the following balances:
Group Group Company Company 2011 2010 2011 2010 $000 $000 $000 $000
Energy Clearing House Limited 32,013 15,464 25,618 15,464
The Group does not have any other significant concentrations of credit risk.
Foreign Exchange Risk
The Group is exposed to foreign exchange risk as a result of transactions denominated in a currency other than the Group’s functional currency,
New Zealand dollars (NZD). The currencies giving rise to this risk are primarily US dollar, Japanese Yen, Pound Sterling, Euro, Australian dollar and
Chilean Peso.
Foreign exchange risk arises from future commercial transactions (including the purchase of capital equipment and maintenance services),
recognised assets and liabilities (including borrowings) and net investments in foreign operations.
It is the Group’s policy to enter into forward exchange contracts to support its domestic capital expenditure programme. To do this foreign exchange
contracts are taken out to hedge spot rate risk on highly probable forecast transactions where there is some uncertainty around timing. These
contracts are rolled on an instalment basis until there is certainty around both the amount and timing of payments at which time the contracts are
rolled into specific contracts hedging those cash flows.
The hedged anticipated transactions denominated in foreign currency are expected to occur at various dates between 1 month and 5 years from
balance date. Gains and losses in the cash flow hedge reserve on foreign currency forward exchange contracts as at 30 June will be released when
the underlying anticipated transactions occur and will be recognised in the income statement or capitalised to the cost of the asset acquired.
At balance date the principal or contract amounts of foreign currency forward exchange contracts are:
Group Group Company Company 2011 2010 2011 2010 $000 $000 $000 $000
Foreign currency forward exchange contracts 218,365 291,896 218,365 291,896
The group has certain investments in foreign operations whose net assets are exposed to foreign currency translation risk. Currency exposure
arising from the net assets of foreign operations is currently unhedged but may be managed on a case by case basis through the use of derivative
contracts or through borrowings denominated in the same currency.
At balance date the Group has US funds of US$1.2 million (2010: US$1.2 million), Japanese funds of ¥0.6 million (2010: ¥0.1 million), Euro funds
of €0.0 million (2010: €0.1 million), Sterling funds of £0.0 million (2010: £0.0 million), Australian funds of A$0.1 million (2010: A$0.1 million) and
Chilean Pesos of $0.7 million (2010: $0.0 million) held in foreign currency bank accounts that are not hedged. This excludes bank accounts held
in the functional currency of offshore subsidiaries.
Notes to the Financial StatementsFor the year ended 30 June 2011

80 Mighty River Power Limited Annual Report 2011
Sensitivity analysis
The following table summarises the impact on other components of equity of the New Zealand dollar weakening or strengthening against the
currencies for which the Group has foreign exchange exposure. The sensitivity analysis is based on an assessment of the reasonably possible
movements in foreign exchange rates over a one year period based on the average actual movements experienced over the prior 10 years,
with all other variables held constant. Post tax profits would not be materially different.
Direct impact on equity Group and Company
2011 2010 $000 $000
Currency strengthens by 7.5% (2010: 7.5%) (15,258) (13,882)
Currency weakens by 10% (2010: 15%) 24,300 35,114
Interest Rate Risk
The group has exposure to interest rate risk to the extent that it borrows for fixed terms at floating interest rates. The Group manages its
cost of borrowing by limiting the ratio of fixed to floating rate cover held. The Group uses interest rate swaps and interest rate options to
manage this exposure.
Financial instruments are held to protect a portion of future borrowings forecast to fund the capital expenditure programme, even though the
underlying facility is not yet placed.
At balance date the principal or contract amounts of interest rate swaps and interest rate options outstanding (including forward starts) are:
Group Group Company Company 2011 2010 2011 2010 $000 $000 $000 $000
Interest rate swaps 2,745,824 2,640,400 2,745,824 2,640,400
Interest rate options 100,000 100,000 100,000 100,000
Forward rate agreements - 175,000 - 175,000
Sensitivity analysis
The following table summarises the impact on post tax profit due to movements in interest rates. The sensitivity analysis is based on an assessment
of the reasonably possible movement in the 10 year swap rate over a year period based on actual movements over the last 10 years, with all
other variables held constant. The movement in post tax profits are due to higher/lower interest costs from variable rate debt and cash balances
combined with the result of fair value changes in interest rate swaps and options that are valid economic hedges but which do not qualify for hedge
accounting under NZ IAS 39. There would be no effect on other components of equity.
Impact on post tax profit Group and Company 2011 2010 $000 $000
Interest rates higher by 100 bpts (2010: 100 bpts) 44,680 40,066
Interest rates lower by 50 bpts (2010: 50 bpts) (23,785) (21,415)
Notes to the Financial StatementsFor the year ended 30 June 2011

Mighty River Power Limited Annual Report 2011 81
Liquidity Risk
The Group’s objective is to maintain a balance between continuity of funding and flexibility through the use of various funding sources. The Group’s
ability to readily attract cost effective funding is largely driven by its credit rating.
Liquidity risk is monitored by continuously forecasting cash flows, and matching these to funding facilities. Policy requires that prescribed headroom
is available in undrawn facilities to cover unanticipated needs. In addition it is the Group’s policy to ensure that not more than 25% of borrowings
should mature in any 12 month period.
Non derivative financial liabilities
The following liquidity risk disclosures reflect all contractually fixed payoffs, repayments from recognised financial liabilities as of 30 June.
The timing of cash flows for liabilities is based on the contractual terms of the underlying contract. However, where the counterparty has
a choice of when the amount is paid, the liability is allocated to the earliest period in which the Group can be required to pay.
Liquid non-derivative assets comprising cash and receivables are considered in the Group’s overall liquidity risk. The Group ensures that
sufficient liquid assets are available to meet all the required short-term cash payments.
Less than 6 6 to 12 1 to 5 Later than Months Months Years 5 Years Total
$000 $000 $000 $000 $000
Group June 2011
Liquid financial assets
Cash and cash equivalents 28,722 - - - 28,722
Receivables 192,117 - 378 - 192,495
220,839 - 378 - 221,217
Financial liabilities
Payables and accruals (180,431) - (21,298) - (201,729)
Loans (12,081) - (285,087) (688,313) (985,481)
(192,512) - (306,385) (688,313) (1,187,210)
Net inflow/(outflow) 28,327 - (306,007) (688,313) (965,993)
Less than 6 6 to 12 1 to 5 Later than Months Months Years 5 Years Total
$000 $000 $000 $000 $000
Group June 2010
Liquid financial assets
Cash and cash equivalents 7,905 - - - 7,905
Receivables 168,645 - - - 168,645
176,550 - - - 176,550
Financial liabilities
Payables and accruals (148,469) - - - (148,469)
Loans (5,950) - (525,920) (446,888) (978,758)
(154,419) - (525,920) (446,888) (1,127,227)
Net inflow/(outflow) 22,131 - (525,920) (446,888) (950,677)
Notes to the Financial StatementsFor the year ended 30 June 2011
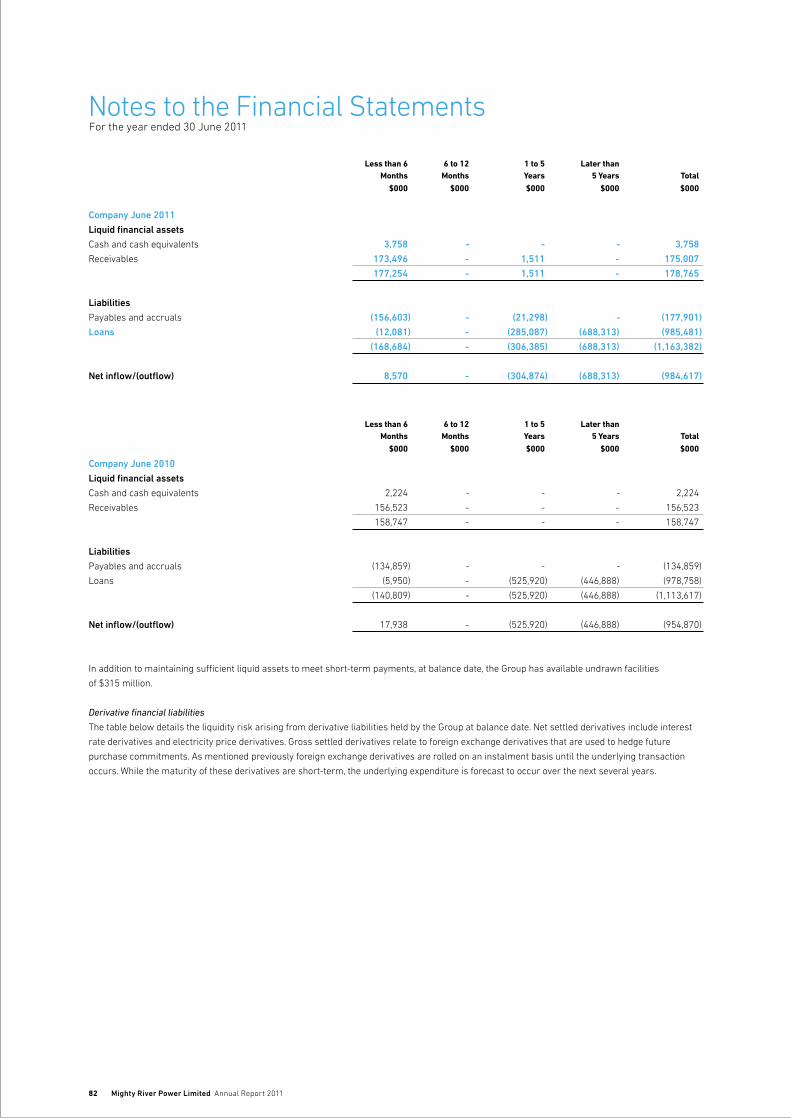
82 Mighty River Power Limited Annual Report 2011
Less than 6 6 to 12 1 to 5 Later than Months Months Years 5 Years Total
$000 $000 $000 $000 $000
Company June 2011
Liquid financial assets
Cash and cash equivalents 3,758 - - - 3,758
Receivables 173,496 - 1,511 - 175,007
177,254 - 1,511 - 178,765
Liabilities
Payables and accruals (156,603) - (21,298) - (177,901)
Loans (12,081) - (285,087) (688,313) (985,481)
(168,684) - (306,385) (688,313) (1,163,382)
Net inflow/(outflow) 8,570 - (304,874) (688,313) (984,617)
Less than 6 6 to 12 1 to 5 Later than Months Months Years 5 Years Total
$000 $000 $000 $000 $000
Company June 2010
Liquid financial assets
Cash and cash equivalents 2,224 - - - 2,224
Receivables 156,523 - - - 156,523
158,747 - - - 158,747
Liabilities
Payables and accruals (134,859) - - - (134,859)
Loans (5,950) - (525,920) (446,888) (978,758)
(140,809) - (525,920) (446,888) (1,113,617)
Net inflow/(outflow) 17,938 - (525,920) (446,888) (954,870)
In addition to maintaining sufficient liquid assets to meet short-term payments, at balance date, the Group has available undrawn facilities
of $315 million.
Derivative financial liabilities
The table below details the liquidity risk arising from derivative liabilities held by the Group at balance date. Net settled derivatives include interest
rate derivatives and electricity price derivatives. Gross settled derivatives relate to foreign exchange derivatives that are used to hedge future
purchase commitments. As mentioned previously foreign exchange derivatives are rolled on an instalment basis until the underlying transaction
occurs. While the maturity of these derivatives are short-term, the underlying expenditure is forecast to occur over the next several years.
Notes to the Financial StatementsFor the year ended 30 June 2011

Mighty River Power Limited Annual Report 2011 83
Less than 6 6 to 12 1 to 5 Later than Months Months Years 5 Years Total
$000 $000 $000 $000 $000
Group June 2011
Derivative liabilities – net settled (8,024) (2,678) (36,270) (341,645) (388,617)
Derivative liabilities – gross settled
Inflows 217,110 - - - 217,110
Outflows (227,515) - - - (227,515)
Net maturity (18,429) (2,678) (36,270) (341,645) (399,022)
Less than 6 6 to 12 1 to 5 Later than Months Months Years 5 Years Total
$000 $000 $000 $000 $000
Group June 2010
Derivative liabilities – net settled (1,414) (5,112) (14,700) (241,550) (262,776)
Derivative liabilities – gross settled
Inflows 235,408 25,230 - - 260,638
Outflows (242,925) (30,777) - - (273,702)
Net maturity (8,931) (10,659) (14,700) (241,550) (275,840)
Less than 6 6 to 12 1 to 5 Later than Months Months Years 5 Years Total
$000 $000 $000 $000 $000
Company June 2011
Derivative liabilities – net settled (8,024) (2,678) (39,777) (341,645) (392,124)
Derivative liabilities – gross settled
Inflows 217,110 - - - 217,110
Outflows (227,515) - - - (227,515)
Net maturity (18,429) (2,678) (39,777) (341,645) (402,529)
Less than 6 6 to 12 1 to 5 Later than Months Months Years 5 Years Total
$000 $000 $000 $000 $000
Company June 2010
Derivative liabilities – net settled (1,414) (5,694) (15,942) (241,549) (264,599)
Derivative liabilities – gross settled
Inflows 235,408 25,230 - - 260,638
Outflows (242,925) (30,777) - - (273,702)
Net maturity (8,931) (11,241) (15,942) (241,549) (277,663)
Fair values
The carrying amount of financial assets and liabilities recorded in the financial statements approximates their fair values except for the Fixed Rate
Bonds and the US Private Placement, the fair value for which has been calculated at $326 million (2010: $321 million) and $234 million (2010: nil)
respectively based on quoted market prices for each bond issue.
The Group uses various methods in estimating the fair value of a financial instrument. The methods comprise:
• Level1–thefairvalueiscalculatedusingquotedpricesinactivemarkets
• Level2–thefairvalueisestimatedusinginputsotherthanquotedpricesincludedinLevel1thatareobservablefortheassetorliability,
either directly (as prices) or indirectly (derived from prices)
• Level3–thefairvalueisestimatedusinginputsfortheassetorliabilitythatarenotbasedonobservablemarketdata
Notes to the Financial StatementsFor the year ended 30 June 2011
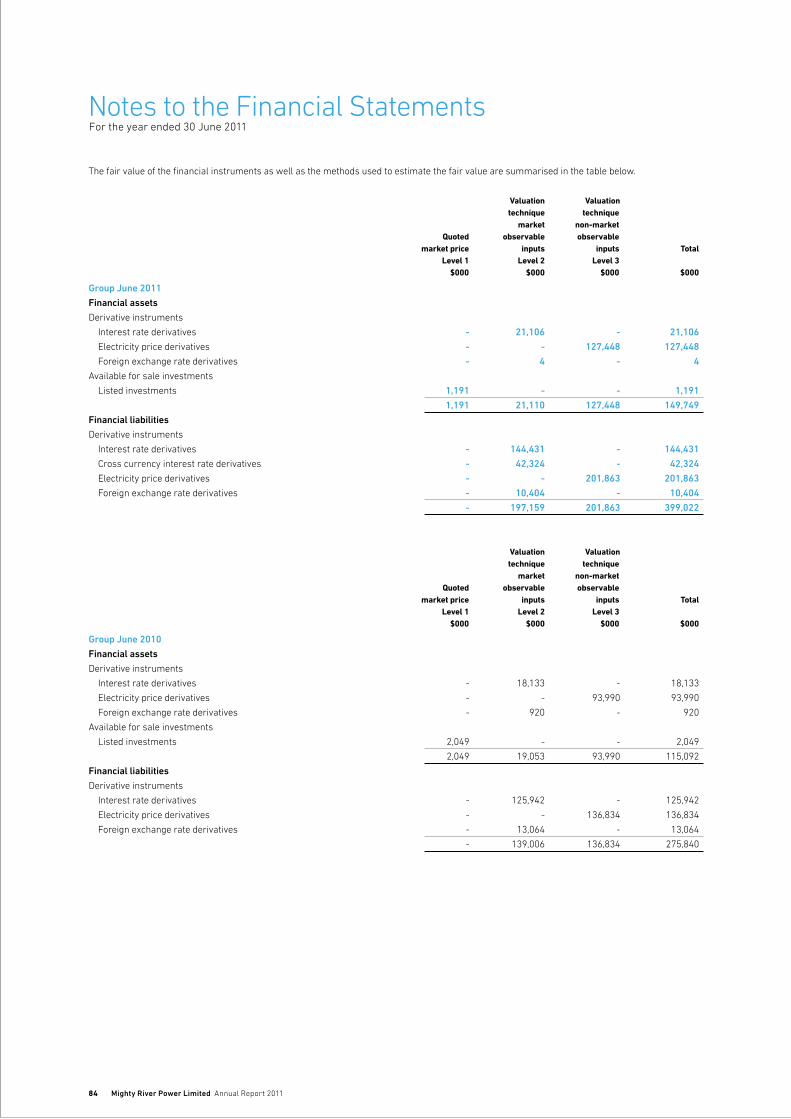
84 Mighty River Power Limited Annual Report 2011
The fair value of the financial instruments as well as the methods used to estimate the fair value are summarised in the table below.
Valuation Valuation technique technique market non-market Quoted observable observable market price inputs inputs Total Level 1 Level 2 Level 3 $000 $000 $000 $000
Group June 2011
Financial assets
Derivative instruments
Interest rate derivatives - 21,106 - 21,106
Electricity price derivatives - - 127,448 127,448
Foreign exchange rate derivatives - 4 - 4
Available for sale investments
Listed investments 1,191 - - 1,191
1,191 21,110 127,448 149,749
Financial liabilities
Derivative instruments
Interest rate derivatives - 144,431 - 144,431
Cross currency interest rate derivatives - 42,324 - 42,324
Electricity price derivatives - - 201,863 201,863
Foreign exchange rate derivatives - 10,404 - 10,404
- 197,159 201,863 399,022
Valuation Valuation technique technique market non-market Quoted observable observable market price inputs inputs Total Level 1 Level 2 Level 3 $000 $000 $000 $000
Group June 2010
Financial assets
Derivative instruments
Interest rate derivatives - 18,133 - 18,133
Electricity price derivatives - - 93,990 93,990
Foreign exchange rate derivatives - 920 - 920
Available for sale investments
Listed investments 2,049 - - 2,049
2,049 19,053 93,990 115,092
Financial liabilities
Derivative instruments
Interest rate derivatives - 125,942 - 125,942
Electricity price derivatives - - 136,834 136,834
Foreign exchange rate derivatives - 13,064 - 13,064
- 139,006 136,834 275,840
Notes to the Financial StatementsFor the year ended 30 June 2011
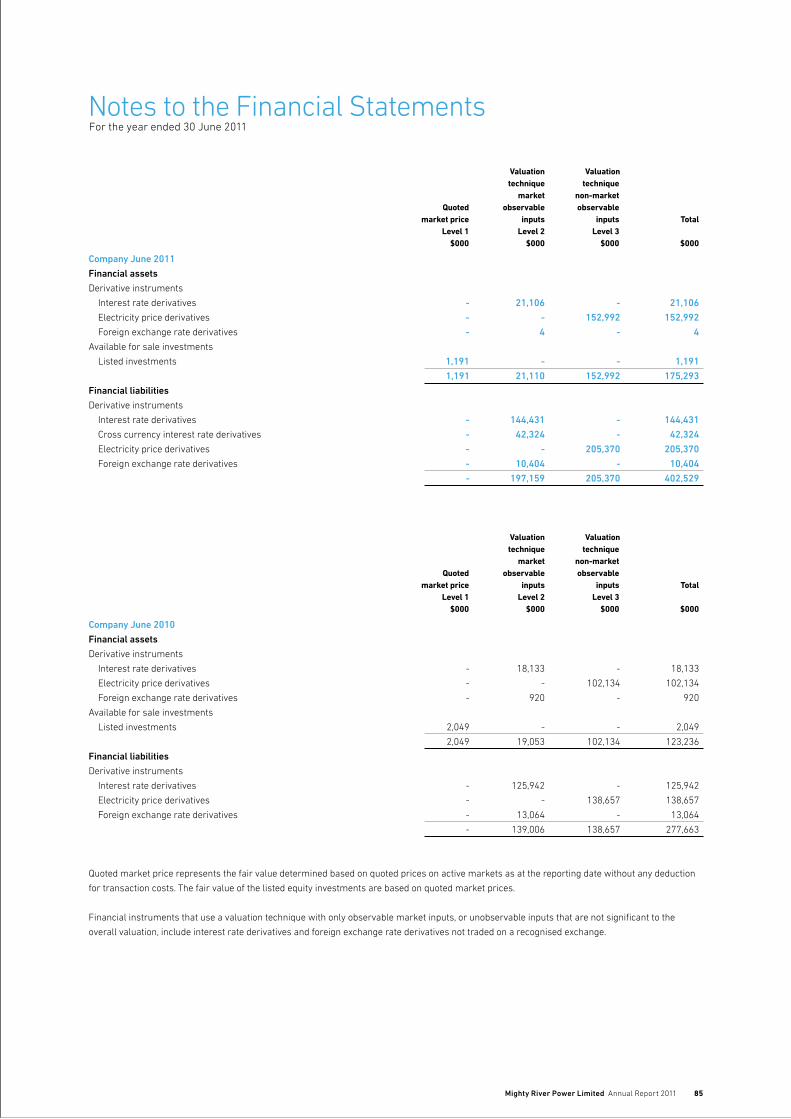
Mighty River Power Limited Annual Report 2011 85
Valuation Valuation technique technique market non-market Quoted observable observable market price inputs inputs Total Level 1 Level 2 Level 3 $000 $000 $000 $000
Company June 2011
Financial assets
Derivative instruments
Interest rate derivatives - 21,106 - 21,106
Electricity price derivatives - - 152,992 152,992
Foreign exchange rate derivatives - 4 - 4
Available for sale investments
Listed investments 1,191 - - 1,191
1,191 21,110 152,992 175,293
Financial liabilities
Derivative instruments
Interest rate derivatives - 144,431 - 144,431
Cross currency interest rate derivatives - 42,324 - 42,324
Electricity price derivatives - - 205,370 205,370
Foreign exchange rate derivatives - 10,404 - 10,404
- 197,159 205,370 402,529
Valuation Valuation technique technique market non-market Quoted observable observable market price inputs inputs Total Level 1 Level 2 Level 3 $000 $000 $000 $000
Company June 2010
Financial assets
Derivative instruments
Interest rate derivatives - 18,133 - 18,133
Electricity price derivatives - - 102,134 102,134
Foreign exchange rate derivatives - 920 - 920
Available for sale investments
Listed investments 2,049 - - 2,049
2,049 19,053 102,134 123,236
Financial liabilities
Derivative instruments
Interest rate derivatives - 125,942 - 125,942
Electricity price derivatives - - 138,657 138,657
Foreign exchange rate derivatives - 13,064 - 13,064
- 139,006 138,657 277,663
Quoted market price represents the fair value determined based on quoted prices on active markets as at the reporting date without any deduction
for transaction costs. The fair value of the listed equity investments are based on quoted market prices.
Financial instruments that use a valuation technique with only observable market inputs, or unobservable inputs that are not significant to the
overall valuation, include interest rate derivatives and foreign exchange rate derivatives not traded on a recognised exchange.
Notes to the Financial StatementsFor the year ended 30 June 2011

86 Mighty River Power Limited Annual Report 2011
Notes to the Financial StatementsFor the year ended 30 June 2011
Financial instruments that use a valuation technique which include non-market observable date include electricity derivatives which are valued
using a discounted cash flow methodology using a combination of ASX market prices for the first five years, combined with Management’s internal
view of forward prices for the remainder of the contracts. Management’s internal view of forward prices is determined by a demand supply based
fundamental model which takes account of current hydrological conditions, future inflows, an assessment of thermal fuel costs, anticipated demand
and supply conditions and future committed generation capacity.
Where the fair value of a derivative is calculated as the present value of the estimated future cash flows of the instrument there are two key
variables being used; the forward price curve and the discount rate. Where the derivative is an option then the volatility of the forward price
is another key variable. The selection of the variables requires significant judgement, and therefore there is a range of reasonably possible
assumptions in respect of these variables that could be used in estimating the fair values of these derivatives. Maximum use is made of
observable market data when selecting variables and developing assumptions for the valuation technique.
Reconciliation of Level 3 fair value movements Group Group Company Company 2011 2010 2011 2010 $000 $000 $000 $000
Opening balance (42,844) (40,145) (36,523) (40,145)
New contracts 21,482 6,849 18,865 13,278
Matured contracts (5,081) (1,600) (4,532) (1,600)
Ineffectiveness of electricity derivative cash flow hedges
recognised through the income statement (1,959) (123) (1,850) (231)
Gains and losses
Through the income statement 2,770 70,027 2,770 70,027
Through other comprehensive income (48,783) (77,852) (31,108) (77,852)
Closing balance (74,415) (42,844) (52,378) (36,523)
Deferred ‘inception’ gains (losses)
An inception adjustment arises when the initial fair value of an electricity derivative is greater or less than zero. The inception value is
amortised over the life of the contract by adjusting the future price path used to determine the fair value of the derivatives by a constant
amount to return the initial fair value to zero.
The table below details the movements in inception value gains (losses) included in the fair value of derivative financial assets and liabilities
as at 30 June.
Group Group Company Company 2011 2010 2011 2010 $000 $000 $000 $000
Electricity price derivatives
Opening deferred inception gains (losses) 27,740 34,295 4,874 34,295
Deferred inception gains (losses) on new hedges 13,056 (6,811) 16,149 (29,677)
Deferred inception gains (losses) realised during the year 969 256 4,474 256
Closing inception gains (losses) 41,765 27,740 25,497 4,874
Capital risk management objectives
Management seeks to maintain a sustainable financial structure for the Group having regard to the risks from predicted short and medium-term
economic, market and hydrological conditions along with estimated financial performance. Capital is managed to provide sufficient funds to
undertake required asset reinvestment as well as to finance new generation development projects and other growth opportunities to increase
shareholder value at a rate similar to comparable private sector companies.
In order to maintain or adjust the capital structure, changes may be made to the amount paid as dividends to the shareholders, capital may be
returned or injected or assets sold to reduce borrowings.

Mighty River Power Limited Annual Report 2011 87
Notes to the Financial StatementsFor the year ended 30 June 2011
Consistent with others in the industry, the Group monitors capital on the basis of the gearing ratio. This ratio is calculated as net debt divided
by total capital. Net debt is calculated as total borrowings (both current and non current) less cash and cash equivalents. Total capital is calculated
as shareholders’ equity plus net debt. The gearing ratio is calculated below:
Group Group 2011 2010 $000 $000
Loans 985,481 978,758
Less cash and cash equivalents (28,722) (7,905)
Net Debt 956,759 970,853
Total Equity 2,906,542 2,688,970
Total Capital 3,863,301 3,659,823
Gearing Ratio 24.8% 26.5%
Under the negative pledge deed in favour of its bank financiers the Group must, in addition to not exceeding its maximum gearing ratio, exceed
minimum interest cover ratios and minimum shareholder’s equity.
The Group also seeks to maintain its current credit rating and monitors its position against the following targets:
Group Group 2011 2010
Free funds from operations/net interest expense (x) 4.8 5.1
Free funds from operations/average debt (%) 31.7% 28.7%
NOTE 25. DERIVATIVE FINANCIAL INSTRUMENTS
The fair values of derivative financial instruments, together with the designation of their hedging relationship, are summarised below:
Group Group Company Company 2011 2010 2011 2010 $000 $000 $000 $000
Current
Interest rate derivative assets 21,106 18,133 21,106 18,133
Electricity price derivative assets 15,761 16,423 22,302 15,481
Foreign exchange rate derivative assets 4 920 4 920
36,871 35,476 43,412 34,534
Interest rate derivative liabilities 144,431 125,942 144,431 125,942
Electricity price derivative liabilities 9,706 4,149 9,706 4,730
Foreign exchange rate derivative liabilities 10,404 13,064 10,404 13,064
164,541 143,155 164,541 143,736
Non-Current
Electricity price derivative assets 111,687 77,567 130,690 86,653
111,687 77,567 130,690 86,653
Cross currency interest rate derivative liabilities 30,287 - 30,287 -
Cross currency interest rate derivative liabilities – margin 12,037 - 12,037 -
Electricity price derivative liabilities 192,157 132,685 195,664 133,927
234,481 132,685 237,988 133,927

88 Mighty River Power Limited Annual Report 2011
Interest rate derivatives, short-term low value foreign exchange derivatives, and short-term low value electricity price derivatives that are
traded on the ASX, while economic hedges, are not designated as hedges under NZ IAS 39 but are treated as at fair value through profit and loss.
All other foreign exchange and electricity price derivatives (except the Tuaropaki Power Company Foundation Hedge, the Virtual Asset Swap
with Meridian, the Nga Awa Purua outage contract and the Genesis swaption) are designated as cash flow hedges under NZ IAS 39.
Cross currency interest rate swaps, which are used to manage the combined interest and foreign currency risk on borrowings issued in foreign
currency, have been split into two components for the purpose of hedge designation. The hedge of the benchmark interest rate is designated
as a fair value hedge and the hedge of the issuance margin is designated as a cash flow hedge.
The Tuaropaki Power Company Foundation Hedge contract was originated in 1997 between the Tuaropkai Power Company and ECNZ. The contract
was subsequently novated to Mighty River Power Limited. The contract had been suspended since September 2002 and was reinstated in January
2010, after several re-suspensions. The contract was valued at the date of reinstatement at $64.9 million with fair value movements to 30 June
2010 of $5.2 million and a further $5.7 million to 30 June 2011. Due to the complex nature of the contract, and the difficulty in demonstrating
hedge effectiveness, the contract has not been designated as a hedge for accounting purposes and consequently these movements have all
been recognised through the income statement.
The Virtual Asset Swap with Meridian is a 15 year energy contract. Contract prices are established annually for up to three years based
on rolling tranches.
The Genesis swaption entitles the Company to exercise an option during various agreed option periods, in return a monthly premium over
the option exercise period is payable to Genesis Energy. On the exercise of the option the underlying energy contract becomes effective.
The Company has entered into an outage cover contract with Nga Awa Purua to support the Joint Venture’s generation revenue in the event
of a forced station outage for which it receives an annual premium.
The changes in fair values of derivative financial instruments recognised in the income statement and equity are summarised below:
Income Income Statement Statement Equity Equity Group Group Group Group 2011 2010 2011 2010 $000 $000 $000 $000
Cross currency interest rate derivatives (30,141) - - -
Borrowings – fair value change 19,084 - - -
(11,057) - - -
Interest rate derivatives (13,822) (61,597) - -
Cross currency interest rate derivatives – margin - - (11,604) -
Electricity price derivatives 2,397 70,027 (56,851) (73,094)
Foreign exchange rate derivatives (588) 3 (38,990) (16,187)
Income tax on changes in fair value taken to equity - - 32,233 26,786
Total change in fair value of financial instruments (23,070) 8,433 (75,212) (62,495)
Notes to the Financial StatementsFor the year ended 30 June 2011

Mighty River Power Limited Annual Report 2011 89
Notes to the Financial StatementsFor the year ended 30 June 2011
Income Income Statement Statement Equity Equity Company Company Company Company 2011 2010 2011 2010 $000 $000 $000 $000
Cross currency interest rate derivatives (30,141) - - -
Borrowings 19,084 - - -
(11,057) - - -
Interest rate derivatives (13,822) (61,597) - -
Cross currency interest rate derivatives – margin - - (11,604) -
Electricity price derivatives 1,279 70,027 (37,921) (66,665)
Foreign exchange rate derivatives (588) 3 (38,990) (16,187)
Income tax on changes in fair value taken to equity - - 26,554 24,856
Total change in fair value of financial instruments (24,188) 8,433 (61,961) (57,996)
Movement in cash flow hedge reserve Group Group Company Company 2011 2010 2011 2010 $000 $000 $000 $000
Opening balance (63,390) 2,696 (56,829) 3,464
The effective portion of cash flow hedges recognised in the reserve (115,803) (61,677) (96,875) (55,247)
Amortisation of fair values 433 (494) 433 (494)
The amount transferred to operating expenses relating to forecast
transactions that are no longer expected to occur 3,497 (16,428) 3,497 (16,428)
The amount transferred to balance sheet 4,428 (10,682) 4,428 (10,682)
Equity accounted share of associates’ movement in reserves 10 (1,155) - -
Tax effect of movements 32,233 26,786 26,554 24,856
Deferred tax rate change adjustment (1,431) (2,436) (1,058) (2,298)
Closing balance (140,023) (63,390) (119,850) (56,829)
Ineffectiveness of cash flow hedges recognised in the income statement (2,551) (352) (2,551) (460)
Other changes in fair value recognised through the income statement (23,070) 8,433 (24,188) 8,433
Fair value movements recognised through the income statement (25,621) 8,081 (26,739) 7,973

90 Mighty River Power Limited Annual Report 2011
Notes to the Financial StatementsFor the year ended 30 June 2011
NOTE 26. RECONCILIATION OF PROFIT FOR THE PERIOD TO NET CASH FLOWS FROM OPERATING ACTIVITIES
Group Group Company Company 2011 2010 2011 2010 $000 $000 $000 $000
Profit for the period 127,073 84,614 54,912 128,844
Items classified as investing/financing activities
•Fixed,intangibleandinvestmentassetcharges (6,870) (20,237) (6,870) (20,237)
•Loancharges 1,835 (1,446) 1,835 (1,446)
•Transfersbetweengroupcompaniesandrelatedparties - - 2,942 8,414
•Netforeignexchangeloss - - 28,281 -
Non-cash items
Depreciation and amortisation 145,404 98,707 99,842 67,636
Net loss/(gain) on sale of property, plant and equipment 727 56 794 (58)
Change in the fair value of financial instruments 25,621 (8,081) 26,739 (7,973)
Impaired assets 19,786 31,373 56,823 8,908
Unwind of discount on long-term provisions 312 249 19 -
Share of earnings of associate companies (2,069) 11,703 - -
Share of earnings of jointly controlled entities (2,935) 21,992 - -
Other non-cash items 1,996 5,261 3,226 5,066
Net cash provided by operating activities before
change in assets and liabilities 310,880 224,191 268,543 189,154
Change in assets and liabilities during the period:
•(Increase)/decreaseintradereceivablesandprepayments (21,402) 19,268 (15,642) 26,294
•Increaseininventories (2,790) (5,927) (2,509) (2,144)
•Increase/(decrease)intradepayablesandaccruals 10,880 (16,156) 13,063 (21,795)
•(Decrease)/increaseinprovisionfortax (6,325) (30,720) (16,536) (28,416)
•Increase/(decrease)indeferredtax 1,583 8,854 (3,378) 1,310
Net cash inflow from operating activities 292,826 199,510 243,541 164,403
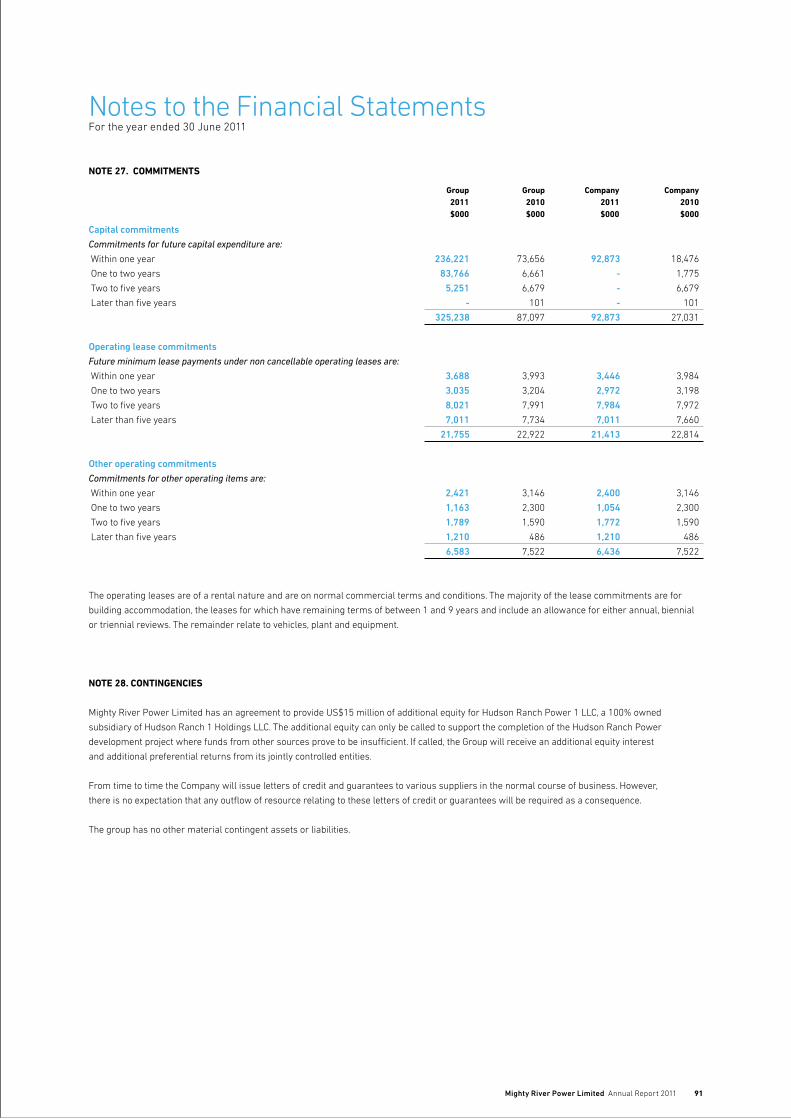
Mighty River Power Limited Annual Report 2011 91
NOTE 27. COMMITMENTS
Group Group Company Company 2011 2010 2011 2010 $000 $000 $000 $000
Capital commitments
Commitments for future capital expenditure are:
Within one year 236,221 73,656 92,873 18,476
One to two years 83,766 6,661 - 1,775
Two to five years 5,251 6,679 - 6,679
Later than five years - 101 - 101
325,238 87,097 92,873 27,031
Operating lease commitments
Future minimum lease payments under non cancellable operating leases are:
Within one year 3,688 3,993 3,446 3,984
One to two years 3,035 3,204 2,972 3,198
Two to five years 8,021 7,991 7,984 7,972
Later than five years 7,011 7,734 7,011 7,660
21,755 22,922 21,413 22,814
Other operating commitments
Commitments for other operating items are:
Within one year 2,421 3,146 2,400 3,146
One to two years 1,163 2,300 1,054 2,300
Two to five years 1,789 1,590 1,772 1,590
Later than five years 1,210 486 1,210 486
6,583 7,522 6,436 7,522
The operating leases are of a rental nature and are on normal commercial terms and conditions. The majority of the lease commitments are for
building accommodation, the leases for which have remaining terms of between 1 and 9 years and include an allowance for either annual, biennial
or triennial reviews. The remainder relate to vehicles, plant and equipment.
NOTE 28. CONTINGENCIES
Mighty River Power Limited has an agreement to provide US$15 million of additional equity for Hudson Ranch Power 1 LLC, a 100% owned
subsidiary of Hudson Ranch 1 Holdings LLC. The additional equity can only be called to support the completion of the Hudson Ranch Power
development project where funds from other sources prove to be insufficient. If called, the Group will receive an additional equity interest
and additional preferential returns from its jointly controlled entities.
From time to time the Company will issue letters of credit and guarantees to various suppliers in the normal course of business. However,
there is no expectation that any outflow of resource relating to these letters of credit or guarantees will be required as a consequence.
The group has no other material contingent assets or liabilities.
Notes to the Financial StatementsFor the year ended 30 June 2011
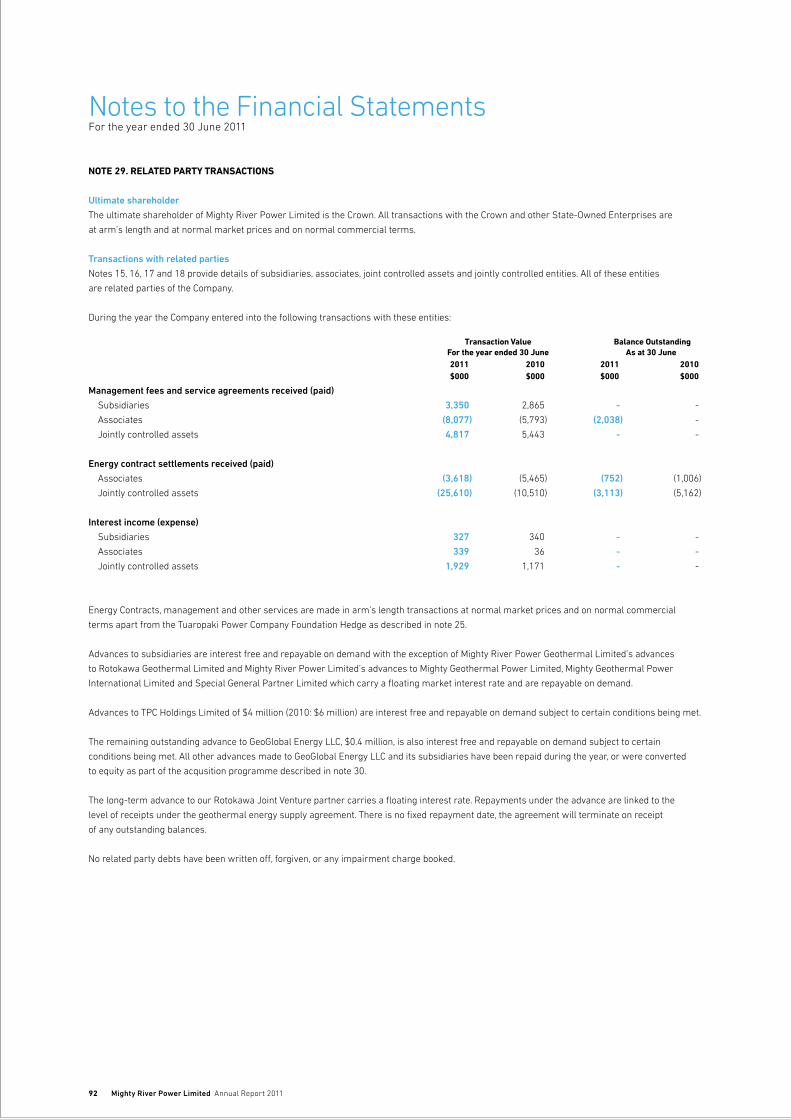
92 Mighty River Power Limited Annual Report 2011
NOTE 29. RELATED PARTY TRANSACTIONS
Ultimate shareholder
The ultimate shareholder of Mighty River Power Limited is the Crown. All transactions with the Crown and other State-Owned Enterprises are
at arm’s length and at normal market prices and on normal commercial terms.
Transactions with related parties
Notes 15, 16, 17 and 18 provide details of subsidiaries, associates, joint controlled assets and jointly controlled entities. All of these entities
are related parties of the Company.
During the year the Company entered into the following transactions with these entities:
Transaction Value Balance Outstanding For the year ended 30 June As at 30 June 2011 2010 2011 2010 $000 $000 $000 $000
Management fees and service agreements received (paid)
Subsidiaries 3,350 2,865 - -
Associates (8,077) (5,793) (2,038) -
Jointly controlled assets 4,817 5,443 - -
Energy contract settlements received (paid)
Associates (3,618) (5,465) (752) (1,006)
Jointly controlled assets (25,610) (10,510) (3,113) (5,162)
Interest income (expense)
Subsidiaries 327 340 - -
Associates 339 36 - -
Jointly controlled assets 1,929 1,171 - -
Energy Contracts, management and other services are made in arm’s length transactions at normal market prices and on normal commercial
terms apart from the Tuaropaki Power Company Foundation Hedge as described in note 25.
Advances to subsidiaries are interest free and repayable on demand with the exception of Mighty River Power Geothermal Limited’s advances
to Rotokawa Geothermal Limited and Mighty River Power Limited’s advances to Mighty Geothermal Power Limited, Mighty Geothermal Power
International Limited and Special General Partner Limited which carry a floating market interest rate and are repayable on demand.
Advances to TPC Holdings Limited of $4 million (2010: $6 million) are interest free and repayable on demand subject to certain conditions being met.
The remaining outstanding advance to GeoGlobal Energy LLC, $0.4 million, is also interest free and repayable on demand subject to certain
conditions being met. All other advances made to GeoGlobal Energy LLC and its subsidiaries have been repaid during the year, or were converted
to equity as part of the acqusition programme described in note 30.
The long-term advance to our Rotokawa Joint Venture partner carries a floating interest rate. Repayments under the advance are linked to the
level of receipts under the geothermal energy supply agreement. There is no fixed repayment date, the agreement will terminate on receipt
of any outstanding balances.
No related party debts have been written off, forgiven, or any impairment charge booked.
Notes to the Financial StatementsFor the year ended 30 June 2011
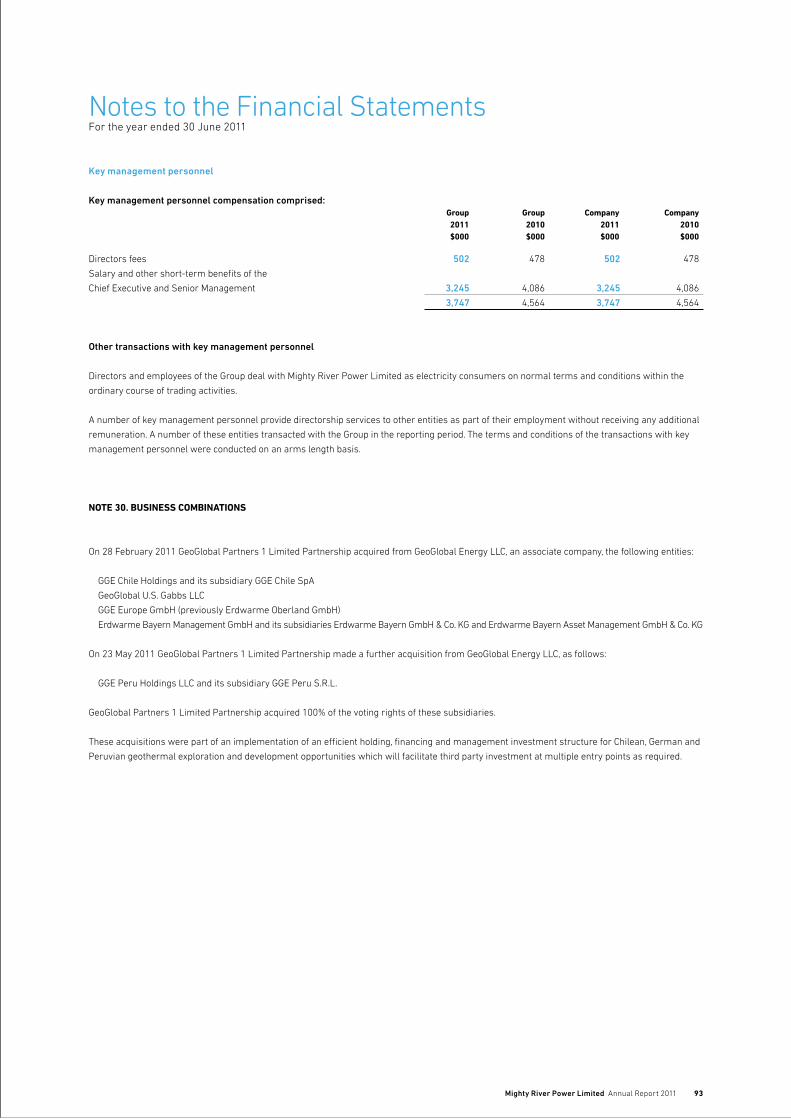
Mighty River Power Limited Annual Report 2011 93
Key management personnel
Key management personnel compensation comprised: Group Group Company Company 2011 2010 2011 2010 $000 $000 $000 $000
Directors fees 502 478 502 478
Salary and other short-term benefits of the
Chief Executive and Senior Management 3,245 4,086 3,245 4,086
3,747 4,564 3,747 4,564
Other transactions with key management personnel
Directors and employees of the Group deal with Mighty River Power Limited as electricity consumers on normal terms and conditions within the
ordinary course of trading activities.
A number of key management personnel provide directorship services to other entities as part of their employment without receiving any additional
remuneration. A number of these entities transacted with the Group in the reporting period. The terms and conditions of the transactions with key
management personnel were conducted on an arms length basis.
NOTE 30. BUSINESS COMBINATIONS
On 28 February 2011 GeoGlobal Partners 1 Limited Partnership acquired from GeoGlobal Energy LLC, an associate company, the following entities:
GGE Chile Holdings and its subsidiary GGE Chile SpA
GeoGlobal U.S. Gabbs LLC
GGE Europe GmbH (previously Erdwarme Oberland GmbH)
Erdwarme Bayern Management GmbH and its subsidiaries Erdwarme Bayern GmbH & Co. KG and Erdwarme Bayern Asset Management GmbH & Co. KG
On 23 May 2011 GeoGlobal Partners 1 Limited Partnership made a further acquisition from GeoGlobal Energy LLC, as follows:
GGE Peru Holdings LLC and its subsidiary GGE Peru S.R.L.
GeoGlobal Partners 1 Limited Partnership acquired 100% of the voting rights of these subsidiaries.
These acquisitions were part of an implementation of an efficient holding, financing and management investment structure for Chilean, German and
Peruvian geothermal exploration and development opportunities which will facilitate third party investment at multiple entry points as required.
Notes to the Financial StatementsFor the year ended 30 June 2011
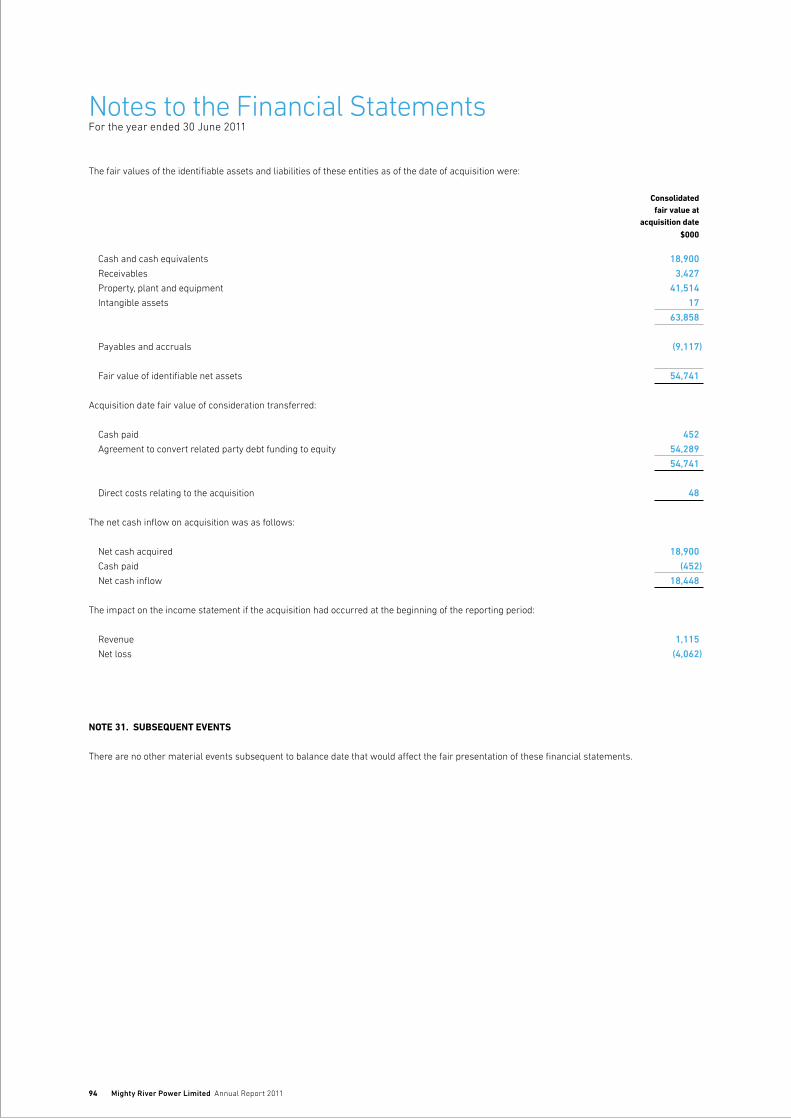
94 Mighty River Power Limited Annual Report 2011
The fair values of the identifiable assets and liabilities of these entities as of the date of acquisition were:
Consolidated fair value at acquisition date
$000
Cash and cash equivalents 18,900
Receivables 3,427
Property, plant and equipment 41,514
Intangible assets 17
63,858
Payables and accruals (9,117)
Fair value of identifiable net assets 54,741
Acquisition date fair value of consideration transferred:
Cash paid 452
Agreement to convert related party debt funding to equity 54,289
54,741
Direct costs relating to the acquisition 48
The net cash inflow on acquisition was as follows:
Net cash acquired 18,900
Cash paid (452)
Net cash inflow 18,448
The impact on the income statement if the acquisition had occurred at the beginning of the reporting period:
Revenue 1,115
Net loss (4,062)
NOTE 31. SUBSEQUENT EVENTS
There are no other material events subsequent to balance date that would affect the fair presentation of these financial statements.
Notes to the Financial StatementsFor the year ended 30 June 2011

Mighty River Power Limited Annual Report 2011 95
Five Year Financial ReviewFor the year ended 30 June 2011
NZ IFRS NZ IFRS NZ IFRS NZ IFRS NZ IFRS 2011 2010 2009 2008 2007
Income Statement Total revenue 1,163,881 1,104,575 1,119,891 1,178,553 814,860
EBITDAF 443,053 327,788 447,131 304,639 315,465Depreciation and amortisation (145,404) (98,707) (104,947) (86,525) (84,948)Change in fair value of financial instruments (25,621) 8,081 (47,155) (9,665) (61,056)Net interest (71,786) (30,741) (24,240) (20,860) (26,384)Equity accounted earnings of associate companies 2,069 (11,703) 2,928 2,331 2,999Equity accounted earnings of jointly controlled entities 2,935 (21,992) - - - Impaired assets (19,786) (31,373) (46,940) (28,059) (19,607)Profit before taxation 185,460 141,353 226,777 161,861 126,469Income tax expense (58,387) (56,739) (67,159) (50,910) (29,546)Net profit for the year 127,073 84,614 159,618 110,951 96,923
Cash Flow Statement Operating cash flow 292,826 199,510 317,105 207,422 223,945Investing cash flow (202,394) (296,425) (221,831) (345,300) (170,266)Financing cash flow (68,788) 47,997 (72,500) 84,981 28,903Net increase/(decrease) in cash 21,644 (48,918) 22,774 (52,897) 82,582Opening cash 7,905 56,823 34,049 86,946 4,364Net Foreign Exchange movements (827) - - - - Closing cash 28,722 7,905 56,823 34,049 86,946
Performance Indicators Return on average shareholders’ equity 4.5% 3.2% 6.5% 5.6% 5.8%Total equity/total assets 54.1% 54.9% 59.7% 55.6% 58.5%Net debt/net debt plus equity 24.8% 26.5% 18.3% 21.7% 20.1%FFO/interest expense 4.8x 5.1x 6.7x 5.4x 8.8x Balance Sheet Shareholders’ Equity Share capital 377,561 377,561 377,561 377,561 377,561Reserves 2,528,686 2,311,250 2,244,039 1,880,089 1,332,932Non-controlling interest 295 159 - - - TOTAL SHAREHOLDERS’ EQUITY 2,906,542 2,688,970 2,621,600 2,257,650 1,710,493
Assets Current assets Cash and short-term deposits 28,722 7,905 56,823 34,049 86,946Derivative financial instruments 36,871 35,476 39,333 42,929 22,024Other 222,883 194,861 291,024 314,338 186,608Total current assets 288,476 238,242 387,180 391,316 295,578
Non-current assets Property, plant and equipment 4,749,506 4,307,547 3,859,941 3,498,704 2,527,051Derivative financial instruments 111,687 77,567 19,377 74,113 31,085Other 226,918 271,544 121,566 93,896 70,254Total non-current assets 5,088,111 4,656,658 4,000,884 3,666,713 2,628,390TOTAL ASSETS 5,376,587 4,894,900 4,388,064 4,058,029 2,923,968
Liabilities Current liabilities Loans 12,081 5,950 42,456 67,461 - Derivative financial instruments 164,541 143,155 92,706 90,249 78,984Other 188,902 161,738 219,835 245,190 133,594Total current liabilities 365,524 310,843 354,997 402,900 212,578 Non-current liabilities Loans 973,400 972,808 600,079 591,315 516,883Derivative financial instruments 234,481 132,685 67,464 115,794 7,694Other 896,640 789,594 743,924 690,370 476,320Total non-current liabilities 2,104,521 1,895,087 1,411,467 1,397,479 1,000,897TOTAL LIABILITIES 2,470,045 2,205,930 1,766,464 1,800,379 1,213,475
TOTAL NET ASSETS 2,906,542 2,688,970 2,621,600 2,257,650 1,710,493

96 Mighty River Power Limited Annual Report 2011
ShareholdersThe Minister for State-Owned Enterprises, Hon Tony Ryall, and Minister of Finance, Hon Bill English.
Board of DirectorsJoan Withers, ChairTrevor Janes, Deputy ChairDr Michael Allen Prue Flacks Jon Hartley Parekāwhia McLean Sandy Maier Tania Simpson Keith Smith
Executive Management TeamDr Doug Heffernan Chief Executive
James Munro General Manager Retail & Corporate Affairs
Fraser Whineray General Manager Operations
Mark Trigg General Manager Development
Bridget O’Shannessey General Manager Human Resources
William Meek Chief Financial Officer
Neil Williams Vice President Strategy Mighty River Power (US) LLC Company SecretaryTony Nagel, General Counsel
Registered OfficeLevel 14, 23-29 Albert Street, Auckland 1010
Credit Rating (as at 30 June 2011)Long-term: BBB+Outlook: Stable
AuditorThe Auditor-General pursuant to section 14 of the Public Audit Act 2001. Brent Penrose of Ernst & Young was appointed to perform the audit on behalf of the Auditor-General.
SolicitorsChapman TrippBell Gully
BankersANZ National BankASB BankKiwibankBank of Tokyo-Mitsubishi UFJBank of New Zealand
Key Office LocationsHead OfficeLevel 14, 23-29 Albert Street, Auckland 1010Phone +64 9 308 8200Fax +64 9 308 [email protected] Hamilton160 Peachgrove Road Hamilton 3216Phone +64 7 857 0199Fax +64 7 857 0192
Rotorua283 Vaughan Road Rotorua 3010Phone +64 7 343 8500Fax +64 7 343 8599
TaupoFirst Floor, 93 Heuheu Street Taupo 3330Phone +64 7 376 1529Fax +64 7 376 1521 Mercury Energy602 Great South Road Auckland 1062Phone +64 9 580 3500Fax +64 9 580 3501www.mercury.co.nz
Bosco Connect Level 2, 27 Bath Street Parnell, Auckland 1052Phone +64 9 302 1500Fax +64 9 309 [email protected]
Tiny Mighty PowerLevel 2, 27 Bath Street Parnell, Auckland 1052Phone 0800 88 66 99www.tinymighty.co.nz MetrixHead Office42 Olive Road, Penrose Auckland 1061Phone +64 9 580 3900Fax +64 9 580 [email protected]
GeoGlobal Energy LLC5471 Wisconsin Ave, Suite 300-A Chevy Chase, Maryland 20815 United StatesPhone +1 240 752 7530Fax +1 240 752 [email protected]
Directory


Mighty River Power Level 14, 23-29 Albert Street Auckland 1010, PO Box 90 399 Auckland, New Zealand PHONE +64 9 308 8200 FAX +64 9 308 8209
www.mightyriver.co.nz
OVERALL ENERGY COMPANY OF THE YEARENERGY PROJECT OF THE YEAR
ENERGY RETAILER OF THE YEAR