midyis - centre for evaluation and monitoring - cem feedback info pack 2014.pdf · midyis is part...
TRANSCRIPT

Feedback Information
Baseline Assessment, Predictions and Monitoring for Secondary Schools
MidYIS

page2
Cont
ents
ContentsAbout MidYIS ............................................................................................................ 2
MidYIS Feedback ..................................................................................................... 3
1. Baseline Feedback ............................................................................................. 4
2. Predictions and Chances Graphs....................................................................... 8
3. Value-added ....................................................................................................... 12
4. Attitudinal Measures ........................................................................................... 18
About MidYISMidYIS is an easy to administer assessment of developed ability with full predictive and value-added measure for KS3, KS4 and INSIGHT.
MidYIS provides powerful information that can be used to monitor pupil progress, set targets, aid inspection, facilitate school improvement and inform the teaching and learning process.
The assessments are available at Years 7, 8 and 9 and are available as either innovative computer adaptive assessments or traditional paper-based tests. MidYIS also assesses more than academic achievement via computer-delivered pupil and parent attitudinal questionnaires.
MidYIS is part of a suite of monitoring systems established by CEM. Part of Durham University, CEM is recognised around the world for its pioneering educational research and school monitoring. It is a trusted supplier of educational assessments delivering over one million tests to pupils each year across almost 70 countries worldwide.
page3
MidYIS Feedback
MidYIS Feedback
All feedback and information is available to download from the secure Secondary+ website. Feedback is presented as Microsoft Excel workbooks, PDF documents and MTF/XML format files (which should easily import into your school management information system).
1. Baseline FeedbackYour pupils’ performance on the MidYIS assessment:
i. Nationally Standardised Scores for each pupil
ii. Band Profile Graphs
iii. Historical Intake Profiles
iv. Individual Pupil Records
v. Additional standardisations for Independent schools
2. Predictions and Chances GraphsPredictions of likely performance in future external examinations:
i. Predicted Grades/Levels for each pupil in each subject
ii. Chances Graphs for each pupil in each subject
iii. Subject-level Chances Graphs
iv. 5+ A* - C Grades at GCSE
3. Value-addedMeasures of pupil, subject and school-level relative progress.
i. Value-added Feedback: Summary Worksheet
ii. Subject Reports
iii. Value-added Summary Graph
iv. Average Standardised Residual Graph
v. Ranked Average Standardised Residual Graph
vi. Measuring Progress Over Time–Statistical Process Control (SPC) Charts
4. Attitudinal MeasuresFor a more rounded picture of your pupils:
i. Comparison graphs showing your pupils’ responses against a background of responses from pupils in other schools covering areas specific to self evaluation, inspection, parental views, and pupils’ arrival in school.
Linking to Other SystemsMidYIS is designed to link to the INSIGHT Curriculum-based Assessments and as such provide measures of value-added from the start of secondary school to these assessments at the end of Year 9.

page4
1. Baseline FeedbackMidYIS assessments provide accurate and robust data. Feedback is delivered promptly: you can expect your first feedback within just 30 minutes from our computer-based assessment and within approximately 2-3 weeks from our paper-based assessment.
i. Standardised Scores for Each Pupil–What these meanMidYIS Assessment results are standardised against a nationally-representative sample of schools. For each pupil there are standardised scores for each of the four sections (Vocabulary, Maths, Non-Verbal and Skills) plus the Overall MidYIS score. The results are standardised to have a mean of 100 and a standard deviation of 15.
MidYIS Test Academic Year Scores Standardised On A Nationally Representative Sample of Schools
Standardised Scores Sort Data By...
Mean Score: 100
Standard Deviation: 15
Vocabulary Maths Non Verbal Skills MidYIS Score
St. S
core
Ban
d
St. S
core
Ban
d
St. S
core
Ban
d
St. S
core
Ban
d
St. S
core
Ban
d
Average 104.4 103.1 103.8 105.3 104.6
St. error 1.2 1.2 1.2 1.2 1.2
Student Surname Forename CEM Id Form Sex CustA0001 APPLE ANDREW 433-1FCB LA M 122 A 105 B 127 A 116 A 120 AA0002 BANANA BERYL 153-9BTT LA F 114 A 124 A 115 A 113 A 121 AA0003 CARROT CLARE 573-1BEO JB F 95 C 103 B 111 B 111 A 105 BA0004 DAMSON DIANA B93-1BE9 LA F 103 B 93 C 103 B 84 D 97 CA0005 FIG FERRIS 4B3-8BC2 DM M 85 D 82 D 81 D 89 D 80 DA0006 GRAPE GAVIN D75-1LV2 JB M 114 A 111 A 129 A 111 A 120 AA0007 HARICOT HANNAH XE7-BD46 DM F 93 C 80 D 81 D 73 D 80 DA0008 JUNIPER JOHN 9TN-BMS2 AV M 126 A 105 B 111 B 114 A 115 AA0009 LIME LAURA KP0-3H43 JB F 124 A 121 A 100 C 134 A 121 A
Why are they useful?These scores allow you to judge how well your pupils have performed on the MidYIS ability test in relation to other pupils and relative to the national average. A pupil scoring at the national average will score 100. Information is available at the pupil, class and cohort level.
Independent schools also receive feedback with scores standardised against the Independent Schools’ sample.
ii. Band Profile Graphs–How these are calculated• The pupils’ scores for each section of the test are given a band A to D (where A is the
highest and D is the lowest).
• The bands are constructed using quartiles, each band containing 25% (a quarter) of the pupils in the nationally representative sample.
• A pupil scoring in band A has scored in the top 25% of the sample.
Seven Band Profile Graphs are included with the Standardised Feedback; Vocabulary, Maths, Non-Verbal, Skills, the Overall score plus Proof Reading and Perceptual Speed and Accuracy.
What these graphs tell usThe graphs show the proportion of pupils falling into each of the four performance bands A–D and allow schools to see how their pupils’ intake abilities compare to a nationally representative sample of pupils.
Base
line
Feed
back

page5
A school with an intake in line with the national sample, in terms of its average ability and range of abilities, would have 25% of pupils in each band.
Vocabulary: Percent in each Band MidYIS Test
38
32
17
13
0
10
20
30
40
50
D C B A
Perc
ent
Why are they useful?Monitoring your intake over a number of years helps you to anticipate future trends in expected performance in external examinations and also gives you a measure of the level of ability your pupils have, as a year group.
To facilitate monitoring any trend in your intake and to help you to track changes in your pupils’ abilities over time, two Historical Intake Profile charts are available.
Historical BoxplotsThis chart shows the distribution of your pupils’ MidYIS scores for the current academic year and preceding years. Boxplots are a very useful statistical tool. They show the median ability within the school, range of abilities, and illustrate any outliers.
Baseline Feedback

page6
Why is it useful?Useful at inspection time, this chart illustrates the range of ability in your current cohort alongside the same information for previous years. An alternative format is the Historical Band Profile Chart: which shows the proportion of your pupils falling into each of the four performance bands (A, B, C and D) for the current year and preceding years.
iii. Individual Pupil Records (IPRs)Individual Pupil Records display, for each pupil, a personalised sheet summarising all the MidYIS baseline information for that pupil.
What the IPR tells usFor each of Vocabulary, Maths, Non Verbal, Skills and the Overall score:
• The MidYIS band (A to D) into which the pupil’s performance falls.
• The stanine (one of nine divisions, with 9 being highest) into which the pupil’s performance falls.
• The percentile, i.e. the percentage of the sample that this pupil performed better than.
• The pupil’s nationally standardised score in each subject, together with the 95% confidence interval for each score. (There is only a 5% chance that the pupil’s ‘true’ ability score would fall outside this range.)
Base
line
Feed
back
page7
Why is this useful?The graphical representation of a pupil’s performance on the MidYIS assessment allows you to quickly and easily identify any areas for concern. Where the confidence bands do not overlap between sections this indicates that the pupil has performed significantly better or worse in that area compared to other areas of the assessment. A significantly low score on a particular section may mean that intervention is needed in order that the pupil achieves his or her full potential. This could also have implications for teaching and learning.
Independent schools also receive Individual Pupil Records with scores standardised against the Independent Schools’ sample.
For more information on how to interpret IPRs, please visit www.cem.org/midyisiprbooklet.
Baseline Feedback

page8
2. Predictions and Chances GraphsTo help you to analyse likely performance in future external examinations, this interactive software displays predicted grades/levels and chances graphs for each pupil in each subject at:
• Key Stage 3 (core and non-core)
• INSIGHT Curriculum-based assessments from CEM
• (I)GCSE (full, short and vocational courses)
This feedback is also available to independent schools based on the relationships between MidYIS and (I)GCSE for independent schools.
i. Predicted Grades/Levels for each pupil in each subject
What this showsPredictions for each pupil in each subject at KS3 and (I)GCSE can be displayed as point scores or as grades/levels and can be adjusted to reflect:
– your school’s prior value-added performance
– top quartile of schools’ (75th percentile) predictions
– bespoke teacher adjustments
Why is this useful?Predicted grades can be used to aid the target setting process and can be analysed at the pupil, form, subject and cohort level. They also can be used to monitor a pupil’s progress against the average progress made by pupils of similar ability and to highlight where intervention may be needed.
The adjustment facilities offered allow you to tailor your predictions to your particular school and circumstances. The prior value-added option will adjust the predictions and chances graphs to be more in keeping with your school’s past achievements. The teacher adjustment facility allows you to add a bespoke amount to each subject’s predictions, e.g. to add an element of challenge.
Pred
ictio
ns a
nd C
hanc
es G
raph
s

page9
ii. Pupil Level Chances Graphs
What these graphs showThese example graphs show the pupil’s probability of achieving various grades/levels in different subjects. Chances Graphs are available for Key Stage 3 and (I)GCSE and are based on your pupil’s individual MidYIS assessment score, not just the band that the score falls into.
A Pupil Level Chances Graph for GCSE French:
Summary Chances Graphs showing (I)GCSE subjects for one pupil:
Why is this useful?Chances Graphs are an excellent way of working with pupils to show what range of grades/levels they are likely to achieve in external examinations. They can be used to:
• Warn more able pupils against complacency
• Encourage less able pupils to work hard and stay focused
• Show that a predicted grade/level is not a foregone conclusion. Pupils of a given ability ultimately achieve a range of grades/levels
• Help parents understand the realistic likely achievements of their child
• Illustrate different chances of success in different subjects
• Aid option choices
Predictions and Chances Graphs

page10
iii. Subject-level Chances GraphsThese graphs summarise likely overall performance in each subject and can aid subject and departmental target setting.
iv. Percentage 5+ A*–C grades at (I)GCSEThis feedback provides an indication of how your pupils and school are expected to perform against various external performance indicators, as follows.
• 5 or more A*–C grades at (I)GCSE
• 5 or more A*–C grades at (I)GCSE including English and Maths
• 2 A*–C passes in (I)GCSE Science subjects
• 1 A*–C pass in a (I)GCSE Modern Language
This feedback includes the following information:
• Pupil probability worksheets. These worksheets show your pupils’ probabilities of achieving each of the league table indicators. It also shows the percentages of pupils expected to achieve each measure at a whole school level.
MidYIS Year 7 Test Academic Year:Probabilities based on Regression Analysis
Expected percentages for school:% 5+A*-C, any Subjects = 62%% 5+ A*-C, with English & Maths = 54%% with 2 Science passes = 55%
Pupils' probabilities of success at GCSE:
MidYIS Score Prob 5+A*-C Prob Passing
St. S
core
Band
Any
subj
ects
With
Eng
& M
aths
Two
Scie
nce
One
Mod
ern
Lang
uage
Average 106.2 0.62 0.54 0.55 -
Student Surname Forename Sex CEM-ID Form7001 APPLE ANDREW M JFB-8BWH 7NK 84 D 0.11 0.05 0.09 0.127002 BANANA BERYL F 8DB-8FCH 7CB 103 B 0.58 0.44 0.47 0.477003 CARROTT CLARE F 09B-1BEQ 7RR 90 C 0.21 0.12 0.17 0.207004 DAMSON DIANE F LMA-1FYV 7CB 112 A 0.81 0.72 0.71 0.697005 FIG FERRIS M KRA-0FEV 7NK 97 C 0.40 0.27 0.32 0.347006 GRAPE GABY F EHB-8BER 7CB 125 A 0.96 0.94 0.92 0.897007 HARICOT HENRIETTA F L7B-9FCH 7CB 108 B 0.72 0.60 0.61 0.607008 JUNIPER JOHN M 4PA-8BEJ 7RR 97 C 0.38 0.24 0.30 0.32
Pred
ictio
ns a
nd C
hanc
es G
raph
s

page11
• School Chances Graphs. These graphs show the chance variation around the expected percentages for your school.
Chance variation in school's % 5+ A*-C with English & Maths (Expected value 54%)
0 01
5
17
30
29
14
3
0 00
5
10
15
20
25
30
35
25-30 30-35 35-40 40-45 45-50 50-55 55-60 60-65 65-70 70-75 75-80
School's Percentage 5+ A*-C
Prob
abili
ty (a
s %
)
Why is this useful?This feedback aims to give schools an idea of their expected performance, but also the element of chance inherent in these indicator figures.
Predictions and Chances Graphs

page12
3. Value-addedMeasures of pupil, subject and school-level relative progress.
What is value-added?Value-added measures the amount of progress made by pupils over a certain period of time, compared against pupils of similar abilities in other schools.
Why is value-added useful?If one school increases the achievement level of its pupils more than other schools, then its pupils gain an additional advantage. This relative advantage is what is called Value-added.
What value-added measures does MidYIS offer?MidYIS provides a comprehensive suite of value-added measures covering progress in lower school and, across the whole school, to the following curriculum-based assessments:
• (I)GCSE
• INSIGHT Curriculum-based assessments from CEM
• Key Stage 3 (as applicable)
Although the achievement measures we display for example purposes may differ, the style of value-added feedback we provide for each external examination is similar and as such the examples shown here are applicable to all external examinations.
i. Value-added Feedback: Summary Worksheet
What this worksheet showsThis sheet provides Value-added information for each pupil in each subject. The example shown here is for (I)GCSE, but is equally applicable to other achievement measures.
For each pupil in each subject we display:
• The pupil’s predicted grade
• The pupil’s achieved grade
• The pupil’s value-added score
• The pupils standardised value-added score (standardised residual)
Plus
• Subject averages and associated standard errors
For GCSE we currently offer analysis for over 50 (I)GCSE, Short Course or Vocational subjects.
Valu
e-ad
ded

page13
Why is this useful?This value-added spreadsheet can be used to identify individual pupil progress measures, cohort or class level averages and can assist the user in further analysis.
ii. Subject ReportsFor each subject, this report displays an informative scatter graph plus a table of pupil level performance information.
Value-added

page14
What these reports showEach Scatter Graph shows the nationally representative regression or ‘trend’ line for that subject with your pupils’ results superimposed. The regression line describes the relationship between the MidYIS score and each subject’s results nationally.
Number of Students: 85
MidYIS Test Score: Standardised overall score on Year 7 MidYIS TestPredicted GCSE Points: Predicted level on the basis of (i) the standardised MidYIS Test score for the student
and (ii) the general pattern of results in this subject this year in the MidYIS Year 7 SampleRaw Residual: Raw Residual = (Actual GCSE Points Score) - (Predicted GCSE Points Score)Standardised Residual: Raw Residual standardised to have a mean of 0 and a standard deviation of 1
Year 7 Pupil Level Residuals to GCSE
Surname ForenameSex
MidYIS Test
Score
Predicted GCSE Points
Actual GCSE Points
Raw Residual
Standardised Residual
APPLE ANDREW M 107 5.0 5.0 0.0 0.0BANANA BOB M 107 5.0 4.0 -1.0 -0.9CARROT CHARLIE M 106 5.0 4.0 -1.0 -0.8DAMSON DIANA F 110 5.2 5.0 -0.2 -0.2FIG FERRIS M 117 5.8 5.0 -0.8 -0.7GRAPE GABY F 101 4.6 4.0 -0.6 -0.5HARICOT HENRIETTA F 81 3.0 4.0 1.0 0.8JUNIPER JOHN M 101 4.5 6.0 1.5 1.2MANGO MARTIN M 81 3.1 3.0 -0.1 0.0
Subject: ENGLISH
Year 7 MidYIS Score Against GCSE English
0.01.02.03.04.05.06.07.08.0
50 60 70 80 90 100 110 120 130 140 150 160 170MidYIS Test Score (Standardised on a Nationally Representative Sample)
GC
SE P
oint
s Sco
re
And the table shows:
• The overall MidYIS Test score
• The expected performance (predicted grade) using the MidYIS Test score
• The pupil’s actual result
• The raw residual or value-added, i.e. the difference between the achieved result and the expected result.
• The pupil’s standardised value-added (residual). This is the raw residual re-scaled to show its position in the whole sample, allowing fair comparison to be made between subjects and over time.
Why is this information useful?The scatter graph provides a visual overview of your pupils’ value-added results. It can help you to unpick what’s happening in a subject. Any subject-level value-added score can hide information about sub-groups. Use the scatter graph to identify areas where groups of pupils are over or under achieving relative to subject averages.
Valu
e-ad
ded

page15
• Pupils plotted above the line have performed better in that particular subject than expected, given their MidYIS Test score. They have made more progress relative to other pupils of similar ability therefore achieving positive Value-added.
• Pupils who fall on the line have performed exactly as we would have expected given their MidYIS Test score, these pupils achieved zero Value-added.
• Those pupils under the line have negative Value-added and have made less progress than those of similar ability.
iii. Value-added Summary Graph
What this graph shows:This graph shows the average value-added performance for each subject in your school i.e. the difference between predicted and actual performance.
MidYIS Year 7 GCSE Value Added Analysis
Average Raw Residuals by Subject
-0.1
-0.8
0.8
-0.1
0.3
-0.5
-0.6
-0.1
0.4
0.3
-0.7
-0.1
1.1
0.3
0.0
-0.3
-0.2
-0.1
-3.0 -2.5 -2.0 -1.5 -1.0 -0.5 0.0 0.5 1.0 1.5 2.0 2.5 3.0
Short Course Physical Education
Voc.Applied Business
Science (Single)
Science (Double)
Religious Studies
Physical Education
Music
Media Studies
Mathematics
History
German
Geography
French
English Literature
English
Drama
Design & Technology
Art & Design
Average Raw Residual
Why is this useful?A positive score means that, on average, pupils in your school did better in that subject than pupils of similar ability in the rest of the MidYIS sample. By the same token, a negative score means that, on average, your pupils did not do as well in that particular subject when compared to pupils of similar ability who took the subject.
iv. Average Standardised Residual Graph
What are Standardised Residuals?Standardised residuals are standardised value-added scores. They are raw residuals (or value-added) rescaled so that all measurements are presented on the same, fair scale. They allow comparisons to be made fairly between subjects and from year to year.
Value-added

page16
Why is this graph useful?This is perhaps the most powerful graph in value-added terms. For each subject it allows you to assess whether there is evidence that pupils are doing better or worse than expected.
The two shades of grey behind the bars represent the confidence limits of the results for different subjects and these allow you to judge whether a subject’s result is statistically-significant or can be attributed to chance. Where a result is statistically-significant and positive this could indicate a department that is doing well. Where a result is statistically-significant and negative this may be a cause for concern.
v. Ranked Average Standardised Residual Graph
What this graph showsThis graph displays the distribution of value-added results in a particular subject (or at an overall school level) for your school and other (anonymised) schools. Your school’s performance is superimposed in pink.
Valu
e-ad
ded
page17
Why is it useful?Typically value-added feedback allows you to compare your school’s performance in a (I)GCSE subject against the average performance in other schools, and to judge whether any conclusions can be drawn from your performance. This value-added tells you about the average performance across other schools. However it does not usually give you any information about how well other individual schools have done.
The ranked average standardised residual feedback supplements the existing value-added feedback by showing the distribution of value-added results in other (anonymised) schools. The aim is that, by showing the value-added results of other schools, you will be able to put your school’s performance into context.
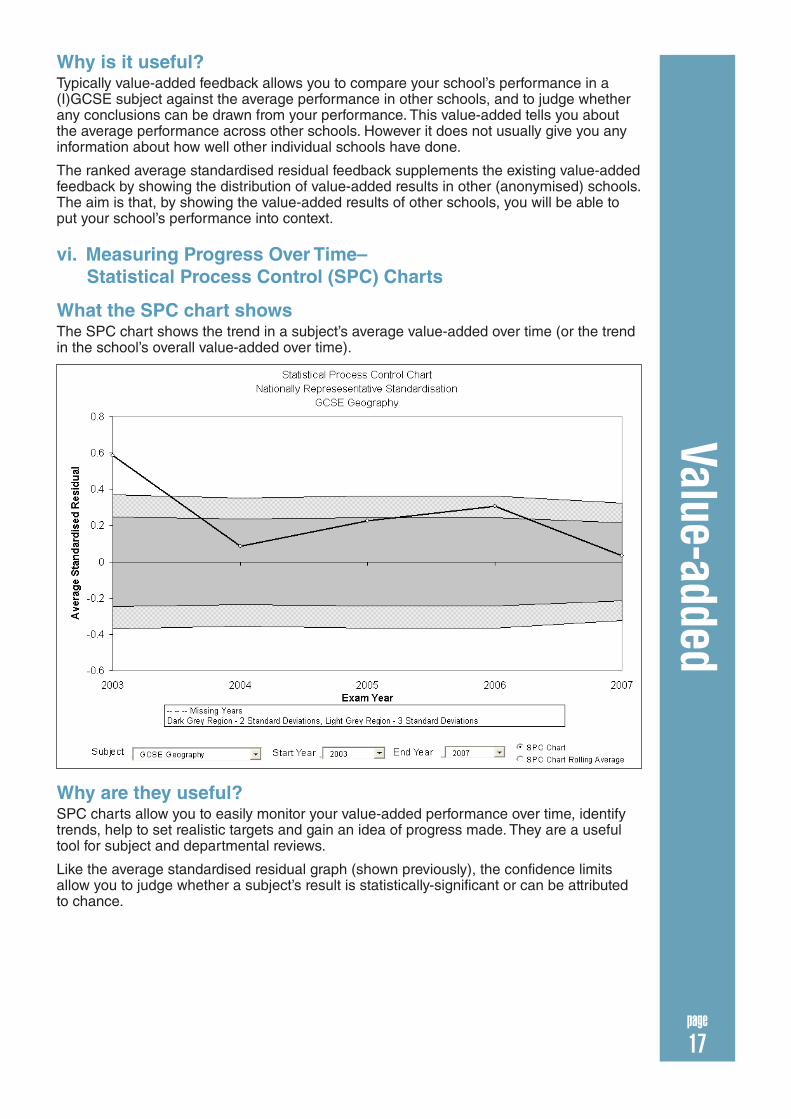
vi. Measuring Progress Over Time– Statistical Process Control (SPC) Charts
What the SPC chart showsThe SPC chart shows the trend in a subject’s average value-added over time (or the trend in the school’s overall value-added over time).
Why are they useful?SPC charts allow you to easily monitor your value-added performance over time, identify trends, help to set realistic targets and gain an idea of progress made. They are a useful tool for subject and departmental reviews.
Like the average standardised residual graph (shown previously), the confidence limits allow you to judge whether a subject’s result is statistically-significant or can be attributed to chance.
Value-added

page18
4. Attitudinal MeasuresThe MidYIS Attitudinal Questionnaire is an online survey of pupils’ views, consisting of a series of questionnaires designed to help contribute to self evaluation and aid the inspection process. The feedback allows you to analyse the attitudes of your pupils in a number of ways and see how your pupils’ attitudes compare against other participating schools.
What Questionnaires are available?The MidYIS Attitudinal Questionnaire is made up of the General (Core) Attitudinal questionnaire and optional Induction questionnaire. A further questionnaire is included in the package to gauge the views of your parents.
General (Core) QuestionnaireThis Questionnaire is taken in Terms 2 or 3; it lasts for approximately 45 minutes and includes attitudes to subjects and topics relevant for self evaluation.
Questionnaire topics include:
Attitude and behaviour towards school
Attitudes to subjects
Healthy lifestyles
Bullying
Racism
Sectarianism
The feedback from the questionnaire is presented in graphical format. These graphs show your pupils’ attitudes against pupil attitudes in other schools. The green background to the chart is the average response from all participating schools. The bars show the average response in your school and the colour of the bar indicates whether your school’s response is significantly different to the figure for all schools. If the bar is white your school’s response is not significantly different, but if it is red then it is.
Below are some examples of the feedback and questions from various sections of the Questionnaire:
About Mathematics
Attit
udin
al M
easu
res

page19
Health and well-being
Bullying
Attitudinal Measures
page20
Induction QuestionnaireThis Questionnaire is designed specifically for your school’s new intake. It is taken in Term 1 and takes approximately 20 minutes.
For example:
On my first day :
I knew what to bring with me.
I found the teachers friendly.
I had difficulty finding my way round the school.
Older pupils were friendly.
If I was worried about something I knew who to ask.
I found adult non-teachers helpful.
I felt welcome.
Parental QuestionnaireThis Questionnaire is to be taken by parents and can (for example), be completed at parents’ evenings. It collects detailed information from the seven areas of the Ofsted letter to Parents. For example: ‘My child is happy that they have chosen this school’ ‘My child talks positively about what goes on in lessons’. This questionnaire can be completed within five to ten minutes.
For example:
My child looks forward to going to school.
My child talks positively about what goes on in lessons.
If my child is worried in school they know who to speak to.
I feel I am well informed about my child’s progress.
Attit
udin
al M
easu
res

page21

For more information visit www.cem.org/midyis
Email: [email protected]
Tel: +44 (0)191 334 4255
www.cem.org