midwestern route identification project - department of … · 1 dresden to lorenzo-i55 (local) il...
TRANSCRIPT

Midwestern Route Identification Project
Sarah K. WochosPolicy Analyst
Council of State Governments - Midwest

Approach
Why Regional?
• States need to know the routes as soon as possible
• Regions develop and use the criteria that is important to them
• States have a better feel for routes that run through their jurisdictions
• States felt that EIS routes were a poor starting point for discussions
• Regional framework has worked well on other issues
Why a Suite of Routes?
• Better variety and thus perhaps better security?
• Flexibility during construction, bad weather or special events
• Inevitable further winnowing through national discussion

Methodology
Primary Factors – from U.S. DOT’s Guidelines for Selecting Preferred Highway Routes for Highway Route Controlled Shipments of Radioactive Materials
Factor 1: Risk to the public during normal transport
Factor 2: Risk to the public in the event of an accident
Factor 3: Risk to the economy/environment in the event of an accident

Methodology
Secondary Factors: Developed by work group
Factor 1: Urban areas traversed (50%)
Factor 2: Accident rates along the route (20%)
Factor 3: Road or track quality (15%)
Factor 4: Traffic density along the route (15%)

Route Generation: TRAGIS
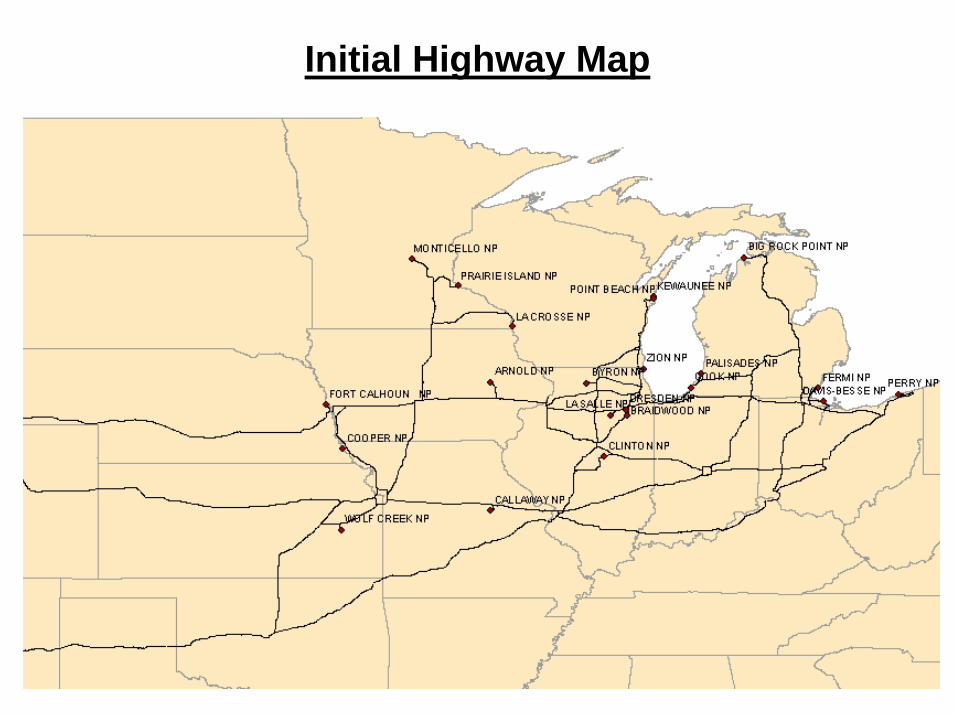
Initial Highway Map

Initial Rail Map

RailHighway
Route Example: Dresden NP

Calculations: Dresden Highway AnalysisRoute Dresden01H Route Description: I80
Segment Segment Description State Factor 1 Factor 2 Factor 3
1 Dresden to Lorenzo-I55 (Local) IL 1.452 0.031 0.000
2 Lorenzo to Joliet-I80 (I55) IL 0.048 154.180 0.102
3 Joliet to IA border (I80) IL 0.514 10.513 0.005
4 IL border to Minden-I680 (I80) IA 0.919 12.581 0.004
5 Minden to NE border (I680) IA 0.087 1.186 0.001
6 IA border to Omaha-I80 (I680) NE 0.063 273.055 0.019
7 Omaha to WY border (I80) NE 1.268 3.101 0.001
Sum (Norm) 4.351 (0.485) 454.646 (0.496) 0.130 (0.326)
Route Dresden02H Route Description: I80, I35, I70
Segment Segment Description State Factor 1 Factor 2 Factor 3
1 Dresden to Lorenzo-I55 (Local) IL 1.452 0.031 0.000
2 Lorenzo to Joliet-I80 (I55) IL 0.048 154.180 0.102
3 Joliet to IA border (I80) IL 0.514 10.513 0.005
4 IL border to Des Moines-I35 (I80) IA 0.558 13.630 0.006
5 Des Moines to MO border (I35) IA 0.295 25.821 0.005
6 IA border to Claycomo-I435 (I35) MO 0.320 10.969 0.006
7 Claycomo to KS border (I435 northern) MO 0.123 20.638 0.052
8 MO border to Kansas City-I70 (I435 northern) KS 0.024 24.510 0.022
9 Kansas City to Topeka-I470 (I70) KS 0.164 41.373 0.023
10 I470 around Topeka (I470) KS 0.054 157.715 0.048
11 Topeka to CO border (I70) KS 1.062 1.738 0.000
Sum (Norm) 4.614 (0.515) 461.119 (0.504) 0.270 (0.674)

Calculations: Dresden Highway AnalysisPrimary factor analysis results
Route (description)Factor 1 Results
(Normalized Score)Factor 2 Results
(Normalized Score)
Factor 3 Results (Normalized Score)
Final Normalized
Score
Dresden 01 (I80) 4.351 (.167) 454.646 (.010) .130 (.013) .19
Dresden 02 (I80, I35, I70) 4.614 (.177) 461.119 (.010) .270 (.027) .21
Dresden 03 (I80, I35, I40) 4.119 (.158) 3852.260 (.083) .760 (.076) .32
Dresden 04 (I55, I70) 4.989 (.191) 11186.297 (.241) 2.776 (.279) .71
Dresden 05 (I55, I70, I35, I40)
4.389 (.168) 13014.789 (.281) 3.090 (.311) .76
Dresden 06 (I55, I44, I40) 3.604 (.138) 17377.470 (.375) 2.920 (.294) .81
Secondary factor analysis results
Route (description)Factor 1 Results
(Normalized Score)
Factor 2 Results
(Normalized Score)
Factor 3 Results
(Normalized Score)
Factor 4 Results
(Normalized Score)
Final Normalized
Score
Dresden 01 (I80) .013 (.501) .019 (.443) 3.714 (.493) 30313.857 (.541)
.49
Dresden 02 (I80, I35, I70) .013 (.499) .024 (.557) 3.618 (.507) 25727.091 (.459)
.51

Highway Map After Initial Analysis

Rail Map After Initial Analysis
Green – BNSF
Red – UP
Purple – NS
Orange - CSX
Blue – CN
Brown – CP
Indigo – KCS
Yellow – TSBY
Black – IHB, BRC, EJE and other short lines

Consultations• Quantitative analysis alone could not determine the final results
• State transportation officials and other state experts have a better feel for the routes that pass through their jurisdictions
– Committee members solicited comments from state DOT personnel orother interested state agencies
– The work group also solicited comments from other affected SRGs
• For rail, operational constraints were not considered in the quantitative analysis
– Work group consulted affected railroad companies (Union Pacific, BNSF, Canadian National, Canadian Pacific, Norfolk Southern and CSX Transportation)
– Railroads commented on the operational viability of the rail routes, interchange points and rail line usage

Final Highway Map

Final Rail Map
Green – BNSF
Red – UP
Purple – NS
Orange - CSX
Blue – CN
Brown – CP
Indigo – KCS
Yellow – TSBY
Black – IHB, BRC, EJE and other short lines

Final Rail and Highway Map
Red – Highway
Blue – Rail

What Do the Results Mean?
• Suite presented as:
– Those that meet regional criteria for ensuring the selection of safe routes
– The region’s suggested starting point for national route selection discussion
– Not “accepted” or “preferred” routes
• Suite does not necessarily reflect the routes that DOE will ultimately use
• Midwest hopes that the suite will be a primary input into the development of the national suite of routes, along with other stakeholder input and operational considerations

Lessons Learned and Conclusions
• The regional route identification process does work
– Regional project was the logical first step – Regional review assures that the factors and conditions most significant to
the Midwest would receive primary consideration
• The DOT guidelines can be adapted to analyze both highway and rail routes
– No federal guidelines for selecting rail routes for hazardous material shipments
– Both the highway and rail routes identified by the process avoid, to the extent possible, high population and accident-prone areas, and stay on the best road and track

• Applying the DOT guidelines is difficult but is a good first step in route analysis
– Data to satisfy the formulas for the DOT guidelines was not readily available
– Data collected from state DOTs, the U.S. Geological Survey, the Federal Highway Administration, and the Federal Railroad Administration, among others
– A central source for route selection data would be ideal, however data collection and adaptation were not so prohibitive as to make theapplication of the guidelines impossible
• Quantitative analysis alone cannot determine the final suite of routes
– Quantitative analysis did a good job of narrowing down the list of potential routes
– Transport carriers’ experience and state officials’ expertise must also be considered
– Data alone cannot determine whether the routes and rail routes in particular, are operationally viable
Lessons Learned and Conclusions (Cont.)

• NAS study suggests DOE identify routes as soon as possible
• The Midwest would like DOE to conduct routing analyses on a regional basis and then combine the four analyses together for discussion.
– Regions could all agree on universal criteria, assumptions and data limitations or develop individual sets. Individual sets of criteria and assumptions increase the likelihood that any routeschosen after analysis meet each region’s specific safety criteria.
– DOE would do any data collection and analysis, but the regions would have to coordinate receiving comments and input from state agencies and committee members.
– Once all analyses are completed, the regions and DOE would make sure all routes are operationally and logistically viable and solicit comments from other interested parties.
– Once the regional maps have been put together, DOE would then solicit public comment, if necessary.
The Future