midterm project report - novia
TRANSCRIPT

Floating Solar Panel Park Midterm Project Report
Floating Ideas Team
Team Members:
Carlos Martin Delgado, Laura Ripoll Albaladejo, Stephan Fischer, Elizabeth Larsen, Amber Kauppila
Novia University of Applied Sciences European Project Semester
March 26, 2019

Abstract This Midterm Report will detail the full work of the Floating Ideas Team throughout the beginning of this semester. The team worked on many things outside of the main project including team building, project management, and ecodesign. The results of these efforts can be found in the following report. They will detail the process taken to form a proper team and also show the project management steps taken to fully detail the project and come up with tools to ensure that the project is done on time, within budget, and covers the full scope intended. In addition to these basics, all the research completed by the team, including research on panel type, placement, solar tracking, mirrors, cooling systems, the floating structure, anchoring methods, rotation, and the connection to the grid, are included. Each section will detail the results of the research and detail the best options for future use. After all the research was done, the team compiled the component options into four workable designs. From here, the team plans to further compile all ideas into one design to test and simulate. In addition, the team also plans to complete a full economic and environmental analysis of this final design.
1
Table of Contents 1. Introduction .………………………………………………………………………………..7
1.1 European Project Semester (EPS) 1.2 The Team
1.2.1 Team Members 1.3 Wärtsilä 1.4 Project Scope
2. Project Management ……………………………………………………………………...9 2.1 Team Building & Intercultural Communication
2.1.1 Team Contract 2.1.2 Onion Model 2.1.3 Tuckman Chart 2.1.4 Belbin Test
2.2 Basic Project Elements 2.3 Mission and Vision 2.4 Objectives 2.5 Work Breakdown Schedule (WBS) 2.6 Project Schedule 2.7 RACI Matrix 2.8 Budgeting 2.9 Conclusion
3. Background Information………………………………………………………………...22 3.1 Overview of How Solar Panels Work 3.2 Solar Cell Performance and Efficiency 3.3 Advantages and Challenges of Solar Energy 3.4 Progress of Floating Solar Park Technology Today 3.5 Floating Solar Park Examples 3.6 Conclusion
4. Research …………………………………………………………………………………..28 4.1 Previous Floating Solar Panel Team, Fall 2018
4.1.1 Summary 4.1.2 Topics in Need of Further Research
4.2 Defined Research Assumptions 4.3 Weather, Wind & Location
4.3.1 Clouds 4.3.2 Precipitation 4.3.3 Wind 4.3.4 Sun
4.4 Types of panels 4.5 Placement 4.6 Solar Tracking 4.7 Mirrors & Concentrators
2

4.8 Cooling Systems 4.8.1 Significance 4.8.2 Cooling System Techniques
4.9 Floating Structures and Materials 4.10 Anchoring 4.11 Rotation 4.12 Connection to the Grid 4.13 Cleaning and Maintenance 4.14 Conclusion
5. Design…………………………………………………………………………………...70 6. Results ………………………………………………………………………………….73 7. Conclusion ……………………………………………………………………………..74 References Appendices Appendix A: Team Contract Appendix B: Large Figures
3
List of Figures Figure 1. Team’s onion model Figure 2. Basic project elements diagram Figure 3. Work Breakdown Structure - Research Track Figure 4. Work Breakdown Structure - Design Track Figure 5. Work Breakdown Structure - Testing Track Figure 6. Example of Trello Board Figure 7. Example of Week’s Plan on Trello Figure 8. Earned Value Analysis for SPI & CPI Figure 9. Diagram illustrating the operation of a PV cell Figure 10. PV cell I-V characteristic curve Figure 11. Cloud Cover in Vaasa, Finland Figure 12. Daylight hours over the course of a year in Vaasa Figure 13. Average daily shortwave solar energy to reach the ground in Vaasa Figure 14. Yearly Solar Irradiation and Energy Output for Europe Figure 15. Electrical specifications of the panel Figure 16. Current-Voltage curves for different temperatures and radiation levels Figure 17. Total fixed panels’ energy production for every month according to simulation Figure 18. Different rotation methods’ energy production for every month according to simulation Figure 19. Connection of solar cells and bypass diodes in a standard solar panel Figure 20. Diagram of position of panels Figure 21. Dimensions of the chosen solar panel Figure 22. Plot showing the relation between distance between panel and sun angle Figure 23. Graph representing the variation of energy density depending on sun angle and slope angle Figure 24. Graph representing the variation of energy density depending on sun angle and slope angle Figure 25. Graph showing energy density for different sun angles with the optimus slope angle Figure 26. Triangular Solar Tracker, spin cell, double solar tracker Figure 27. Types of concentrated solar power solutions Figure 28. Processing of Fresnel lenses Figure 29. Fresnel lens Figure 30. Archimedes V-Trough PV Concentrator Figure 31. Cross-section V-Trough Figure 32. Vega energy WA layers Figure 33. Diagram of a WVC system Figure 34. Visual of high- pressure sprinkler head for solar panel cooling system Figure 35. Visual layout of water sprinkler cooling system Figure 36. Diagram of Photonic Crystal Cooling Material Figure 37. PE-HD floating photovoltaic power plant parts Figure 38. Submerged & floating photovoltaic systems
4

Figure 39. Swimming Solar Park by Statkraft, Albania Figure 40. Chains Crossed Inwards Figure 41. Chains Going Outwards Figure 42. Scheme of the typical connection to the grid of a solar park Figure 43. Connection of different types of inverters Figure 44. Design 1: Rotating circular structures Figure 45. Design 2: Rectangular structure Figure 46. Design3: Square with circular rotating platform Figure 47. Design 4: Triangle shaped inflatable structure
5

List of Tables Table 1. Phases, characteristics and team leader roles of the Tuckman-Chart Table 2. Belbin Test results Table 3. RACI Matrix Table 4. Standard Testing Condition specifications Table 5. Detailed descriptions for each design Table 6. Comparison between fixed and rotating panels Table 7. Raw calculation data for 10 degrees sun angle Table 8. Raw calculation data for 15 degrees sun angle Table 9. Raw calculation data for 20 degrees sun angle Table 10. Raw calculation data for 5 degrees sun angle Table 11. Comparison of raw calculation data for different sun angles and slope angles Table 12. Parameters of 3 different options for placing the panels Table 13. Advantages and disadvantages of a WVC system Table 14. Advantages and disadvantages of a water sprinkler cooling system Table 15. Advantages and disadvantages of a forced water circulation cooling system Table 16. Advantages and disadvantages of forced air circulation system. Table 17. Advantages and disadvantages of transparent cooling coating Table 18. Required characteristics of a floating material Table 19. Options for design
6
1. Introduction 1.1 European Project Semester (EPS) The European Project Semester (EPS) program is offered in eighteen universities throughout Europe and is a one semester project-based learning program designed for engineering students. Throughout the duration of 15 weeks, multinational teams are to work on an assigned project subject. This program allows students to improve their intercultural communication and teamwork skills while being challenged to solve real multidisciplinary problems. For this report, the EPS is hosted at Novia University of Applied Sciences. The Floating Ideas Team has been assigned to the Floating Solar Panel Project to investigate the feasibility of a floating solar panel park in Finland. An introduction to the project, objectives, and more detailed information about the project will be addressed in the report. 1.2 The Team
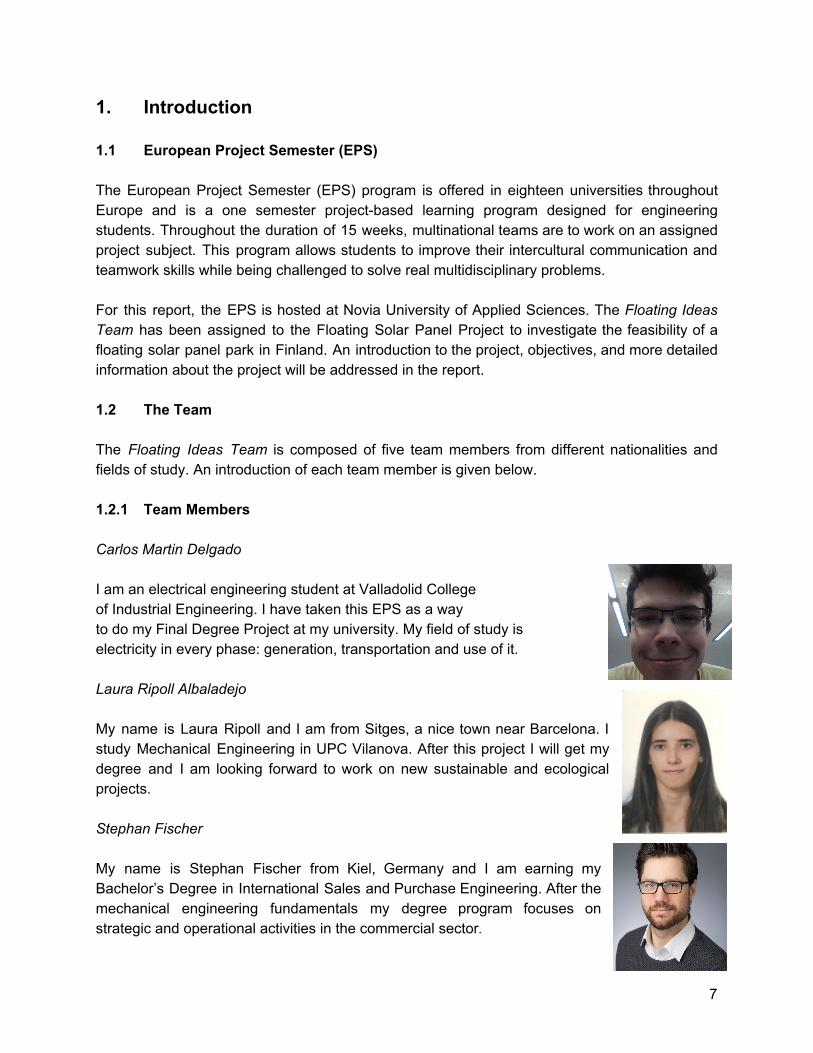
The Floating Ideas Team is composed of five team members from different nationalities and fields of study. An introduction of each team member is given below. 1.2.1 Team Members
Carlos Martin Delgado
I am an electrical engineering student at Valladolid College of Industrial Engineering. I have taken this EPS as a way to do my Final Degree Project at my university. My field of study is electricity in every phase: generation, transportation and use of it. Laura Ripoll Albaladejo
My name is Laura Ripoll and I am from Sitges, a nice town near Barcelona. I study Mechanical Engineering in UPC Vilanova. After this project I will get my degree and I am looking forward to work on new sustainable and ecological projects. Stephan Fischer
My name is Stephan Fischer from Kiel, Germany and I am earning my Bachelor’s Degree in International Sales and Purchase Engineering. After the mechanical engineering fundamentals my degree program focuses on strategic and operational activities in the commercial sector.
7

Elizabeth Larsen
My name is Elizabeth Larsen. I study Civil, Environmental, and Sustainable Engineering. I am originally from Minnesota, but study at South Dakota School of Mines and Technology in Rapid City, South Dakota. I will be earning my Bachelor’s Degree after the completion of this project. Amber Kauppila
My name is Amber Kauppila and I am earning my Bachelor’s Degree in Environmental Engineering. I am from Marquette, Michigan in the United States. Major focuses in my studies include waste to energy technology, sustainability, and remediation. 1.3 Wärtsilä Wärtsilä is a Finnish company that was founded in 1834 with locations in Helsinki, Vaasa, Turku, and other European locations. Wärtsilä is a world leader in smart technologies and product lifecycle solutions for the marine and energy businesses. The goal of Wärtsilä is to sustainably meet the world’s increasing energy demand through maximizing the environmental and economic performance of customers vessels and power plants (Wärtsilä, 2019). The Floating Ideas Team is fortunate to have Sören Hedvik, a current employee of Wärtsilä and sustainability enthusiast, to serve as a contact for the company and to help assist with the Floating Solar Panel Park project. 1.4 Project Scope
Floating solar panels are an emerging technology that is becoming increasingly popular amongst countries that are shifting to renewable energy options. As the material for solar technology is rapidly dropping in price level and developing worldwide, it is becoming possible to engineer the technology to make it feasible for locations with low solar energy potential. Due to the country’s northern location, Finland is currently considered a country with low solar energy potential. However, as a result of Finland’s cooler climate and landscape with over 180,000 lakes, floating solar technology still has the potential to be feasible in Finland.
The purpose of the Floating Solar Panel Park project is to determine, and verify the feasibility of floating solar technology in Finland. The project will design and build a floating solar panel prototype that will be tested in different locations in Vaasa, Finland. The project will estimate the yearly power output and efficiency of the panels in regards to interested parties such as energy companies and other countries with low solar energy potential. These concepts will be further built upon throughout the project through research, simulation, and testing.
8

2. Project Management The following section provides information pertaining to the group work and exercises completed by the Floating Ideas Team as a part of the Project Management course. 2.1 Team Building & Intercultural Communication During the beginning of the semester, the Floating Ideas Team performed various exercises that are explained in detail below. The objective was to build stronger teamwork practices, communication, and time management skills by highlighting challenges and opportunities of different work strategies amongst team members. 2.1.1 Team Contract
Working in a team usually can be difficult, even more when people do not know each other. Before problems appear it’s very important to define working rules and that is what a team contract covers. For this project, the team decided to write a team contract facing all possible situations that can become in all the project phases. The contract specifies how members have to treat each other, timetable rules, compromise, and vision of the project. The team contract can be find at the end of the report as the Appendix A.
2.1.2 Onion Model
There are many ways to visualise the concept of culture, but one of the most popular models is based on an onion. The Onion Model of Culture shows how culture has a number of layers. There are a number of interpretations of this model but the simplest one consists of four key layers.
The outer layers represent cultural artefacts or symbols such as flags, architecture or traditional clothing. The next layer is composed of common rituals and traditions. This could include how people greet each other, eat meals, get married or practise their religion. Heroes make up the next layer, such as Winston Churchill in the UK, and tend to represent many of the culture’s values and beliefs.
In the centre of the onion are the underlying values and cultural assumptions which influence all of the other layers. These beliefs, norms and attitudes are much harder to recognise without a deeper analysis and thorough understanding of each of these layers and how they interact. We have tried to create an onion model representing our team’s new “culture” finding some symbols, rituals, heroes and values we all share.
9

Figure 1. Team’s onion model 2.1.3 Tuckman Chart The Forming-Storming-Norming-Performing model or Tuckman-Chart was developed by Bruce Tuckman in 1965 to describe the phases of team building. Especially for team constellations consisting out of complete strangers and foreigners it normally takes a lot of time to figure out how every personality works and how the individuals fit together. With the Tuckman-Chart the Phases of team building are defined and described in a way which supports building teams in a more efficient way. Especially in order for the team to grow, face up challenges, tackle problems, find solutions, plan work and deliver results the phases are a necessary part of team building. The Phases, Characteristics and Team Leader roles shown in the table below are as follows:
10
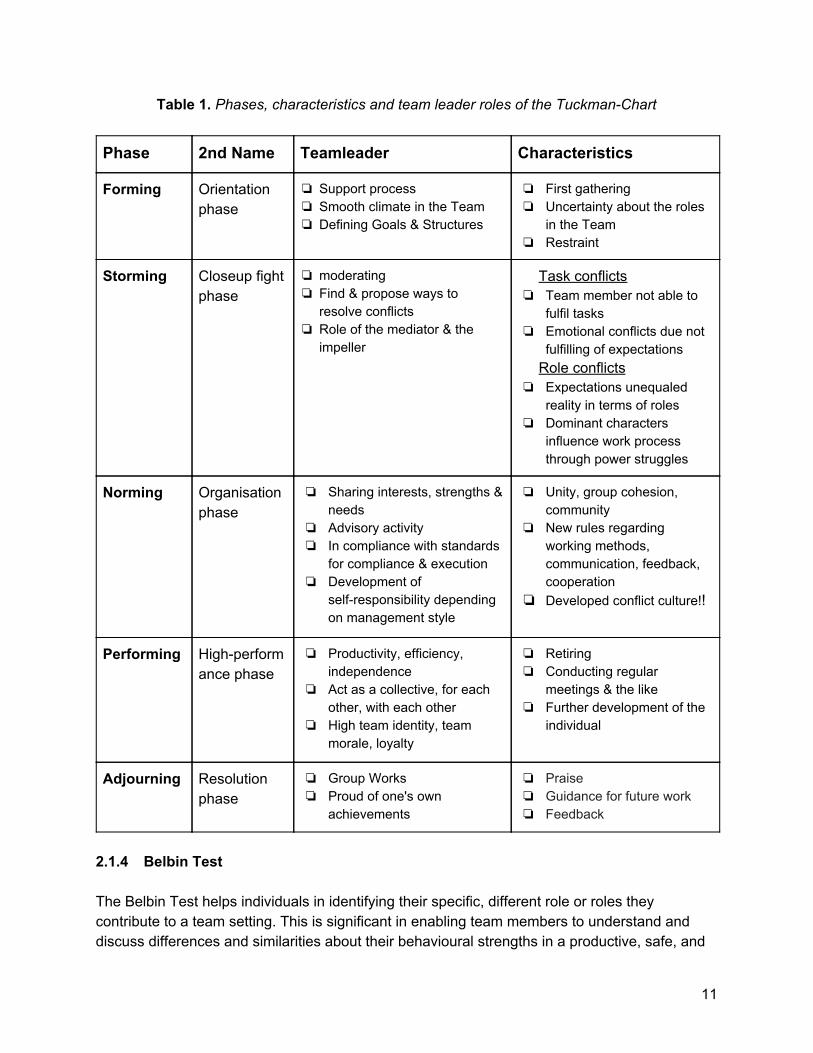
Table 1. Phases, characteristics and team leader roles of the Tuckman-Chart
Phase 2nd Name Teamleader Characteristics
Forming Orientation phase
❏ Support process ❏ Smooth climate in the Team ❏ Defining Goals & Structures
❏ First gathering ❏ Uncertainty about the roles
in the Team ❏ Restraint
Storming Closeup fight phase
❏ moderating ❏ Find & propose ways to
resolve conflicts ❏ Role of the mediator & the
impeller
Task conflicts ❏ Team member not able to
fulfil tasks ❏ Emotional conflicts due not
fulfilling of expectations Role conflicts
❏ Expectations unequaled reality in terms of roles
❏ Dominant characters influence work process through power struggles
Norming Organisation phase
❏ Sharing interests, strengths & needs
❏ Advisory activity ❏ In compliance with standards
for compliance & execution ❏ Development of
self-responsibility depending on management style
❏ Unity, group cohesion, community
❏ New rules regarding working methods, communication, feedback, cooperation
❏ Developed conflict culture!!
Performing High-performance phase
❏ Productivity, efficiency, independence
❏ Act as a collective, for each other, with each other
❏ High team identity, team morale, loyalty
❏ Retiring ❏ Conducting regular
meetings & the like ❏ Further development of the
individual
Adjourning Resolution phase
❏ Group Works ❏ Proud of one's own
achievements
❏ Praise ❏ Guidance for future work ❏ Feedback
2.1.4 Belbin Test The Belbin Test helps individuals in identifying their specific, different role or roles they contribute to a team setting. This is significant in enabling team members to understand and discuss differences and similarities about their behavioural strengths in a productive, safe, and
11
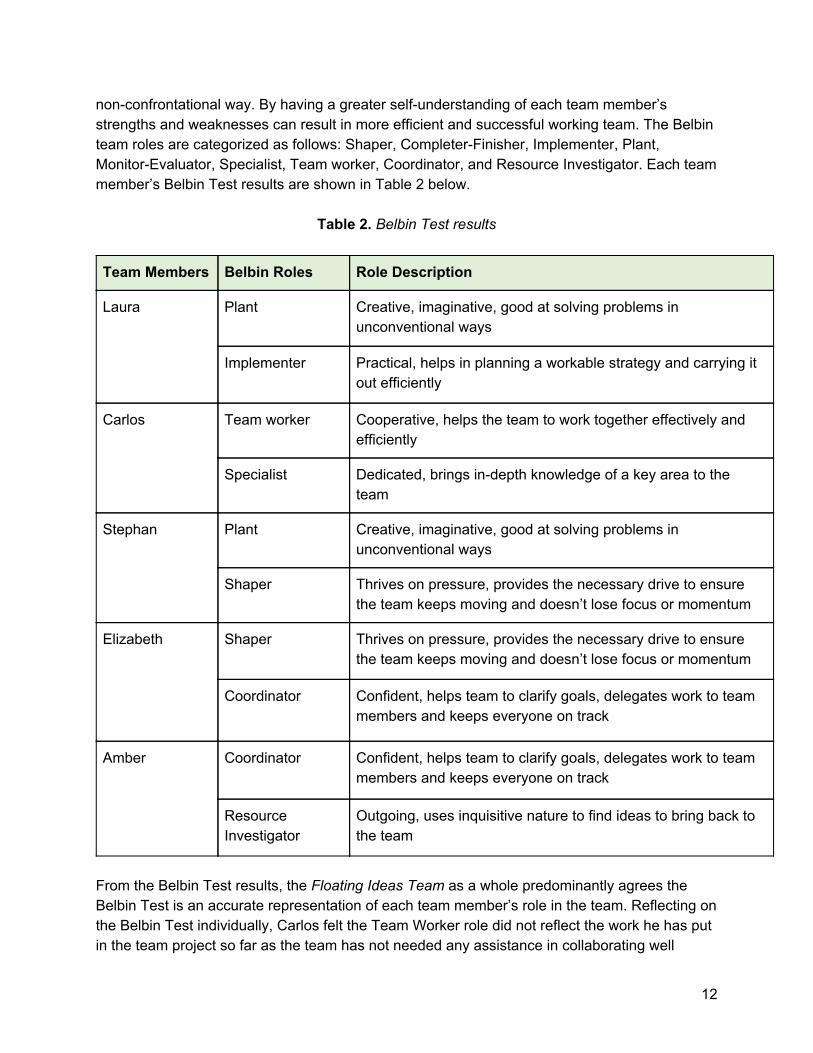
non-confrontational way. By having a greater self-understanding of each team member’s strengths and weaknesses can result in more efficient and successful working team. The Belbin team roles are categorized as follows: Shaper, Completer-Finisher, Implementer, Plant, Monitor-Evaluator, Specialist, Team worker, Coordinator, and Resource Investigator. Each team member’s Belbin Test results are shown in Table 2 below.
Table 2. Belbin Test results
Team Members Belbin Roles Role Description
Laura Plant Creative, imaginative, good at solving problems in unconventional ways
Implementer Practical, helps in planning a workable strategy and carrying it out efficiently
Carlos Team worker Cooperative, helps the team to work together effectively and efficiently
Specialist Dedicated, brings in-depth knowledge of a key area to the team
Stephan Plant Creative, imaginative, good at solving problems in unconventional ways
Shaper Thrives on pressure, provides the necessary drive to ensure the team keeps moving and doesn’t lose focus or momentum
Elizabeth Shaper Thrives on pressure, provides the necessary drive to ensure the team keeps moving and doesn’t lose focus or momentum
Coordinator Confident, helps team to clarify goals, delegates work to team members and keeps everyone on track
Amber Coordinator Confident, helps team to clarify goals, delegates work to team members and keeps everyone on track
Resource Investigator
Outgoing, uses inquisitive nature to find ideas to bring back to the team
From the Belbin Test results, the Floating Ideas Team as a whole predominantly agrees the Belbin Test is an accurate representation of each team member’s role in the team. Reflecting on the Belbin Test individually, Carlos felt the Team Worker role did not reflect the work he has put in the team project so far as the team has not needed any assistance in collaborating well
12

together or resolving conflict between team members. Likewise, Stephan also does not feel the role, Shaper, reflected his performance throughout the project up to this point as the responsibilities of a Shaper haven’t been a significant need to the team for the role.
In addition, the team agrees the Belbin Test is a useful tool in understanding similarities and differences amongst team members as well as the potential challenges the team may face in the future. The team concurs challenges specific to the team that are important to be aware of are effective communication, managing conflicting Belbin roles, maintaining a motivated approach throughout the duration of the project, and taking responsibility for Belbin team roles that have not yet been filled by members of the team. 2.2 Basic Project Elements When given a project, it is imperative to detail the most basic project elements to better understand the tasks at hand and get a good feel for the outside factors pushing this project along. These outside factors generally come in the form of interested parties, the environment it is set in, and the resources that can be utilized for this project. The following figure details the most basic project elements for this design project.
Figure 2. Basic project elements diagram As one can see, the basis task of this project is to design a floating solar panel park that will give back a statistically significant amount of energy to Vaasa, Finland. As mentioned, Wärtsilä is the main interested party, but other parties might be interested once the project is completed. In addition, the environment and resources available correspond with what has been provided
13
by Novia University of Applied Sciences and EPS. With these basic principles in mind, the project can be completed. 2.3 Mission and Vision The mission statement for the project is as follows: “Create an economically, socially, and environmentally feasible floating solar energy source for Northern Europe first concentrated in Vaasa, Finland and then extend it to other locations with
similar latitudes.”
The vision statement for the project is as follows:
“Design a sustainable and economically successful floating solar park technology that is adaptable for areas that are not yet energy efficient in reference to solar energy.”
2.4 Objectives The team’s objectives for the project are listed below.
1. Increased efficiency for solar panel parks in Northern Europe.
2. Solar panel parks are adaptable to account for ice and snow-related efficiency
loss.
3. Increased solar insolation for each solar panel resulting from added solar
insulation.
4. Have adaptable systems for cooling solar panels, if necessary.
5. Reach solar panel’s maximum solar capacity through experimentation.
6. The net economic balance for the solar panel park will equate to zero after 10
years.
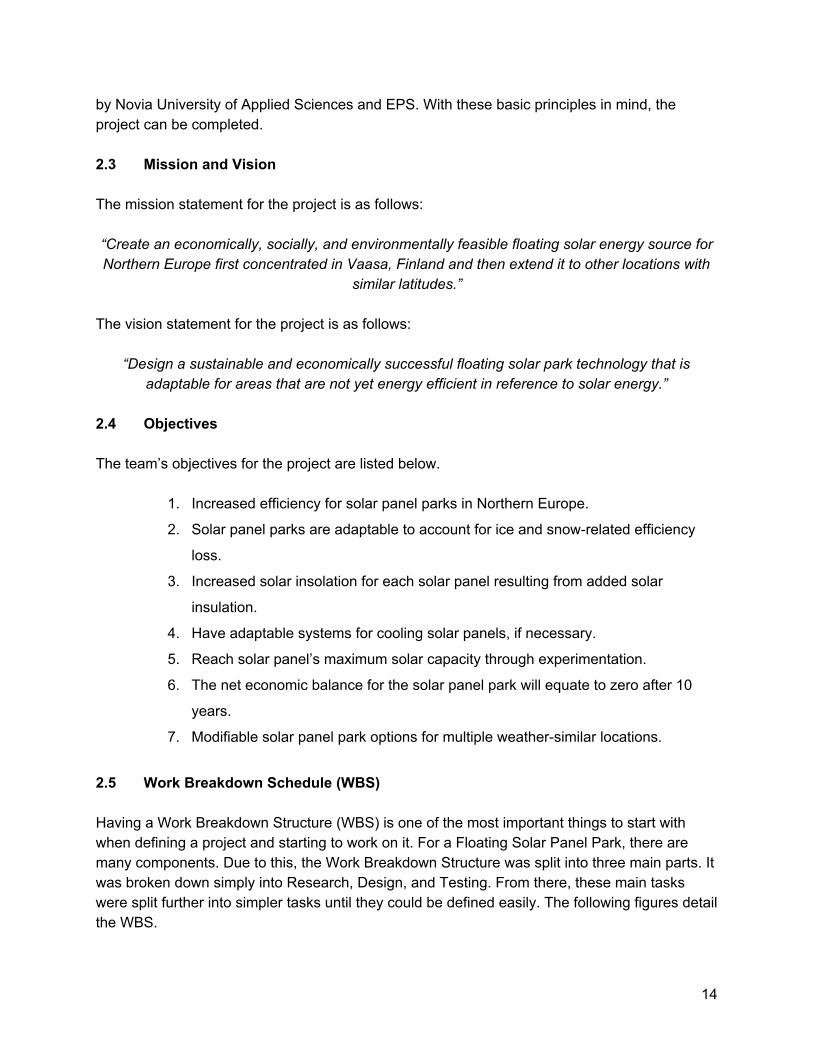
7. Modifiable solar panel park options for multiple weather-similar locations. 2.5 Work Breakdown Schedule (WBS) Having a Work Breakdown Structure (WBS) is one of the most important things to start with when defining a project and starting to work on it. For a Floating Solar Panel Park, there are many components. Due to this, the Work Breakdown Structure was split into three main parts. It was broken down simply into Research, Design, and Testing. From there, these main tasks were split further into simpler tasks until they could be defined easily. The following figures detail the WBS.
14
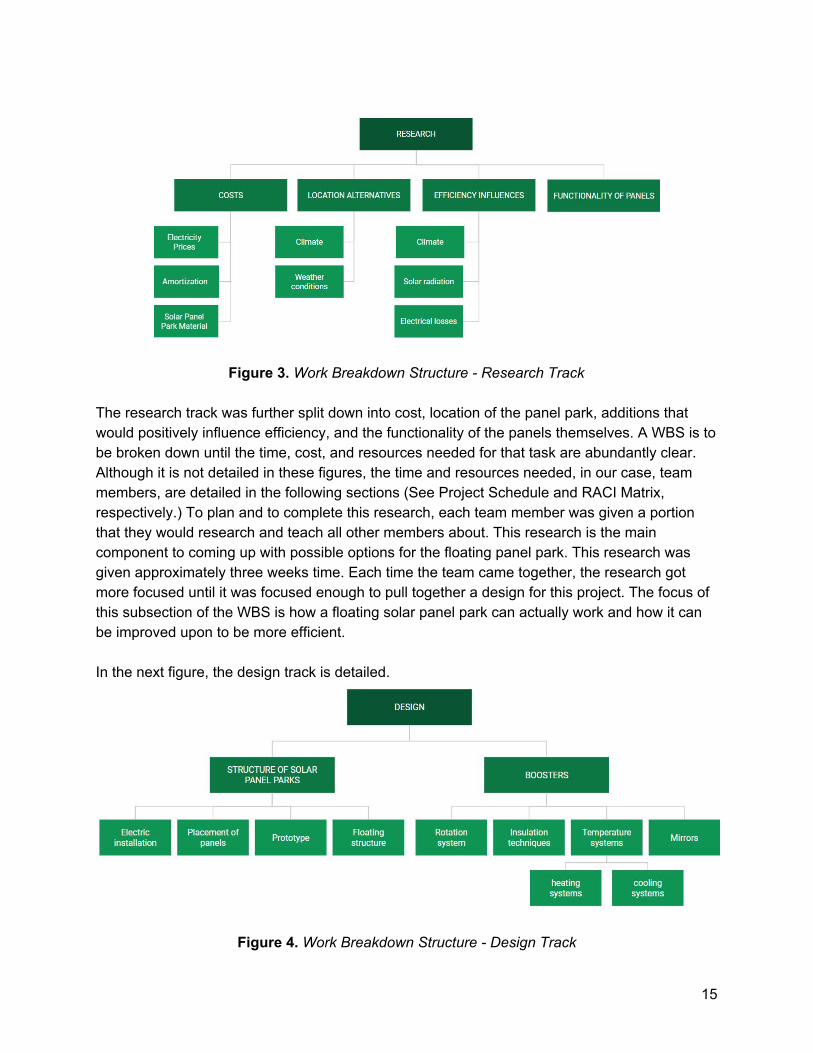
Figure 3. Work Breakdown Structure - Research Track
The research track was further split down into cost, location of the panel park, additions that would positively influence efficiency, and the functionality of the panels themselves. A WBS is to be broken down until the time, cost, and resources needed for that task are abundantly clear. Although it is not detailed in these figures, the time and resources needed, in our case, team members, are detailed in the following sections (See Project Schedule and RACI Matrix, respectively.) To plan and to complete this research, each team member was given a portion that they would research and teach all other members about. This research is the main component to coming up with possible options for the floating panel park. This research was given approximately three weeks time. Each time the team came together, the research got more focused until it was focused enough to pull together a design for this project. The focus of this subsection of the WBS is how a floating solar panel park can actually work and how it can be improved upon to be more efficient. In the next figure, the design track is detailed.
Figure 4. Work Breakdown Structure - Design Track
15
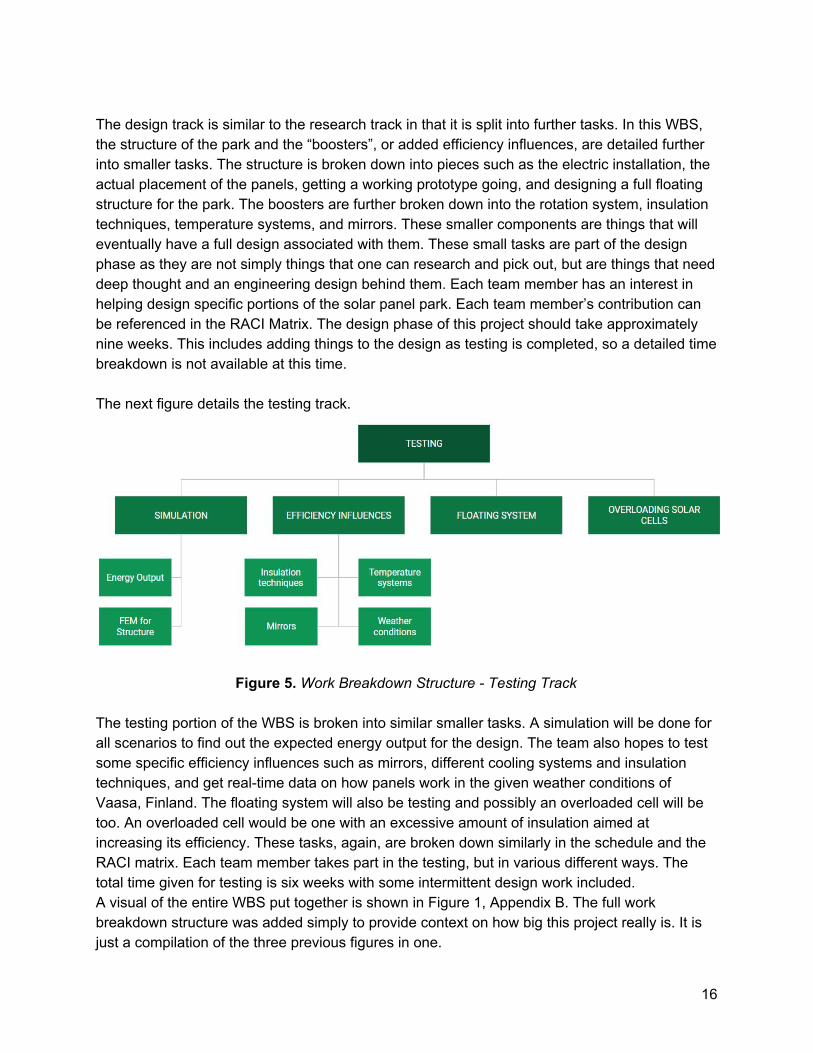
The design track is similar to the research track in that it is split into further tasks. In this WBS, the structure of the park and the “boosters”, or added efficiency influences, are detailed further into smaller tasks. The structure is broken down into pieces such as the electric installation, the actual placement of the panels, getting a working prototype going, and designing a full floating structure for the park. The boosters are further broken down into the rotation system, insulation techniques, temperature systems, and mirrors. These smaller components are things that will eventually have a full design associated with them. These small tasks are part of the design phase as they are not simply things that one can research and pick out, but are things that need deep thought and an engineering design behind them. Each team member has an interest in helping design specific portions of the solar panel park. Each team member’s contribution can be referenced in the RACI Matrix. The design phase of this project should take approximately nine weeks. This includes adding things to the design as testing is completed, so a detailed time breakdown is not available at this time. The next figure details the testing track.
Figure 5. Work Breakdown Structure - Testing Track
The testing portion of the WBS is broken into similar smaller tasks. A simulation will be done for all scenarios to find out the expected energy output for the design. The team also hopes to test some specific efficiency influences such as mirrors, different cooling systems and insulation techniques, and get real-time data on how panels work in the given weather conditions of Vaasa, Finland. The floating system will also be testing and possibly an overloaded cell will be too. An overloaded cell would be one with an excessive amount of insulation aimed at increasing its efficiency. These tasks, again, are broken down similarly in the schedule and the RACI matrix. Each team member takes part in the testing, but in various different ways. The total time given for testing is six weeks with some intermittent design work included. A visual of the entire WBS put together is shown in Figure 1, Appendix B. The full work breakdown structure was added simply to provide context on how big this project really is. It is just a compilation of the three previous figures in one.
16

2.6 Project Schedule The schedule for any project is arguably the most important part of the planning phase to get straightened out and adhere to as quickly as possible. Schedules help to ensure that all project tasks get done on time and to the completion level they need. It is imperative that project managers check back with the schedule regularly to make sure they are staying on track and in the right time frame. The estimated schedule for the full project can be found in Figure 2, Appendix B. The above schedule shows how large one project can be. The colors off to the left side denote the tasks that need to be completed. These tasks are, again, divided into Research, Design, and Testing. However, a fourth task group is added here. This group is Managerial Tasks, which when broken down further includes writing the midterm report, editing the report, making presentations, etc. Each piece of this project is very fluid and depends on the portions before it to run smoothly. The team comes back to this schedule frequently to either adjust the schedule due to various schedule changes from EPS/other courses or to check their progress. The schedule in Figure 10 is updated to 19.3.2019. One can see that the team’s research is on schedule and in some cases ahead of schedule. The other tasks that were scheduled before 19.3.2019 are in the Managerial Tasks section and are not as far along as they should be. This is something that the team has noted and is trying to correct immediately. The managerial tasks, however, are not considered to be on the critical path, meaning some slack in those tasks is okay. The team’s critical path, essentially follows a diagonal line down from left to right. It starts with the research tasks and then goes to the design, then testing, then back to design, then more testing, and so on. The research is necessary to get started on the design and the design is necessary to start testing. After that, additions are added to the design and testing making the critical path jump between the two task sections.
As an additional tool to go on with the schedule and follow weekly all steps the team agreed to use Trello. Trello is a collaboration tool that organizes projects into boards. Is a efficient way to know what is being worked on, who is working on what, and where something is in a process.
17

Figure 6. Example of Trello board
The Solar Panel Team board has been divided in different sections such as project management, project basics, project structure, working packages and deadlines. There are documents, images, task lists and notes inside every section. The most important ones are the working packages, divided into project weeks because, as it is shown in the schedule, tasks are weekly defined. The next image shows an example of week six where the agenda and the meeting notes are attached. The green tab means that all the tasks were done. When the tab is orange it means that is the actual week and the tasks are being done and when the tasks are not completed the tag has to be changed to a red one. The deadline concerns to the weekly meeting with Mikael and Sören and it appears also in the calendar format of Trello. Task lists are shown at the end, start doing, doing and must finish.
18

Figure 7. Example of week’s plan on Trello
Trello board can be updated and modified from all smartphones, that makes it easy to use and it is a good way to be to be up to date and communicated with the rest of the team. 2.7 RACI Matrix Human Resource Management is a large part of Project Management. Because of this, our team developed an RACI Matrix to help divvy up tasks as well as ensure that each task had an owner or someone who would be responsible for checking up on its progress and completion. This matrix also helps make sure that we are not all devoting time to the same task when we can be productively splitting up the work and keeps people not involved in each task informed about what is being done. An RACI Matrix does this by simplifying every person’s role for a given task into four categories. RACI stands for Responsible, Accountable, Consulting, and Informing. These four words detail what each role is for the task.
Responsible - Who is responsible for this activity? This individual is in charge of checking up with others to see what work is being done and to ensure that the task will get done on time. These individuals are also tasked with informing the individuals who are not involved, how everything is going.
19

Accountable - Who is also accountable for this task? These individuals are also working on the given task, but are not in charge of ensuring its completion. These members are completing the tasks alongside the “responsible” individual. Consulting - Who should be we consulting with for this task? These individuals are not doing the actual work on the task but help in the form of giving advice through consultation. These individuals are not needed at every meeting about this task but are asked to help when needed or when a large decision needs to be made. Informing - Who do we need to inform about this task? These individuals are being informed about the progress and completion of these tasks only. They are not working on the project nor being consulted for help. Table 4, below, is the working RACI Matrix for this project team. The tasks from the Work Breakdown Structure are featured to the left in this table. It is color-coded by job type with a key to the right.
Table 3. RACI Matrix
As one can see from the RACI Matrix, every task has one, and in some cases two, responsible parties. This is to ensure that the task gets done and one person can communicate with everyone else about its progress. In most cases, everyone in the team wanted to be involved with every task. Usually, this wouldn’t be the case in design projects elsewhere, but with this
20
being a multicultural and multidisciplinary team, everyone wanted to try to be involved to learn from one another. Additionally, the supervisors for this project were included. The team would like to consult with them regularly, but only inform them about progress for some of the more basic, non-design, tasks.
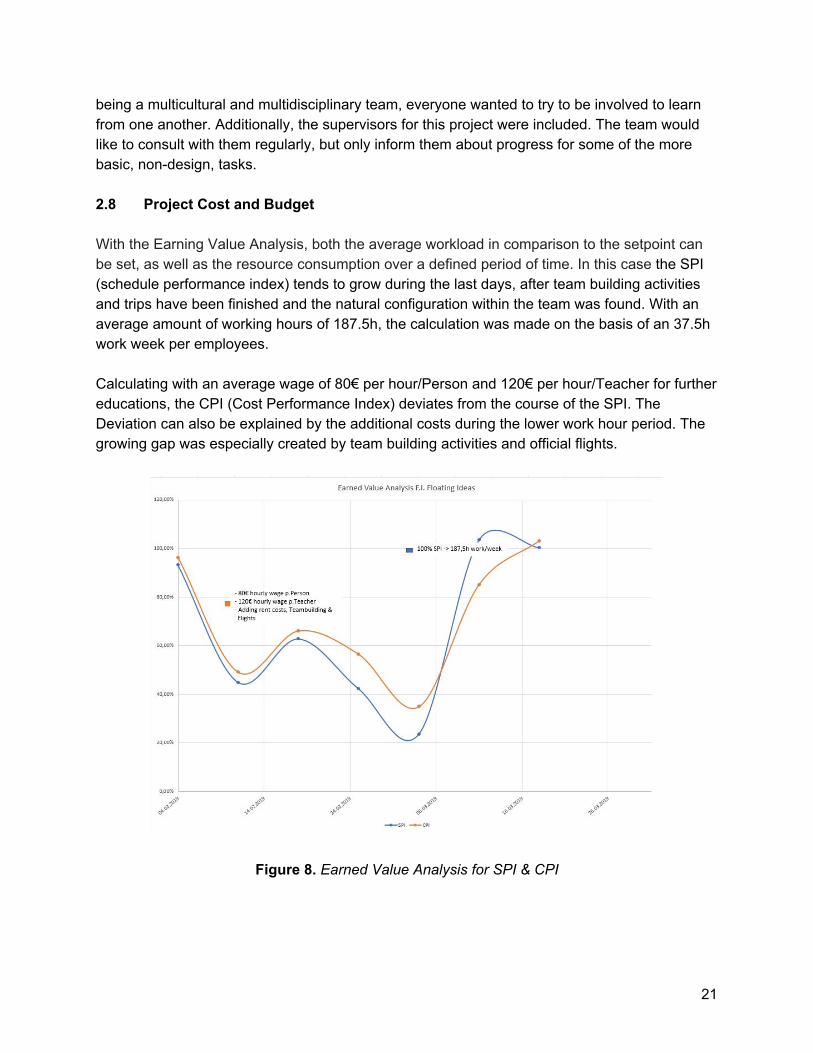
2.8 Project Cost and Budget With the Earning Value Analysis, both the average workload in comparison to the setpoint can be set, as well as the resource consumption over a defined period of time. In this case the SPI (schedule performance index) tends to grow during the last days, after team building activities and trips have been finished and the natural configuration within the team was found. With an average amount of working hours of 187.5h, the calculation was made on the basis of an 37.5h work week per employees. Calculating with an average wage of 80€ per hour/Person and 120€ per hour/Teacher for further educations, the CPI (Cost Performance Index) deviates from the course of the SPI. The Deviation can also be explained by the additional costs during the lower work hour period. The growing gap was especially created by team building activities and official flights.
Figure 8. Earned Value Analysis for SPI & CPI
21
2.9 Conclusion
Throughout the first few weeks of the EPS Project, the team spent time learning about team building and project management. The team learned about Tuckman’s phases of working in a team, Belbin’s team roles, and about each other. The team building course set the stage for the team to recognize who in the group would excel at certain things and what they may struggle with. It also helped prepare them for group work and taught them more about themselves in the process. The team was also able to create a team identity through the use of the Onion Model and other similar activities.
The Project Management course was all about learning about what it takes to actually run and complete a project. Through this course, the team set themselves up for future success, by coming up with clear and concise objectives, breaking down the work into smaller work packages, and creating a schedule that everyone could follow. These tasks have helped the team to stay on track when it comes to scope and time. The final important pillar of a project is cost. This is not easy to estimate as we do not have a large budget, but was estimated to shows just how expensive larger projects can be. Overall, the project management course helped the team to realize where they stood when it came to scope, time, and money. And through doing the exercises they are now able to stay on track throughout the project.
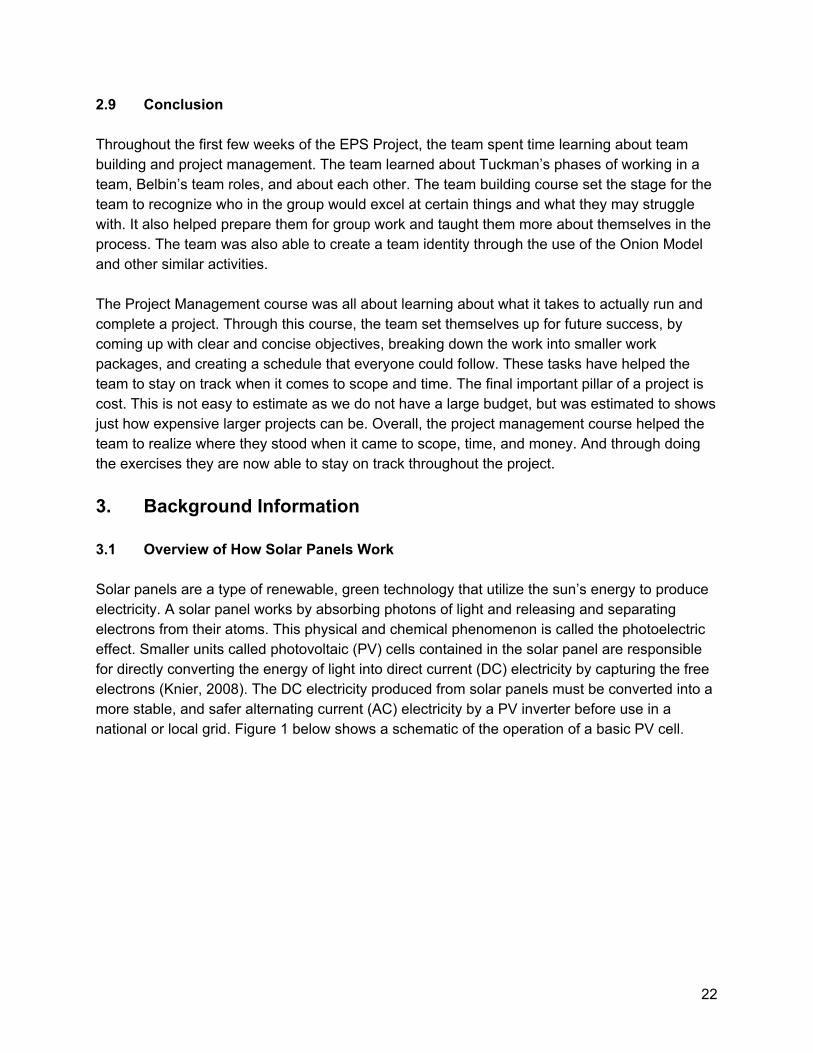
3. Background Information 3.1 Overview of How Solar Panels Work Solar panels are a type of renewable, green technology that utilize the sun’s energy to produce electricity. A solar panel works by absorbing photons of light and releasing and separating electrons from their atoms. This physical and chemical phenomenon is called the photoelectric effect. Smaller units called photovoltaic (PV) cells contained in the solar panel are responsible for directly converting the energy of light into direct current (DC) electricity by capturing the free electrons (Knier, 2008). The DC electricity produced from solar panels must be converted into a more stable, and safer alternating current (AC) electricity by a PV inverter before use in a national or local grid. Figure 1 below shows a schematic of the operation of a basic PV cell.
22
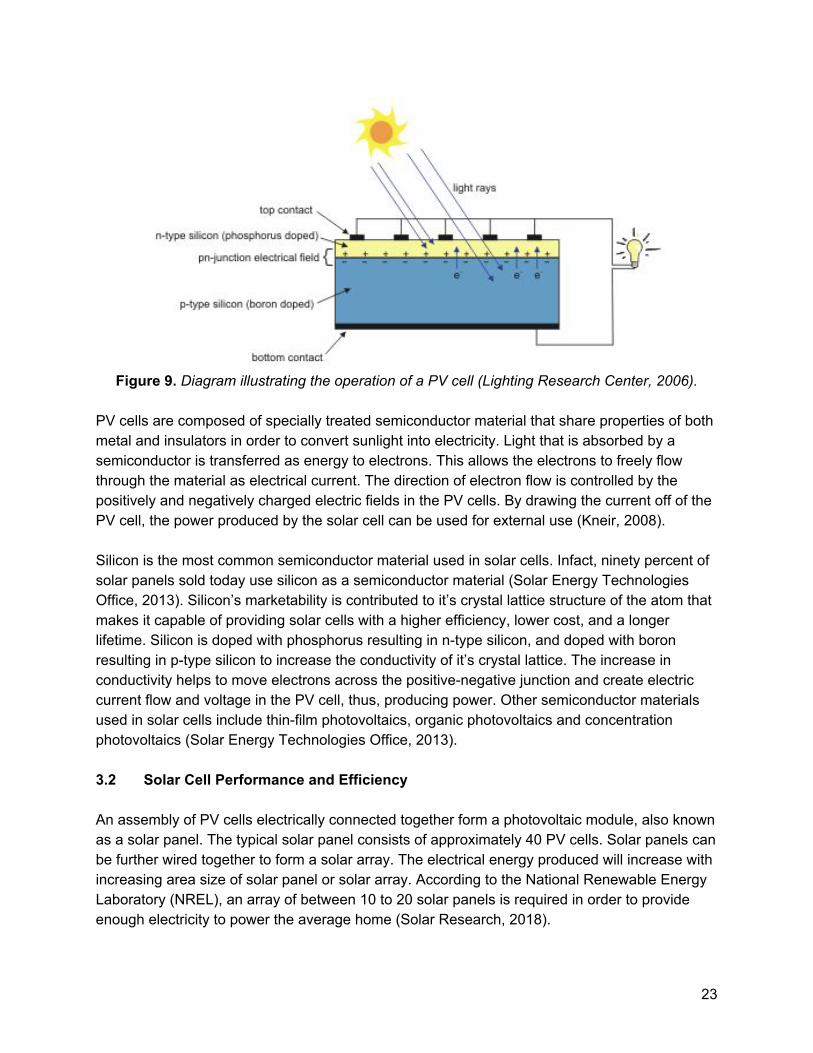
Figure 9. Diagram illustrating the operation of a PV cell (Lighting Research Center, 2006).
PV cells are composed of specially treated semiconductor material that share properties of both metal and insulators in order to convert sunlight into electricity. Light that is absorbed by a semiconductor is transferred as energy to electrons. This allows the electrons to freely flow through the material as electrical current. The direction of electron flow is controlled by the positively and negatively charged electric fields in the PV cells. By drawing the current off of the PV cell, the power produced by the solar cell can be used for external use (Kneir, 2008).
Silicon is the most common semiconductor material used in solar cells. Infact, ninety percent of solar panels sold today use silicon as a semiconductor material (Solar Energy Technologies Office, 2013). Silicon’s marketability is contributed to it’s crystal lattice structure of the atom that makes it capable of providing solar cells with a higher efficiency, lower cost, and a longer lifetime. Silicon is doped with phosphorus resulting in n-type silicon, and doped with boron resulting in p-type silicon to increase the conductivity of it’s crystal lattice. The increase in conductivity helps to move electrons across the positive-negative junction and create electric current flow and voltage in the PV cell, thus, producing power. Other semiconductor materials used in solar cells include thin-film photovoltaics, organic photovoltaics and concentration photovoltaics (Solar Energy Technologies Office, 2013).
3.2 Solar Cell Performance and Efficiency
An assembly of PV cells electrically connected together form a photovoltaic module, also known as a solar panel. The typical solar panel consists of approximately 40 PV cells. Solar panels can be further wired together to form a solar array. The electrical energy produced will increase with increasing area size of solar panel or solar array. According to the National Renewable Energy Laboratory (NREL), an array of between 10 to 20 solar panels is required in order to provide enough electricity to power the average home (Solar Research, 2018).
23
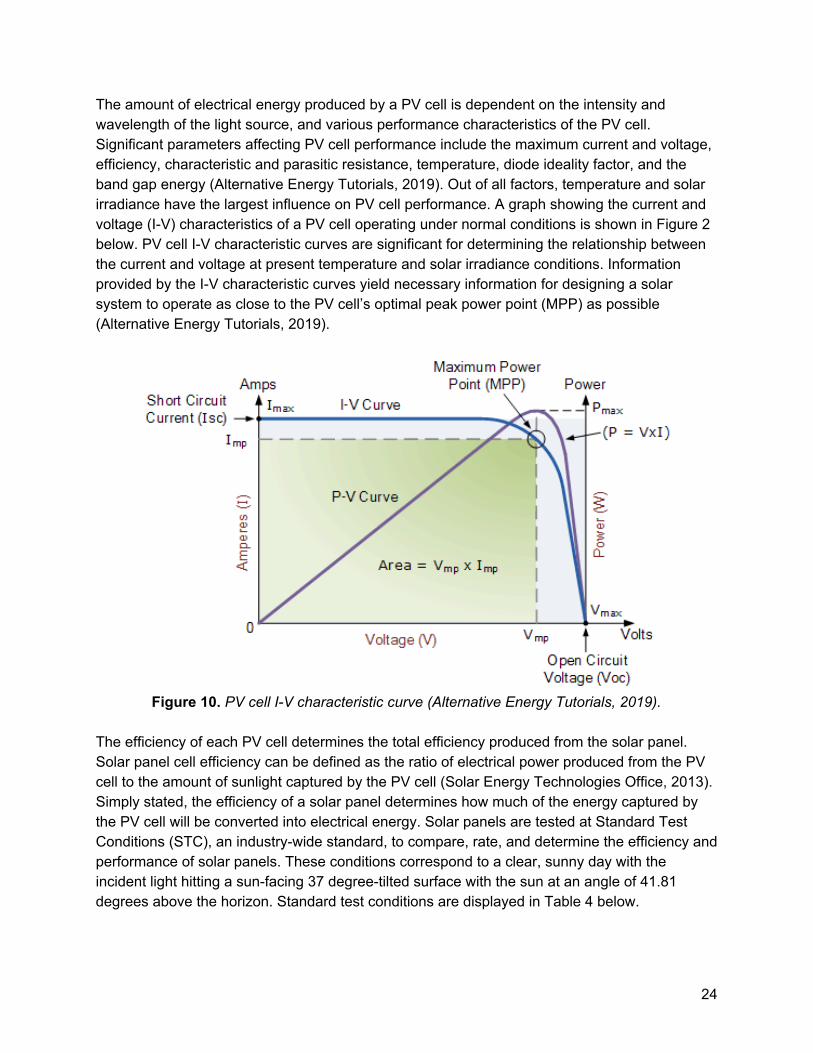
The amount of electrical energy produced by a PV cell is dependent on the intensity and wavelength of the light source, and various performance characteristics of the PV cell. Significant parameters affecting PV cell performance include the maximum current and voltage, efficiency, characteristic and parasitic resistance, temperature, diode ideality factor, and the band gap energy (Alternative Energy Tutorials, 2019). Out of all factors, temperature and solar irradiance have the largest influence on PV cell performance. A graph showing the current and voltage (I-V) characteristics of a PV cell operating under normal conditions is shown in Figure 2 below. PV cell I-V characteristic curves are significant for determining the relationship between the current and voltage at present temperature and solar irradiance conditions. Information provided by the I-V characteristic curves yield necessary information for designing a solar system to operate as close to the PV cell’s optimal peak power point (MPP) as possible (Alternative Energy Tutorials, 2019).
Figure 10. PV cell I-V characteristic curve (Alternative Energy Tutorials, 2019).
The efficiency of each PV cell determines the total efficiency produced from the solar panel. Solar panel cell efficiency can be defined as the ratio of electrical power produced from the PV cell to the amount of sunlight captured by the PV cell (Solar Energy Technologies Office, 2013). Simply stated, the efficiency of a solar panel determines how much of the energy captured by the PV cell will be converted into electrical energy. Solar panels are tested at Standard Test Conditions (STC), an industry-wide standard, to compare, rate, and determine the efficiency and performance of solar panels. These conditions correspond to a clear, sunny day with the incident light hitting a sun-facing 37 degree-tilted surface with the sun at an angle of 41.81 degrees above the horizon. Standard test conditions are displayed in Table 4 below.
24

Table 4. Standard Testing Condition specifications
It is important to note that STC is not a sufficiently accurate standard to stimulate a panel’s real world operation and performance due to major climatic and geographic conditions on Earth. Regularly occurring deviations in lamp spectrum, module and environment temperature, and solar irradiation are examples of sources that cause panel’s of manufacturers to not effectively meet STC, resulting in incorrect output data. Today, the typical efficiency of commercially available PV panels is 7 to 17%, with the most efficient solar panels on market today having efficiency ratings as high as 22.2%. Efficiency values of panels and cells will vary with each manufacturer and panel type.
For this report, the Floating Ideas Team will further elaborate on other weather and performance related conditions of hail impact, wind, snow, and ice load, exposure to humidity, thermal cycling, UV degradation, insulation resistance, and chemical exposure that have the ability to affect solar panel efficiency.
3.3 Advantages and Challenges of Solar Energy
The sun is a powerful energy source that has the ability to meet the global energy demands of Earth for an entire year with only an hour of sunlight. However, solar energy technology by today's standards is only able to utilize 0.001% of the energy given off by the sun (Oni B., 2017). By effectively, and efficiently harnessing the sun’s radiation, solar power has the potential to become an advantageous, renewable, and clean energy source. Increasing demand for solar energy has also considerably improved the technology making investment and installation more realistic for consumers. Nevertheless, there are still a number of associated challenges that make the technology financially impractical and an inadequate power source for meeting current global energy needs. Below you will find an outline of key advantages and challenges faced of solar energy technology.
Advantages
Renewable energy source that will not be exhausted within reasonable usage
Aesthetically pleasing for residential, urban applications (silent, odor-free)
Clean, green energy source that doesn’t pollute the environment directly
Require very little maintenance after installation
25

Primarily safe, no dangers of radioactive waste production or toxin/fume leakage
Reduction in energy costs by electricity or heat production
Land conservation
Improved water quality from reduction in water evaporation and algae growth
Promising technological advancements/improvements in future
Challenges
Uncompetitive high energy source, cannot meet today’s global energy demand
High initial capital costs and long payback period
Irregular energy production due to weather, seasons, and day-night cycle
Technology has a lifetime of 25 years, beyond 25 years the efficiency decreases rapidly
Issue of finding storage for energy generated at peak times
Installation of technology has a large area requirement
Monitoring required to restrict maximum amount of energy generated not be exceeded
Difficult to move solar panels once installed
Obstruction to aquatic habitats, water transportation, and recreational activities
Increased exposure to harsh hydraulic and weather conditions that reduce system lifetime
3.4 Progress of Floating Solar Park Technology Today In today’s society and growing population, 80% of the world’s current energy demand is produced using fossil fuels. Fossil fuels not only pose grave environmental consequences, but are nonrenewable resources that will eventually be exhausted. Thus, the need for, and transition to renewable, green energy sources are becoming more and more dire. Solar power is a type of green energy that is growing fast in recent years as a result of technological advancement, solar PV capacity growth, significant cost reduction in material, and worldwide need for green, renewable energy sources.
26
Floating solar, also known as a floating photovoltaic, is a relatively new solar energy technology that consists of a solar array that floats on top of a body of water. From the design, this technology is able to take advantage of unutilized water spaces and convert them into profitable and eco-friendly energy generating areas. Due to the rapid drop in the price of solar PV modules, and factors of land encroachment and increasing purchasing cost of acquiring land have helped to aid the floating solar industry in becoming a popular alternative to traditional solar methods. According to NREL, floating solar park technology is estimated to save 2.1 million hectares of land saved if solar panels were installed on top of water bodies instead of on the ground (DOE/NREL, 2019).
Although the solar PV industry has been around and developing for over one hundred years, the first floating solar panel systems installation was in 2007. After the Fukushima nuclear disaster that occurred in 2011, Japan was one of the first countries to heavily invest in the floating solar industry as an effort of energy transition. Since then, Japan has experienced enormous benefits that has helped put the country in a better economic and environmental state. From Japan’s success with their floating solar projects, the floating solar market is growing more popular and is being developed worldwide as other countries are following in pursuit (Thi N., 2017). Floating solar has predominantly been installed in China, Japan and the UK, but the technology is expanding to the US, South America, China, South Korea, ASEAN countries, Latin America, and Asia (DOE/NREL, 2019). Floating solar is projected to continue to be adopted by developed countries, and especially amongst island nations with land-scarce regions. In fact, the use of floating solar has grown more than a hundred-fold in less than four years, from a worldwide installed capacity of 10 megawatts at the end of 2014 to 1.1 gigawatts by September 2018 according to the World Bank Group and the Solar Energy Research Institute of Singapore (SERIS) (The World Bank, 2018). The democratization of floating solar takes time, which is why some nations have yet to adopt the technology. However, with greater awareness and increasing need for renewable energy sources, floating solar panels have a bright future and the rapid adoption of floating solar technology can be expected.
3.5 Floating Solar Park Examples
Many countries have been working on floating solar parks the last years. Japan has nearly 50 floating solar facilities of more than 1 MW and plans to install several dozen more.The country’s largest farm (13.7 MW) was opened in March 2018 in Chiba, near Tokyo, where it supplements the output of the hydroelectric dam on the same site. Following the steps of Japan, a pioneer in the field, China is developing floating solar photovoltaic (PV) farms on a gigantic scale, thanks to the variety offered by its landscape. The Huainan farm in Anhui province is now operational, with a capacity of 40 megawatts (MW), and another 150 MW facility is planned for the same region by 2019.
Leading Saudi developer and operator ACWA Power has announced it has won the right to develop the first utility-scale renewable energy project in Al Jouf region in Saudi Arabia, the 300
27

megawatt Skaka IPP PV solar project, at a record-breaking tariff of 2.34 US-cents per kilowatt-hour.
India, home to a huge number of irrigation reservoirs (36,000 in the state of Karnataka alone), has announced an ambitious floating solar program supported by the public authorities. Australia has also started to move into the market.
However, apart from the United Kingdom, which has two of the world's ten largest floating solar farms (the Queen Elizabeth Reservoir near London and the Godley Reservoir near Manchester), European countries such as Belgium, Denmark, Italy and Portugal have so far opted for sites with capacities of less than 1 MW. In France, discussions have been ongoing for several years for an ambitious project in a former aggregates quarry in Piolenc, Vaucluse. If it goes ahead, the floating solar farm should be ready in 2019. In the Alsace region, a small site on a lake in the Strasbourg suburb of Illkirch-Graffenstaden is being finalized for use by the local authorities, but is facing opposition from environmental activists. 3.6 Conclusion Solar panel technology is used all over the world. It is able to help harness a renewable energy, such as the sun, and use it for powering the society we live in today. The technology used is a type of PV cell that converts photons from the sun into electricity that can then be used. This is done by exciting electrons in the p-type silicon layer so that they want to go to the n-type silicon layer. The process by which they go from one layer to the next is where the electricity is made. This technology has been very helpful in providing places across the world with electricity and is something that will continue to help countries reach their sustainability goals. Floating solar parks are just one way to harness this solar energy, but there are many other ways out there. 4. Research To start any project, immense amounts of research need to be done. To complete a project, one must essentially be an expert on what they are writing about and designing. Because of this, a lot of research was done to get to a few final design options. Additionally, this project had been started before. This project was previously done by another EPS team in the Fall of 2018. Because of this, extensive work had to be done to understand the work they had completed and where the team should go next. The following section details the previous teams work as well as the new research done to further this design project. 4.1 Previous Floating Solar Panel Team, Fall 2018
28

4.1.1 Summary The previous project team worked on the same project. They were tasked with designing a floating solar panel park and had similar goals to that of this team. The previous team thought of many different options for a design and in the end, recommended some best options, but concluded that a floating solar panel park like this would not be feasible for a location like Vaasa, Finland.
The previous team considered many different efficiency boosters such as cooling techniques (plunging cooling systems and trickling water), solar tracking (tilting the panel to an optimum angle), and mirrors (flat mirrors and parabolic ones). For their designs they considered rotation, anchoring, the structure holding the panels, an antifreeze system, solar tracking, and cleaning. They came up with six designs in total. Each design had a cost associated with it. The table below details the basics of each design.
Table 5. Detailed descriptions for each design
Design Basics Cost (Euro)
Floating Platform Hexagonal support structure with circular one on the inside that rotates above water. Small holes in the outside tubing to pump water through.
2,179,167
Off-Board Engine Same structure as above, but the rotation is done with an off-board engine.
2,179.167
Cylindrical Shape Bendable panels are placed on the cylindrical inner tube. Weights on the inside move to cause rotation of the whole structure.
1,791,445
Adapted Cylindrical Shape
Same inner tube as above, but the panels are placed on top of the inner tube on poles. Same rotation as above.
1,557,675
Biflotant Design A structure is made of one large inflatable tube and the other side is a bunch of small inflatable tubes. The panel rests on top of an A-frame shape and can be tilted by adding or taking away air from the small inflatable tubes on the one side.
1,773,084
The Pole A pole holds up a large array of panels. This pole is set in the ground. This design does not float.
720,360
29

These designs were all compared. The least expensive option, The Pole, was deemed to be the best since it had the lowest cost to energy output ratio.
In addition to the design, the previous team also did some small experiments that determined that for solar panels to work clouds should preferably be nowhere in sight and tilting the panels helps increase efficiency. Overall, the testing was very short and they couldn’t conclude much.
With this work and these designs already in mind, the team had to come up with how they would like to add to the knowledge already created on this project. The following section details the information that the team would like to expand upon or add to the previous work. 4.1.2 Topics in Need of Further Research
1. Types of solar panels: a little deeper research is needed. 2. Cooling: the methods proposed in the previous report did not seem to work, so
new methods should be studied. Moreover cooling systems may not be necessary in such a cold climate.
3. Solar tracking: the simulations done were not very realistic. New simulations must be done and the best way to rotate must be determined.
4. Mirrors: new ways of concentrating the light should be researched and it must be tested how the temperature increase caused by the mirrors affects performance.
5. Shadows: they may be an important cause of energy losses. This must be studied.
6. Electrical grid connection: the decisions are not justified. A further study about different types of inverters should be done.
7. Floating Structures and Materials: there is not research about this in the previous report.
8. Designs: new designs should be developed. The cost estimations in the previous report were not very realistic. Better estimations must be done.
4.2 Defined Research Assumptions To start this design and research process, some things had to be decided upon and assumed so that everyone on the team was on the same page. These decisions and assumptions are the following.
1. We are focusing on lakes, not the sea. This removes the salt water component and makes designing the structure easier due to less corrosion possibility.
2. Cold weather climates (with Ice and Snow) should be expected. The scope of this project lies in locations in Northern Europe with cold climates.
3. Vaasa, Finland is the first focus and then it can be determined later if another location would be able to also be apt to host a floating solar park of this design.
30

4. The location should be near a populated area (for maintenance) and the electricity is going back to the grid. The size of this park is also being assumed to be 1 MW.
5. A silicone monocrystalline panel will be used for this design. Assuming this helps with simulations and energy output calculations.
4.3 Weather, Wind & Location Vaasa, Finland is located on the West Coast of Finland right on the Bothnian Bay. With the sea being so close, Vaasa, Finland is a more temperate place in the summer, while being very cold in the winter. Over the course of the year, the temperature ranges from -10 C to 20 C (Average Weather…). This means that for most of the year the weather isn’t that warm. In addition to the temperature, Vaasa, Finland is also very cloudy and has a lot of precipitation. 4.3.1 Clouds Vaasa, Finland’s weather can be described as cloudy/overcast or slightly less cloudy for most of the year. In the figure below, one can see that even on the clearest days, it is still cloudy 46% of the time. With the weather bouncing between 46% cloudy and 76% cloudy, it makes it difficult to recommend using solar panels in this location. However, the sun does shine in the summer and for long periods of time at that. The sun’s availability will be described later.
Figure 11. Cloud Cover in Vaasa, Finland
The cloud cover is generally worse from October until April making it slightly more difficult to produce energy during this time. Because of this, it might not be worth it to collect energy during this period of time.
31

4.3.2 Precipitation
Precipitation takes the form of both rain and snow. Rain alone is very common for 9.7 months out of the year (Average Weather…). This means that the weather will generally be overcast for this portion of the day as well. The rain could act as a cleaning method for the panels, but is generally not that helpful when it comes to collecting energy.
There are also parts of the year that commonly have mixed snow and rain and then further, parts of the year are completely snowy. The snow is common for 6 months out of the year, October to April (Average Weather…). This again, might mean that neglecting the panels in between October and April might be the best option. Snow can be hard to remove from panels and would require added effort and cost when designing the solar park. 4.3.3 Wind According to WeatherSpark.com, the wind in Vaasa, Finland blows from the South for almost 11 months out of the year, with the wind coming from the North for the last month of the year (Average Weather…). This means that the wind will most likely come at the panel park and hit it straight on possibly creating a large wind sail that could affect the placement of the solar panel park. Since the panel park is going to rotate from side to side, this might not be as large of a problem as once thought. More research will need to be done to rule this out as a possible issue. During the windier part of the year, September 15th to March 28th, the average wind speeds are more than 12.7 km/h (Average Weather…). This type of wind does not pose a threat to the panels themselves, but when the panels are put into a large formation could cause a wind sail effect and want to move more due to the wind. This time, however, is when the temperature starts to get cold and there would be a high likelihood that while the wind might be blowing faster, this park will soon be frozen in the ice where it doesn’t matter anymore. Again, more research will need to be done to determine when the lakes will freeze over and what that will mean in terms of wind resistance. The wind can also be directed and used for cooling, if designed correctly. More about this will be talked about later.
4.3.4 Sun
With Vaasa being so far in the north, the day lengths range dramatically throughout the year. In Figure 14, one can see that the longest days are in the summer and the shortest days correlate with winter. This figure also accounts for daylight savings time.
32

Figure 12. Daylight Hours over the Course of a Year in Vaasa
The portion of the graph with the yellow shading represents the times where the solar panels would be most active and could collect the most sunlight. This equates to about 20 hours, 23 minutes of sun on the longest day of the year, June 21st (Average Weather…). This also means that only about 4 hours, 40 minutes of sun are available on and near the shortest day of the year, December 22nd (Average Weather...).
With all of this in mind, WeatherSpark.com also detailed the best times in the year for daily incident shortwave solar energy. They took into account seasonal variations in length of day, elevation of the sun, and absorptions by clouds when calculating these values. The following figure shows the average daily shortwave solar energy reaching the ground for all parts of the year.
33

Figure 13. Average Daily Shortwave Solar Energy to Reach the Ground in Vaasa
As one can see, the brightest period of the year lasts about 3 months, from May 8th to August 7th (Average Weather…). It will be imperative that the solar panels are functioning properly in this time period as the most amount of solar energy can be gained then. Additionally, it seems that adequate amounts of solar energy reach the ground in between March 1st and October 10th. This means that making sure the panels are active during this time is also important when trying to get as much energy out of them as one can.
With all this information about the weather, it can be concluded that putting in the extra effort to clean the panels in the winter would be useless. The sun does not shine enough in the winter to warrant the extra task of cleaning off the snow. The best time to get energy from the sun is from March until October and that is when the conditions are the clearest as well as has the least amount of snow. This means that during the winter, if the panels are covered in snow, that is okay. However, in the summer months, it will be imperative that they are working to their best ability. 4.3.5 Additional Locations For this project, Vaasa, Finland is going to be the main focus for research and design purposes. Solar panel park technology, however, it viable in many locations across Europe and the across the world. Vaasa, Finland was originally chosen for this kind of technology because it doesn’t have a lot of other renewable energy sources available to it. Other countries nearby have started wind farms and have gotten renewable energy from the wind, but this is less viable in Vaasa and takes up a lot of land. According to the figure below, near Vaasa, Finland, the solar electricity is estimated to be about 850 kWh/kWp. This is a little bit on the lower scale and that is
34
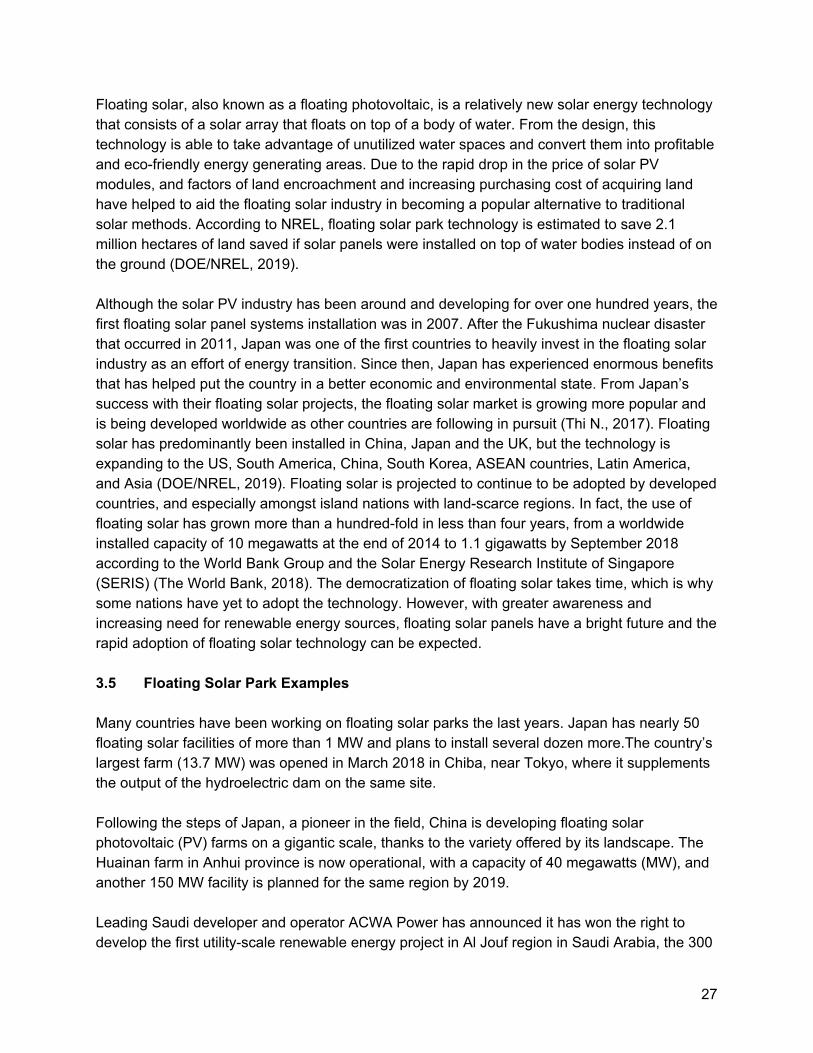
why making sure that the final design is as efficient and as well-equipped to collect solar radiation as possible, is a must before integrating this into Finnish bodies of water.
Figure 14. Yearly Solar Irradiation and Energy Output for Europe (Photovoltaic Solar Electricity Potential in European Countries)
Vaasa, Finland does not have the highest potential for solar energy, but does provide a sufficient amount of energy if given the right circumstances. With that being said, other locations in northern Europe are also viable options for a solar panel park. Locations in Sweden, Norway, The Netherlands, Denmark, and the United Kingdom, etc. would all have similar potential to Finland and would be good locations for a solar park such as this one.
35
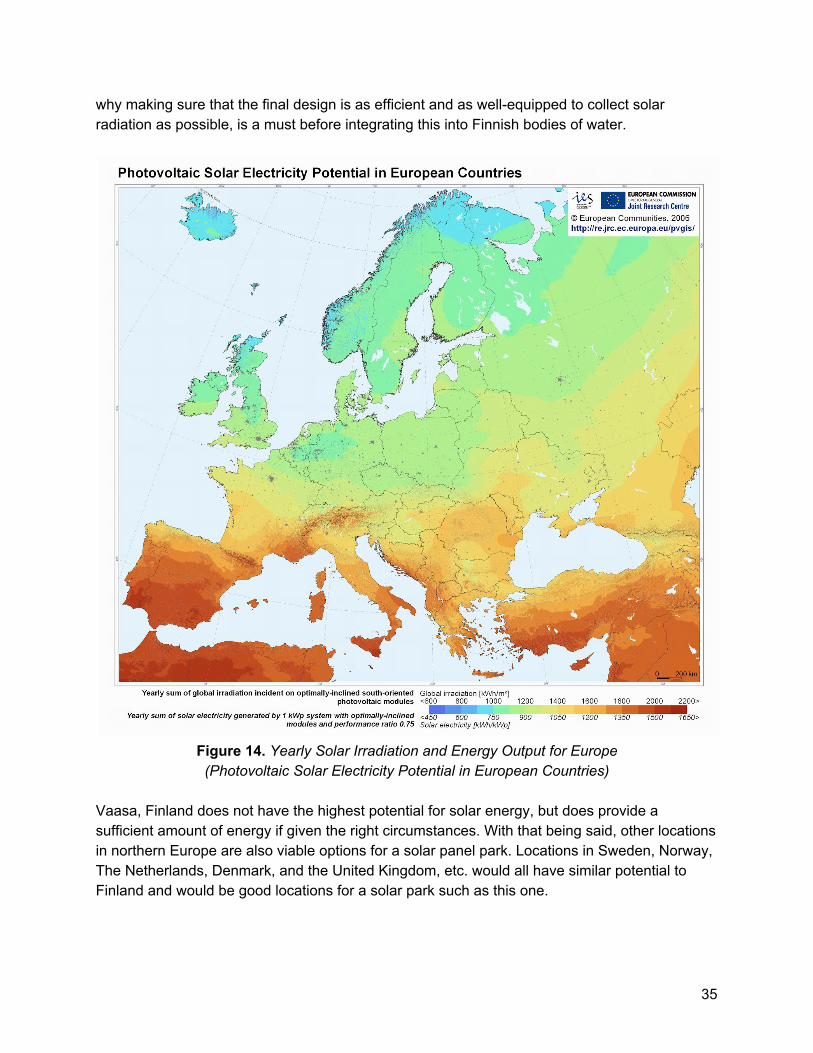
4.4 Types of panels 4.4.1 Monocrystalline Solar Panels (Mono-SI) This type of solar panels (made of monocrystalline silicon) is the purest one. They can be easily recognised from the uniform dark look and the rounded edges. The silicon’s high purity causes this type of solar panel has one of the highest efficiency rates, with the newest ones reaching above 20% (Askari Mohammad Bagher). Monocrystalline panels have a high power output, occupy less space, and last the longest. Of course, that also means they are more expensive. Another advantage to consider is that they tend to be slightly less affected by high temperatures compared to polycrystalline panels. They have been used in the solar industry for many years, which means that the manufacturing process is very optimized and the prices are very competitive. 4.4.2 Polycrystalline Solar Panels (Poly-SI) These panels can be quickly distinguished because this type of solar panels has squares, its angles are not cut, and it has a blue, speckled look. They are made by melting raw silicon, which is a faster and cheaper process than that used for monocrystalline panels. This leads to a lower final price but also lower efficiency (around 15%), lower space efficiency, and a shorter lifespan since they are affected by hot temperatures to a greater degree. However, the differences between mono- and polycrystalline types of solar panels are not so significant and the choice will strongly depend on your specific situation. The first option offers a slightly higher space efficiency at a slightly higher price but power outputs are basically the same. 4.4.3 Thin-Film Solar Cells (TFSC) Thin-film solar panels are manufactured by placing one or more films of photovoltaic material (such as silicon, cadmium or copper) onto a substrate. These types of solar panels are the easiest to produce and economies of scale make them cheaper than the alternatives due to less material being needed for its production.
36

They are also flexible—which opens a lot of opportunities for alternative applications—and is less affected by high temperatures. The main issue is that they take up a lot of space, generally making them unsuitable for residential installations. Moreover, they carry the shortest warranties because their lifespan is shorter than the mono- and polycrystalline types of solar panels. However, they can be a good option to choose among the different types of solar panels where a lot of space is available. This type of cells are mainly used for photovoltaic power stations, integrated in buildings or smaller solar power systems. There are some different types of thin-film panels:
● Amorphous Silicon Solar Cell (A-Si) are the most used of this type because they are the cheapest, although the efficiency is very low, around 7%
● Gallium arsenide cells have good resistance against temperature and can reach an efficiency around 32%. They are quite expensive because the materials are rare.
● Cadmium telluride cells are cheap to manufacture but the efficiency is low, around 11%. Moreover the materials needed are rare.
● CIS cells (Copper and indium selenide alloy) have efficiencies around 12% and the output is quite constant.
4.4.4 Bifacial panels Bifacial modules produce solar power from both sides of the panel. Whereas traditional opaque-backsheeted panels are monofacial, bifacial modules expose both the front and backside of the solar cells. When bifacial modules are installed on a highly reflective surface some bifacial module manufacturers claim up to a 30% increase in production just from the extra power generated from the rear. Bifacial modules come in many designs. Some are framed while others are frameless. Some are dual-glass, and others use clear backsheets. Most use monocrystalline cells, but there are polycrystalline designs. The one thing that is constant is that power is produced from both sides. There are frameless, dual-glass modules that expose the backside of cells but are not bifacial. True bifacial modules have contacts/busbars on both the front and back sides of their cells.
37

4.4.5 Conclusion As the purpose is to design a big solar park, it should be more appropriate to use crystalline silicon panels because the prices are more competitive when comparing euros/Wp. There is not a big difference between monocrystalline and polycrystalline, monocrystalline are slightly more expensive but require less space. However the other types of panels can be useful for special conditions. For example, thin film cells are better for concentration systems because they are less affected by temperature and bifacial panels could be appropriate if the light reflecting on the water. 4.5 Placement of panels The objective of this analysis is studying how different distributions of panels work and try to find the best of them; this means the one that produces more energy output. 4.5.1 Panel model It is difficult to find which the best panel in the market is so this is not a totally close decision. It is necessary to choose one model to do the simulations and compare different situations so the chosen panel is the model BMO-290 made by BISOL with 290 Wp of power.
Figure 15. Electrical specifications of the panel
38
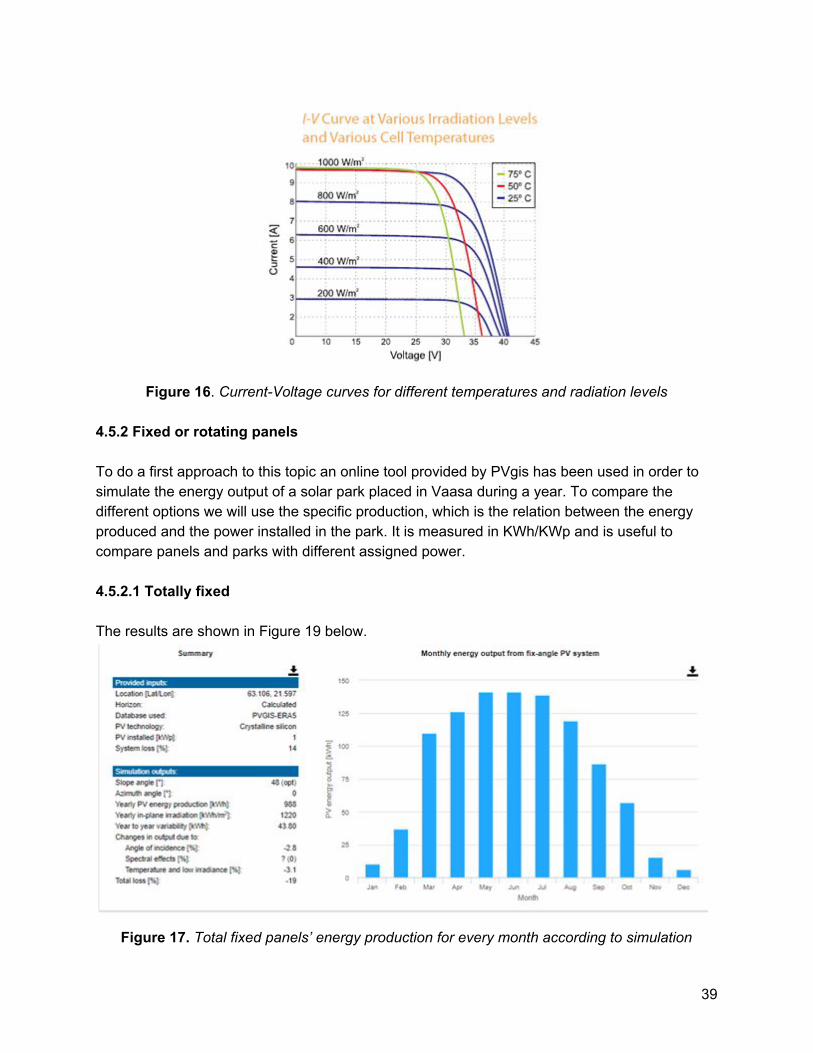
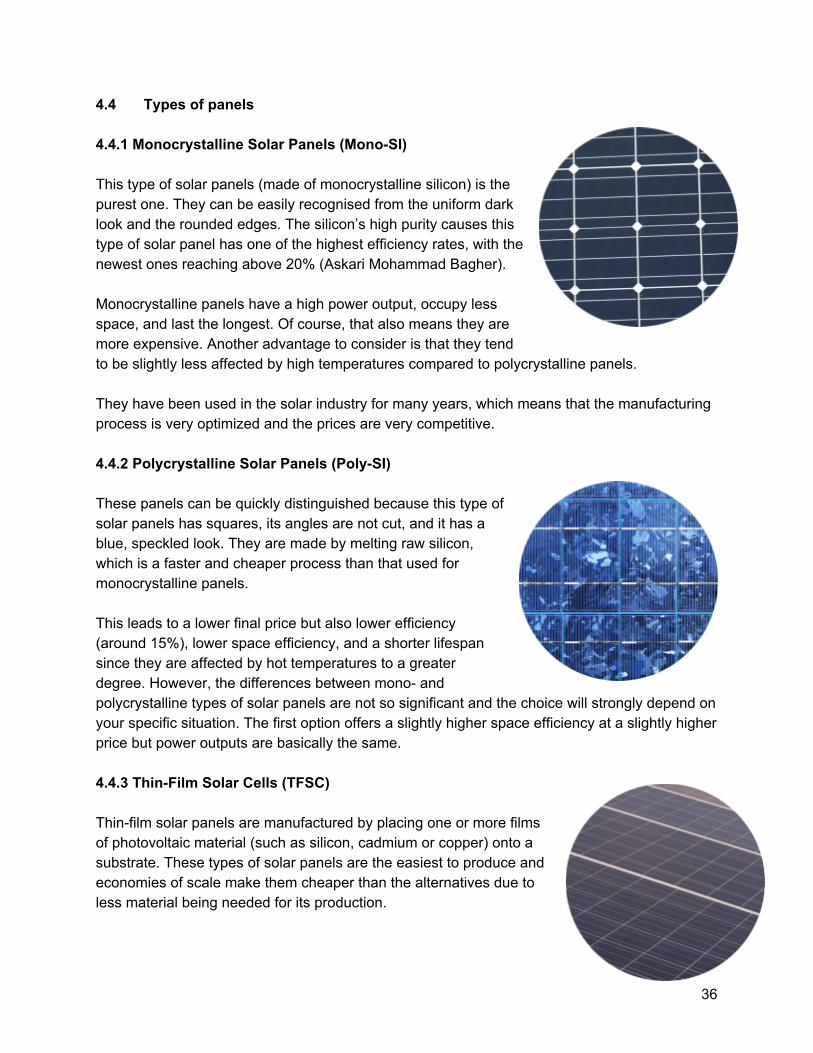
Figure 16. Current-Voltage curves for different temperatures and radiation levels
4.5.2 Fixed or rotating panels To do a first approach to this topic an online tool provided by PVgis has been used in order to simulate the energy output of a solar park placed in Vaasa during a year. To compare the different options we will use the specific production, which is the relation between the energy produced and the power installed in the park. It is measured in KWh/KWp and is useful to compare panels and parks with different assigned power.
4.5.2.1 Totally fixed The results are shown in Figure 19 below.
Figure 17. Total fixed panels’ energy production for every month according to simulation
39
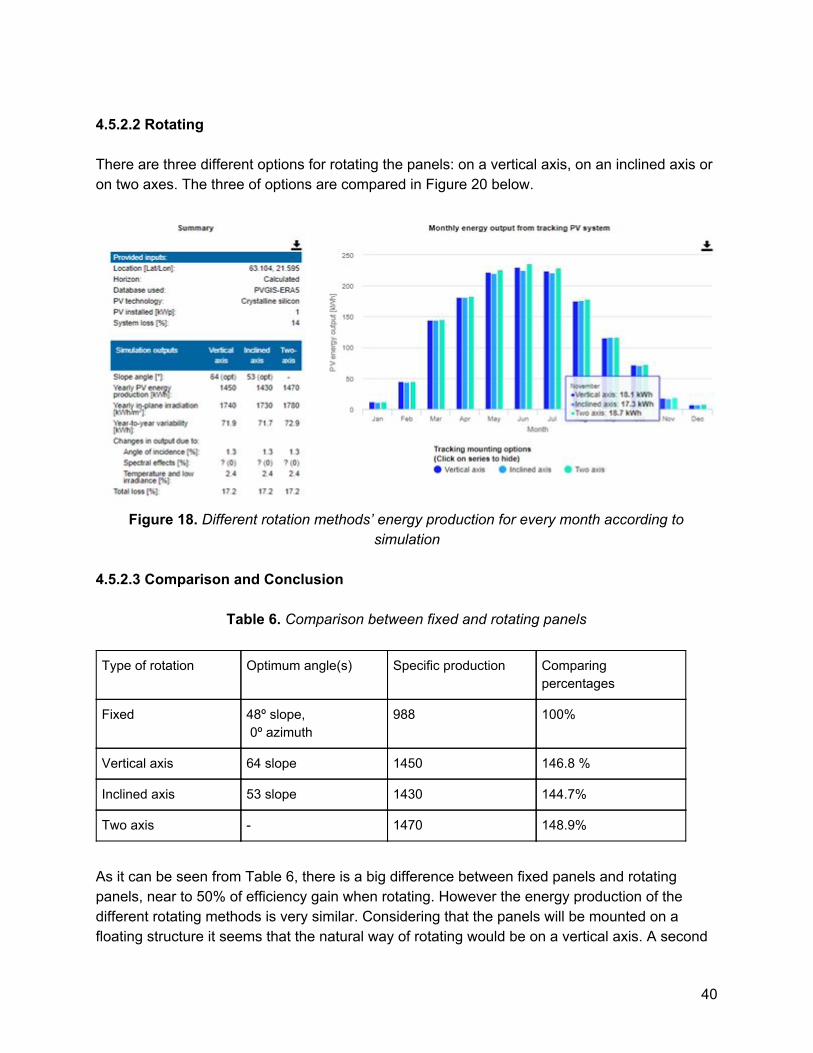
4.5.2.2 Rotating There are three different options for rotating the panels: on a vertical axis, on an inclined axis or on two axes. The three of options are compared in Figure 20 below.
Figure 18. Different rotation methods’ energy production for every month according to
simulation
4.5.2.3 Comparison and Conclusion
Table 6. Comparison between fixed and rotating panels
Type of rotation Optimum angle(s) Specific production Comparing percentages
Fixed 48º slope, 0º azimuth
988 100%
Vertical axis 64 slope 1450 146.8 %
Inclined axis 53 slope 1430 144.7%
Two axis - 1470 148.9%
As it can be seen from Table 6, there is a big difference between fixed panels and rotating panels, near to 50% of efficiency gain when rotating. However the energy production of the different rotating methods is very similar. Considering that the panels will be mounted on a floating structure it seems that the natural way of rotating would be on a vertical axis. A second
40

axis could be added too but would require another system which would increase the cost and require more moving parts that can originate maintenance problems. It is not worth it for such a small amount of extra energy, so we can state that a vertical axis is the best option.
Another important conclusion from these simulations is the energy production during the winter months. From November to February only a little amount of energy is produced comparing to summer months. This result opens the possibility of turning off the power plant during the winter. Keeping the panels free of ice and snow would require a an extra system to heat the panels in order to melt them or some kind of mechanical device that could remove them from the panel surface. Any of these solutions would increase remarkably the cost of the park, would need energy to work and still would not success on having the panels totally clean to get the maximum energy output. For all these reasons it is very unlikely that the extra energy and money invested on keeping the panels working during the winter will be recovered with the energy that it would generate during those months. Moreover it is not a good idea either to let the panels work without cleaning the snow in order to get some little energy without any expense; the inverter and some control devices will consume energy and the energy balance would probably be negative. The best solution will be turning on off the whole system when the snow starts to fall in November, make sure that the ice does not cause any damage and turn it on in March when the temperatures start to be above zero degrees. 4.5.3 Shadows In northern locations like Vaasa, shadows caused by panels will generate important energy losses because the sun is usually very low and the angle of the panels is quite big. Therefore is very important to consider how the shadows affect our solar park and try to find the best disposition for the panels. To know how big energy losses due to shadows are, we will use a software called PVsyst to simulate the energy production in a year. The panel used will be the one chosen above and the inverter is just one that fits the panel. As the purpose of this is comparing the inverter model is not important.
The solar cells forming a solar panel are connected in series. When several cells are connected in series they may experiment mismatch effects. Mismatch happens when cells connected in series are under different conditions, if one of the cells is producing less current because of shadows or degradation all the other cells will produce less too. To avoid this loss of energy, panels have bypass diodes; these are connected in parallel to a cell to allow the current generated by other cells flow through them when the cell is not working properly (PV Education. (o.D.). Bypass Diodes | PVEducation. Retrieved March 10, 2019). Connecting a diode for each cell would be expensive so they usually use only three diodes in this kind of panels. The diodes are connected as shown in figure 21.
41

Figure 19. Connection of solar cells and bypass diodes in a standard solar panel
Based on this, the panels must always be placed in horizontal way because that way, when the shadows cover the lowest part of the panel, only a part of the energy will be lost. Some different options will be analysed to understand how the shadows affect the energy production depending on how the panels are placed. 4.5.3.1 First Situation: No Shadows As it was found before, the optimum angle to rotate on vertical axes is 64º. The specific production calculated by simulating this situation on PVsyst is 1377 KWh/KWp. As we are also considering turning off the power plant from November to February, also the specific production from March to October will be calculated. In this case it is 1250 KWh/KWp.
4.5.3.2 Second Situation: Sun angle 10º
Figure 20. Diagram of position of panels
42

Figure 21. Dimensions of the chosen solar panel
The specific production during the whole year in this situation is 1169 KWh/KWp. During the best 8 months it is 1104 KWh/KWp. Knowing that the length of the panel is 991 mm we can calculate the necessary distance (d2 in figure 22) to get a sun angle of ten degrees. That is 5.5 meters. However, thinking about it, it is easy to realize that the shadows do not allow the panels to generate when the sun is low and therefore a smaller slope angle may be better. By trying different angles it is found that the maximum output is got when the slope angle is 53 degrees. The specific production is 1183 KWh/KWp but the specific production decreases very slowly when decreasing the angle. This means that it can be worth it to lose a little energy in order to make the distance between panels shorter and, in consequence, the area of the park smaller.
43

Table 7. Raw calculation data for 10 degrees sun angle
Slope angle (degrees) Specific production (KWh/KWp)
Specific production Mar-Oct (KWh/KWp)
Distance between panels (m)
53 1183 1121 5.08
50 1181 1120 4.94
47 1176 1116 4.79
45 1172 1112 4.67
43 1166 1107 4.56
40 1155 1098 4.37
It has also to be consider to put one row of panels in top of the other and separating them a longer distance. The space needed would be the same for the same number of panels and the energy output in this situation would be slightly higher because the panels on the top would get more sunlight. However doing this also means that the wind force is doubled and, as the park is floating, it may not stay in its place.
4.5.3.3 Third situation: Sun angle 15º In order to decrease the size of the park we will see how it works with more shadows. A similar process will be followed; finding the optimum angle and see how the output and distance change when the angle decreases. The optimum angle in this case is 47º.
Table 8. Raw calculation data for 15 degrees sun angle
Slope angle (degrees) Specific production (KWh/KWp)
Specific production Mar-Oct (KWh/KWp)
Distance between panels (m)
47 1046 1008 3.38
45 1044 1007 3.32
43 1042 1005 3.25
40 1036 1000 3.14
44
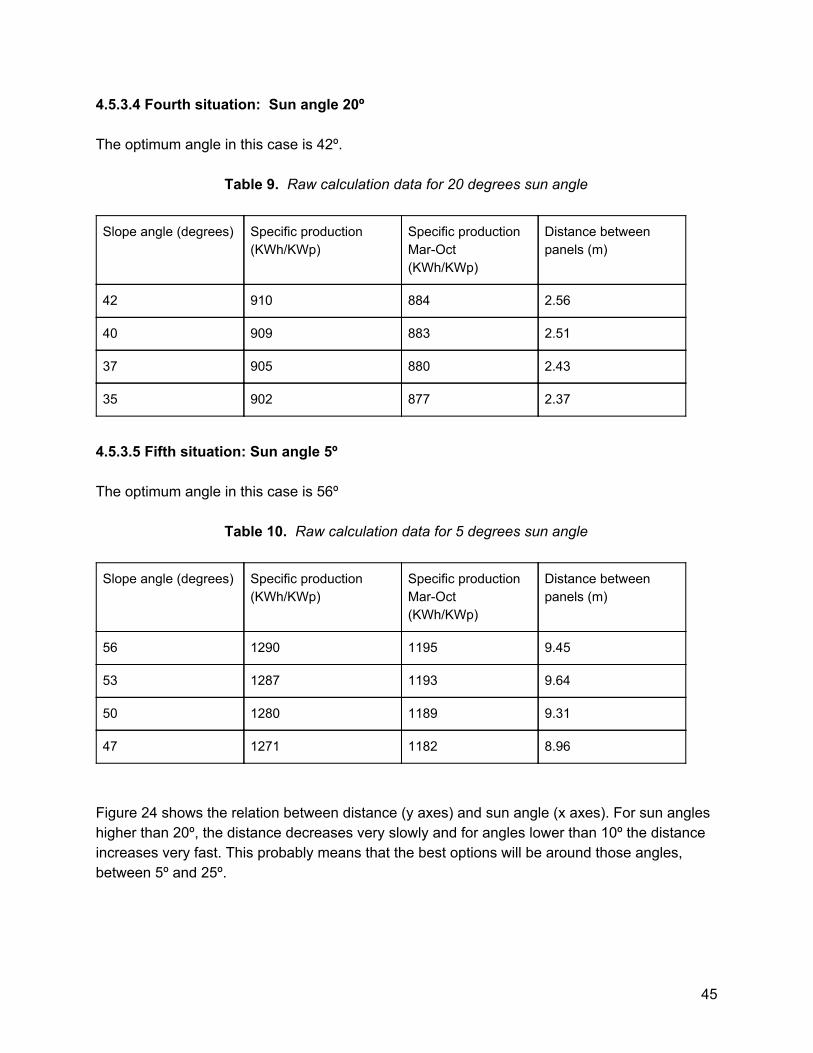
4.5.3.4 Fourth situation: Sun angle 20º The optimum angle in this case is 42º.
Table 9. Raw calculation data for 20 degrees sun angle
Slope angle (degrees) Specific production (KWh/KWp)
Specific production Mar-Oct (KWh/KWp)
Distance between panels (m)
42 910 884 2.56
40 909 883 2.51
37 905 880 2.43
35 902 877 2.37
4.5.3.5 Fifth situation: Sun angle 5º
The optimum angle in this case is 56º
Table 10. Raw calculation data for 5 degrees sun angle
Slope angle (degrees) Specific production (KWh/KWp)
Specific production Mar-Oct (KWh/KWp)
Distance between panels (m)
56 1290 1195 9.45
53 1287 1193 9.64
50 1280 1189 9.31
47 1271 1182 8.96
Figure 24 shows the relation between distance (y axes) and sun angle (x axes). For sun angles higher than 20º, the distance decreases very slowly and for angles lower than 10º the distance increases very fast. This probably means that the best options will be around those angles, between 5º and 25º.
45
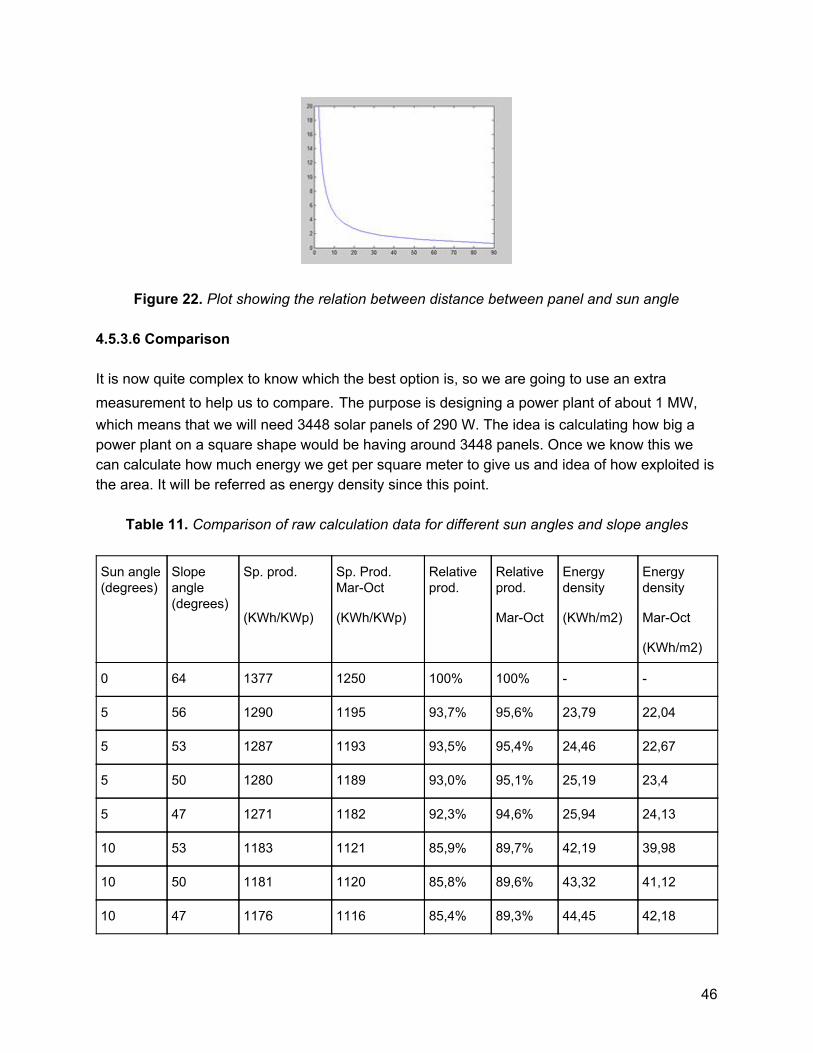
Figure 22. Plot showing the relation between distance between panel and sun angle 4.5.3.6 Comparison
It is now quite complex to know which the best option is, so we are going to use an extra measurement to help us to compare. The purpose is designing a power plant of about 1 MW, which means that we will need 3448 solar panels of 290 W. The idea is calculating how big a power plant on a square shape would be having around 3448 panels. Once we know this we can calculate how much energy we get per square meter to give us and idea of how exploited is the area. It will be referred as energy density since this point.
Table 11. Comparison of raw calculation data for different sun angles and slope angles
Sun angle (degrees)
Slope angle (degrees)
Sp. prod. Sp. Prod. Mar-Oct
Relative prod.
Relative prod.
Energy density
Energy density
(KWh/KWp) (KWh/KWp) Mar-Oct (KWh/m2) Mar-Oct
(KWh/m2)
0 64 1377 1250 100% 100% - -
5 56 1290 1195 93,7% 95,6% 23,79 22,04
5 53 1287 1193 93,5% 95,4% 24,46 22,67
5 50 1280 1189 93,0% 95,1% 25,19 23,4
5 47 1271 1182 92,3% 94,6% 25,94 24,13
10 53 1183 1121 85,9% 89,7% 42,19 39,98
10 50 1181 1120 85,8% 89,6% 43,32 41,12
10 47 1176 1116 85,4% 89,3% 44,45 42,18
46

Sun angle (degrees)
Slope angle (degrees)
Sp. prod. Sp. Prod. Mar-Oct
Relative prod.
Relative prod.
Energy density
Energy density
(KWh/KWp) (KWh/KWp) Mar-Oct (KWh/m2) Mar-Oct
(KWh/m2)
10 40 1155 1098 83,9% 87,8% 47,77 45,41
15 47 1046 1008 76,0% 80,6% 55,75 53,73
15 45 1044 1007 75,8% 80,6% 56,65 54,64
15 43 1042 1005 75,7% 80,4% 57,76 55,71
15 40 1036 1000 75,2% 80,0% 59,41 57,34
20 42 910 884 66,1% 70,7% 63,84 62,02
20 40 909 883 66,0% 70,6% 65,04 63,18
20 37 905 880 65,7% 70,4% 66,86 65,01
20 35 902 877 65,5% 70,2% 68,33 66,43
From Table 10 we can see that the losses due to shadows are lower if comparing the energy output only from March to April, this gives us another reason to believe that it is not worth it to keep the park working during the winter months.It is not so easy to get some conclusions from the sun and slope angles analysis. Here are the results plotted to see them better:
Figure 23. Graph representing the variation of energy density depending on sun angle and
slope angle
47
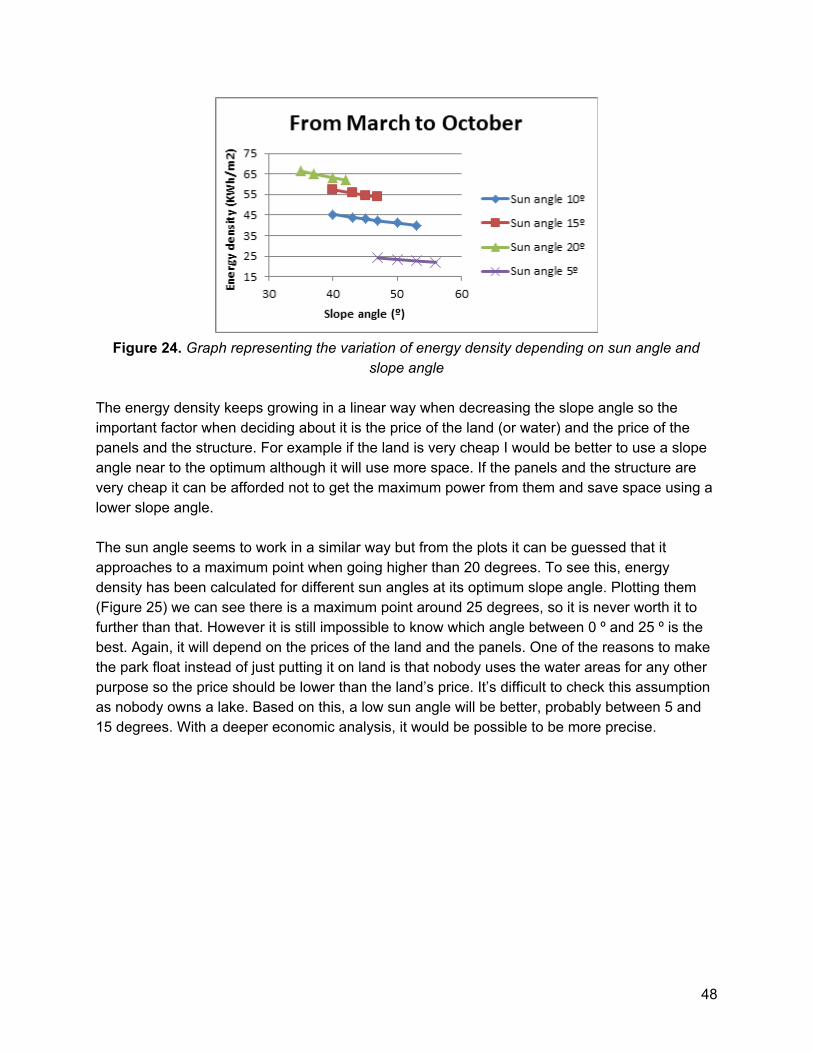
Figure 24. Graph representing the variation of energy density depending on sun angle and
slope angle
The energy density keeps growing in a linear way when decreasing the slope angle so the important factor when deciding about it is the price of the land (or water) and the price of the panels and the structure. For example if the land is very cheap I would be better to use a slope angle near to the optimum although it will use more space. If the panels and the structure are very cheap it can be afforded not to get the maximum power from them and save space using a lower slope angle.
The sun angle seems to work in a similar way but from the plots it can be guessed that it approaches to a maximum point when going higher than 20 degrees. To see this, energy density has been calculated for different sun angles at its optimum slope angle. Plotting them (Figure 25) we can see there is a maximum point around 25 degrees, so it is never worth it to further than that. However it is still impossible to know which angle between 0 º and 25 º is the best. Again, it will depend on the prices of the land and the panels. One of the reasons to make the park float instead of just putting it on land is that nobody uses the water areas for any other purpose so the price should be lower than the land’s price. It’s difficult to check this assumption as nobody owns a lake. Based on this, a low sun angle will be better, probably between 5 and 15 degrees. With a deeper economic analysis, it would be possible to be more precise.
48

Figure 25. Graph showing energy density for different sun angles with the optimus slope angle
4.5.3.6 Conclusion After all this analysis, we can understand much better how shadows affect the energy production but it is still impossible to know the best way to place the panels. Three different options will be considered for the designs:
Table 12. Parameters of 3 different options for placing the panels
Compact Medium Spaced
Sun angle (degrees) 25 10 6.5
Slope angle (degrees) 37 40 53
Distance between panels (m) 2.07 4.37 7.54
Sp. Production, whole year (KWh/KWp) 799 1155 1263
Energy density, whole year (KWh/m2) 69.19 47.77 30.55
Sp. Production, Mar-Oct (KWh/KWp) 775 1098 1179
Energy density, Mar-Oct (KWh/m2) 67.11 45.41 28.52
Area required for 1 MW approx. (m2) 11537 24386 41292
Square side length (m) 107.64 157.32 203.58
Columns 65 94 123
Rows 53 37 28
49

4.6 Solar Tracking A solar tracking system tracks the position of the sun and maintains the solar photovoltaic modules at an angle that produces the best power output. Several solar tracking principles and techniques have been proposed to track the sun efficiently. The idea behind designing a solar tracking system is to fix solar photovoltaic modules in a position that can track the motion of the sun across the sky to capture the maximum amount of sunlight. Tracker system should be placed in a position that can receive the best angle of incidence to maximize the electrical energy output. Designing such device to produce electrical energy is interesting and important. However, it requires extensive mathematical calculations and detailed measurements of different solar parameters. One of the most important parameters is the daily average solar irradiance. The daily average solar irradiance ranges from 4–7 kilowatt-hour (KWh/m2) worldwide (M.K.M., 2018).
Tracker systems track the position of the sun, thereby increasing the input of solar radiation and electrical energy output. However, designing, implementing, and installing these systems are difficult for different reasons. Multiple amount of measurement results are required before employing tracker systems. These results are collected during a relatively long period time to be used when installing solar cells to track the sun. The collected results are used to identify the best technique for tracking the position of the sun. Following the position of the sun is performed to obtain the optimal output of solar energy in all situations (ICRERA, 2012). Different environmental pressures and different parameters, including panel direction, angle of photons incidence, time to measure the results, material of solar cells, and conductivity of photovoltaic modules, may affect the output of the solar panel cells (Aust Economy Rev., 2006). Considering the first aspect of increasing efficiency, solar tracking can be condensed to a few details. A distinction must be made between active and passive solar tracking, as well as between one-axis and two-axis tracking of the solar panels.
Figure 26. Triangular Solar Tracker, spin cell, double solar tracker
In addition to the mechanical tracking of the above-mentioned aspects, there are also specially designed solar panels, which have, to some extent, integrated the solar movement in their
50

construction. These include Spin Cells or Triangular Solar Panels. Both cases are not suggested for northern latitudes due to the energy loss by non-utilization of the entire panel area at any time (M.K.M., 2018). 4.7 Mirrors & Concentrators 4.7.1 Increasing the efficiency of solar modules through mirrors
Known variants of solar power bundling have been around for some time in the field of solar thermal power plants. The best known are the parabolic troughs, the paraboloid and the solar tower, but these are difficult to apply to the photovoltaic technology, as they are concave mirror constructions designed for maximum temperature output, similar to the burning glass (Wikimedia Commons, 2011).
Figure 27. Types of concentrated solar power solutions
Nonetheless, there are now techniques for solar power bundling in the field of photovoltaic systems.
One way to increase the output from the photovoltaic systems is to supply concentrated light onto the PV cells. This can be done by using optical light collectors, such as lenses or mirrors. The PV systems that use concentrated light are called concentrating photovoltaics (CPV). The CPV collect light from a larger area and concentrate it to a smaller area solar cell.
The company Concentrix, for example, relies on Fresnel lenses that can concentrate sunlight almost 500 times, and the high-efficiency solar cells developed at ISE (III-V stacked solar cells made of gallium indium phosphide, gallium arsenide and germanium),(Fedkin, M.F.(o.D.)). As shown in Figure 29, Fresnel lenses concentrate incident light onto a central solar cell. These cells are specially designed for concentrated radiation, have a diameter of 2 mm and an
51

efficiency of up to 32%. When soldered to copper sheets, they are glued to a glass plate so that they are always in the focus of a Fresnel lens, see Fig. 28.
Figure 28. Processing of Fresnel lenses Figure 29. Fresnel lens Disadvantages of this efficiency enhancement variant are the high manufacturing costs for the special solar cells and the need for a minimum one-axis tracking of the sun so that the focal point of the lens at all times meets the active area of the solar cell.
Figure 30. Archimedes V-Trough PV Concentrator
Another variant of the increase in efficiency are Mirrors. One Variation was already mentioned with the solar thermal power plants, the Heliostats. The Heliostats are the combination of mirrors combined with solar tracking. Heliostats could work for Solar energy plants, but they would need a big amount of space and therefore will not be considered further.
52

The so-called V-trough concentrators are a better solution for space saving. The V-trough concentrator is formed by two flat reflector benches, which are attached to the side of the photovoltaic with an angle of 60 ° and can result in a construction just like Fig. 30 or Fig. 31. This results in a geometric concentration factor of C = 2 (Klotz, F. H. K. (o.D.), 1996). The geometric concentration factor C is defined as the ratio of the radiation-receiving aperture area of a concentrating collector to its absorber area. The irradiance in the module level depends on the reflector quality and the direct radiation drive. On clear days, irradiation intensities of up to 2000 W / m² can be achieved with good reflectors. The V-Trough solution can achieve an energy gain of 58% compared to conventional solar cells with the same size (measured in Central Europe) . This reduces the proportion of expensive solar cells. The mirror surface is significantly cheaper than the module surface (Archimedes Solar GmbH, 2008).
Figure 31. Cross-section V-Trough Generally, efficiency increasing methods in the solar sector are divided into 3 groups. Solar tracking systems, mirrors and concentrators. Coming to the topic of Mirrors it has been proven that the Attachment of Heliostats to the solar cells would not be efficient after all. Additionally, it can be seen a change in the last years related to the V-Trough concentration method. Looking at the sources of the known efficiency enhancement measures for solar energy systems, it is noticeable that V-trough technology has hardly received any attention for some time (Powalla, 2019). Among the concentrators there are various variants of special cells. The Fresnel lenses, tandem solar cells or fluorescent cells are only a few variants and types of different lens and cell types. The Fresnel lenses have the highest efficiency with respect to the problem of photovoltaic use in Finland and have therefore been considered in more detail. For these reasons the focus will be set in the Fresnel lenses on the coming designs, which, judging by literature, have the greatest potential for development in solar power plants. But it will also be worked with the V-Trough technology and a conventional monocrystalline solar cell to have a basic for further comparisons in energy output and in aspects of economy calculations.
53
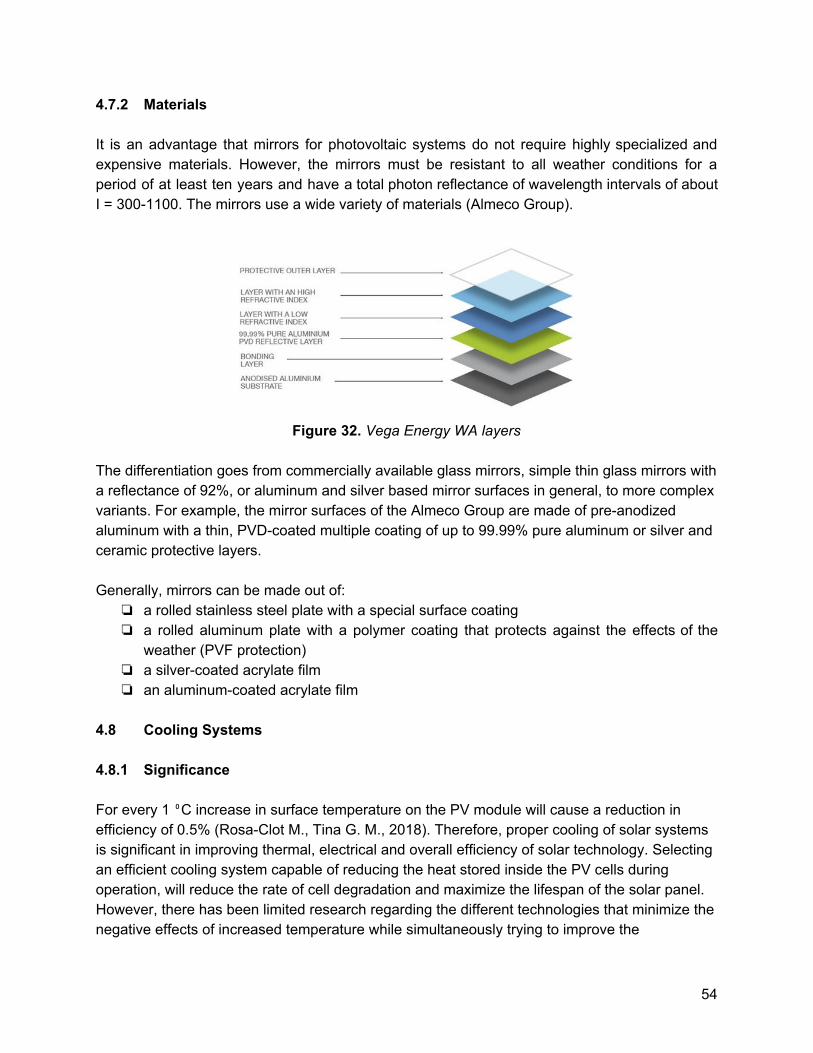
4.7.2 Materials It is an advantage that mirrors for photovoltaic systems do not require highly specialized and expensive materials. However, the mirrors must be resistant to all weather conditions for a period of at least ten years and have a total photon reflectance of wavelength intervals of about I = 300-1100. The mirrors use a wide variety of materials (Almeco Group).
Figure 32. Vega Energy WA layers
The differentiation goes from commercially available glass mirrors, simple thin glass mirrors with a reflectance of 92%, or aluminum and silver based mirror surfaces in general, to more complex variants. For example, the mirror surfaces of the Almeco Group are made of pre-anodized aluminum with a thin, PVD-coated multiple coating of up to 99.99% pure aluminum or silver and ceramic protective layers. Generally, mirrors can be made out of:
❏ a rolled stainless steel plate with a special surface coating ❏ a rolled aluminum plate with a polymer coating that protects against the effects of the
weather (PVF protection) ❏ a silver-coated acrylate film ❏ an aluminum-coated acrylate film
4.8 Cooling Systems 4.8.1 Significance
For every 1 ⁰C increase in surface temperature on the PV module will cause a reduction in efficiency of 0.5% (Rosa-Clot M., Tina G. M., 2018). Therefore, proper cooling of solar systems is significant in improving thermal, electrical and overall efficiency of solar technology. Selecting an efficient cooling system capable of reducing the heat stored inside the PV cells during operation, will reduce the rate of cell degradation and maximize the lifespan of the solar panel. However, there has been limited research regarding the different technologies that minimize the negative effects of increased temperature while simultaneously trying to improve the
54

performance of the PV panel operating beyond the recommended STC temperature (Siecker J., Kusakana K., Numbi B. P., November 2017). Various cooling techniques have been investigated, but for the purposes of this project have been narrowed down to the following cooling systems below. Each cooling technique listed gives an overall operational description, and their capability of addressing undesirable influence of temperature on PV efficiency in terms of their advantages and disadvantages.
4.8.2 Cooling System Techniques
Water Veil Cooling System
The Water Veil Cooling (WVC) system consists of a pump and an irrigation system made of polyethylene pipes positioned on the top of each solar panel. This technique includes a temperature control system that switches on when the solar panel temperature exceeds a fixed threshold, typically the maximum temperature for solar panel is 30 ⁰C (Siecker J., Kusakana K., Numbi B. P., November 2017). A low pressure, submersible water pump is used to move the water through the pipes to the top of the panel. Figure 33 below shows a typical layout of a WVC system. A WVC system utilizes a uniform water layer to lower PV cell surface temperature and create a refractive layer to decrease the solar radiation reflected by the glass. For reference, the refractive index is 1.3 to water and 1.5 to glass (Castanheira A., Fernandes J., Branco C., 2018). A WVC system is estimated to increase the efficiency of a solar panel by 10% on an annual basis to 15% output at peak radiation conditions. There is also potential for panel surface cleaning caused from the irrigation system water flow. Key disadvantages of a WVC system include a large power requirement to circulate the cooling water, and water blockage that is caused by dust or dirt deposition on the panel. It is significant to note that this cooling technique may compete with other non-solar, conventional energy supply systems as a result of this system’s higher operating costs.
55

Figure 33. Diagram of a WVC system (Rosa-Clot M., Tina G. M., 2018).
Water Sprinkler Cooling System A water sprinkler cooling system is a simpler alternative to a WCV system. Instead of irrigation pipes, the system utilizes high-pressure sprinklers that operate at a pressure of 2 to 3 bar. As a result, the cost of cooling is much less than the WCV system while still increasing the power output by 10% on an annual basis. A issue that may become a concern is the shadowing effect caused from the water jet. Although this can be limited by the amount of time spent spraying. Spray time can be planned for a very short amount of time to maintain a low panel temperature without waste of pumping energy and loss of solar radiation (Siecker J., Kusakana K., Numbi B. P., November 2017). Therefore, major disadvantages of this cooling system are water and heat wastage. Visuals of a high-pressure sprinkler attachment and layout of water sprinkler cooling system is shown in Figure 36 and 37 below.
56

Figure 34. Visual of high- pressure sprinkler head for solar panel cooling system (Castanheira
A., Fernandes J., Branco C., 2018).
Figure 35. Visual layout of water sprinkler cooling system (Castanheira A., Fernandes J.,
Branco C., 2018). Forced Water Circulation Cooling System
The forced water circulation cooling system has thermal collecting pipes mounted to the back of the solar panel. Water is used as the working fluid that circulates through the thermal collecting pipes by a DC pump. The heat generated from the PV cells is transferred to the circulating water in the thermal collecting pipes and the recycled flow goes back to a hot water insulated collecting tank for other uses (Siecker J., Kusakana K., Numbi B. P., November 2017). A major disadvantage associated with this system is that the operation of the DC pump and water tube network are expensive to run, making this system the most high-costing. Another issue of concern is that the system is incapable of reaching optimal efficiency due to the constant flow rate of the system. On the other hand, the system is capable of the greatest drop in operating PV cell temperature as well as the highest increase in power output. Depending on other environmental and economical factors, this system may not be a feasible cooling technique for this project.
57

Forced Air Circulation Cooling System The forced air circulation cooling system is designed so that the PV module is placed on top of a support structure with an air channel underneath. A fan powered by the PV module will force the air acting as the cooling fluid through the channels. The width of the channel has significant effect on the PV cell temperature, or the natural cooling due to convection. As the width of the channel increases, the cavity velocity and size of the heat exchanging surface increase. This allows the heat from the solar panel to transfer to the air in the channels via convection and reduce in surface operating temperature, therefore reaching a higher electrical efficiency (Siecker J., Kusakana K., Numbi B. P., November 2017). Depending on the size availability for the location design area, this relationship could work positively or negatively in favor for the project. This cooling technique is not as efficient as the other cooling techniques listed above and is only economical for large-scale PV systems. Another issue of concern is that the temperature controller is required to adjust the air flow rate which adds additional costs. However, forced air circulation systems are very effective in cold climatic conditions compared to hot climatic conditions making this more favorable for Finland. The system is additionally one of the lesser energy intensive cooling techniques available. Transparent coating (photonic crystal cooling)
This cooling system technique incorporates a transparent coating (photonic crystal cooling) based on silica photonic crystals. The coating creates a new material atop the solar cells enabling the PV cells to reflect generated heat in the form of infrared light under solar irradiance back into space (Siecker J., Kusakana K., Numbi B.P., November 2017). The transparent coating is capable of keeping PV cells cooler even though the PV cell absorbs the same amount of sunlight. In fact, researchers predict the transparent coating could help solar cells turn approximately 1% more sunlight into electricity (Li W., Shi Y., Chen K., Zhu L., Fan S., 2017 ). Although this amount may seem insignificant, it is in actuality a significant increase in efficiency for such a small addition to the system. By using the sky as a heat sink to eliminate unwanted generated heat, the cooling material is capable of lowering the cell temperature and eliminating the problem entirely. Like the forced air circulation cooling system, the transparent coating also works better in a cooler climate such as Finland. Disadvantages of the material is that it needs to be replaced as the coating degrades with time and will no longer work as effectively. Another issue this cooling technique is that some of the heat generated will be wasted when it could be utilized for energy. Figure 36 below shows a typical diagram of the transparent coating material.
58

Figure 36. Diagram of Photonic Crystal Cooling Material (Li W., Shi Y., Chen K., Zhu L., Fan S.,
2017). 4.8.3 Solution to Calcite Formation
For water cooling techniques that utilize water for cooling by exposing water to the solar panel surface, certain precautionary steps can be taken in order to prevent the formation of calcite formation. To avoid calcite formation suction pipes with a non-return strainer and, or a strainer/filter attachment can be utilized before water enters the pipes to prevent unwanted particles from entering the system. A pre-water treatment system could also be another option but it should be kept in mind that this would drastically increase the cost of the cooling system. 4.8.4 Looking Ahead As of today, economical and technically viable design options along with effective cooling system information are still in early development. As a result, only a limited amount of data is currently available (Castanheira A., Fernandes J., Branco C., 2018). Therefore generating numbers regarding energy intensitivity for cooling and quantity of PV cell electrical output for each cooling technique is hard to determine and compare at this point. Moving forward, the team will determine whether or not to invest in a cooling technique further along in the project when more data is known from simulation and testing. When deciding on a cooling technique, the team will not only consider factors of water and energy losses in the cooling system, but the investment cost, durability and maintenance required to upkeep the system. The team additionally has the option to either utilize the lake water, or use water stored in a onsite water tank for obtaining the cooling water used in various systems. Both lake water and onsite stored water each have pros and cons that will need to be considered before making a final decision. A cooling system will not yet be ruled out as a cooling technique has the ability to increase annual energy production a great amount depending on various factors and meteorological elements of the desired location of the floating solar installation.
59

4.9 Floating Structures and Materials The structure is an important part of the project and, due to the location chosen, ice and corrosion are two of the hardest inconveniences. To find a good material for the floating structure, the research has to be focused on the next chart.
Table 18. Required characteristics of a floating material
Corrosion resistance high
Impermeability high
Floatage / Buoyancy high
Density low
Rigidity medium / low
Traction resistance high
Bending resistance medium
Deformation low
Ice compressión resistance high
Many materials have been considered such as wood, stainless steel, PVC, and other composite materials with fibers and special finishing treatments.
PVC, PE polyvinyl chloride (PVC) and polyethylene (PE-HD, PE-LD) belong to the plastics. In a study on the topic of corrosion in water pipes, the material plastic is generally classified as harmless (Förstner, 2012). There is no influence of the water on the plastic (corrosion), nor of the plastic on the water. For cable insulation often a so-called soft PVC is used, which is also used in the underwater cables. This PVC plasticizer (phthalates) are added, which are not bound to the plastic and thus easily escape (Umweltbundesamt, 2017). These can accumulate in 40 sediments and accumulate in the food chain via enrichment in fish. The effects of phthalates on humans are not fully understood. Due to controversial opinions, there are now also alternative plasticizers such as adipates, adipic acid polyesters or citrates. Hexamol® DINCH and citrates in particular have been scientifically studied and approved as plasticisers in toys and food contact. With these phthalate alternatives, there are no indications to date of negative health and environmental effects (Windsperger und Tuschel, 2007). PE-HD is considered to be very resistant to diluted acids, alkalis, alcohol, gasoline, water, fats and oils. Solar radiation affects PE-HD, as well as most plastics, in its mechanical properties and in its color. Antioxidants or active carbon black are often used as UV protection.
60

Figure 37. PE-HD Floating photovoltaic power plant parts Polyethylene is water-repellent and does not swell when stored in water. Due to its resistance to chemicals, PE-HD has been the preferred material for drinking water pressure pipes and sewage pipes for more than 40 years. From the food and pharmaceutical perspective, there are no concerns about the use of PE in the water and it is a non-dangerous variation for the platform building in floating solar park foundations (Domininghaus, 2012).
Figure 38. Submerged & floating photovoltaic systems
Nowadays there are some floating platforms in the freshwater area. Several test basins were installed in Singapore in 2016 in cooperation with the Solar Energy Research Institute of Singapore (SERIS). Ciel et terre, a French company, which is the leader in floating freshwater technology. Similar to floating footbridges in bathing lakes, Ciel et terre has developed a modular plug-in system consisting of polyethylene pontoons on which solar modules are mounted (Ciel et terre 2017). In 2017, 4CSolar built a first floating prototype of tubes, also made of PE-HD, in the Maldives (Smadja and Smadja 2017).
61

Kyocera, a Japanese company, is installing floating equipment in Japan using the polyethylene substructure of Ciel et terre and its own solar modules (Kyocera 2017). There is also a development concept of Swimsol in the freshwater area, in which polysurf pontoons are used instead of the polystyrene floats. This has the advantage that the entire construction manages with fewer components and as a result, the assembly is also less expensive. Larger systems can be installed in less time and installation costs are minimized. The French company Ciel et terre uses a custom pontoon type to mount their solar modules directly on top. These are also characterized by a very fast installation time (Ciel et terre 2017). In the new development concept of Swimsol, the floats originally made of styrofoam are exchanged for blow-molded polyethylene floats. Nevertheless, there are other methods of building swimming platforms which are being tested just as a swimming solarpark in Albania by Statkraft shows.
Figure 39. Swimming Solar Park by Statkraft, Albania
The PV Cells are mounted on a flexible membrane which is an effective barrier against the waterbody, carefully designed to withstand mechanical stress and sun exposure. This solution is a great alternative for more southern regions, but due to the fact that the angle to the sun can not be adjusted, the non-permeable membrane is not a solution for solar parks in Finland (Ocean sun, 2018). When you take all this in consideration, the most efficient way in building foundations for swimming solar platforms are the polysurf pontoons by Swimsol and the PE-HD variations, which capture the least cost and are easy to assemble. 4.10 Anchoring
Since many options for floating systems are available there are also many options for anchoring systems. Most of the anchoring systems consist of an anchor, being attached to a fixed object, or a combination of the two. Fixed objects include the land, a driven pile and pole, or something in the environment that is going to stay fixed. After further research and a discussion about the structure type, it seems like the best options are to either anchor the structure straight down from the bottom and have another fixed point off to the side to limit the structure from rotating all the way around or to anchor the structure at
62

points diagonal to each other and either cross the anchors inward or place the anchors farther apart to hold them in place. The following figures detail the two ways anchors could be placed.
Figure 40. Chains Crossed Inwards Figure 41. Chains Going Outwards (How to Anchor a Dock System) (Floating Power Plant…)
These anchors can be dredge-anchors that will stick into the ground further as the platform moves around a little bit or can be a simple concrete block that is of enough weight to hold the structure in place.
4.11 Rotation As for rotation, there seems to be two ways main ways to rotate the panels. One way is above water, which includes gear-like movement, and another way is under water where motors or propulsion machines would be necessary to move the platform. Rotating underwater might be less accurate, but would require less of an exact design up front and would possibly require better solar tracking in the end. For below water rotation, there are many “motor-like” options. The best design seems to be to attach two motors to the outside edges of the floating platform and have them be able to spin both directions to rotate the platform back and forth to follow the sun. Options for motors could be an electric outboard motor, a pump that expels water quicker on one side that the other, or an electric propellor motor generally used for trolling. The final design will have to take into account the energy used to run these motors to see which one is the most feasible. Besides the “motor-like” options, rotation above the water is also possible. This can be done in the form of a gear system on top of the floating platform that would be able to rotate as it tracked the sun. This could take the form of a singular rotating system is in the middle of multiple platforms holding panels and all rotating at the same time or a rotating system could be put in the singular structure, row, or panel even making everything more modular when it came to rotation. With this option, a more static anchoring system would be required. This type of
63
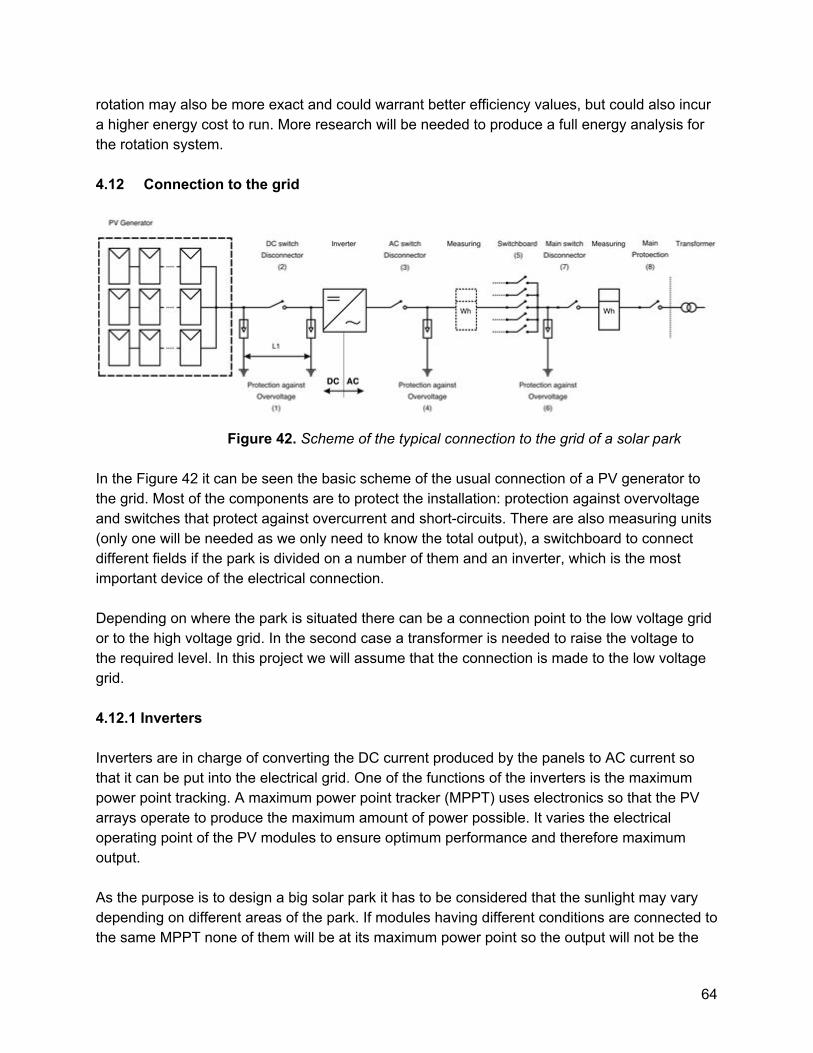
rotation may also be more exact and could warrant better efficiency values, but could also incur a higher energy cost to run. More research will be needed to produce a full energy analysis for the rotation system. 4.12 Connection to the grid
Figure 42. Scheme of the typical connection to the grid of a solar park
In the Figure 42 it can be seen the basic scheme of the usual connection of a PV generator to the grid. Most of the components are to protect the installation: protection against overvoltage and switches that protect against overcurrent and short-circuits. There are also measuring units (only one will be needed as we only need to know the total output), a switchboard to connect different fields if the park is divided on a number of them and an inverter, which is the most important device of the electrical connection.
Depending on where the park is situated there can be a connection point to the low voltage grid or to the high voltage grid. In the second case a transformer is needed to raise the voltage to the required level. In this project we will assume that the connection is made to the low voltage grid. 4.12.1 Inverters Inverters are in charge of converting the DC current produced by the panels to AC current so that it can be put into the electrical grid. One of the functions of the inverters is the maximum power point tracking. A maximum power point tracker (MPPT) uses electronics so that the PV arrays operate to produce the maximum amount of power possible. It varies the electrical operating point of the PV modules to ensure optimum performance and therefore maximum output.
As the purpose is to design a big solar park it has to be considered that the sunlight may vary depending on different areas of the park. If modules having different conditions are connected to the same MPPT none of them will be at its maximum power point so the output will not be the
64
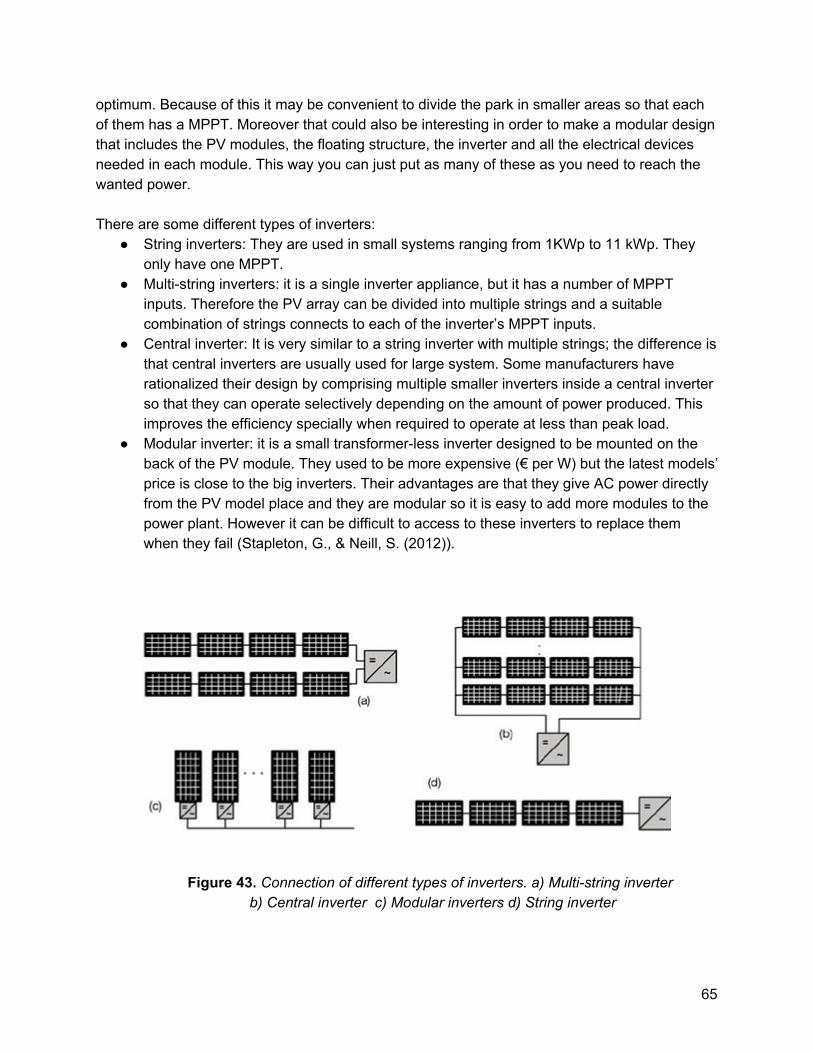
optimum. Because of this it may be convenient to divide the park in smaller areas so that each of them has a MPPT. Moreover that could also be interesting in order to make a modular design that includes the PV modules, the floating structure, the inverter and all the electrical devices needed in each module. This way you can just put as many of these as you need to reach the wanted power. There are some different types of inverters:
● String inverters: They are used in small systems ranging from 1KWp to 11 kWp. They only have one MPPT.
● Multi-string inverters: it is a single inverter appliance, but it has a number of MPPT inputs. Therefore the PV array can be divided into multiple strings and a suitable combination of strings connects to each of the inverter’s MPPT inputs.
● Central inverter: It is very similar to a string inverter with multiple strings; the difference is that central inverters are usually used for large system. Some manufacturers have rationalized their design by comprising multiple smaller inverters inside a central inverter so that they can operate selectively depending on the amount of power produced. This improves the efficiency specially when required to operate at less than peak load.
● Modular inverter: it is a small transformer-less inverter designed to be mounted on the back of the PV module. They used to be more expensive (€ per W) but the latest models’ price is close to the big inverters. Their advantages are that they give AC power directly from the PV model place and they are modular so it is easy to add more modules to the power plant. However it can be difficult to access to these inverters to replace them when they fail (Stapleton, G., & Neill, S. (2012)).
Figure 43. Connection of different types of inverters. a) Multi-string inverter b) Central inverter c) Modular inverters d) String inverter
65

For a big power plant it is probably better to use central inverter (or a number of them) or some multi-string inverters because it is going to be cheaper than using a lot of small string inverters or modular inverters.
The panels will all be exactly the same and will be placed quite close to each other so they are expected to work under the same conditions. If this is the case, a central inverter is better because the MPP will be the same for all the panels.
However the first row will never be shaded by other panels so they will generate more energy if they have their own MPPT. Moreover, if the park is divided in several floating structures, the conditions may vary a bit more and it can be worth it to have several smaller inverters or multi-string inverters.
Another advantage of having several inverters is that not all the production is lost if one inverter is not working. Summing up, it is difficult to decide about this before knowing what the whole design will look like. 4.13 Cleaning and Maintenance Maintaining the solar panels in a floating solar park might not be as easy as keeping a home solar panel working, but some of the same techniques can be used to ensure increased efficiency throughout the year. Cleaning your solar panels is a must. Cleaning the panels even once a year can increase the efficiency of your panels by 3.5% (Done in Google study, Best Way to Clean Solar Panels). And rain doesn’t cut it. There is a 12% difference in efficiency output came from comparing professionally cleaning the panels to just relying on rain to wash them. This test was done in California, a place with a very different climate than Vaasa, but still a good comparison proving that cleaning is a good thing to do (Best Way to Clean…). This annual cleaning can come in conjunction with the snow and ice removal that may be needed in March when the ice starts to thaw. Cleaning the solar panels consists of taking a soft brush or sponge and washing off and grime, dirt, or debris from the panels face. Biodegradable soap can also be used for harsher stains on the panel’s surface (Cleaning and Maintenance…). Taking care to be gentle on the panel and clean it carefully is a must if peak efficiency is to be guaranteed. Maintenance will also need to be done to keep these panels in working order. Checking all electrical components at the time of the annual cleaning would be a good way to save money and reduce the amount of workdays required to check the panels. Maintenance will also need to be done if something goes wrong, which is not something that can be planned for, but is something one needs to be aware of and ready for.
66
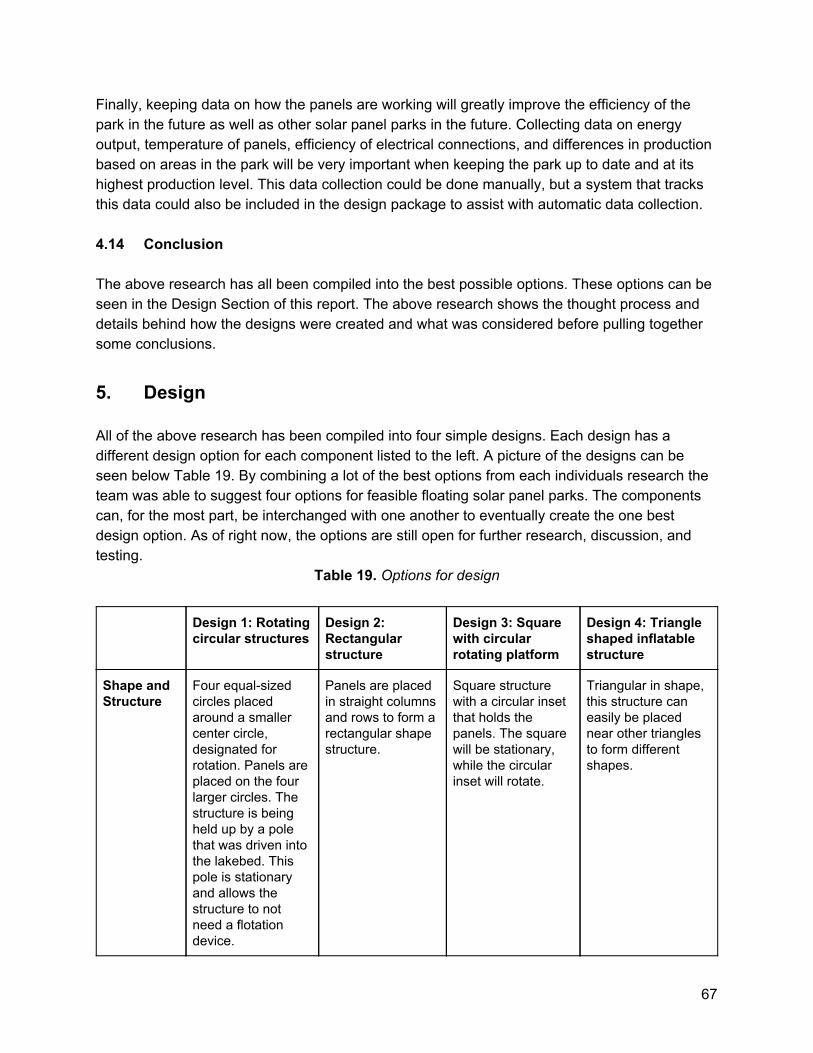
Finally, keeping data on how the panels are working will greatly improve the efficiency of the park in the future as well as other solar panel parks in the future. Collecting data on energy output, temperature of panels, efficiency of electrical connections, and differences in production based on areas in the park will be very important when keeping the park up to date and at its highest production level. This data collection could be done manually, but a system that tracks this data could also be included in the design package to assist with automatic data collection. 4.14 Conclusion The above research has all been compiled into the best possible options. These options can be seen in the Design Section of this report. The above research shows the thought process and details behind how the designs were created and what was considered before pulling together some conclusions. 5. Design All of the above research has been compiled into four simple designs. Each design has a different design option for each component listed to the left. A picture of the designs can be seen below Table 19. By combining a lot of the best options from each individuals research the team was able to suggest four options for feasible floating solar panel parks. The components can, for the most part, be interchanged with one another to eventually create the one best design option. As of right now, the options are still open for further research, discussion, and testing.
Table 19. Options for design
Design 1: Rotating circular structures
Design 2: Rectangular structure
Design 3: Square with circular rotating platform
Design 4: Triangle shaped inflatable structure
Shape and Structure
Four equal-sized circles placed around a smaller center circle, designated for rotation. Panels are placed on the four larger circles. The structure is being held up by a pole that was driven into the lakebed. This pole is stationary and allows the structure to not need a flotation device.
Panels are placed in straight columns and rows to form a rectangular shape structure.
Square structure with a circular inset that holds the panels. The square will be stationary, while the circular inset will rotate.
Triangular in shape, this structure can easily be placed near other triangles to form different shapes.
67
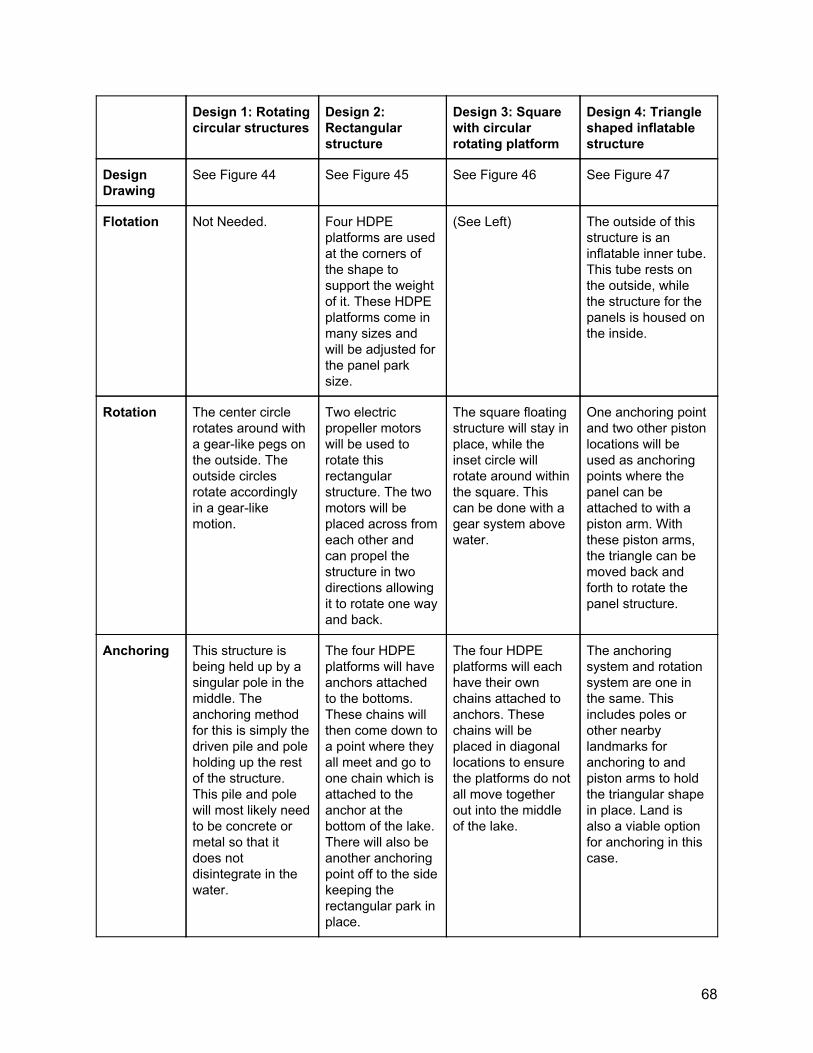
Design 1: Rotating circular structures
Design 2: Rectangular structure
Design 3: Square with circular rotating platform
Design 4: Triangle shaped inflatable structure
Design Drawing
See Figure 44 See Figure 45 See Figure 46 See Figure 47
Flotation Not Needed. Four HDPE platforms are used at the corners of the shape to support the weight of it. These HDPE platforms come in many sizes and will be adjusted for the panel park size.
(See Left) The outside of this structure is an inflatable inner tube. This tube rests on the outside, while the structure for the panels is housed on the inside.
Rotation The center circle rotates around with a gear-like pegs on the outside. The outside circles rotate accordingly in a gear-like motion.
Two electric propeller motors will be used to rotate this rectangular structure. The two motors will be placed across from each other and can propel the structure in two directions allowing it to rotate one way and back.
The square floating structure will stay in place, while the inset circle will rotate around within the square. This can be done with a gear system above water.
One anchoring point and two other piston locations will be used as anchoring points where the panel can be attached to with a piston arm. With these piston arms, the triangle can be moved back and forth to rotate the panel structure.
Anchoring This structure is being held up by a singular pole in the middle. The anchoring method for this is simply the driven pile and pole holding up the rest of the structure. This pile and pole will most likely need to be concrete or metal so that it does not disintegrate in the water.
The four HDPE platforms will have anchors attached to the bottoms. These chains will then come down to a point where they all meet and go to one chain which is attached to the anchor at the bottom of the lake. There will also be another anchoring point off to the side keeping the rectangular park in place.
The four HDPE platforms will each have their own chains attached to anchors. These chains will be placed in diagonal locations to ensure the platforms do not all move together out into the middle of the lake.
The anchoring system and rotation system are one in the same. This includes poles or other nearby landmarks for anchoring to and piston arms to hold the triangular shape in place. Land is also a viable option for anchoring in this case.
68

Design 1: Rotating circular structures
Design 2: Rectangular structure
Design 3: Square with circular rotating platform
Design 4: Triangle shaped inflatable structure
Cooling Systems
A coating could be used on the panels to reduce the heating effect they will receive from being used all day.
Forced air is a possible method for cooling the panels down. This would mean that the air blowing past the panel would be directed to it could cool each panel.
A spraying system can be established near the front of every so many rows in an attempt to cool down the panels.
A trickling system works best for this design as not all panels are in a straight row. The trickling method allows each panel to be cooled down directly without needing to put them around a certain cooling system.
The designs above can now be visualized in the following design drawings. Please note that the mirrors that were in the research section can be placed on any of these floating panel park designs and thusly have not been added to the table above. The main mirror techniques hoping to be used and tested include Fresno-lensing and the V-trough method.
Figure 44. Design 1: Rotating circular structures
Figure 45. Design 2: Rectangular structure
69

Figure 46. Design3: Square with circular rotating platform
Figure 47. Design 4: Triangle shaped inflatable structure
These four main designs came from pulling together all of the research done on floating solar panel parks and their main components. The components themselves are interchangeable, but some do depend on other portions. Like the anchoring method depends greatly on the floating structure and so on. From here, the components will be analyzed through more research, energy and cost analyses, and possible testing to see which of the options for each components is the best. From this analysis, a final best option will be designed and proposed to Wärtsilä. 6. Results The Floating Ideas Team is currently in the process of revising and finalizing the prototype design for the Floating Solar Panel Park project. Going forward, the team plans to test the prototype design in different locations in Vaasa, Finland to estimate the yearly power output and efficiency of the solar panel prototype. The data will then be simulated and analyzed to a full-scale floating solar park to determine the feasibility of floating solar park technology in Finland. In addition to the final design and testing of the product, an economic analysis will be started. This analysis will include cost of manufacturing the solar panel park as well as energy costs and
70
savings had from implementing such a project. And finally, an environmental impact assessment will be completed to estimate the possible impacts this kind of project will have on the environment. 7. Conclusion The Floating Ideas Team has throughout the beginning of this EPS semester accomplished much in terms of setting up the team, researching, and combining researched components into a few simple designs. The Floating Ideas Team started with the basics by forming their team and set up a system for managing the project throughout the semester. To start, team roles were researched to help better develop the team. The team had multiple repeats of personality meaning that sometimes the team members might have to shift out of their comfort zone to fill another needed team role. After determining team characteristics, a team contract and other team agreements such as the mission, vision, and objectives of this project were made. The main mission for this project being to create an economically, socially, and environmentally feasible floating solar energy source for Northern Europe first concentrated in Vaasa, Finland and then extended to other locations with similar latitudes. This mission is what started the team on the track to detailing their work breakdown structure and consequently their schedule and RACI Matrix. In all three of these documents, the work was broken into three main sections, with one extra managerial section to help with deadlines. The main three sections are research, design, and testing. With these three sections of the project being the most important, the team decided that by the time the midterm report was to be handed in, all of the research had to be done and a design had to be close to being decided upon. The research that the team did included many aspects of typical floating solar panel park. Weather was considered first. With Vaasa, Finland being cold and snowy for a portion of the year, and with the amount of shortwave solar radiation making it to the ground being very low during that same time of year, it was concluded that the panel park should not be set up to require extra additions or maintenance to ensure they are clear and working in the winter. The panels will need to be working efficiently from March until October to collect as much solar radiation as possible, but from October until March it doesn’t matter much to make sure they are clear of snow. The type of panel being used in this solar park will be monocrystalline panels due to the fact that they are a mix of better efficiency with a small increase in price. Most often with the other panel types the cost overrides the added efficiency or they don’t have very good efficiency, leading the team to decide on the monocrystalline monofacial panel. After deciding on a type of panel, it was easier to research and simulate the best placement of these panels. Due to a shadowing effect, it was simulated that placing the panels approximately 2.07, 4.37, and 7.54 meters apart would ensure that the panels would get more sun. Additionally, placing the panels sideways was also simulated and determined to be the best mode for placing the panels in the park.
71

Beyond just the panels there are a lot of other components that go into making a solar park work and be efficient to offset its original costs. To do this, efficiency influencers were researched. The first “influencer” being solar tracking. Solar tracking is a must in Finland. With the sun being in the sky for different periods of the day and at vastly different heights in the sky depending on season, solar tracking would help to ensure that the panels in the park would be facing the sun as much as possible. Another device that could greatly help increase the efficiency of the panel park would be mirrors and other solar concentrators. These devices help direct the sun more squarely at the panels or increase the amount of sun being shone at them. The best options for mirrors/concentrators are Fresnel Lenses and V-Troughs. Both of these devices are proven to work in many cases, thus making it difficult to choose one for a specific design. If mirrors/concentrators are used, there is the fear that with the added solar insolation, the panels will heat up too much and become less efficient. Because of this, multiple cooling systems were researched and fit to a design. The main cooling systems researched were the water veil, water sprinkler, forced water circulation, forced air circulation, and the use of a transparent coating. Each cooling system has its own advantage, but with the lake being right underneath the park, the water options seem to slightly have an advantage. More research will need to be done to choose the best option. The structure is the last portion of the design. Many materials and designs were researched to make the actual floating structure of this design. The materials for this project were specially considered. With this structure being in the water and being subjected to freeze/thaw cycles, the material has to be tough and resistant to corrosion. The best products found to combat some of these special needs were the polysurf pontoons by Swimsol and the PE-HD floating pontoons. These products are able to withstand water, since they are used for swimming docks and other floating platforms frequently. They are also flexible and would be able to freeze within the ice without breaking. In addition to the floating structure, there needs to be an anchoring system as well as a rotation system. These two go hand-in-hand and are dependent upon one another. This means that with the two types of rotation, above water and below water, the anchoring systems would most likely be different. For above water rotation such as gear-like movements above the water, a stationary anchoring system would be wanted. This could include a driven pile and pole, an anchor with a secondary tie-up location, or anchors set at two locations and strung away from each other. For below water rotation, such as motor options, a very different set up is needed. For below water rotation, the whole structure rotates, requiring the anchors to allow some rotation. This kind of anchoring system could look like four anchor chains coming to meet as one anchor or having two set anchor with are strung each other. For visualization, the pictures in the research section of this report should be referenced. In the end, the team took all of the information that they researched and compiled it into four unique designs. The designs themselves can be referenced in the design section of this report. From here, the team plans to do an energy balance analysis to determine which components of each design would perform best in Vaasa, Finland. With this study done, the team can further compile the best components into a final design which will then be tested and then simulated to
72

see how a large, 1 MW solar park would behave. Beyond these tests, the team also plans to do an economic and environmental analysis for this floating solar park. After that, the team should be able to propose a final product design to Wärtsilä for possible manufacturing and implementation.
73

REFERENCES
Average Weather in Vaasa Finland Year Round. (n.d.). Retrieved from https://weatherspark.com/y/87765/Average-Weather-in-Vaasa-Finland-Year-Round Belis G., Cortes Martin A., De Oliveira M., Vrignon P., Winters R. (May 18, 2018), “Floating Solar Panel Final Report,” Novia University of Applied Sciences.
Best Way to Clean Solar Panels. (n.d.). Retrieved from https://energyinformative.org/solar-panel-cleaning/ Cleaning and Maintenance Tips for Solar Panels. (n.d.). Retrieved from https://www.greenmatch.co.uk/blog/2016/04/cleaning-and-maintenance-tips-for-solar-panels Floating Power Plant - Invest in the future of energy. (n.d.). Retrieved from http://www.floatingpowerplant.com/ How to Anchor a Dock System [Review]. (n.d.). Home Depot. Retrieved March 10, 2019, from https://images.homedepot-static.com/catalog/pdfImages/7b/7b3ad166-3238-478e-9405-ae8e4ac2666b.pdf Knier G. (August 6, 2008), “How Do Photovoltaics Work?” Retrieved from https://science.nasa.gov/science-news/science-at-nasa/2002/solarcells Solar Energy Technologies Office. (August 16, 2013), “Solar Photovoltaic Cell Basics,” U.S. Department of Energy. Retrieved from https://www.energy.gov/eere/solar/articles/solar-photovoltaic-cell-basics Stapleton, G., & Neill, S. (2012). Grid-connected solar electric systems: The Earthscan expert handbook for planning, design and installation. Abingdon, Oxon: Earthscan. Lighting Research Center. (July, 2006), “How do PV panels or PV cells work?” Rensselaer Polytechnic Institute. Retrieved from https://www.lrc.rpi.edu/programs/nlpip/lightinganswers/photovoltaic/04-photovoltaic-panels-work.asp Alternative Energy Tutorials. (2019), “Solar Cell I-V Characteristic,”. Retrieved from http://www.alternative-energy-tutorials.com/energy-articles/solar-cell-i-v-characteristic.html Solar Research. (2018), “Solar Grid and Systems Integration,” The National Renewable Energy Laboratory. Retrieved from https://www.nrel.gov/solar/index.html Oni B. (February 9, 2017), “Solar a Energy: Advantages And Disadvantages,” Tile Energy. Retrieved from https://www.tileenergy.uk/solar-a-energy-advantages-and-disadvantage Prouvost B. (September 25, 2017), “Inside the World of Floating Solar Technology,” Distributed Energy. Retrieved from https://foresternetwork.com/distributed-energy-magazine/solar/flotovoltaics/ DOE/NREL. (January 8, 2019), “Great Potential for Floating Solar Photovoltaics Systems,” Science Daily. Retrieved from https://www.sciencedaily.com/releases/2019/01/190108125422.htm
74

Thi N. (July 16, 2017), “The Evolution of Floating Solar Photovoltaics,” Research Gate. PDF. The World Bank. (October 30, 2018), “Growing Exponentially, Floating Solar Opens Up New Horizons for Renewable Energy: Report,”. Retrieved from https://www.worldbank.org/en/news/press-release/2018/10/30/floating-solar-opens-new-horizons-for-renewable-energy Wärtsilä. (2019), “ Wärtsilä in Finland,”. Retrieved from https://www.wartsila.com/fin Honsberg, C. H., & Bowden, S. B. (n.d.). Shading | PVEducation. Retrieved March 19, 2019, from https://www.pveducation.org/pvcdrom/modules-and-arrays/shading Bagher, A. M. (n.d.). Types of Solar Panels (2019) | GreenMatch. Retrieved March 20, 2019, from https://www.greenmatch.co.uk/blog/2015/09/types-of-solar-panels Rosa-Clot M., Tina G. M., (2018), “Submerged and Floating Photovoltaic Systems,” Elsevier Inc. Retrieved from https://books.google.fi/books?id=OOLWDgAAQBAJ&pg=PA110&lpg=PA110&dq=water+veil+cooling+system&source=bl&ots=8q5tHaS1SI&sig=ACfU3U079xe5xBUzDeI9EYrZrDEECY8cnQ&hl=en&sa=X&ved=2ahUKEwiz1pPYp5HhAhVD2aYKHcFQAQUQ6AEwBnoECAgQAQ#v=onepage&q=water%20veil%20cooling%20system&f=false Siecker J., Kusakana K., Numbi B. P., (November 2017), “A review of solar photovoltaic systems cooling technologies,” ELSEVIER. PDF document. Photovoltaic Solar Electricity Potential in European Countries [Photograph]. (n.d.). Li W., Shi Y., Chen K., Zhu L., Fan S., (2017), “A Comprehensive Photonic Approach for Solar Cell Cooling,” ACS Photonics. Retrieved from https://pubs.acs.org/doi/abs/10.1021/acsphotonics.7b00089 Alfons Oebbeke, A. O. (2008, 23. Juli). Fluoreszenzkollektoren: Mit Weltrekord zurück aus der Mottenkiste. Retrieved on March 11, 2019, from https://www.baulinks.de/webplugin/2008/1241.php4 Altmeppen, K. D., Zschaler, F., Zademach, H. M., Böttigheimer, C., & Müller, M. (2017). Nachhaltigkeit in Umwelt, Wirtschaft und Gesellschaft: Interdisziplinäre Perspektiven. Wiesbaden, Deutschland: Springer Fachmedien Wiesbaden. Apex IT Group. (o.D.). Optimierungs- und Verstärkungstechniken. Retrieved March 10, 2019, from http://www.apex-portal.com/ecosolutions/analyse-derexergie/sonne_verstaerkungstechnik.php Esolutions Company. (o.D.). Solar Konzentratoren | Solar trackers | Beiderseitige Solarplatten | Mobiles Fotovoltaiksystem. Retrieved March 9, 2019, from http://www.solar-trackers.com/de/solar-concentrators.asp Fraunhofer ISE. (o.D.). Current Status of Concentrator Photovoltaic (CPV) Technology. Retrieved March 9, 2019, from https://www.ise.fraunhofer.de/content/dam/ise/de/documents/publications/studies/cpv-report-ise-nrel.pdf
75

Konstantin, P. (2017). Praxisbuch Energiewirtschaft: Energieumwandlung, -transport und -beschaffung, Übertragungsnetzausbau und Kernenergieausstieg (4. Aufl.). Berlin, Deutschland: Springer Berlin Heidelberg. Kyocera. (o.D.). KYOCERA TCL Solar Begins Construction on 13.7MW Floating Solar Power Plant; Company’s fourth floating solar project, world’s largest, will be built on Japan’s Yamakura Dam reservoir | News Releases | KYOCERA. Retrieved March 19, 2019, from https://global.kyocera.com/news/2016/0102_knds.html Powalla, M. P. Prof. Dr.-Ing.. (o.D.). ZSW: Dünnschichtsolarzellen und -module. Retrieved March 19, 2019, from https://www.zsw-bw.de/forschung/photovoltaik/themen/duennschichtsolarzellen-und-module.html PV Education. (o.D.). Bypass Diodes | PVEducation. Retrieved March 10, 2019, from https://www.pveducation.org/pvcdrom/modules-and-arrays/bypass-diodes Miloni, R. P. M. R.P.. (2014, 1. März). Adaptive Photovoltaik. Retrieved March 6, 2019, from http://www.solventure.ch/adaptive_photovoltaik.pdf Rolf Hug, R. H. (o.D.). Solar-Report | Konzentrator-Photovoltaik bringt die Sonne auf den Punkt - SolarServer. Retrieved March 10, 2019, from https://www.solarserver.de/solar-magazin/solar-report/konzentrator-photovoltaik-bringt-die-sonne-auf-den-punkt.html Stefan Glunz, S. G. (o.D.). Stand und Perspektiven der Photovoltaik. Retrieved March 9, 2019, from http://www.fze.uni-saarland.de/AKE_Archiv/DPG2005-AKE_Berlin/Buch/DPG2005_AKE4.3Glunz_Stand%20und%20Perspektiven%20der%20Photovoltaik_final.pdf Sven Vörtmann - Internet und IT Service, TYPO3, S. V. (o.D.). Konzentrator. Abgerufen March 8, 2019, von https://www.energie-experten.org/erneuerbare-energien/solarenergie/solarzelle/konzentrator.html Wesselak, V., & Voswinckel, S. (2012). Photovoltaik: Wie Sonne zu Strom wird. Berlin, Deutschland: Springer Berlin Heidelberg. Domininghaus, Hans. 2012. Kunststoffe. Herausgegeben von Peter Elsner, Peter Eyerer, und Thomas
Hirth. Berlin, Heidelberg: Springer Berlin Heidelberg
Förstner, Ulrich. 2012. Umweltschutztechnik. Berlin, Heidelberg: Springer Berlin Heidelberg.
Umweltbundesamt. 2017. „Phthalate: PVC-Weichmacher mit Gesundheitsrisiko“. Retrieved March 19,
2019. http://www.umweltbundesamt.at/umweltsituation/schadstoff/pvcweichmacher/.
76

Windsperger, Andreas, Brigitte Windsperger, und Richard Tuschl. 2007. „Die aktuelle Situation des
Werkstoffs Weich-PVC in den relevanten Themenbereichen“. PVC Heute. Institut für industrielle Ökologie
Smadja, Judith, und Paul Smadja. 2017. „4cSolar - Floatracker, Water treatment, Nearshore, Open sea“.
4csolar. Retrieved March 08, 2019. https://www.4csolar.com
Ciel et terre. 2017. „Ciel et terre“. Ciel & Terre. Retrieved March 06, 2019. http://www.ciel-et-terre.net/.
Cogley, J. Graham. 1979. „The Albedo of Water as a Function of Latitude“. Monthly Weather Review 107
(6): 775–81
Kyocera. 2017. „KYOCERA TCL“. Retrieved March 08, 2019.
http://global.kyocera.com/news/2016/0102_knds.html.
Heliofloat GmbH. (o.D.). Heliofloat Platform Technology. Retrieved March 14, 2019, from https://www.heliofloat.com/index.php?id=17 Kriechhammer, S. K. (2017). Master Thesis Technikfolgenabschätzung von schwimmenden Solaranlagen (Eine energetische und ökologische Betrachtung). Abgerufen von https://zidapps.boku.ac.at/abstracts/download.php?dataset_id=17079&property_id=107 Ocean Sun. (o.D.). Products | Ocean Sun. Retrieved March 19, 2019, from https://oceansun.no/products/ Statkraft picks Ocean Sun for €2.3M solar park in Albania. (o.D.). Retrieved March 18, 2019, from https://www.aa.com.tr/en/energy/general/statkraft-picks-ocean-sun-for-23m-solar-park-in-albania/23816 Nadia AL-Rousan, AL-Rousan Mohammad, Shareiah Adnan, Hazem AL-Najjar. Choosing the efficient tracking method for real time tracking system in Jordan and it's neighbors to get maximum gained power based on experimental data. In: Proceedings of international conference on renewable energy research and applications (ICRERA); 2012. IEEE. Birol F. World energy prospects and challenges. Aust Econom Rev 2006;39(2):190–5. Smith CL. The energy challenge. Appl Petrochem Res 2012;2(1-2):3–6. Jazayeri K, Uysal S, and Jazayeri M. MATLAB/simulink based simulation of solar incidence angle and the sun's position in the sky with respect to observation points on the Earth. In: Proceedings of international conference Duffie JA, Beckman WA. Solar engineering of thermal processes 3. New York: Wiley; 2013https://books.google.com.my/books?hl=en&lr=&id= Q1tjDQAAQBAJ&oi=fnd&pg=PR17&dq=Solar+engineering+of+thermal+processe&ots=Zj8QiteyOC&sig=i
77

PL_N9_McVorH__5Rl5AMPj4c4&redir_esc=y#v=onepage&q=Solar%20engineering%20of%20thermal%20processe&= false Al-Naima, F., & Yaghobian, N. (1990). Design and construction of a solar tracking system. Solar & Wind Technology, 7(5), 611-617. https://doi.org/10.1016/0741-983x(90)90072-a AL-Rousan, N., Isa, N. A. M., & Desa, M. K. M. (2018). Advances in solar photovoltaic tracking systems: A review. Renewable and Sustainable Energy Reviews, 82, 2548–2569. https://doi.org/10.1016/j.rser.2017.09.077 Rosa-Clot, M. R. C., Rosa-Clot, P. R. C., Tina, G. M. T., & Ventura, C. V. (2017, 1. Oktober). RAST: RoundAbout Solar Tracking. Retrieved March 18, 2019, from https://www.sciencedirect.com/science/article/pii/S1876610217347082 Tharamuttam, J. K. T., & Ng, A. K. N. (2017, 1. Dezember). Design and Development of an Automatic Solar Tracker. Retrieved March 19, 2019, from https://www.sciencedirect.com/science/article/pii/S1876610217365025 Askari Mohammad Bagher, Mirzaei Mahmoud Abadi Vahid, Mirhabibi Mohsen. Types of Solar Cells and Application. American Journal of Optics and Photonics. Vol. 3, No. 5, 2015, pp. 94-113. doi: 10.11648/j.ajop.20150305.17 Pictures Chris, A. (o.D.). Type of concentrated solar power – Wikimedia Commons [Bild/Grafik]. (2011,24. November). Retrieved March 10, 2019, https://commons.wikimedia.org/wiki/File:Type_of_Concentrated_solar_power.png Fedkin, M. F. (o.D.). 5.1. What are concentrating photovoltaics? | EME 812: Utility Solar Power and Concentration [Bild/Grafik]. Retrieved March 9, 2019, from https://www.e-education.psu.edu/eme812/node/537 Rolf Hug, R. H. (o.D.). Solar-Report | Konzentrator-Photovoltaik bringt die Sonne auf den Punkt - SolarServer [Bild/Grafik]. Retrieved March 8, 2019, from https://www.solarserver.de/solar-magazin/solar-report/konzentrator-photovoltaik-bringt-die-sonne-auf-den-punkt.html Archimedes Solar GmbH (o.D.). Solar-Report | Konzentrator-Photovoltaik bringt die Sonne auf den Punkt - SolarServer [Bild/Grafik]. Retrieved March 8, 2019, from https://www.solarserver.de/solar-magazin/solar-report/konzentrator-photovoltaik-bringt-die-sonne-auf-den-punkt.html Klotz, F. H. K. (o.D.). Querschnitt des PV V-Troges [Bild/Grafik]. Retrieved March 10, 2019, from http://www.fvee.de/fileadmin/publikationen/Themenhefte/th1996/th1996_02_07.pdf Vega Energy. (o.D.). Alluminio - ALMECO GROUP [Bild/Grafik]. Retrieved March 7, 2019, from http://www.almecogroup.com/uploads/1011-tinox_energy_WR__0002_schema_vega_energy_wr_eng.jpg
78
Sahu, A. S., Yadav, N. Y., & Sudhakar, K. S. (2015) [Bild/Grafik]. Floating photovoltaic power plant: A review. Renewable and Sustainable Energy Reviews, , 6. Rosa-Clot, M. R. C., & Tina, G. M. T. (2018) [Bild/Grafik]. The Floating PV Plant. Submerged and Floating Photovoltaic Systems, 89–136. https://doi.org/10.1016/b978-0-12-812149-8.00005-3 Ocean Sun. (o.D.). Statkraft picks Ocean Sun for €2.3M solar park in Albania [Bild/Grafik]. Retrieved March 20, 2019, from https://www.aa.com.tr/en/energy/general/statkraft-picks-ocean-sun-for-23m-solar-park-in-albania/23816
RAST: RoundAbout Solar Tracking [Bild/Grafik]. (2017, 1. Oktober). Retrieved March 16, 2019, from https://www.sciencedirect.com/science/article/pii/S1876610217347082 AL-Rousan, N., Isa, N. A. M., & Desa, M. K. M. (2018b) [Bild/Grafik]. Advances in solar photovoltaic tracking systems: A review. Renewable and Sustainable Energy Reviews, 82, 2548–2569. https://doi.org/10.1016/j.rser.2017.09.077 Castanheira A., Fernandes J., Branco C., (February 1, 2018). “Demonstration project of a cooling system for existing PV power plants in Portugal,” ScienceDirect. Retrieved from https://www.sciencedirect.com/science/article/pii/S0306261917316859 Record-Low Solar Bid From ACWA Power For 1st Utility-Scale Renewable Energy Project In Saudi Arabia. February 6th, 2018 by Joshua S Hill https://cleantechnica.com/2018/02/06/acwa-power-develop-first-ever-utility-scale-renewable-project-saudi-arabia-record-breaking-tariff/ Bi-facial Solar Panels, By Kelly Pickerel, April 2, 2018. https://www.solarpowerworldonline.com/2018/04/what-are-bifacial-solar-modules/ Test to compare of snow-shedding rates between tilt angles and study the bifacial advantage. St Lawrence College Project, 2017. http://www.silfabsolar.com/the-bifacial-advantage/ Solar works in cold weather. By Manish Nayar, CEO, OYA Solar, By SPW | February 5, 2019. https://www.solarpowerworldonline.com/2019/02/solar-works-in-cold-weather/ Huainan, the Largest Floating Solar Farm in the World, 11 JUL. 2018. https://www.planete-energies.com/en/medias/close/huainan-largest-floating-solar-farm-world Architecture and constructions in extreme climate zones, F. Pfenniger http://www.arquitecturaenacero.org/uso-y-aplicaciones-del-acero/soluciones-constructivas/arquitectura-y-construcciones-en-zonas-de
79

APPENDICES Appendix A: Team Contract
TEAM CONTRACT
Project: Floating Solar Panels Group members: Carlos Martin Delgado, Laura Ripoll Albaladejo, Stephan Fischer, Elizabeth Larsen, Amber Kauppila Valid dates: February to May (both included) PROJECT VISION We want to learn in this project as much as possible, in our fields and outside of them. We expect to do our best, keep the project interesting during all the semester. The final grade we get is not the most important part of the project if we did our best. ELEMENTS OF EFFECTIVE TEAMWORK
Communication 1. Free ideas. Everyone can express her/his idea without been judge. 2. listening to each other. When someone is speaking we have to listen to her/him and
pay attention (don’t be looking at the phone) 3. Try to make an effective non judgmental feedback. 4. No “cross talking” is allowed. This means not interrupting when someone else is
talking. 5. In the event that a group member or members are dominating the group, it’s the
time keeper’s job to politely interrupt them (this is when you can interrupt) and ask that someone else speak.
6. Keeping the other team members informed. 7. First understand, and then be understood to apply to all team members. 8. Use visual means like drawings, charts, as well as tables in order to facilitate
discussion. (Good when we present each others the work we have done).
Participation 1. initiative in participating in the group tasks, especially in areas where they may have
strengths. 2. Ask for help when needed and if you can help someone because of your strengths
you should do it. 3. members need to make concerted efforts to be available for meetings. 4. Each team member needs to be honest as well as open. 5. Encourage a diversity of opinions on all topics. 6. Everyone given the opportunity for equal participation in whatever type of work, not
only in her/his specific field.
80

7. Focus on what is best for the team as a whole. The team has to be bigger than an individual team player. The interests of the team have to come first. Besides, care has to be taken that the interests of the team and the team players are in synergy and do not clash.
Organization
1. All the group work will be shared in Google Drive. 2. We will use Trello to organize our work.
Procedure
1. Each group member agrees to show up to class and to outside group meetings on time. If someone is late more than 5 minutes will have to bring coffee/tee for the rest of the members.
2. Group members can be late (like 30 minutes or 1 hour) to a meeting if it was noticed before or it can be justified. If a group member is late without notifying will have to prepare dinner for all the group next weekend.
3. All members have to respect deadlines. 4. Everyone should be accountable with her/his work.
WORK PLANNING
1. We will meet every morning during the week at school to work in the project. 2. We will share and explain what we have been doing for the project at least once a week. We
will choose TEAM ACTIVITY PLAN We will do an activity together once a week like having dinner, going to ice hockey or bowling. CRITICAL REVIEW DATES 21/03/2019 - Send midterm report to Mikael and Sören 26/03/2019 - Midterm presentation 09/05/2019 - Send final report to Mikael and Sören 14/05/2019 - Final presentation CONTRACT AGREEMENT This is an official contract. Once you have signed it you are accountable. Name: Carlos Martin Delgado Date: 08/02/2019 Name: Laura Ripoll Albaladejo Date: 08/02/2019 Name: Stephan Fischer Date: 08/02/2019 Name: Elizabeth Larsen Date: 08/02/2019 Name: Amber Kauppila Date: 08/02/209
81

Appendix B: Figures
Figure 1. Full Work Breakdown Structure
82

Figure 2. Full project schedule
83