middlesex university research repository - …eprints.mdx.ac.uk/13056/1/emokoro_thesis.pdf ·...
TRANSCRIPT
Middlesex University Research Repository:
an open access repository of
Middlesex University research
http://eprints.mdx.ac.uk
Okoro, Efeosasere Moibi, 2014. A study of different representation
conventions during investigatory sensemaking. Available from Middlesex
University’s Research Repository.
Copyright:
Middlesex University Research Repository makes the University’s research available electronically.
Copyright and moral rights to this thesis/research project are retained by the author and/or
other copyright owners. The work is supplied on the understanding that any use for
commercial gain is strictly forbidden. A copy may be downloaded for personal, non-
commercial, research or study without prior permission and without charge. Any use of the
thesis/research project for private study or research must be properly acknowledged with
reference to the work’s full bibliographic details.
This thesis/research project may not be reproduced in any format or medium, or extensive
quotations taken from it, or its content changed in any way, without first obtaining permission
in writing from the copyright holder(s).
If you believe that any material held in the repository infringes copyright law, please contact
the Repository Team at Middlesex University via the following email address:
The item will be removed from the repository while any claim is being investigated.

A STUDY OF
DIFFERENT REPRESENTATION CONVENTIONS
DURING INVESTIGATORY SENSEMAKING
A THESIS
SUBMITTED TO THE SCHOOL OF SCIENCE AND TECHNOLOGY,
MIDDLESEX UNIVERSITY, LONDON,
IN PARTIAL FULFILMENT OF THE REQUIREMENTS
FOR THE DEGREE OF
MASTERS OF SCIENCE (BY RESEARCH)
EFEOSASERE MOIBI OKORO
DECEMBER, 2013
Supervisor: Dr. Simon Attfield Programme Leader: Dr. Kai Xu

ii
Abstract
Background
During the process of conducting investigations, users structure information externally to
help them make sense of what they know, and what they need to know. Software-based
visual representations may be a natural place for doing this, but there are a number of types
of information structuring that might be supported and hence designed for. Further, there
might be important differences in how well different representational conventions support
sensemaking. There are questions about what type of representational support might allow
these users to be more effective when interacting with information.
Aim
To explore the impact that different types of external representational structuring have on
performance and user experience during intelligence type investigations. Intelligence
analysis represents a difficult example domain were sensemaking is needed. We have a
particular interest in the role that timeline representations might play given evidence that
people are naturally predisposed to make sense of complex social scenarios by constructing
narratives. From this we attempt to quantify possible benefits of timeline representation
during investigatory sensemaking, compared with argumentation representation.
Method
Participants performed a small investigation using the IEEE 2011 VAST challenge dataset in
which they structured information either as a timeline, an argumentation or as they wished
(freeform). 30 participants took part in the study. The study used three levels of a between
participants independent variable of representation type. The dependent variables were
performance (in terms of recall, precision efficiency and understanding) and user experience
(in terms of cognitive load, engagement and confidence in understanding).
Result
The result shows that the freeform condition experienced a lower cognitive load than the
other two: timeline and argument respectively. A post hoc exploratory analysis was
conducted to better understand the information behaviour and structuring activities across
conditions and to better understand the types of structuring that participants perform in the
freeform condition. The analysis resulted in an Embedded Representational Structuring

iii
Theory (ERST) that helps to characterise and describe representations primarily in terms of
their elements and their relations.
Conclusion
The results suggest that: (a) people experienced lower cognitive load when they are free to
structure information as they wish, (b) during their investigations, they create complex
heterogeneous representations consisting of various entities and multiple relation types and
(c) their structuring activities can be described by a finite set of structuring conventions.

iv
Declaration
I, Efeosasere Moibi Okoro, hereby declare that this thesis entitled, “A Study of Different
Representation Conventions during Investigatory Sensemaking” is my own work, and that all
the sources I have used or quoted have been indicated or acknowledged by means of
completed reference
Efeosasere Moibi Okoro

v
Dedication
My Mother
Mrs. Abigail U. Okoro
“My mother was the making of me.
She was so true, so sure of me, and I felt I had some one to live for,
some one I must not disappoint” Thomas Edison

vi
Acknowledgement
This thesis has been the most enormous but yet the most interesting “thing” I have ever had
to do and there would have been no way I would have been able to do this without the help
of the following persons.
I am pleased to thank Dr. Simon Attfield who acted as my supervisor throughout the course
of this thesis, for his endless efforts and encouragements. Thank you for pushing me beyond
my very self and believing in me.
To Neesha, Chris and Tinni who contributed greatly to the construction of the study of this
thesis and to Professor William Wong for his great feedbacks, advice and interest in my
work. Also not forgetting my very good colleagues; Ivo, Phong, Young, Rick and Joshua who
have been with me from the start of this course till finish. I really appreciate you all.
To Damien, Sogie, Dorcas, Anthony and Nil who have been family to me from my
undergraduate days, I am very grateful for your friendship till this day and to Victoria “Na-na”
for all your encouragements.
To Dad, Mum and Ese for all your emotional support, encouragements and motivations. I
would not have asked for a better family and to God Almighty for your grace and faithfulness,
You see my heart, I am indeed grateful “Not unto me, Oh Lord, not unto me”.

vii
Publications related to this thesis
Chapin, L., Attfield, S., & Okoro, E. M. (2013). Predictive Coding, Storytelling and God:
Narrative Understanding in e-Discovery. Presented at the DESI V Workshop,
Consiglio Nazionale delle Ricerche, Rome, Italy. Retrieved from
http://www.umiacs.umd.edu/~oard/desi5/Chapin-final.pdf
viii
Table of contents
1 INTRODUCTION AND BACKGROUND 3
1.1 BACKGROUND 3
1.2 PROPOSED STUDY 3
1.3 THESIS OUTLINE 5
2 LITERATURE REVIEW 7
2.1 SENSEMAKING 7
2.1.1 THE FRAME AND THE DATA FRAME THEORY OF SENSEMAKING 9
2.1.2 REPRESENTATION 10
2.1.3 RE-REPRESENTATION 12
2.2 ARGUMENT STRUCTURING AND MAPPING 13
2.2.1 WHATELY DIAGRAMMING METHOD 14
2.2.2 WIGMORE’S CHART 15
2.2.3 TOULMIN DIAGRAMMING METHOD 18
2.3 NARRATIVE, ITS SIGNIFICANCE AND CONSTRUCTION 20
2.4 HYBRID APPROACH 22
2.5 CONCLUSION 23
3 STUDY METHOD 25
3.1 OVERVIEW 25
3.2 DESIGN 26
3.2.1 RECALL: 26
3.2.2 PRECISION: 27
3.2.3 TASK DURATION: 27
3.2.4 COGNITIVE LOAD: 27
3.2.5 UNDERSTANDING: 29
3.2.6 CONFIDENCE: 29
3.2.7 ENGAGEMENT: 30
3.3 PARTICIPANTS 30
3.4 MATERIALS 31
3.5 PROCEDURE 32
ix
3.5.1 TRAINING 32
3.5.2 TASK 33
3.5.3 DATA COLLECTION 34
3.5.4 DEBRIEF 34
4 STUDY FINDINGS 36
4.1 TEST OF SIGNIFICANCES AND EFFECT SIZE 39
4.1.1 DURATION 39
4.1.2 PRECISION AND RECALL COMPARISON 40
4.1.3 UNDERSTANDING 43
4.1.4 CONFIDENCE 44
4.1.5 COGNITIVE LOAD 45
4.1.6 ENGAGEMENT 47
4.2 SUMMARY OF THE STUDY FINDINGS 48
5 POST HOC EXPLORATORY ANALYSIS 50
5.1 OVERVIEW 50
5.2 ANALYSING AND COMPARING REPRESENTATIONAL STRUCTURING ACROSS CONDITIONS OVER TIME 50
5.2.1 CODING SCHEME 51
5.2.2 ACTIVITY TIMELINE GRID 52
5.2.3 EXPLORING USER-GENERATED REPRESENTATIONS IN INVESTIGATORY SENSEMAKING TASKS 55
5.3 UNDERSTANDING THE EMBEDDING OF STRUCTURAL CONVENTIONS IN FREEFORM CONDITIONS 64
5.3.1 THE FUNCTIONAL THEORY OF EMBEDDED REPRESENTATIONAL STRUCTURING (ERST) 64
6 DISCUSSION AND CONCLUSION 84
6.1 RESULT SUMMARY AND EXPLANATION 84
6.2 EMBEDDED REPRESENTATIONAL STRUCTURE THEORY (ERST) 85
6.2.1 DESIGN SUGGESTIONS 86
6.3 STUDY LIMITATIONS 86
6.4 CONCLUSION 87
7 BIBLIOGRAPHY 89
8 APPENDICES 99
8.1 APPENDIX A: CONSENT FORM AND QUESTIONNAIRE 99
8.1.1 CONSENT FORM 99
x
8.1.2 BACKGROUND INFORMATION FORM 102
8.1.3 CERTAINTY QUESTIONNAIRE 103
8.1.4 ENGAGEMENT QUESTIONNAIRE 105
8.2 APPENDIX B: STUDY PRESENTATION SLIDES 107
8.2.1 ARGUMENT CONDITION PRESENTATION 107
8.2.2 TIMELINE CONDITION PRESENTATION 109
8.2.3 FREEFORM CONDITION PRESENTATION 110
8.3 APPENDIX C: SPSS OUTPUT 111
8.3.1 FREQUENCIES 111
8.3.2 HISTOGRAMS 112
8.3.3 KRUSKAL-WALLIS TEST FOR ALL DEPENDENT VARIABLES 116
8.3.4 MANN-WHITNEY TEST FOR THE ARGUMENT (1.0) AND FREEFORM (2.0) CONDITIONS 118
8.3.5 MANN-WHITNEY TEST FOR ARGUMENT (1.0) AND TIMELINE (3.0) CONDITIONS 120
8.3.6 MANN-WHITNEY TEST FOR FREEFORM (2.0) AND TIMELINE (3.0) CONDITIONS 122
8.3.7 KRUSKAL-WALLIS TEST FOR STRUCTURAL ACTIVITIES 124
8.3.8 KRUSKAL-WALLIS TEST FOR INFORMATION SEEKING AND BEHAVIOUR ACTIVITIES 125
8.4 APPENDIX D: ACTIVITY TIMELINE GRIDS 126
8.5 APPENDIX E: OTHER RELATIONS EXAMPLES 137
8.5.1 OTHER INFORMATION OBJECT SURROGATE RELATION EXAMPLES 137
8.5.2 OTHER TIMELINE RELATION EXAMPLES 139
8.5.3 OTHER JUSTIFICATION RELATION EXAMPLES 141

xi
Table of figures
FIGURE 2-1: NOTIONAL MODEL OF ANALYST SENSEMAKING FROM PIROLLI & CARD (2005) 8
FIGURE 2-2: SIMPLIFIED SENSEMAKING PROCESS 9
FIGURE 2-3: DATA FRAME THEORY FOR SENSE MAKING FROM KLEIN ET AL. (2006) 10
FIGURE 2-4: LEARNING LOOP COMPLEX THEORY OF SENSEMAKING 12
FIGURE 2-5: WHATELY DIAGRAMMING FROM MACAGNO ET AL (2007, P.13) 15
FIGURE 2-6: PART OF WIGMORE’S CHART FOR COMMONWEALTH V. UMILIAN FROM GOODWIN AND
FISHER (2000 P.226) 16
FIGURE 2-7: WIGMORE’S CHART SYMBOLS, LINES AND THEIR INTERPRETATION FROM WIGMORE
(1913, PP. 751–753) 16
FIGURE 2-8: EXAMPLE OF AN ARGUMENT USING TOULMIN MODEL (TOULMIN ET AL., 1979 P.77) 19
FIGURE 2-9: COMBINING NARRATIVE AND ARGUMENT, THE HYBRID MODEL FROM BEX (2010 P.2) 23
FIGURE 3-1: MEAN DURATION JUDGMENT RATIO IN THE PROSPECTIVE AND RETROSPECTIVE
PARADIGMS AS A FUNCTION OF COGNITIVE LOAD. ERROR BARS ARE THE STANDARD ERRORS
OF THE MEAN FROM (BLOCK ET AL. 2010) 28
FIGURE 3-2: GENDER DISTRIBUTION ACROSS CONDITIONS 30
FIGURE 3-3: NATIVE AND NON-NATIVE ENGLISH SPEAKERS DISTRIBUTION ACROSS CONDITIONS 31
FIGURE 3-4: ARGUMENT STRUCTURE USED BY THE PARTICIPANTS FOR THE ARGUMENT CONDITION
32
FIGURE 4-1: COGNITIVE LOAD DISTRIBUTION AND MEAN FIGURE 4-2: ENGAGEMENT DISTRIBUTION
AND MEAN 36
FIGURE 4-3: UNDERSTANDING DISTRIBUTION AND MEAN 37
FIGURE 4-4: BAR GRAPH SHOWING MEDIAN DURATION IN MINUTES WITH ERROR BARS INDICATING
THE MEDIAN ABSOLUTE DEVIATION 39
FIGURE 4-5: BAR GRAPH SHOWING MEDIAN PERCENTAGE RECALL AND PRECISION VALUES WITH
ERROR BARS INDICATING THEIR MEDIAN ABSOLUTE DEVIATION 40
FIGURE 4-6: SCATTERPLOT SHOWING THE F MEASURE VALUES FOR ALL PARTICIPANTS PER
CONDITION 41
FIGURE 4-7: BAR GRAPH SHOWING MEDIAN UNDERSTANDING WITH ERROR BARS INDICATING THE
MEDIAN ABSOLUTE DEVIATION 43
FIGURE 4-8: BAR GRAPH SHOWING MEDIAN CONFIDENCE WITH ERROR BARS INDICATING THE
MEDIAN ABSOLUTE DEVIATION 44
FIGURE 4-9 BAR GRAPH SHOWING MEDIAN COGNITIVE LOAD WITH ERROR BARS INDICATING THE
MEDIAN ABSOLUTE DEVIATION 45
FIGURE 4-10: BAR GRAPH SHOWING THE MEDIAN ENGAGEMENT WITH ERROR BARS INDICATING THE
MEDIAN ABSOLUTE DEVIATION 47
FIGURE 5-1: SAMPLE ACTIVITY TIMELINE GRID 53
FIGURE 5-2: CLUSTERED BAR CHART SHOWING THE AVERAGE PERCENTAGE TIME FOR PERFORMING
INFORMATION SEEKING AND BEHAVIOUR ACTIVITIES ACROSS CONDITIONS 53
FIGURE 5-3: CLUSTERED BAR CHART SHOWING THE AVERAGE PERCENTAGE TIME FOR PERFORMING
STRUCTURAL ACTIVITIES ACROSS CONDITIONS 54

xii
FIGURE 5-4: REPRESENTATION SHOWING ONE INFORMATION OBJECT 56
FIGURE 5-5: SYNTAX TREE SHOWING ONE INFORMATION OBJECT 56
FIGURE 5-6: REPRESENTATION SHOWING TWO INFORMATION OBJECTS 57
FIGURE 5-7: SYNTAX TREE SHOWING TWO INFORMATION OBJECTS 57
FIGURE 5-8: REPRESENTATION SHOWING ONE INFORMATION OBJECT SURROGATE AND ONE
INFORMATION OBJECT 58
FIGURE 5-9: SYNTAX TREE SHOWING ONE INFORMATION OBJECT SURROGATE AND ONE
INFORMATION OBJECT 58
FIGURE 5-10: REPRESENTATION SHOWING TWO INFORMATION OBJECT SURROGATES 59
FIGURE 5-11: SYNTAX TREE SHOWING TWO INFORMATION OBJECT SURROGATES 59
FIGURE 5-12: REPRESENTATION SHOWING MULTIPLE INFORMATION OBJECTS SURROGATES 60
FIGURE 5-13: REPRESENTATION SHOWING MULTIPLE INFORMATION OBJECTS SURROGATES IN A
THEME 60
FIGURE 5-14: SYNTAX TREE SHOWING MULTIPLE INFORMATION OBJECTS SURROGATES AND A
THEME 61
FIGURE 5-15: REPRESENTATION SHOWING COLOUR CODED THEMES 61
FIGURE 5-16: SYNTAX TREE SHOWING A TIMELINE RELATION EMBEDDED IN A THEME 62
FIGURE 5-17: SYNTAX TREE SHOWING ALL THE CONSTITUENTS OF THE USER’S REPRESENTATION 62
FIGURE 5-18: INFORMATION OBJECT SURROGATE RELATION WITH GIST AND SOURCE ELEMENTS
CREATED BY PARTICIPANT 16 69
FIGURE 5-19: SAMPLE INFORMATION OBJECT (DOCUMENT) WHEN OPENED 69
FIGURE 5-20: INFORMATION OBJECT SURROGATE RELATION WITH GIST, SOURCE AND DATE
ELEMENTS CREATED BY PARTICIPANT 9 70
FIGURE 5-21: INFORMATION OBJECT SURROGATE RELATION WITH GIST, SOURCE AND DATE
ELEMENTS CREATED BY PARTICIPANT 25 70
FIGURE 5-22: INFORMATION OBJECT SURROGATE RELATION WITH GIST, SOURCE AND DATE
ELEMENTS CREATED BY PARTICIPANT 20 71
FIGURE 5-23: TIMELINE RELATION WITH TITLE, DATE, GIST AND SOURCE ELEMENTS CREATED BY
PARTICIPANT 3 72
FIGURE 5-24: TIMELINE RELATION WITH DATE , GIST AND SOURCE ELEMENTS CREATED BY
PARTICIPANT 25 73
FIGURE 5-25: TIMELINE RELATION WITH TITLE, DATE AND SOURCE ELEMENTS CREATED BY
PARTICIPANT 7 73
FIGURE 5-26: THEMED GROUPING RELATION CREATED BY PARTICIPANT 9 USING LINES 74
FIGURE 5-27: THEMED GROUPING RELATION CREATED BY PARTICIPANT 7 USING COLOUR 75
FIGURE 5-28: EXPLANATION RELATION WITH TWO INFORMATION OBJECT SURROGATES CREATED BY
PARTICIPANT 3 77
FIGURE 5-29: EXPLANATION RELATION WITH THREE INFORMATION OBJECT SURROGATES CREATED
BY PARTICIPANT 3 78
FIGURE 5-30: JUSTIFICATION RELATION WITH A CLAIM AND EVIDENTIAL SUPPORT CREATED BY
PARTICIPANT 14 80
FIGURE 5-31: SAMPLE OF THE INFORMATION OBJECT’S CONTENT USED BY PARTICIPANT 14 TO
JUSTIFY THEIR CLAIM 80
FIGURE 5-32:JUSTIFICATION RELATION WITH SINGLE CLAIM AND MULTIPLE EVIDENTIAL SUPPORT
CREATED BY PARTICIPANT 14 81

xiii
FIGURE 5-33: SAMPLE INFORMATION OBJECT USED BY PARTICIPANT 14 TO PROVIDE SUPPORT TO
THEIR CLAIM 81
FIGURE 8-1: AN INFORMATION OBJECT SURROGATE RELATION WITH TITLE AND DATE ELEMENTS
CREATED BY PARTICIPANT 14 137
FIGURE 8-2: AN INFORMATION OBJECT SURROGATE RELATION WITH TITLE, SOURCE AND DATE
ELEMENTS CREATED BY PARTICIPANT 7 138
FIGURE 8-3: AN INFORMATION OBJECT SURROGATE RELATION WITH TITLE, GIST, SOURCE AND DATE
ELEMENTS CREATED BY PARTICIPANT 3 138
FIGURE 8-4: A TIMELINE RELATION WITH TITLE, DATE AND GIST ELEMENTS CREATED BY
PARTICIPANT 14 139
FIGURE 8-5: A TIMELINE RELATION WITH DATE , GIST AND SOURCE ELEMENTS CREATED BY
PARTICIPANT 9 139
FIGURE 8-6: A TIMELINE RELATION WITH DATE , GIST AND SOURCE ELEMENTS CREATED BY
PARTICIPANT 20 140
FIGURE 8-7: JUSTIFICATION RELATION WITH A SINGLE CLAIM AND TIMELINE RELATION AS EVIDENTIAL
SUPPORT 141
FIGURE 8-8: A JUSTIFICATION RELATION CREATED BY PARTICIPANT 18 142
FIGURE 8-9: A JUSTIFICATION RELATION CREATED BY PARTICIPANT 29 142

xiv
Table of tables
TABLE 1-1: DEPENDENT VARIABLES AND THEIR PREDICTED HYPOTHESIS DIRECTION 4
TABLE 2-1: EVIDENCE LIST FOR COMMONWEALTH V. UMILIAN CASE FROM WIGMORE (1913, PP. 757–
758) 17
TABLE 2-2: PERCENTAGE OF SUBJECTS CHOOSING A VERDICT OF GUILTY OF MURDER BY
PROSECUTION AND DEFENCE ORDER CONDITIONS FROM PENNINGTON AND HASTIE (1991). 21
TABLE 3-1: THE DOCUMENT SERIAL NUMBERS FOR THE RELEVANT AND IRRELEVANT DOCUMENTS
USED IN THE STUDY 33
TABLE 4-1: THE STANDARD VALUES FOR EFFECT SIZE FROM KOJI (2013) 38
TABLE 4-2: THE PERCENTAGE OF HIGH AND LOW PERFORMING PARTICIPANTS PER CONDITION 42
TABLE 4-3: THE CONDITIONS AND THEIR TEST TAILS FOR THE MANN-WHITNEY TESTS 46
TABLE 4-4: SUMMARY OF KRUSKAL-WALLIS TEST RESULTS 48
TABLE 4-5: SUMMARY OF THE MANN-WHITNEY TEST AND EFFECT SIZE RESULTS 48
TABLE 5-1: INTERPRETIVE AND OBJECTIFIABLE CODES USED FOR VIDEO PROTOCOL ANALYSIS 51
TABLE 5-2: PRODUCTION RULE FOR SYNTAX TREE SHOWING ONE INFORMATION OBJECT 56
TABLE 5-3: PRODUCTION RULE FOR SYNTAX TREE SHOWING ONE INFORMATION OBJECT 57
TABLE 5-4: PRODUCTION RULE FOR SYNTAX TREE SHOWING ONE INFORMATION OBJECT
SURROGATE AND ONE INFORMATION OBJECT 58
TABLE 5-5: PRODUCTION RULE FOR SYNTAX TREE SHOWING TWO INFORMATION OBJECT
SURROGATES 59
TABLE 5-6: PRODUCTION RULE FOR SYNTAX TREE SHOWING MULTIPLE INFORMATION OBJECTS
SURROGATES AND A THEME 61
TABLE 5-7: PRODUCTION RULE FOR SYNTAX TREE SHOWING A TIMELINE RELATION EMBEDDED IN A
THEME 62
TABLE 5-8: PRODUCTION RULE FOR SYNTAX TREE SHOWING ALL THE CONSTITUENTS OF THE
USER’S REPRESENTATION 62
TABLE 5-9: RELATIONS AND ELEMENTS OF THE ERST 67
TABLE 5-10: INFORMATION OBJECT SURROGATE RELATION AND ELEMENTS 67
TABLE 5-11: TIMELINE RELATION AND ELEMENTS 72
TABLE 5-12: THEMED GROUPING RELATION AND ELEMENTS 74
TABLE 5-13: EXPLANATION RELATION AND ELEMENTS 76
TABLE 5-14: JUSTIFICATION RELATION AND ELEMENTS 79
TABLE 5-15: THE RELATION FREQUENCY AMONG PARTICIPANTS 82

xv
Table of equations
EQUATION 3-1: FORMULAE FOR MEASURING PARTICIPANTS RECALL 26
EQUATION 3-2: FORMULAE FOR MEASURING PARTICIPANTS PRECISION 27
EQUATION 3-3: FORMULAE FOR CALCULATING DURATION JUDGEMENT 28
EQUATION 4-1: THE EFFECT SIZE FORMULA FOR A MANN-WHITNEY TEST FROM KOJI (2013) 38
EQUATION 4-2: THE FORMULA TO CALCULATE F MEASURE 41

xvi

Chapter 1 Introduction and background
2
Chapter 1 Introduction and Background

Chapter 1 Introduction and background
3
1 Introduction and background
1.1 Background
During the process of conducting investigations, users structure information externally to
help them make sense of what they know, and what they need to know. Software-based
visual representations may be a natural place for doing this, but there are a number of types
of information structuring that might be supported and hence designed for. Further, there
might be important differences in how well different representational conventions support
sensemaking. There are questions about what type of representational support might allow
these users to be more effective when interacting with information.
Literature points us to two dominant representation approaches; narrative and
argumentation. Cognitive psychology research in juror decision making by Pennington &
Hastie (1986, 1991, 1992) and reports and commentary from the legal industry by
McElhaney (2012) and Hamilton & Chapin (2012) provide evidence that people are naturally
predisposed to make sense of complex social scenarios by constructing narratives. On the
other hand, the argumentation approach, was made popular by Wigmore (1913) and
Toulmin (2003) and there is an argued point that argument structuring improves critical
thinking (Twardy, 2003; van Gelder, 2009) because one of the components of critical
thinking is to produce arguments, comprehend their logical structure and examine their
strength and weakness (Sbarski et al., 2008; Toulmin, Rieke, & Janik, 1979).
1.2 Proposed study
The present study sets out to explore and compare the impact that different types of external
representational structuring have on performance and user experience during intelligence
type investigations. Intelligence analysis represents a difficult example domain were
sensemaking is expedient (Greitzer, 2005; Heuer, 1999). On the basis of previous research,
given evidence that people are naturally predisposed to make sense of complex social
scenarios by constructing exploratory narratives, we hypothesised that given the role that
narrative play, if people are given a timeline representation, they will exhibit better
performance and experience better user experience when performing sensemaking task
than when they are given an argumentation representation (see table 1-1). We also have
Chapter 1 Introduction and background
4
included a freeform representation in order to see what people would naturally do in a
sensemaking task like this. If the hypothesis is right, then the benefits of timeline in relation
to argumentation should be quantifiable.
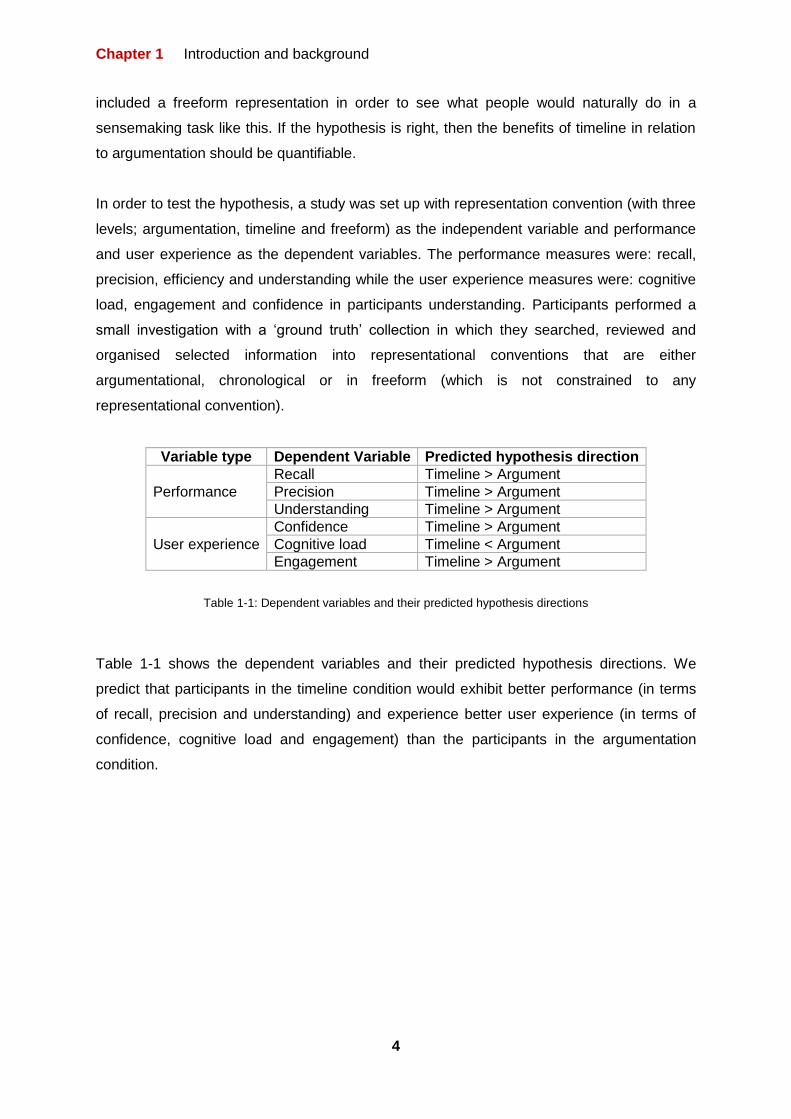
In order to test the hypothesis, a study was set up with representation convention (with three
levels; argumentation, timeline and freeform) as the independent variable and performance
and user experience as the dependent variables. The performance measures were: recall,
precision, efficiency and understanding while the user experience measures were: cognitive
load, engagement and confidence in participants understanding. Participants performed a
small investigation with a ‘ground truth’ collection in which they searched, reviewed and
organised selected information into representational conventions that are either
argumentational, chronological or in freeform (which is not constrained to any
representational convention).
Variable type Dependent Variable Predicted hypothesis direction
Performance
Recall Timeline > Argument
Precision Timeline > Argument
Understanding Timeline > Argument
User experience
Confidence Timeline > Argument
Cognitive load Timeline < Argument
Engagement Timeline > Argument
Table 1-1: Dependent variables and their predicted hypothesis directions
Table 1-1 shows the dependent variables and their predicted hypothesis directions. We
predict that participants in the timeline condition would exhibit better performance (in terms
of recall, precision and understanding) and experience better user experience (in terms of
confidence, cognitive load and engagement) than the participants in the argumentation
condition.

Chapter 1 Introduction and background
5
1.3 Thesis outline
The reminder of this thesis is outlined as follows:
Chapter 2 explores literature in the subject of sensemaking and also narrative and
argumentation structuring.
Chapter 3 describes the study that sets out to explore and compare the impact that different
types of external representational structuring have on performance and user experience
during intelligence type investigations.
Chapter 4 presents the results of the study
Chapter 5 presents a post hoc analysis that, (i) analyses and compares representational
structuring across conditions over time and (ii) describes and provides the Embedded
Representational Structuring Theory (ERST) for characterising and describing complex
heterogeneous representations primarily in terms of their relations and elements.
Chapter 6 discusses the findings from the study and the value of the ERST. It also provides
design suggestions for sensemaking tools.

Chapter 2 Literature Review
6
Chapter 2 Literature Review
Chapter 2 Literature Review
7
2 Literature review
2.1 Sensemaking
Sensemaking is an on-going process (G. Klein, Phillips, & Peluso, 2007; Russell, Stefik,
Pirolli, & Card, 1993; Kirsh, 2009; Pirolli & Card, 2005; Baber, Attfield, Wong, & Rooney,
2013; Zhang, Qu, Giles, & Song, 2008). Zhang et al (2008) describes it as a complicated
one which involves the twin hands of information seeking and comprehension. Klein et al.
(2007) describe sensemaking as constructing meaning from data. However, Baber et al.
(2013) added that sensemaking is also inclusive of background knowledge. That is, in the
words of Baber and colleagues “… a process through which data meet background
knowledge…” (Baber et al., 2013, p. 125). Sensemaking is further described as the
deliberate effort to understand events (Klein et al., 2007) mostly when one is faced with a
new event in unfamiliar situations and their current knowledge is inadequate (Zhang et al,
2008).
An example domain were sensemaking is expedient is intelligence analysis. Intelligence
analysis is a cognitively complex task (Greitzer, 2005; Heuer, 1999). It is described as
among the more difficult problem domains because it is connected to decisions about human
intentions and actions which are often unpredictable. Professionals of this domain are
confronted daily with vast amount of incomplete, inconclusive and ambiguous, homogenous
and heterogonous data in order to determine the likelihood of an undesirable event (Baber et
al., 2013; Thomas & Cook, 2005; Heuer, 1999). In order to do this, they usually will go
through a set of sense making tasks (Thomas & Cook, 2005; Pirolli & Card, 2005).
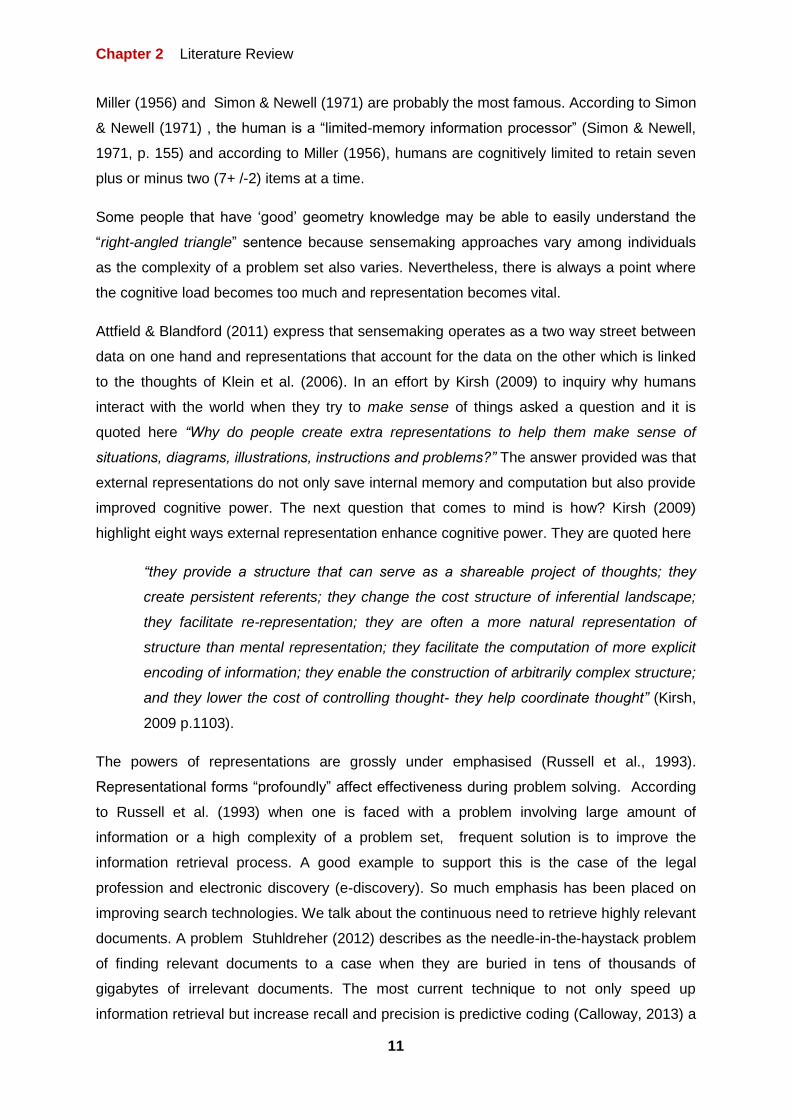
The most recognised model for sensemaking in the intelligence analysis domain is the
notional model of analyst sensemaking (Pirolli & Card, 2005) (see figure 2-1). The model
resulted from a cognitive task analysis and verbal protocol analysis with the aim of providing
an empirical understanding of the structure and processes involved in intelligence analysis
(Pirolli & Card, 2005).

Chapter 2 Literature Review
8
Figure 2-1: Notional model of analyst sensemaking from Pirolli & Card (2005)
The overall process of the notional model of analyst sensemaking is an iterative one
organised into two major loops of activities: foraging and sensemaking loops that includes
both a bottom-up and top-bottom information process. The rectangles and circles in figure
2-1 represent data flow and process flow respectively. They flow from raw data to
presentable information that can be communicated via stories. These data and process
flows are further arranged by their degree of effort and the degree of structuring involved.
These are presented in the horizontal and vertical axis respectively.
The external data source indicates raw evidence (data) often both homogenous and
heterogeneous. The “shoe- box” is described as the relevant subset of the external data for
processing. The evidence file contains a small extract from items in the relevant subset. The
schemas are the re-organised form of the information (such as diagrams, maps etc.) (Klein,
Moon, & Hoffman, 2006) which can be internal as well as external (Russell et al., 1993) so
conclusions can easily be drawn. Hypotheses are the provisional organisation of those
conclusions with supporting evidence and finally, the data flow ends with a presentation.
The foraging loop includes those processes directed at information seeking (searching and
filtering) such as the review and extracting of information and the identification of relations.
On the other hand the sensemaking loop includes the schematisation of the information
‘forged’ from the foraging process, the building of a case, the inclusion of support to increase
certainty and storytelling. The model is simplified by a linear diagram in Pirolli & Card (2005)
work (see figure 2-2). Here, the sensemaking task consists of information gathering, re-

Chapter 2 Literature Review
9
representation of the information in a schema that helps the analytical process, the
manipulation of the representation formed to develop insight and the creation of a product.
Figure 2-2: Simplified sensemaking process
2.1.1 The frame and the data frame theory of sensemaking
The data frame theory for sensemaking by Klein et al. (2006) have the same functional
capability as the schema in the notional model (Pirolli & Card, 2005). The frame is the centre
of the data frame theory. When people try to make sense of events they begin with a frame.
A frame is a metaphor used by Klein et al. (2006) to describe a perspective or view point. It
is internal to the perceiver (Pirolli & Card, 2005) and specific to what is being perceived
(Klein et al., 2007; Russell et al., 1993). The metaphor “frame” can be expressed in many
schematic ways: diagrams, stories, maps, hypothesis etc.
The data frame theory captures a number of sense making activities (Klein et al., 2006):
frame elaboration, frame questioning, frame evaluation, reframing and the generation of a
new frame. Klein et al. (2006) expresses a bi-directional street where the metaphor frame,
both shapes data and is also shaped by the acquisition of data. The theory is a closed
looped transition sequence between mental model formation (explanatory) and mental
simulation (anticipatory) i.e. each loop is leading to either refining the existing frame or
stimulating a new one. There are two parts to the theory of which each has their own
dynamics and requirements. The elaborating and preserving the frame belongs to the left
side of the model as can be seen in figure 2-3 and reframing belongs to the right side while
questioning the frame belongs to the centre. In the centre, the user questions their frame
leading them to either reframe or preserve their frame. While preserving their frame, this
could lead to a further elaboration of the frame.
What is not evident in the data frame theory is the origination of the ‘frame’. Baber et al
(2013) in a laboratory based study with the aim of exploring sensemaking through an
intelligence analysis exercise suggested that the frame originates from a ‘draft frame’ which
originates from the sorting of the artefacts (such as evidence data) provided for a case into
categories such as events with dates, phone records, financial transactions etc. This allows
Information gathering
Schema Insight Product

Chapter 2 Literature Review
10
the participants to ask themselves some initial questions such as “what is individual Y doing
at time X?” or “what were the outcomes of event Z?” (Baber et al., 2013, p. 131).
Figure 2-3: Data frame theory for sense making from Klein et al. (2006)
2.1.2 Representation
The schema (Pirolli & Card, 2005) may be casually in the analyst’s mind i.e. internal to the
perceiver (Klein et al., 2007) or aided by a paper and pen or computer based system i.e.
external to the perceiver. Whatever the case, representation is at the core of sensemaking
(Russell et al., 1993; Attfield & Blandford, 2011; Bex, 2010) and it is sometimes easier to
perform sense making externally , through the constructing of physical drawing (Kirsh, 2009)
than internally. Kirsh (2009) describes an example that supports this argument. A user is
provided this sentence to comprehend it “A basic property of right-angled triangles is that the
length of a median extending from the right angle to the hypotenuse is itself one half the
length of the hypotenuse” (Kirsh, 2009 p.1103). Take a few seconds to think about it.
Kirsh (2009) asked another question, instead of representing why not just think? The answer
to that question is given to us by Kirsh & Maglio (1994) who stated that through
representation and interaction, it is sometimes less demanding to process more adequately ,
with better speed and accuracy than by working internally alone. If one reaches out for a pen
and paper, it is much easier to comprehend the “right-angled triangle” sentence. The
conclusion given to us by Kirsh (2009) indicates that it is easier to perform the sensemaking
process externally through the construction of a physical drawing than it is to construct one
in the “eyes of one’s mind” (Kirsh, 2009 p. 1104). More so, according to Bex (2010) one can
only process a limited amount of information at one time. This is a general claim made by
many psychologists (Ramsey, Jansma, Jager, Raalten, & Kahn, 2004; Klingberg, 2000).
Chapter 2 Literature Review
11
Miller (1956) and Simon & Newell (1971) are probably the most famous. According to Simon
& Newell (1971) , the human is a “limited-memory information processor” (Simon & Newell,
1971, p. 155) and according to Miller (1956), humans are cognitively limited to retain seven
plus or minus two (7+ /-2) items at a time.
Some people that have ‘good’ geometry knowledge may be able to easily understand the
“right-angled triangle” sentence because sensemaking approaches vary among individuals
as the complexity of a problem set also varies. Nevertheless, there is always a point where
the cognitive load becomes too much and representation becomes vital.
Attfield & Blandford (2011) express that sensemaking operates as a two way street between
data on one hand and representations that account for the data on the other which is linked
to the thoughts of Klein et al. (2006). In an effort by Kirsh (2009) to inquiry why humans
interact with the world when they try to make sense of things asked a question and it is
quoted here “Why do people create extra representations to help them make sense of
situations, diagrams, illustrations, instructions and problems?” The answer provided was that
external representations do not only save internal memory and computation but also provide
improved cognitive power. The next question that comes to mind is how? Kirsh (2009)
highlight eight ways external representation enhance cognitive power. They are quoted here
“they provide a structure that can serve as a shareable project of thoughts; they
create persistent referents; they change the cost structure of inferential landscape;
they facilitate re-representation; they are often a more natural representation of
structure than mental representation; they facilitate the computation of more explicit
encoding of information; they enable the construction of arbitrarily complex structure;
and they lower the cost of controlling thought- they help coordinate thought” (Kirsh,
2009 p.1103).
The powers of representations are grossly under emphasised (Russell et al., 1993).
Representational forms “profoundly” affect effectiveness during problem solving. According
to Russell et al. (1993) when one is faced with a problem involving large amount of
information or a high complexity of a problem set, frequent solution is to improve the
information retrieval process. A good example to support this is the case of the legal
profession and electronic discovery (e-discovery). So much emphasis has been placed on
improving search technologies. We talk about the continuous need to retrieve highly relevant
documents. A problem Stuhldreher (2012) describes as the needle-in-the-haystack problem
of finding relevant documents to a case when they are buried in tens of thousands of
gigabytes of irrelevant documents. The most current technique to not only speed up
information retrieval but increase recall and precision is predictive coding (Calloway, 2013) a

Chapter 2 Literature Review
12
topic that is outside the focus of this thesis. However, Russell et al. (1993) states that
whatever the task, speeding up the information retrieval process can do just little help as we
still need to make sense of what is retrieved.
2.1.3 Re-representation
The core to the re-representation sensemaking process can be found in the work by Russell
and colleagues called “learning loop complex theory of sensemaking” (see figure 2-4). It
consists of three loops: generation loop, representational shift loop and data coverage loop.
It starts with a search for a good representation (the generation loop) then an attempt is
made to encode the representation with information (data coverage loop). Items that are task
relevant but do not fit into the representation are called “residue”. This identification of the
residue gives rise to the adjustment of the representation so that it has a better coverage of
the information (representation shift loop). The end product is a more compact
representation of the information relevant to the specific task.
Figure 2-4: Learning loop complex theory of sensemaking
In conclusion of this section (section 2.1), we have discussed sensemaking and the notional
sensemaking model and have gone in-depth into the ‘schema’ which enabled us to highlight
the importance of external representation. External representing is important to sensemaking
and we do not know which works in a sensemaking task. There are a number of candidates

Chapter 2 Literature Review
13
that have been identified in literature. Bex (2010) draws our attention to two dominant
approaches of representing: the argumentation approach and the narrative approach.
2.2 Argument structuring and mapping
Arguments are commonly used to develop and present cases (Cyra & Górski, 2011). They
can be described as structures of claims in either an inferential or evidential relationship to
each other (Sbarski, van Gelder, Marriott, Prager, & Bulka, 2008) in other to support and/or
counter a claim (van Gelder, 2002). An argument structure is a presentation of an argument
by graphical techniques (Sbarski et al., 2008). Le, Niebuhr, Drexler, & Pinkwart (2013) and
van Gelder (2002) described a typical argument structure to be a “box and arrow” diagram
where the nodes correspond to propositions and the links shows their relations, be it
evidential or inferential (Sbarski et al., 2008; van Gelder, 2009) or a structure made up of
named circles and lines where each named circle represents a proposition and the lines
represents inference (Macagno, Reed, & Walton, 2007). The graphical techniques used in
the presentation of an argument structure are the use of graphs, tables or matrices and
thread or trees (which can either be simple trees, hi-trees or bi-partite trees) (Sbarski et al.,
2008).
It is an argued point that argument structuring improves critical thinking (Twardy, 2003; van
Gelder, 2009) because one of the components of critical thinking is to produce arguments,
comprehend their logical structure and examine their strength and weakness (Sbarski et al.,
2008; Toulmin, Rieke, & Janik, 1979). However, it is not very popular. One of the reasons is
because it is not practical for people to sketch out argument maps (Twardy, 2003).
Many authors such as van Gelder (2009), Twardy (2003) etc. consider argument mapping
and structuring as the same thing. However, Argument mapping or argument visualisation is
the activity of using argument maps (van Gelder, 2002) or the two dimensional (Twardy,
2003) diagramming of the argument structure (van Gelder, 2009; Reed, 2007). The rationale
for mapping an argument is to uncover the structure of an argument in order to identify
unstated assumptions or to evaluate the supports an argument provides to a conclusion
(Fisher, 2004). According to van Gelder (2009) argument mapping is similar to other forms of
mapping such as concept and mind mapping however, argument mapping is directed at the
relationships among propositions be it evidential or inferential.
Argument mapping has been available since the early 20th century and the idea of it can be
dated to as far back as Richard Whately in the 1850s (Macagno et al., 2007). However, it is

Chapter 2 Literature Review
14
believed to have been originated by John Henry Wigmore (Goodwin & Fisher, 2000) or at
least traced to Wigmore (Sbarski et al., 2008; Bex, 2010; van Gelder, 2009), who used
argument mapping techniques to indicate legal case evidential structures (van Gelder, 2002;
Rowe & Reed, 2006). Wigmore’s work was wholly taken up from the view of formal logic
(Macagno et al., 2007). Numerous papers have been written for the purpose of either
interpreting (Chalamish, Gabbay, & Schild, 2011) or translating (Rowe & Reed, 2006)
Wigmore’s work. In the late 1950s Stephen Toulmin used mapping to show a general
structure of informal argument theory (van Gelder, 2002). The Toulmin theory is the most
generalised and has been used in a number of domains including educational critical
teaching (Simon, Erduran, & Osborne, 2006). Toulmin is often said to have revolutionised
argumentation (Macagno et al., 2007). Other people developed diagrammatic argument
theories after Toulmin such as, Michael Scriven in the 70s, David Kelley in the 80s and
James Freeman in the 90s (Macagno et al., 2007). Argument mapping or simply
argumentation theory (van Gelder, 2009) specifics the entities to be represented and the
relationships each entity have with the others and also provides a set of rules to govern
structuring or mapping. Below we describe a number of them, providing examples to support
their description.
2.2.1 Whately diagramming method
In Whately diagramming method (see figure 2-5), the user first figures out the argument’s
conclusion and then traces their thoughts backwards to find the reason the statement was
made in the first place (Macagno et al., 2007). At the top of the diagramming method,
Whately presents an “Ultimate conclusion” which is “proved by” two premises “Y is X” and “Z
is Y”. These premises individually are further “proved by” separate premises that appear
below them and a continuation of other groups of premises. Whately’s structure exhibits a lot
of familiarity to the structures available today. That is, the statements e.g. “Y is X, proved by”
represents the nodes and lines represents the propositions relations.

Chapter 2 Literature Review
15
Figure 2-5: Whately diagramming from Macagno et al (2007, p.13)
2.2.2 Wigmore’s Chart
The motive behind Wigmore’s work was to define a visual language for reasoning with a
large amount of evidence in a case at a trail (Bex, 2010). Wigmore’s chart method is a
representational scheme with a number of conventions, two mainly: lines and shapes
(Goodwin & Fisher, 2000). The lines represent the evidence processes (processes such as
premise and conclusion, objection and conclusion, refute and conclusion etc.) and they
connect the shapes which represents facts. The shapes are further numbered with each
number corresponding to a statement collected in an “Evidence List” (Wigmore, 1913, p.
753).
Consider the example in figure 2-6, a sample of Wigmore’s chart (Wigmore, 1913, pp. 757–
758) for the Commonwealth v. Umilian case concerning the alleged murder of J (Jedrusik)
by U (Umilian). Table 2-1 shows the evidence list for the case and figure 2-7 shows the
interpretation of the symbols and lines in the chart. The aim of the argument in figure 2-6 is
to establish the conclusion “Revengeful murderous emotion towards J”. At first (the lines
coming from below) Wigmore shows what injury Jedrusik caused to Umilian (evidence list 9).
The next step (the line to the left) was to explain the impact of the injury over time (evidence
list 18). Finally (lines going right), Wigmore provides more reason to support the argument
(evidence list 20). The testimony of the witnesses (the square with a dot in the middle)
provides evidential support in the chart (evidence list 18.1 and 20.1) “A dot within the symbol
of any kind of alleged fact signifies that we now believe it to be a fact.” (Wigmore, 1913, p.
752).

Chapter 2 Literature Review
16
Figure 2-6: Part of Wigmore’s Chart for Commonwealth v. Umilian from Goodwin and Fisher (2000 p.226)
Figure 2-7: Wigmore’s Chart symbols, lines and their interpretation from Wigmore (1913, pp. 751–753)

Chapter 2 Literature Review
17
8 Revengeful murderous emotion towards J.
9 J. had charged him with intended bigamy Nov. 18., and had tried thereby to prevent his
marriage.
10 Letter received by priest, stating that U. already had family in old country.
11 Anon, witnesses to this.
12 J. was author of letter, though it was in fictitious name.
13 Anon, witnesses to this.
14 Letter communicated by priest to U., with refusal to perform marriage; refusal later
withdrawn.
15 Anon, witnesses to this.
16 Letter's statements were untrue.
17 Anon, witnesses to this.
18 U. being innocent, and marriage being finally performed, U. would not have had a strong
feeling of revenge.
19 J. remaining in daily contact, wound must have rankled.
20 Wife remaining there, jealousy between U. and J. probably continued.
21 U. uttered threats and other hostile expressions between Nov. 18 and Dec. 31.
22 Anon, witnesses to this.
23 U., on Dec. 31, charged J. to K. with stealing K.'s goods.
24 Anon, witnesses to this.
25 Does not appear that these charges were false, hence not malicious.
Table 2-1: Evidence list for Commonwealth v. Umilian case from Wigmore (1913, pp. 757–758)
Chapter 2 Literature Review
18
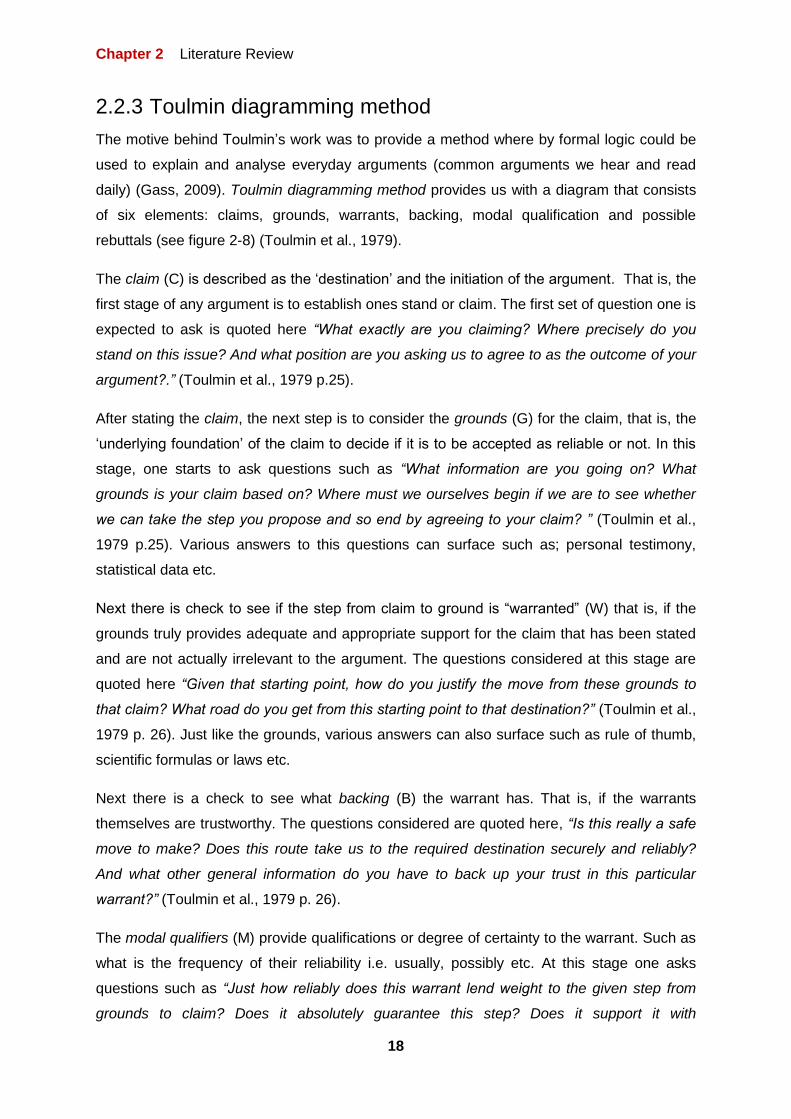
2.2.3 Toulmin diagramming method
The motive behind Toulmin’s work was to provide a method where by formal logic could be
used to explain and analyse everyday arguments (common arguments we hear and read
daily) (Gass, 2009). Toulmin diagramming method provides us with a diagram that consists
of six elements: claims, grounds, warrants, backing, modal qualification and possible
rebuttals (see figure 2-8) (Toulmin et al., 1979).
The claim (C) is described as the ‘destination’ and the initiation of the argument. That is, the
first stage of any argument is to establish ones stand or claim. The first set of question one is
expected to ask is quoted here “What exactly are you claiming? Where precisely do you
stand on this issue? And what position are you asking us to agree to as the outcome of your
argument?.” (Toulmin et al., 1979 p.25).
After stating the claim, the next step is to consider the grounds (G) for the claim, that is, the
‘underlying foundation’ of the claim to decide if it is to be accepted as reliable or not. In this
stage, one starts to ask questions such as “What information are you going on? What
grounds is your claim based on? Where must we ourselves begin if we are to see whether
we can take the step you propose and so end by agreeing to your claim? ” (Toulmin et al.,
1979 p.25). Various answers to this questions can surface such as; personal testimony,
statistical data etc.
Next there is check to see if the step from claim to ground is “warranted” (W) that is, if the
grounds truly provides adequate and appropriate support for the claim that has been stated
and are not actually irrelevant to the argument. The questions considered at this stage are
quoted here “Given that starting point, how do you justify the move from these grounds to
that claim? What road do you get from this starting point to that destination?” (Toulmin et al.,
1979 p. 26). Just like the grounds, various answers can also surface such as rule of thumb,
scientific formulas or laws etc.
Next there is a check to see what backing (B) the warrant has. That is, if the warrants
themselves are trustworthy. The questions considered are quoted here, “Is this really a safe
move to make? Does this route take us to the required destination securely and reliably?
And what other general information do you have to back up your trust in this particular
warrant?” (Toulmin et al., 1979 p. 26).
The modal qualifiers (M) provide qualifications or degree of certainty to the warrant. Such as
what is the frequency of their reliability i.e. usually, possibly etc. At this stage one asks
questions such as “Just how reliably does this warrant lend weight to the given step from
grounds to claim? Does it absolutely guarantee this step? Does it support it with

Chapter 2 Literature Review
19
qualifications? Or does it give us, at most, the basis for a more-or-less risky bet? ” (Toulmin
et al., 1979 p. 26). The modal qualifiers tend to lead to various types of conclusions
(probable, presumable, possible) as oppose to one of “certainties alone”.
The possible rebuttals (R) report the stage or circumstance the arguments conclusion will be
considered invalid. The final sets of questions to be asked are “What kinds of factors or
conditions could throw us off the road? What possibilities might upset this argument? And
what assumptions are we implicitly relying on in trusting such a step” (Toulmin et al., 1979
p. 26).
Figure 2-8: Example of an argument using Toulmin model (Toulmin et al., 1979 p.77)
Figure 2.8 shows an example of an argument structured using Toulmin model. It shows the
claim (C) as “Hannah Smith is entitled to vote at town meetings”. The grounds (G) to that
claim is “Hannah Smith is a local taxpayer”. “All local taxpayers are normally entitled to vote
at town meetings” provides the warrant (W). “The relevant legal and constitutional provision
being what they are,” provides backing (B) to the warrant. The argument has a modal
qualifier (M) “So, presumably” and the rebuttals (R) is “Unless she is noncitizen, a minor, a
lunatic, or other disqualified person”.

Chapter 2 Literature Review
20
2.3 Narrative, its significance and construction
The other trend Bex (2010) mentioned was the narrative or story-centric (Hamilton & Chapin,
2012) approach. Narratives are one of the forms listed by Pirolli & Card (2005) for
expressing a “frame”. The other forms stated were maps, diagrams etc. The inclusion of
narrative to the forms that is used to express a frame according to Baber et al. (2013) simply
implies the inference that what is actually necessary in sensemaking is a good narrative.
Bex (2010) refers to narrative as stories that tell what happened and what might happen in a
case. According to Chatman (1980) story consists of chains of events (actions, happenings)
and characters and settings. According to Bex (2010), Naugle (1999), Chapin, Attfield, &
Okoro (2013) and Pennington & Hastie (1991), the narrative approach is the most natural
approach of reasoning with evidence as oppose to the argument approach which in the
words of Twardy (2003) “just isn’t practical” (Twardy, 2003 p.5). McElhaney (2009)
emphasised that people only make their decisions via narratives and not by any other
means,
“People don’t make their decisions with syllogisms and rational progressions of
principle. Stories—not rules—are what really influence our thinking. Since the dawn
of time, we have used stories to teach, explain, understand how the world works,
memorialize events and instill moral values” (McElhaney, 2009, p. 2)
The significance of a narrative approach is massive. According to Naugle (1999) it
penetrates the core of what it means to be human in the first place and according to Chapin
et al. (2013), it is narrative that people of various cultures and from various generations have
resorted to in order to make sense of the events of their lives. The benefits of the narrative
approach are not fictitious or mere claims cognitive psychologists have provided empirical
evidence to this (Pennington & Hastie, 1991). In an initial study by Pennington and Hastie
(1991) with a goal to discover the cognitive process jurors take to decision making, a number
of adult jurors from a jury pool were recruited. They showed the jurors a filmed stimulated
murder trial of Commonwealth of Massachusetts v. Johnson (Hastie, Penrod, & Pennington,
1983; Pennington & Hastie, 1991). They proceeded to conduct and record a brief interview
section with the experimental participants and analysed the protocols to understand how the
jurors would internally organise the information. The first result of the analysis was that the
jurors arranged information into a narrative structure even though they were not presented
(shown) in that form. As much as “85% of all the events referred to in the protocols were
causally linked” (Pennington & Hastie, 1991., p. 536). Indications of this came from the
assertions the participants were making such as “Johnson was angry so he decided to kill
Chapter 2 Literature Review
21
him” (Pennington & Hastie, 1991., p. 536). The second result of the analysis was that,
interestingly, 55% of the protocol references were to events provided in the trail testimony
and the other 45% were from “inferred events” from world knowledge about similar events
and generic expectations about what makes a coherent (consistent, plausible and complete)
story.
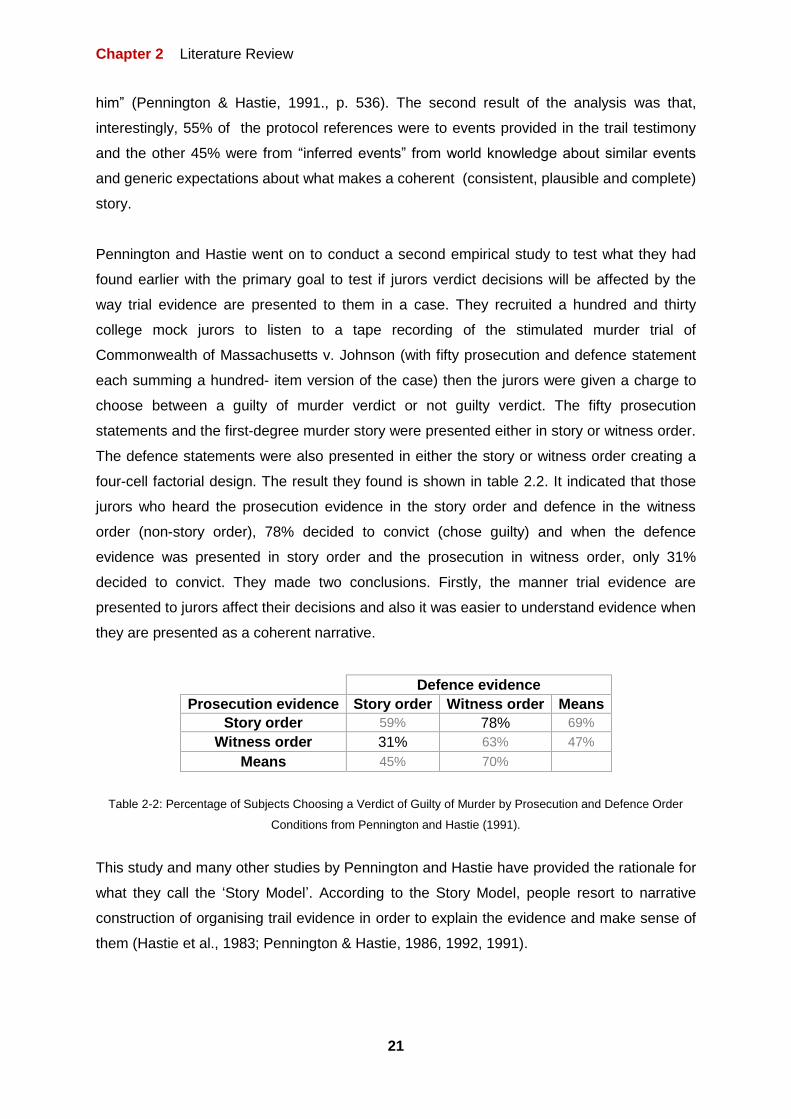
Pennington and Hastie went on to conduct a second empirical study to test what they had
found earlier with the primary goal to test if jurors verdict decisions will be affected by the
way trial evidence are presented to them in a case. They recruited a hundred and thirty
college mock jurors to listen to a tape recording of the stimulated murder trial of
Commonwealth of Massachusetts v. Johnson (with fifty prosecution and defence statement
each summing a hundred- item version of the case) then the jurors were given a charge to
choose between a guilty of murder verdict or not guilty verdict. The fifty prosecution
statements and the first-degree murder story were presented either in story or witness order.
The defence statements were also presented in either the story or witness order creating a
four-cell factorial design. The result they found is shown in table 2.2. It indicated that those
jurors who heard the prosecution evidence in the story order and defence in the witness
order (non-story order), 78% decided to convict (chose guilty) and when the defence
evidence was presented in story order and the prosecution in witness order, only 31%
decided to convict. They made two conclusions. Firstly, the manner trial evidence are
presented to jurors affect their decisions and also it was easier to understand evidence when
they are presented as a coherent narrative.
Defence evidence
Prosecution evidence Story order Witness order Means
Story order 59% 78% 69%
Witness order 31% 63% 47%
Means 45% 70%
Table 2-2: Percentage of Subjects Choosing a Verdict of Guilty of Murder by Prosecution and Defence Order
Conditions from Pennington and Hastie (1991).
This study and many other studies by Pennington and Hastie have provided the rationale for
what they call the ‘Story Model’. According to the Story Model, people resort to narrative
construction of organising trail evidence in order to explain the evidence and make sense of
them (Hastie et al., 1983; Pennington & Hastie, 1986, 1992, 1991).

Chapter 2 Literature Review
22
2.4 Hybrid approach
It was not long before Bex (2010) saw the significance of both the argumentation and
narrative approaches during sensemaking. Bex (2009) created a hybrid theory that
combines the two approaches: argumentation and narrative. In the hybrid approach, the
narrative about what occurred in a case is constructed then arguments which are based on
evidence or “common sense” are used to provide support for or counter against the narrative
(Bex, van Koppen, Prakken, & Verheij, 2010; Bex, 2009). The benefit of the hybrid approach
surpasses the benefits of the two approaches individually. The main benefit of the hybrid
approach is that, it lessens “tunnel vision” (Bex, 2010). This Heuer (1999) describes as a
situation where the most obvious narrative is taken as the main hypothesis and other
narratives are overlooked. Also it provides argumentative support for a story. The hybrid
theory has been developed into a sensemaking and visualisation tool called AVERs
(argument visualization tool for representing stories about evidence) (van den Braak,
Vreeswijk, & Prakken, 2007). AVERs allows two main things, the first, visualisation of a
narrative as well as its argumentative support and also, it allows a user to directly link
arguments to the evidence used in those arguments (Bex, 2010).
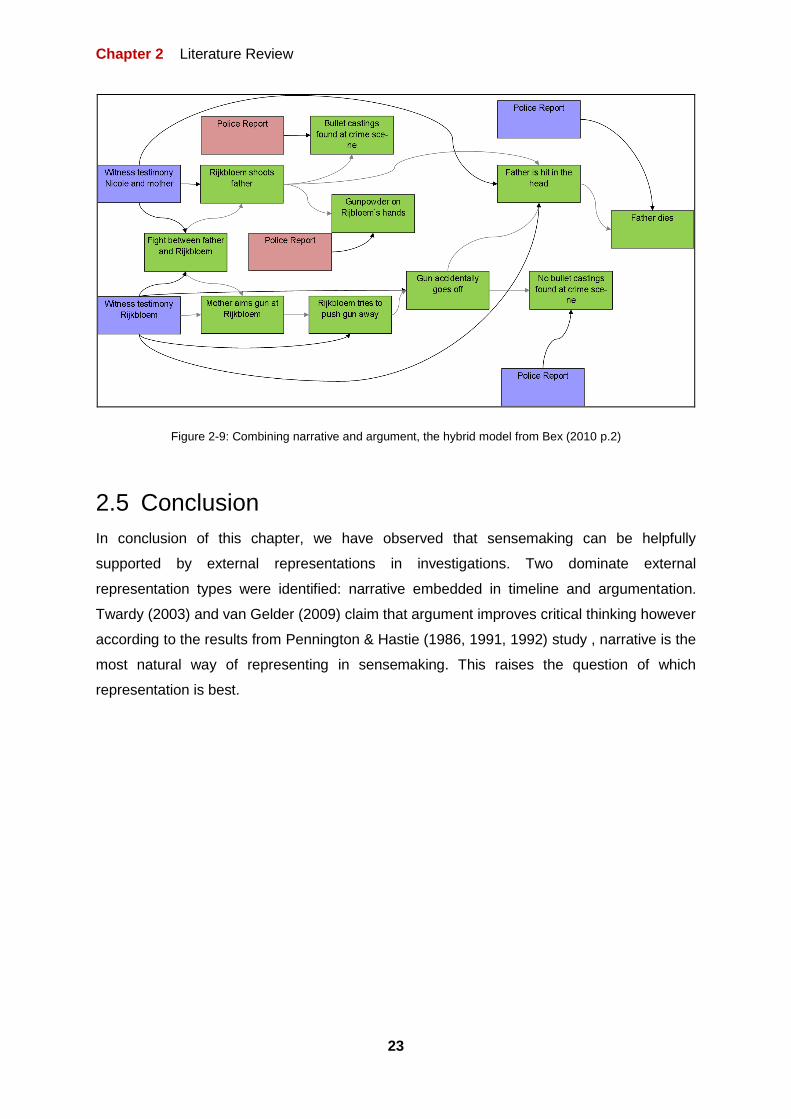
Figure 2.9 shows a redrawn example from Bex (2010). Here, Rijbloem is accused of killing
his girlfriend father Nicole (Davies, Lloyd-Bostock, McMurran, & Wilson, 1996 p.283). His
defence was that Nicole’s mother had accidentally shot him. The green rectangles represent
the narrative and the blue and red rectangles represent case evidence (witness’s testimony
and police report) either providing argumentative support for or counter against the
narratives.
Chapter 2 Literature Review
23
Figure 2-9: Combining narrative and argument, the hybrid model from Bex (2010 p.2)
2.5 Conclusion
In conclusion of this chapter, we have observed that sensemaking can be helpfully
supported by external representations in investigations. Two dominate external
representation types were identified: narrative embedded in timeline and argumentation.
Twardy (2003) and van Gelder (2009) claim that argument improves critical thinking however
according to the results from Pennington & Hastie (1986, 1991, 1992) study , narrative is the
most natural way of representing in sensemaking. This raises the question of which
representation is best.

Chapter 3 Study Method
24
Chapter 3
Study Method
Chapter 3 Study Method
25
3 Study Method
3.1 Overview
The aim of this thesis is to explore the impact that different types of external representational
structuring might have on performance and user experience during intelligence type
investigations. We have hypothesised that given the role that timeline representation play
given evidence that people are natural predisposed to make sense of complex social
scenarios by constructing exploratory narratives. If people are then given a timeline
representation, they will exhibit better performance and user experience than the other
representation we identified from literature, argumentation representation. We also have
included a freeform representation in other to see what people would naturally do in
sensemaking task like this. If the hypothesis is right, then it should be quantifiable.
In order to test the hypothesis, a study was set up with representational convention (with
three levels; argumentation, timeline and freeform) as the independent variable and
performance and user experience as the dependent variables.
Since a part of exploratory investigation is document review (Chapin et al., 2013), given a
‘ground truth’ dataset with a knowledge of the relevant documents it contains, standard
information retrieval (IR) measures such as recall and precision (Brassil, Hogan, & Attfield,
2009; Teufel, 2006; Rijsbergen, 1981; Blanco & Silvestri, 2008), can be used as a metric for
effectiveness. Effectiveness is a variable used to evaluate information retrieval performance
(Rijsbergen, 1981). It deals with the retrieving of the most relevant information to a user’s
need (Blanco & Silvestri, 2008). Duration of time spent to complete the task can be used to
measure efficiency. Efficiency is another variable used to evaluate information retrieval
performance (Blanco & Silvestri, 2008). It deals with the speed at which information is
provided to a user (Blanco & Silvestri, 2008). The participants understanding of key facts of
the dataset can also be measured by asking questions about the dataset.
These performance measures can be mixed up with user experience measures such as the
measure of psychological engagement which can be measured through a standardised
questionnaire developed by O’Brien (2010) from the research on facilitating user
engagement in the design of interactive systems (O’Brien & Toms, 2010). The cognitive load
the task impose on the participants can also be measured using a ratio of duration
judgement (Block & Zakay, 1997). Also, the confidence they ascertain to their individual
responses to the questions on understanding can be measured using a standardised format

Chapter 3 Study Method
26
of the intelligence confidence levels scale developed by the United States Joint Chiefs of
Staff committee (2007).
In this study, in order to determine the impact that different types of external representational
structuring have on performance and user experience during intelligence type investigations,
a number of measures were identified. The user experience measures were; cognitive load,
engagement and confidence while the performance measures were: recall, precision,
efficiency and understanding. Participants are asked to perform a small investigation with a
‘ground truth’ collection in which they search, review and organise selected information into
representational conventions that are either argumentational or chronological or in freeform
(which is not constrained to any representational convention).
3.2 Design
This study used an independent measure design. There was one independent variable:
representation conventions (with three levels; timeline, argumentation or freeform).
Participants were asked to search, review and organise selected information into
representational conventions that are either argumentational, chronological or in freeform
(which is not constrained to any representational convention). The experiment used a wholly
between-group design, with each participant assigned to only one of the representation
conventions. The dependent variable was a set of performance and user experience
variables. The performance measures were: recall, precision, efficiency and understanding
while the user experience measures were: cognitive load, engagement and confidence in
participants understanding.
3.2.1 Recall:
Recall is measured as the proportion of the total number of relevant documents identified
among the total number of relevant documents in the document population (Teufel, 2006). At
the end of the task, the documents the participants used for their representation were
collected and then the recall values were calculated using equation 3-1.
Equation 3-1: Formula for measuring participant’s recall
Chapter 3 Study Method
27
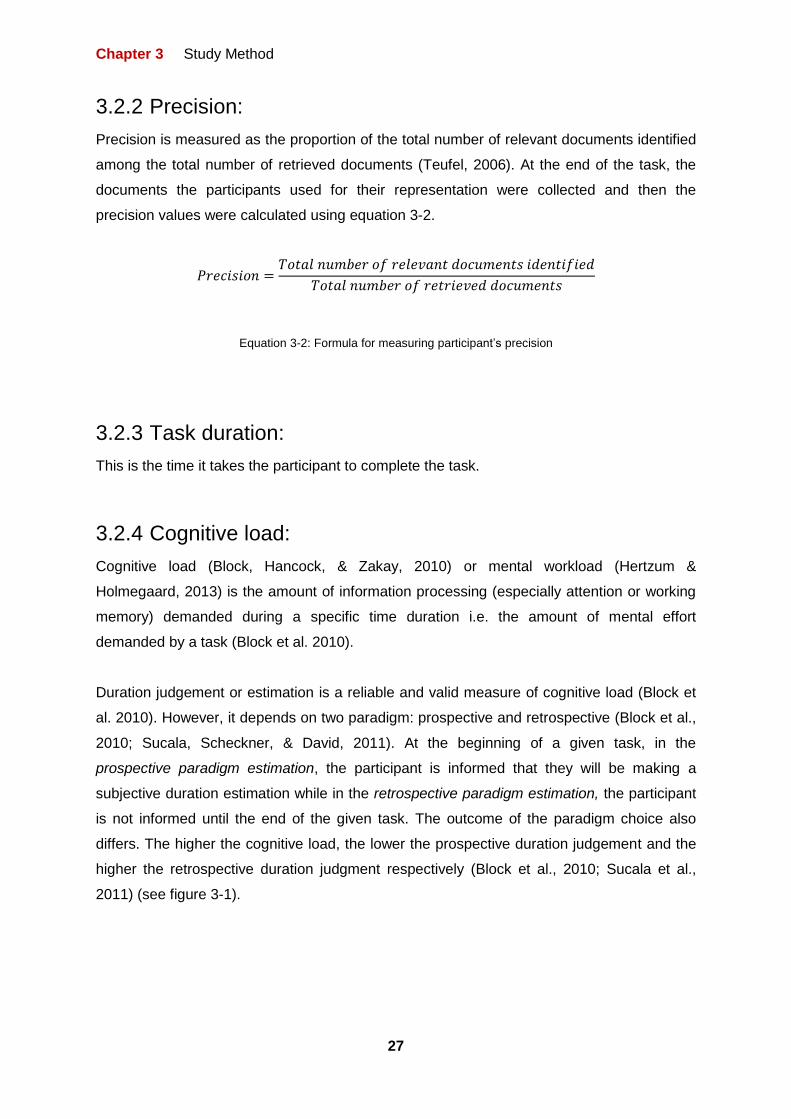
3.2.2 Precision:
Precision is measured as the proportion of the total number of relevant documents identified
among the total number of retrieved documents (Teufel, 2006). At the end of the task, the
documents the participants used for their representation were collected and then the
precision values were calculated using equation 3-2.
Equation 3-2: Formula for measuring participant’s precision
3.2.3 Task duration:
This is the time it takes the participant to complete the task.
3.2.4 Cognitive load:
Cognitive load (Block, Hancock, & Zakay, 2010) or mental workload (Hertzum &
Holmegaard, 2013) is the amount of information processing (especially attention or working
memory) demanded during a specific time duration i.e. the amount of mental effort
demanded by a task (Block et al. 2010).
Duration judgement or estimation is a reliable and valid measure of cognitive load (Block et
al. 2010). However, it depends on two paradigm: prospective and retrospective (Block et al.,
2010; Sucala, Scheckner, & David, 2011). At the beginning of a given task, in the
prospective paradigm estimation, the participant is informed that they will be making a
subjective duration estimation while in the retrospective paradigm estimation, the participant
is not informed until the end of the given task. The outcome of the paradigm choice also
differs. The higher the cognitive load, the lower the prospective duration judgement and the
higher the retrospective duration judgment respectively (Block et al., 2010; Sucala et al.,
2011) (see figure 3-1).

Chapter 3 Study Method
28
Figure 3-1: Mean duration judgment ratio in the prospective and retrospective paradigms as a function of
cognitive load. Error bars are the standard errors of the mean from (Block et al. 2010)
Duration judgement is measured as the ratio of subjective duration estimate (or interval
duration estimate (Sucala et al., 2011) ) to objective duration (Block et al. 2010) (see
equation 3-3). Subjective duration is defined as the subjective evaluation of duration (Sucala
et al. 2011) and objective duration is the objective evaluation of duration. In other to asses
this, a person is asked to verbally estimate the duration of an activity or task (Sucala et al.
2011). For the study, participants were asked to make a retrospective subjective estimate
i.e. they were not informed they will be making a subjective duration estimate till the task
was completed. For the duration judgement involving the retrospective paradigm, a value
greater than one represents a temporal overestimate which indicates higher cognitive load
and a value lower than one represents a temporal underestimate which indicates lower
cognitive load (Sucala et al., 2011).
⁄
Equation 3-3: Formula for calculating duration judgement

Chapter 3 Study Method
29
3.2.5 Understanding:
Understanding is measured by assigning scores to participant’s verbal responses to
questions about key facts of the task. The questions include: What is the potential terrorist
threat, who is involved in the potential terrorist threat, when is the terrorist attack likely to
happen, where is the terrorist attack likely to take place and how was the terrorist threat
likely to happen (see appendix A). Scores of 1 and 0 were given. 0 was given when a
participant got an answer wrong and 1 was given when they got it right.
3.2.6 Confidence:
The confidence users place on an answer is measured using a confidence level scale
provided by the United States Joint Intelligence Committee intelligence (2007). After a
participant respond to a question for example “what is the potential terrorist threat”, they are
presented a confidence level scale to indicate how confident they are of the answer they
have provided. The scale contains levels such as; highly probable (>90%), probable (60-
90%), chances are slightly greater (or less) than even (40-60%), probably not (10-40%) and
highly improbable (<10%) (See appendix A).
Chapter 3 Study Method
30
3.2.7 Engagement:
In order to understand the factors that compose engagement and be able to evaluate them
to facilitate engaging user experience in the design of interactive systems, O’Brien & Tom
(2010) identified six attributes of engagement and developed a user engagement
questionnaire from them (O’Brien, 2010). An adaptation of the user engagement
questionnaire by O’Brien & Toms (2010) is used to asses engagement in this study. It
included sections on Felt Involvement (FI), Focused Attention (FA), Endurability (E) and
Perceived Usability (PUs) (See appendix A).
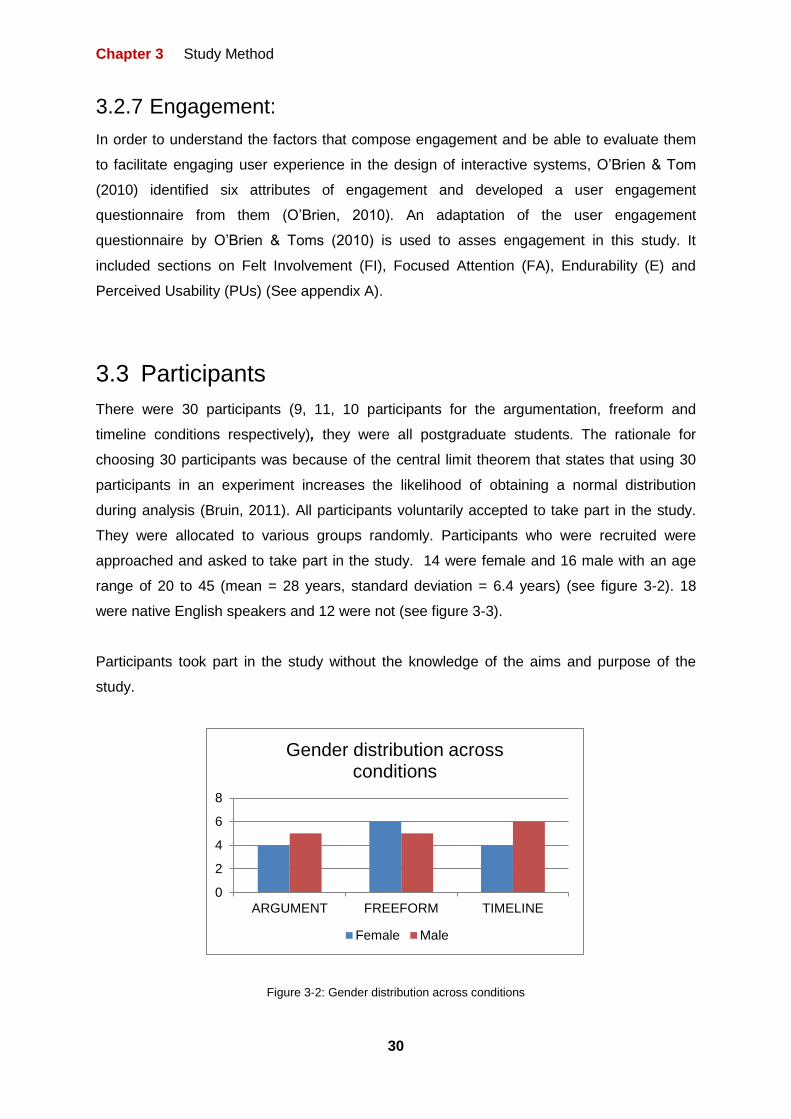
3.3 Participants
There were 30 participants (9, 11, 10 participants for the argumentation, freeform and
timeline conditions respectively), they were all postgraduate students. The rationale for
choosing 30 participants was because of the central limit theorem that states that using 30
participants in an experiment increases the likelihood of obtaining a normal distribution
during analysis (Bruin, 2011). All participants voluntarily accepted to take part in the study.
They were allocated to various groups randomly. Participants who were recruited were
approached and asked to take part in the study. 14 were female and 16 male with an age
range of 20 to 45 (mean = 28 years, standard deviation = 6.4 years) (see figure 3-2). 18
were native English speakers and 12 were not (see figure 3-3).
Participants took part in the study without the knowledge of the aims and purpose of the
study.
Figure 3-2: Gender distribution across conditions
0
2
4
6
8
ARGUMENT FREEFORM TIMELINE
Gender distribution across conditions
Female Male

Chapter 3 Study Method
31
Figure 3-3: Native and non-native English speakers distribution across conditions
3.4 Materials
A handpicked subset of the IEEE VAST mini challenge 3 dataset was used as the problem
set for the task. The data was a corpus of news reports about a fictional town called
Vastopolis. A PC running Microsoft OneNote and Windows search explorer was used for the
investigative task. Microsoft OneNote was used as the platform for the representation
because OneNote allows users to combine and arrange documents, text snippets and add
annotations on a single visual canvas. Windows search explorer was the tool for keyword
searching through the dataset. Screen capturing software was used to capture the task for
later analysis and also record the duration of the task. An audio recorder was used to record
the question and answer dialogue in order to assess the participants understanding (see
appendix A for the questions asked). A degree of confidence questionnaire was used to
measure subjective confidence in the answers provided (See appendix A). An adaptation of
the user engagement questionnaire by O’Brien (2010) was used to measure subjective
engagement (see appendix A). The adaptation of the user engagement scale included
sections on Felt Involvement (FI), Focused Attention (FA), Endurability (E) and Perceived
Usability (Pus). These sections were selected among six other sections that included:
Aesthetics and Novelty. The Aesthetics and Novelty sections of the questionnaire were not
included because they were not applicable to quantification we are trying to make.
0
2
4
6
8
ARGUMENT FREEFORM TIMELINE
Native and non-native English speakers distribution
Non-native Native

Chapter 3 Study Method
32
3.5 Procedure
Participants initially completed an informal consent form (see appendix A). The procedure
followed a general training (a training section all participants went through).
3.5.1 Training
Participants were given general and condition-specific training. Participants were given
general training to allow them to be familiar with Microsoft OneNote and the search tool,
Microsoft Windows Explorer. Participants in the argumentation and timeline conditions were
then given brief PowerPoint presentations on how to represent their investigations in those
forms (see appendix B).
The argumentation structure adopted is a simplified hybrid of argument models by Toulmin
(1979) and Wigmore (1913). Participants were shown how to create a three-level
argumentation structure consisting of: conclusion; intermediate propositions which can either
support or and counter the conclusion, and evidence which supports the intermediate
propositions. Blue and red lines are used to indicate supporting and countering sub-
arguments respectively (see figure 3.4).
Figure 3-4: Argument structure used by the participants for the argument condition
In the timeline condition participants were instructed to create a timeline using the relevant
documents found. Then to keep iterating the process until they have gotten all their answers.

Chapter 3 Study Method
33
Participants in the freeform condition were told to conduct the investigation in whatever way
that suited them and were told to use the representation platform for any representation they
needed to do.
3.5.2 Task
The task was to identify any terrorist threat in a fictional place, Vastopolis.
3.5.2.1 Problem set
The problem set uses data and questions from the IEEE 2011 VAST challenge (IEEE VAST,
2011b). Given a corpus of news reports about a fictional town called Vastopolis, participants
are asked to: (1) identify any imminent terrorist threats in the Vastopolis metropolitan area;
(2) provide detailed information on the threats (e.g. who, what, where, when, and how); (3)
provide a list of the evidential documents supporting their answer (IEEE VAST, 2011a).
The VAST dataset contains over 4000 plain text documents, manually generated or modified
from an existing corpus of news reports. Each report is a plain text file containing a headline,
date of publication, and the content. For the current study we selected a subset of 30
articles. These were not selected at random but was handpicked to include 13 documents
that were relevant to the threat (determined by the VAST challenge committee), and an
additional 17 irrelevant documents selected to add noise (see table 3-1).
Document type Document serial numbers Total
Related to imminent threat (relevant)
03212, 03740, 03040, 03662, 04085, 04080, 01785, 03435, 01878, 01030, 01038, 03295, 02385
13
Related to isolated case (irrelevant)
03375, 04156, 01482, 01594, 02696, 00432, 04314, 00008, 03563, 01750, 02900, 01243, 00274, 03772, 03874, 02664, 03237
17
30
Table 3-1: The document serial numbers for the relevant and irrelevant documents used in the study

Chapter 3 Study Method
34
3.5.3 Data collection
The investigation processes were recorded using screen recording software for later
analysis. Participants were not encouraged to ‘think aloud’ since this would disrupt the
duration of time spent measurement of the task. However, after the task a question and
answer session is conducted which assess the participants subjective perception of time and
ask a series of factual questions and probe for confidence ratings. Following the interview,
participants are asked to complete the user-engagement questionnaire.
3.5.4 Debrief
Participants were thanked and urged not to discuss the study with any of the other
postgraduate students selected to take part in the study.

Chapter 4 Study findings
35
Chapter 4
Study Findings

Chapter 4 Study findings
36
4 Study Findings
This section shows the findings of the study to explore the impact that different types of
external representational structuring have on performance and user experience during
intelligence type investigations. As stated in the method section, we are measuring this
impact based on a number of performance and user experience measures: recall, precision,
duration, cognitive load, confidence, understanding and engagement.
After the study was completed, a test for normality was conducted on the data acquired from
the study. This was done using a well-known approach where the density distribution of the
sample data (this was done using the density() function in R (Zhao, 2012)) is compared
to a normal probability curve (D’Agostino & Stephens, 1986). The result of the density
distributions indicated that the data acquired were not normalised (see appendix C). Figures
4-1, 4-2 and 4-3 show samples of the non-normalised distributions. The other distributions
can be found in appendix C.
Figure 4-1: Cognitive load Distribution and mean Figure 4-2: Engagement Distribution and mean

Chapter 4 Study findings
37
Figure 4-3: Understanding Distribution and mean
A non-parametric Kruskal–Wallis one way analysis of variance test was performed to test for
significance. The reason for the non-parametric test choice as oppose to a parametric
alternative ANOVA was because, (1) parametric tests have some assumptions on normality
of distribution and homogeneity of variance. However as can be seen in the figures above
(Figures 4.1; 4.2; 4.3) showing samples of the distribution of dependent variables, the data
gathered during the study did not realise the conditions for a parametric test to be conducted
i.e. the distributions when plotted were not normally distributed. (2) An advantage of using a
non-parametric test is that it is usually used when the examined groups are of unequal size
(different number of participants) (Dancey & Reidy, 2011) which is similar to the case we
have here i.e. argumentation, freeform and timeline conditions have nine (9), eleven (11)
and ten (10) participants respectively. The Kruskal-Wallis test is reported with three
elements H indicating the chi square, df. indicating the degree of freedom and p indicating
the test for significance (McDonald, 2009). For example (H=6.894, d.f. = 2, p<0.05).
The significance level used was 0.05. The effect size is not calculated using the Kruskal
Wallis test because there is no straight forward way to calculate the effect size for the
Kruskal Wallis H test. However, one can calculate the effect size with the Mann-Whitney U
test (Koji, 2013).
The effect size is used to assess the importance of an experimental effect regardless of the
significance of the test statistics (Field & Hole, 2003). It is a standardised method of
quantifying the size of the difference between various groups (Field & Hole, 2003).

Chapter 4 Study findings
38
According to Harris (2008) it helps us to answer the question of “how big”. That is, how big
an effect does the independent variable (IV) create on the dependent variable (DV).
The Pearson’s r correlation coefficient is commonly used to calculate effect size (Field &
Hole, 2003). The value is constrained to lie between 0 and 1 where 0 indicates no effect and
1 indicates a perfect effect. It has an objective and standardised scale which is used for its
interpretation (Koji, 2013 ;Field & Hole, 2003). The scale is provided in Table 4-1.
Small size Medium size Large size
r 0.1 0.3 0.5
Table 4-1: The standard values for effect size from Koji (2013)
Equation 4-1 shows the formula for the Mann-Whitney U test effect size provided by (Koji,
2013). Where N is the total number of the samples and Z is the z-score. The z-score is
provided when a Mann-Whitney test is conducted.
√
Equation 4-1: The effect size formula for a Mann-Whitney test from Koji (2013)
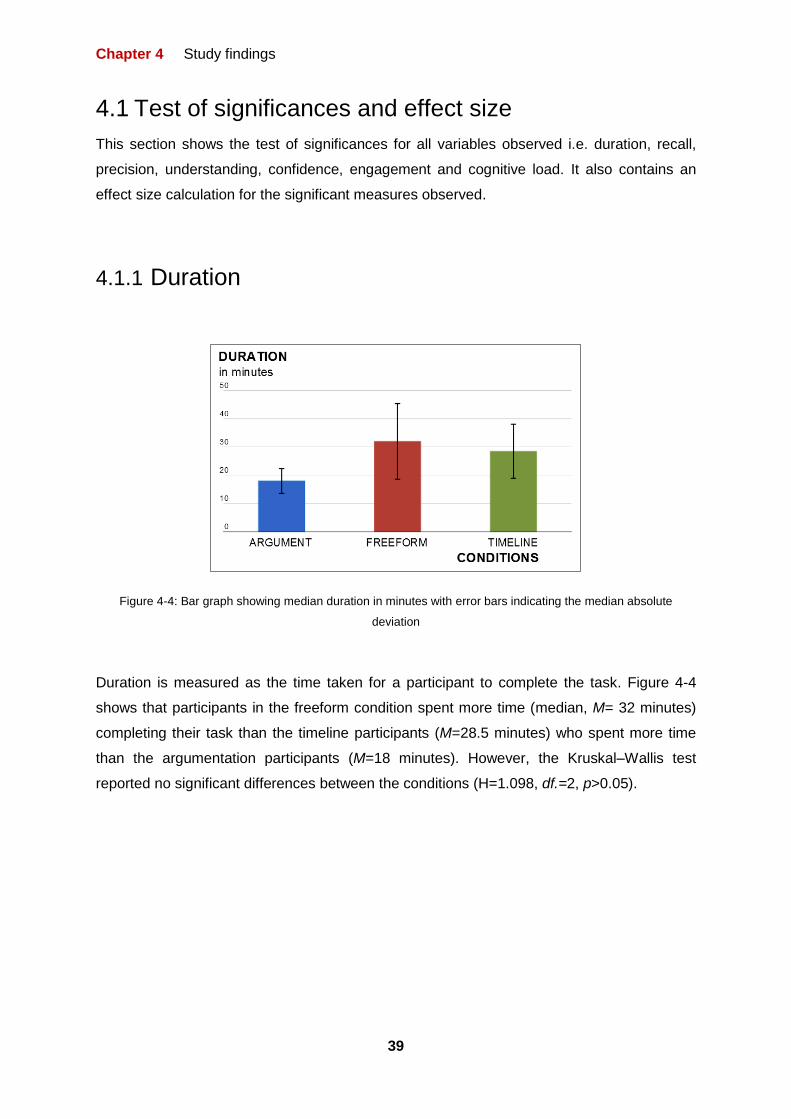
Chapter 4 Study findings
39
4.1 Test of significances and effect size
This section shows the test of significances for all variables observed i.e. duration, recall,
precision, understanding, confidence, engagement and cognitive load. It also contains an
effect size calculation for the significant measures observed.
4.1.1 Duration
Figure 4-4: Bar graph showing median duration in minutes with error bars indicating the median absolute
deviation
Duration is measured as the time taken for a participant to complete the task. Figure 4-4
shows that participants in the freeform condition spent more time (median, M= 32 minutes)
completing their task than the timeline participants (M=28.5 minutes) who spent more time
than the argumentation participants (M=18 minutes). However, the Kruskal–Wallis test
reported no significant differences between the conditions (H=1.098, df.=2, p>0.05).
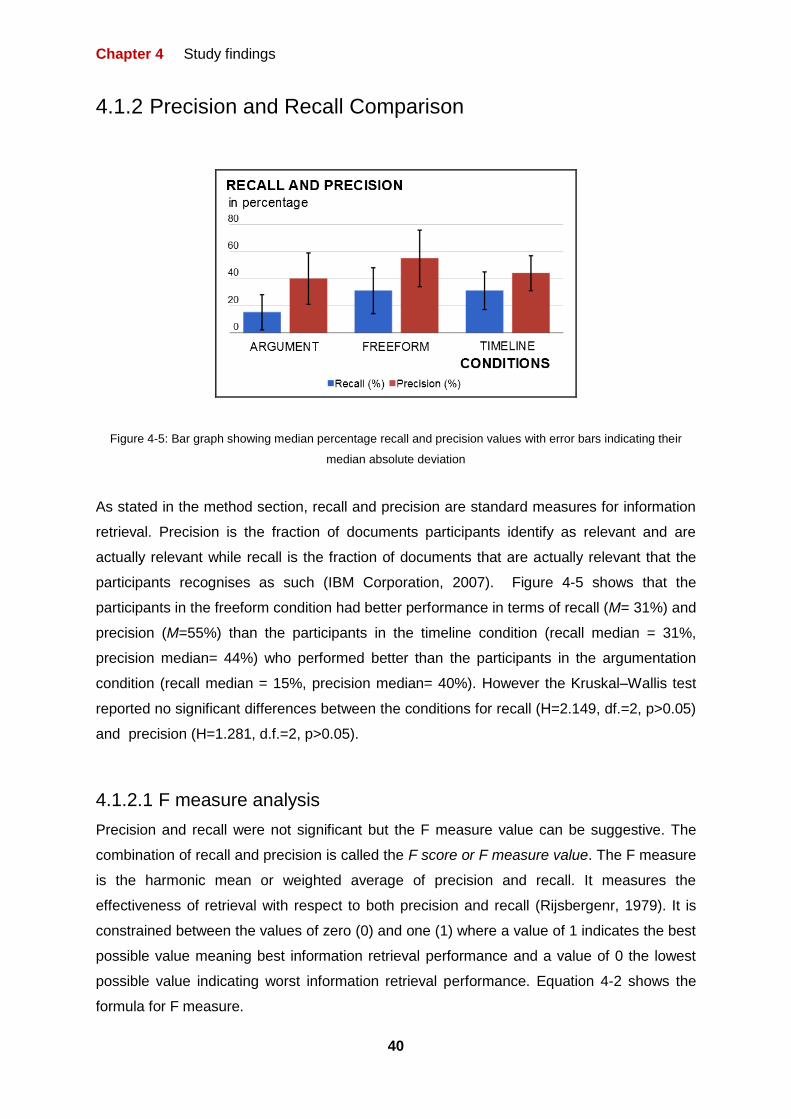
Chapter 4 Study findings
40
4.1.2 Precision and Recall Comparison
Figure 4-5: Bar graph showing median percentage recall and precision values with error bars indicating their
median absolute deviation
As stated in the method section, recall and precision are standard measures for information
retrieval. Precision is the fraction of documents participants identify as relevant and are
actually relevant while recall is the fraction of documents that are actually relevant that the
participants recognises as such (IBM Corporation, 2007). Figure 4-5 shows that the
participants in the freeform condition had better performance in terms of recall (M= 31%) and
precision (M=55%) than the participants in the timeline condition (recall median = 31%,
precision median= 44%) who performed better than the participants in the argumentation
condition (recall median = 15%, precision median= 40%). However the Kruskal–Wallis test
reported no significant differences between the conditions for recall (H=2.149, df.=2, p>0.05)
and precision (H=1.281, d.f.=2, p>0.05).
4.1.2.1 F measure analysis
Precision and recall were not significant but the F measure value can be suggestive. The
combination of recall and precision is called the F score or F measure value. The F measure
is the harmonic mean or weighted average of precision and recall. It measures the
effectiveness of retrieval with respect to both precision and recall (Rijsbergenr, 1979). It is
constrained between the values of zero (0) and one (1) where a value of 1 indicates the best
possible value meaning best information retrieval performance and a value of 0 the lowest
possible value indicating worst information retrieval performance. Equation 4-2 shows the
formula for F measure.
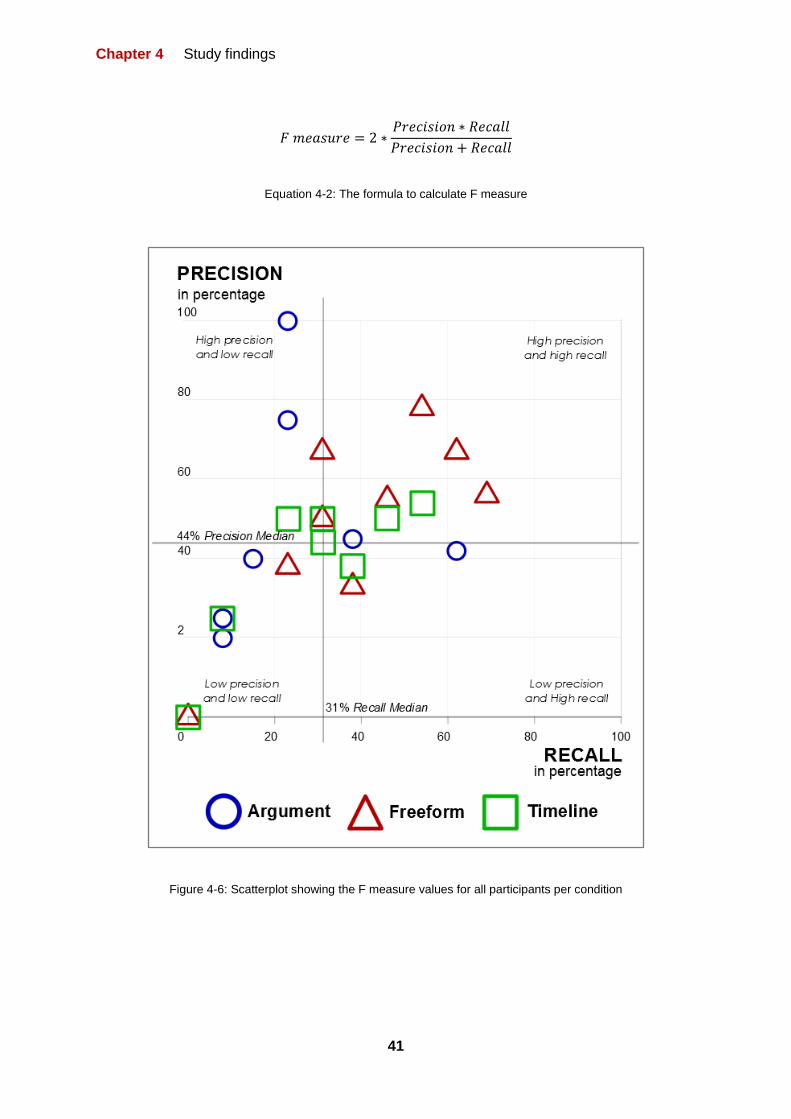
Chapter 4 Study findings
41
Equation 4-2: The formula to calculate F measure
Figure 4-6: Scatterplot showing the F measure values for all participants per condition
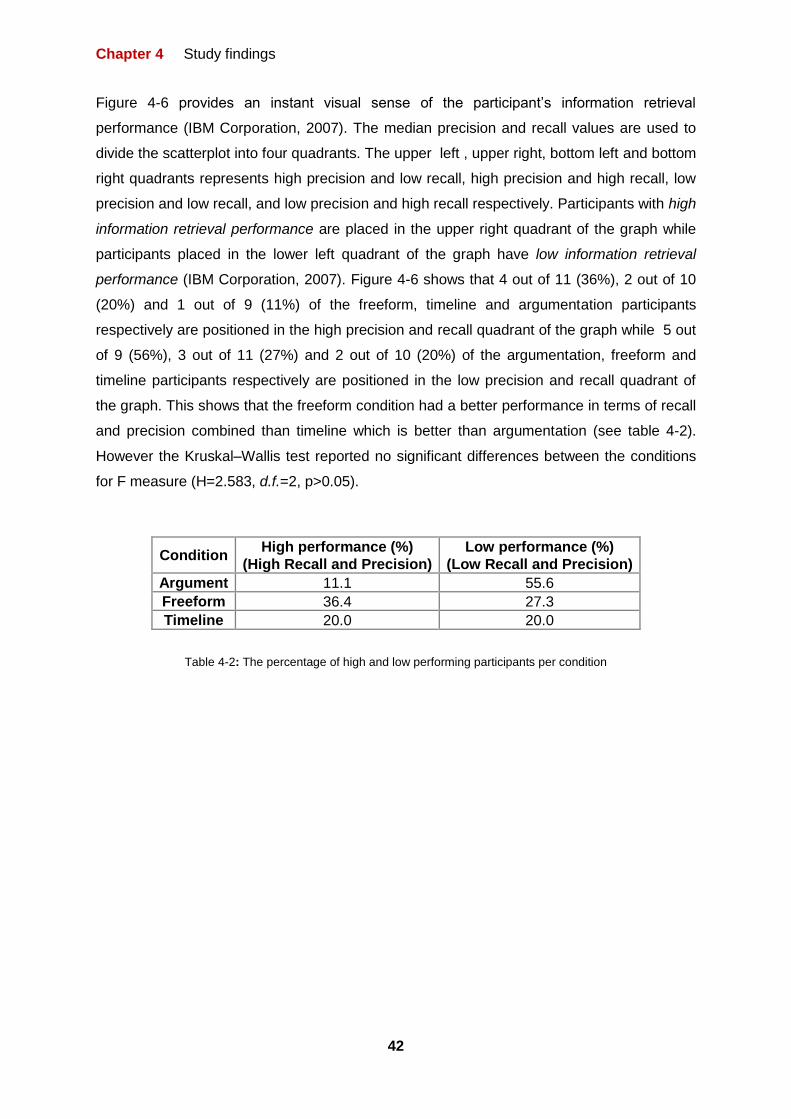
Chapter 4 Study findings
42
Figure 4-6 provides an instant visual sense of the participant’s information retrieval
performance (IBM Corporation, 2007). The median precision and recall values are used to
divide the scatterplot into four quadrants. The upper left , upper right, bottom left and bottom
right quadrants represents high precision and low recall, high precision and high recall, low
precision and low recall, and low precision and high recall respectively. Participants with high
information retrieval performance are placed in the upper right quadrant of the graph while
participants placed in the lower left quadrant of the graph have low information retrieval
performance (IBM Corporation, 2007). Figure 4-6 shows that 4 out of 11 (36%), 2 out of 10
(20%) and 1 out of 9 (11%) of the freeform, timeline and argumentation participants
respectively are positioned in the high precision and recall quadrant of the graph while 5 out
of 9 (56%), 3 out of 11 (27%) and 2 out of 10 (20%) of the argumentation, freeform and
timeline participants respectively are positioned in the low precision and recall quadrant of
the graph. This shows that the freeform condition had a better performance in terms of recall
and precision combined than timeline which is better than argumentation (see table 4-2).
However the Kruskal–Wallis test reported no significant differences between the conditions
for F measure (H=2.583, d.f.=2, p>0.05).
Condition High performance (%) Low performance (%)
(High Recall and Precision) (Low Recall and Precision)
Argument 11.1 55.6
Freeform 36.4 27.3
Timeline 20.0 20.0
Table 4-2: The percentage of high and low performing participants per condition

Chapter 4 Study findings
43
4.1.3 Understanding
Figure 4-7: Bar graph showing median understanding with error bars indicating the median absolute deviation
Understanding is measured by assigning scores to participant’s verbal responses to five
questions about key facts of the task. Scores of 1 and 0 were given, 0 was given when
participants got an answer wrong and 1 was given when they got it right. Figure 4.7 shows
that the argumentation condition (M=40%) had a better understanding value than the
freeform (M=20%) which is better than the timeline (M=10%) condition. However, the
Kruskal–Wallis test reported no significant differences between the conditions (H= 0.187,
df.=2, p>0.05).

Chapter 4 Study findings
44
4.1.4 Confidence
Figure 4-8: Bar graph showing median confidence with error bars indicating the median absolute deviation
When a participant provides an answer to a question, they are presented a confidence level
scale to indicate how confident they are of the answer they have provided from >90%
indicating highly probable to <10% indicating highly improbable. Figure 4-8 shows that the
participants in the timeline condition (M=58%) had better confidence on their answers than
those in the freeform condition (M=50%) which is better than those in the argumentation
(M=47%) conditions. However, the Kruskal–Wallis test also reported no significant
differences between conditions (H= 0.59, df= 2, p>0.05).
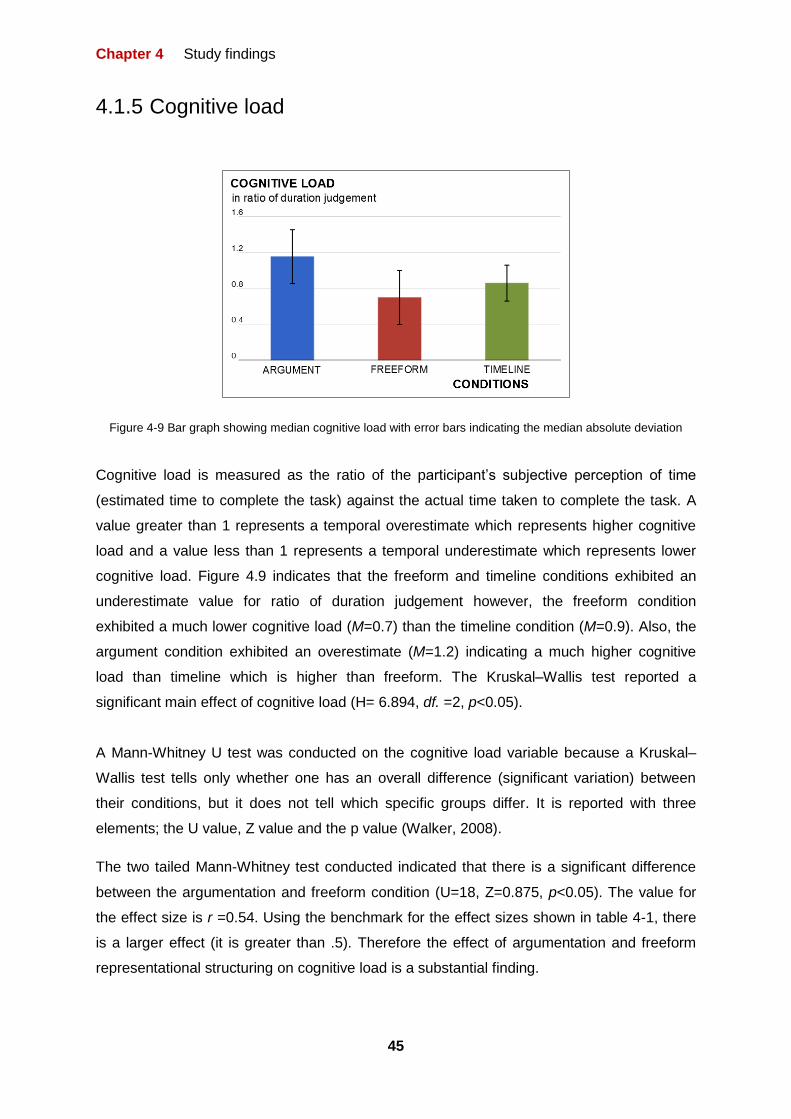
Chapter 4 Study findings
45
4.1.5 Cognitive load
Figure 4-9 Bar graph showing median cognitive load with error bars indicating the median absolute deviation
Cognitive load is measured as the ratio of the participant’s subjective perception of time
(estimated time to complete the task) against the actual time taken to complete the task. A
value greater than 1 represents a temporal overestimate which represents higher cognitive
load and a value less than 1 represents a temporal underestimate which represents lower
cognitive load. Figure 4.9 indicates that the freeform and timeline conditions exhibited an
underestimate value for ratio of duration judgement however, the freeform condition
exhibited a much lower cognitive load (M=0.7) than the timeline condition (M=0.9). Also, the
argument condition exhibited an overestimate (M=1.2) indicating a much higher cognitive
load than timeline which is higher than freeform. The Kruskal–Wallis test reported a
significant main effect of cognitive load (H= 6.894, df. =2, p<0.05).
A Mann-Whitney U test was conducted on the cognitive load variable because a Kruskal–
Wallis test tells only whether one has an overall difference (significant variation) between
their conditions, but it does not tell which specific groups differ. It is reported with three
elements; the U value, Z value and the p value (Walker, 2008).
The two tailed Mann-Whitney test conducted indicated that there is a significant difference
between the argumentation and freeform condition (U=18, Z=0.875, p<0.05). The value for
the effect size is r =0.54. Using the benchmark for the effect sizes shown in table 4-1, there
is a larger effect (it is greater than .5). Therefore the effect of argumentation and freeform
representational structuring on cognitive load is a substantial finding.

Chapter 4 Study findings
46
The other two tailed Mann-Whitney test conducted indicated no significant difference
between the freedom and timeline conditions (U=41, Z=0.986, p>0.05).
The one tailed Mann-Whitney test conducted indicated that there is a significant difference
between the argumentation and timeline conditions (U=21.5, Z=1.924, p<0.05). The value
for the effect size is r=0.44 indicating a medium effect size. This is also a substantial finding.
One may wonder why there is a difference in the tails for the three Mann-Whitney tests
conducted above i.e. argumentation and freeform, argumentation and timeline and timeline
and freeform tested with two tails, one tail and two tails respectively (See table 4-3). This is
because the directions of the hypothesis were set from the outset. Referring back to the
introductory section of this thesis, there was a hypothesis that timeline would perform better
than argument (one direction) but none was set for when the freeform condition was
involved.
Conditions Test Tails
Argument and Freeform Two tailed
Argument and Timeline One tailed
Timeline and Freeform Two tailed
Table 4-3: The conditions and their test tails for the Mann-Whitney tests
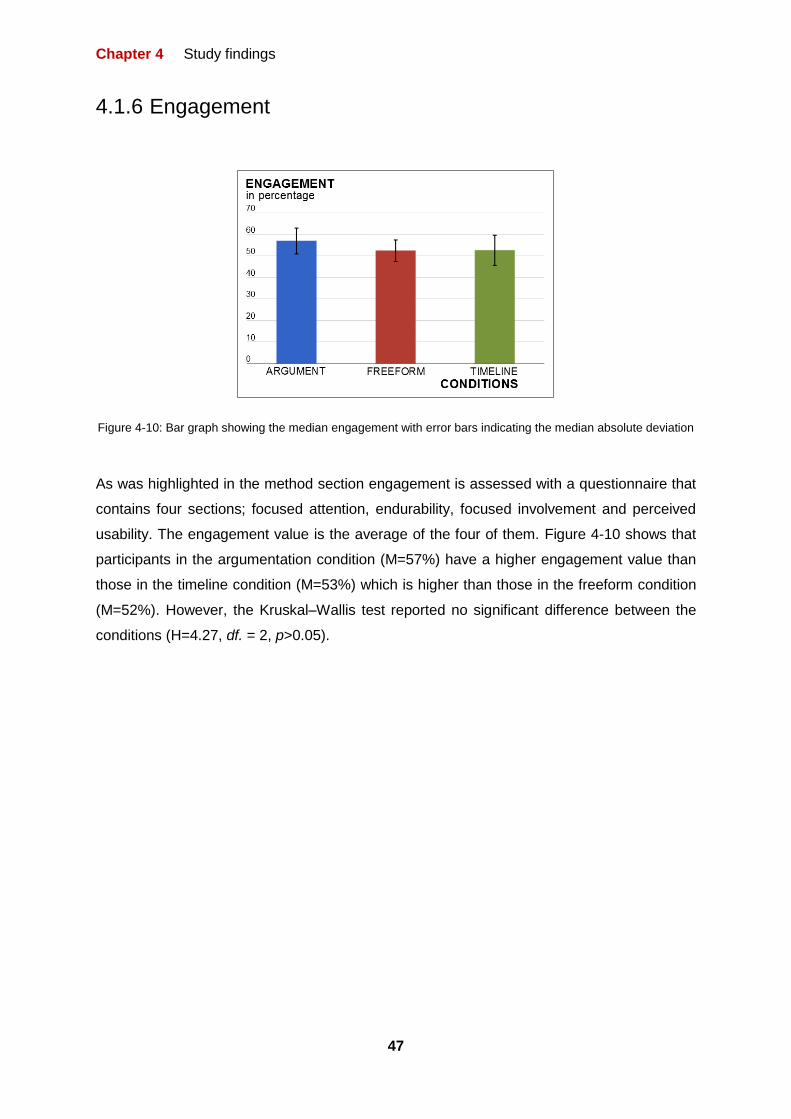
Chapter 4 Study findings
47
4.1.6 Engagement
Figure 4-10: Bar graph showing the median engagement with error bars indicating the median absolute deviation
As was highlighted in the method section engagement is assessed with a questionnaire that
contains four sections; focused attention, endurability, focused involvement and perceived
usability. The engagement value is the average of the four of them. Figure 4-10 shows that
participants in the argumentation condition (M=57%) have a higher engagement value than
those in the timeline condition (M=53%) which is higher than those in the freeform condition
(M=52%). However, the Kruskal–Wallis test reported no significant difference between the
conditions (H=4.27, df. = 2, p>0.05).

Chapter 4 Study findings
48
4.2 Summary of the study findings
A summary of the Kruskal-Wallis and Mann-Whitney test results are presented in the tables
below.
Variable type Dependent Variables Significance
Performance
Duration p>0.05
Recall Verse Precision p>0.05
Understanding p>0.05
User experience
Cognitive load p<0.05
Confidence p>0.05
Engagement p>0.05
Table 4-4: Summary of Kruskal-Wallis test results
A Kruskal-Wallis test was conducted on all dependent variables. The summary of the result
are presented in Table 4-4. It indicates that (1) there was no significant difference acquired
in the duration, recall verse precision, understanding, confidence and engagement
dependent variables. (2) There was a significant differences acquired in the cognitive load
user experience dependent variable.
A Mann-Whitney U test was conducted on the cognitive load dependent variable. The
summary of the results are presented in table 4-5. It indicated that (1) the participants in the
argumentation condition significantly experienced higher cognitive load than those in the
freeform condition and this finding is a substantial one (2) participants in the argumentation
condition significantly experienced higher cognitive load than those in the timeline condition
and this also is a substantial finding (3) there was no difference between the timeline and
freeform conditions.
Dependent Variable Direction Significance Effect size
Cognitive load
Argument (1.2) > Freeform (0.7) p<0.05 r= 0.54
Argument (1.2) > Timeline (0.9) p<0.05 r= 0.44
Timeline (0.9) > Freeform (0.7) p>0.05
Table 4-5: Summary of the Mann-Whitney test and effect size results

Chapter 5 Post hoc exploratory analysis
49
Chapter 5 Post hoc exploratory analysis

Chapter 5 Post hoc exploratory analysis
50
5 Post hoc exploratory analysis
5.1 Overview
The findings from the study conducted to explore the impact that different types of external
representational structuring have on performance and user experience during intelligence
type investigations indicated that the participants in the freeform and timeline conditions
experienced lower cognitive load while conducting their task than the participants in the
argumentation condition. However, the user performance remained the same.
An informal review of the representations created by the freeform participants suggested that
participants in the freeform condition constructed a hybrid representation using the timeline
and argumentation approaches as well as others. We also observed that the participants in
the constricted conditions (timeline and argumentation) deviated from their constrictions to a
more hybrid approach.
In other to better understand the types of structuring that the participants actually did, an
exploratory analysis was conducted on the video protocols to (1) analyse and compare
representational structuring across conditions over time (2) understand the types of
structuring that participants perform in the freeform condition.
5.2 Analysing and comparing representational
structuring across conditions over time
In other to analyse and compare the types of structuring that the participants actually did, the
participants video screen recordings were coded. A coding scheme was designed to analyse
and characterise what the participants actually did over time. The coding scheme looked at
structural activities interpretive codes in the context of information seeking objectifiable
codes (see table 5-1). After the video screen recordings were coded, an activity timeline grid
adopted from Attfield (2005) was used to show the distribution of information seeking and
structural activities over time (see figure 5-1).
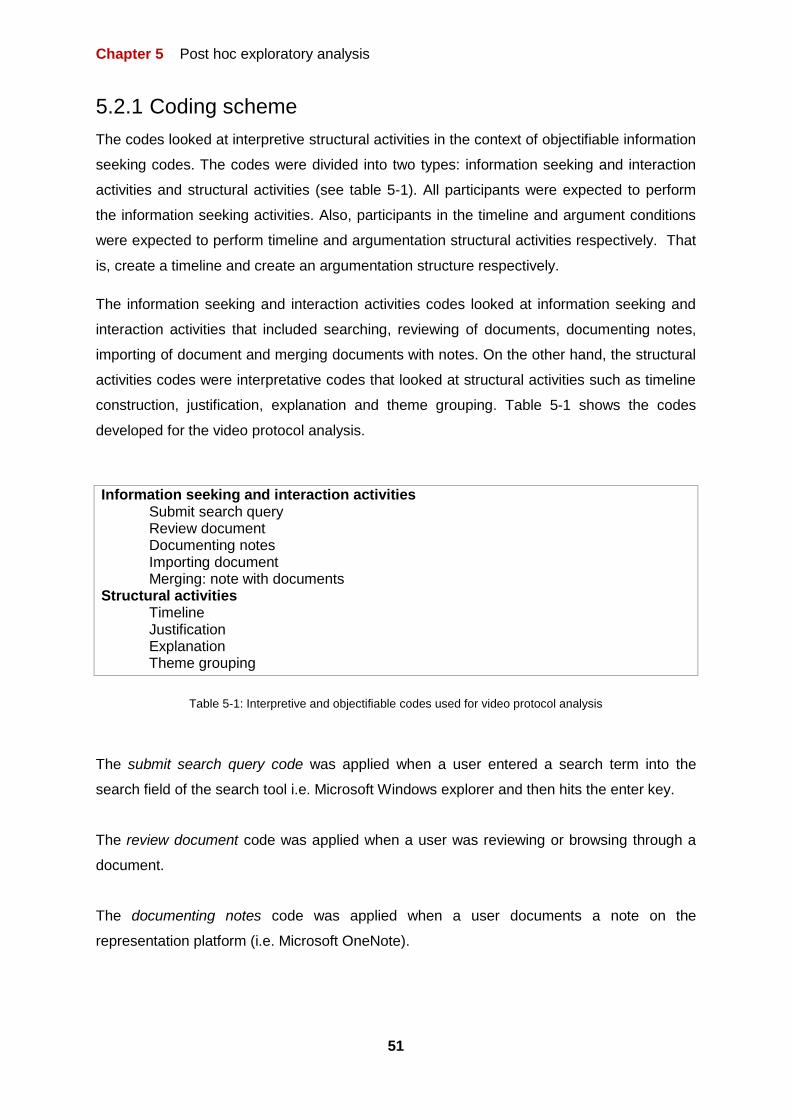
Chapter 5 Post hoc exploratory analysis
51
5.2.1 Coding scheme
The codes looked at interpretive structural activities in the context of objectifiable information
seeking codes. The codes were divided into two types: information seeking and interaction
activities and structural activities (see table 5-1). All participants were expected to perform
the information seeking activities. Also, participants in the timeline and argument conditions
were expected to perform timeline and argumentation structural activities respectively. That
is, create a timeline and create an argumentation structure respectively.
The information seeking and interaction activities codes looked at information seeking and
interaction activities that included searching, reviewing of documents, documenting notes,
importing of document and merging documents with notes. On the other hand, the structural
activities codes were interpretative codes that looked at structural activities such as timeline
construction, justification, explanation and theme grouping. Table 5-1 shows the codes
developed for the video protocol analysis.
Information seeking and interaction activities Submit search query Review document Documenting notes Importing document Merging: note with documents
Structural activities Timeline Justification Explanation Theme grouping
Table 5-1: Interpretive and objectifiable codes used for video protocol analysis
The submit search query code was applied when a user entered a search term into the
search field of the search tool i.e. Microsoft Windows explorer and then hits the enter key.
The review document code was applied when a user was reviewing or browsing through a
document.
The documenting notes code was applied when a user documents a note on the
representation platform (i.e. Microsoft OneNote).

Chapter 5 Post hoc exploratory analysis
52
The importing document code was applied when a user imported a document into the
platform either by (1) dragging and dropping the document or (2) selecting ‘import document’
in the file menu or (3) documenting the documents identification number.
The merging (note with document) code was applied when a user merged a document with a
note for easy repositioning (so that the document and note can be moved together easily).
The timeline code was applied when a user was performing activities which contributed to a
timeline relation that is, to show the distribution of various events over time.
The justification code was applied when a user was performing activities which contributed
to a justification relation that is, to provide justification or argumentative support for a claim.
The explanation code was applied when a user was performing activities which contributed
to an explanation relation that is, to show that an event causes another event to happen.
The theme grouping code was applied when a user was performing activities which
contributed to a theme grouping relation that is, to show that a group of events are related to
each other by a single theme.
5.2.2 Activity timeline grid
The activity timeline grid was used to represent the participant’s information seeking
behaviour and structural activities over time (see figure 5-1). Each column represents a
period of a minute and each row represents an activity. Where an activity occurs at least
once in a given minute, the corresponding cell is filled with a colour. All minutes (cells)
containing information seeking and behaviour activities i.e. activities that included searching,
reviewing, documenting notes, importing document and merging of documents and notes
were filled with the colour grey. In contrary, those minutes with structural activities i.e.
activities that included some structuring such as timeline construction, justification,
explanation and theme grouping were filled with different colours for easy discernment.
Timeline construction, theme grouping, explanation, justification are coloured yellow, red,
green and blue respectively.
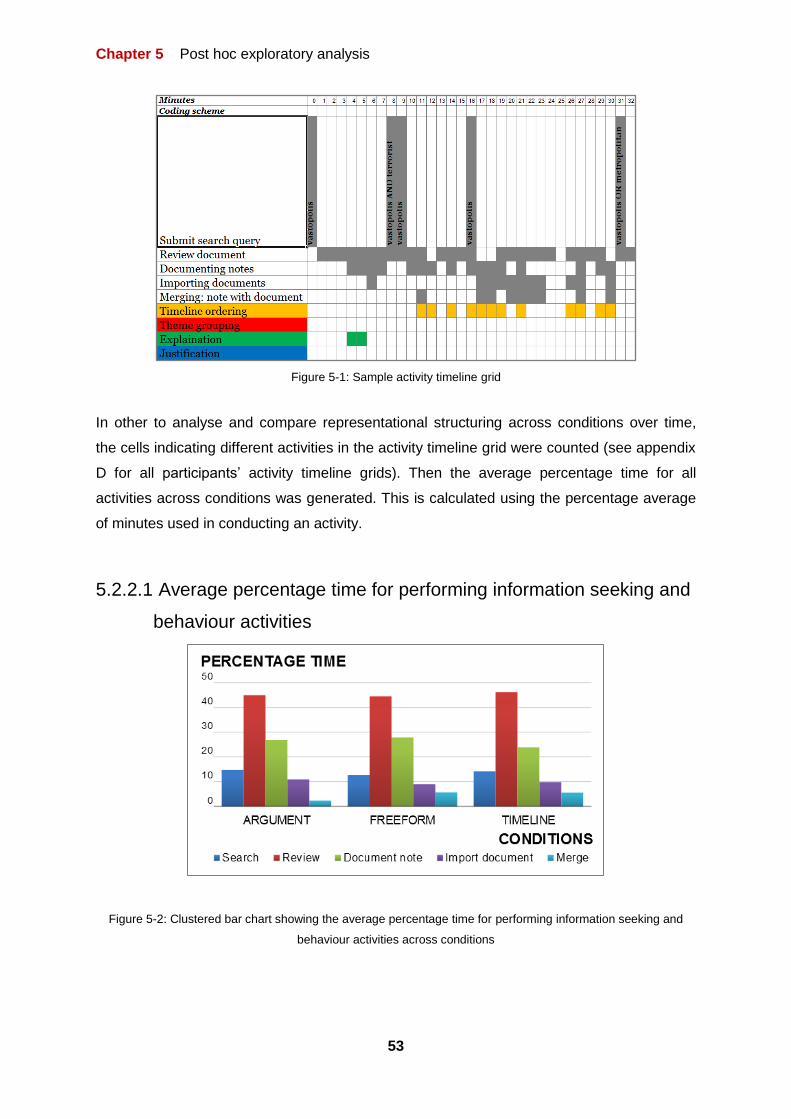
Chapter 5 Post hoc exploratory analysis
53
Figure 5-1: Sample activity timeline grid
In other to analyse and compare representational structuring across conditions over time,
the cells indicating different activities in the activity timeline grid were counted (see appendix
D for all participants’ activity timeline grids). Then the average percentage time for all
activities across conditions was generated. This is calculated using the percentage average
of minutes used in conducting an activity.
5.2.2.1 Average percentage time for performing information seeking and
behaviour activities
Figure 5-2: Clustered bar chart showing the average percentage time for performing information seeking and
behaviour activities across conditions

Chapter 5 Post hoc exploratory analysis
54
As stated earlier in section 5.2.1, information seeking and behaviour activities are the
activities we expect all participants to perform. These activities include searching, reviewing
of documents, documenting of notes, importing of documents and merging of documents
and notes. Figure 5-2 indicates a similar distribution of information seeking and behaviour
activities across conditions. The Kruskal-Wallis test reported no significant difference for
searching (H=.024, df. =2, p>0.05), reviewing (H=.450, df. =2, p>0.05), documenting note
(H=1.028, df. =2, p>0.05), importing documents (H=.055, df. =2, p>0.05) and merging
documents and notes (H=2.659, df. =2, p>0.05).
5.2.2.2 Average percentage time for performing structural activities
Figure 5-3: Clustered bar chart showing the average percentage time for performing structural activities across
conditions
As stated in section 5.2, structural activities are those activities that include some structuring
such as timeline, justification, explanation and theme grouping structuring. Figure 5-3 shows
that (1) as expected, the timeline structural activity is more prominent in the timeline
condition (67% of minutes featured some timeline construction). (2) Also as expected, the
justification structural activity is more prominent in the argumentation condition (52% of
minutes featured some justification construction). (3) However, the freeform condition
exhibited a heterogeneous representation of structural activities with timeline structuring
activities as the most prominent (65% of minutes featured some timeline construction).

Chapter 5 Post hoc exploratory analysis
55
Figure 5-3 also shows that the timeline and argumentation conditions moved away from their
constrictions towards a more freeform approach i.e. elements of timeline can be found in the
argumentation condition and elements of justification can also be found in the timeline
condition as well as others. This could be because the participants of the timeline and
argumentation conditions were told to construct their representations using timeline and
argumentation structures respectively but were not constricted to do so. The Kruskal-Wallis
test reported no significant difference for timeline (H=2.796, df. =2, p>0.05), theme grouping
(H=.362, df. =2, p>0.05), explanation (H=.571, df. =2, p>0.05) and justification (H=4.237, df.
=2, p>0.05).
5.2.3 Exploring user-generated representations in investigatory
sensemaking tasks
During the process of analysing and comparing representational structuring across
conditions over time, other observations were made; (1) the user representation grammar
evolved, becomes increasingly sophisticated over time as their representation expanded, (2)
users considered what they did in terms of the costs (time and cognition) it took to construct
various relations (3) it seemed that these entities and multiple relation types are embedded
within others and (4) the users seemed to be applying their own representation rules.
Using participant 7 as a case study, the user started their representation by dragging an
information object from the search tool (the left of the figure 5-4) into the representation
interface (the right of the figure). The information object is represented by an object icon (see
figure 5-4). The number below the object icon represents the file name of the object.
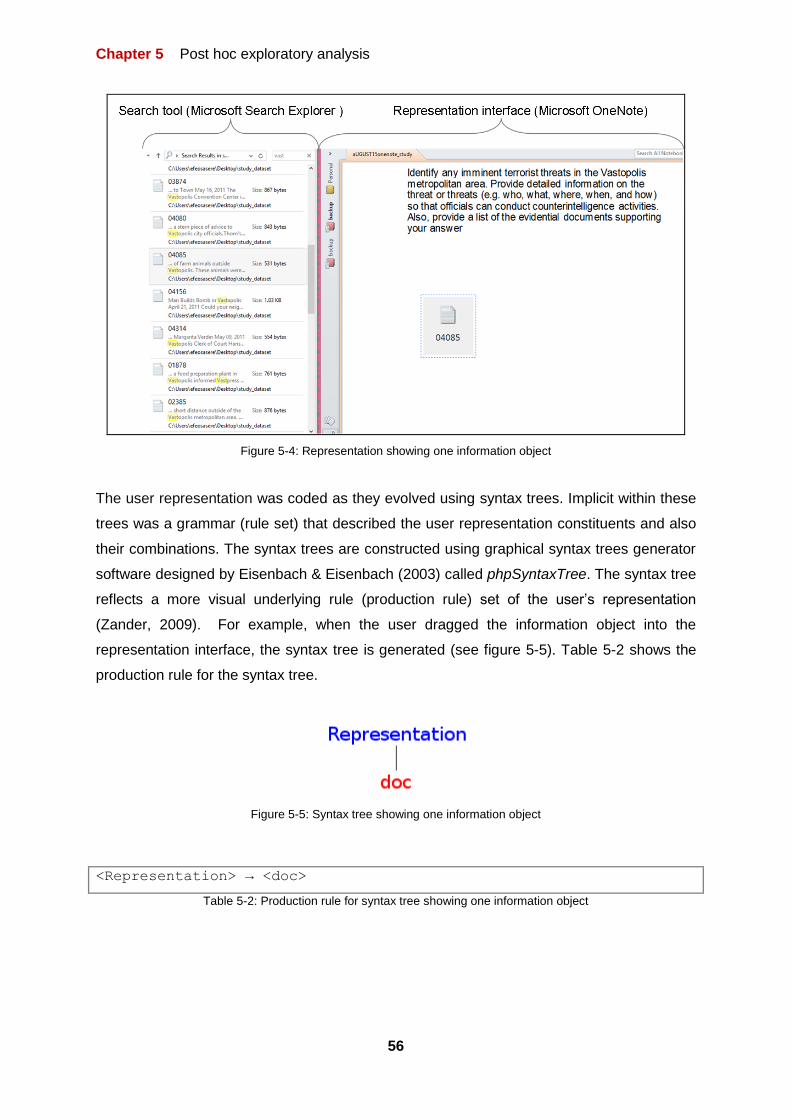
Chapter 5 Post hoc exploratory analysis
56
Figure 5-4: Representation showing one information object
The user representation was coded as they evolved using syntax trees. Implicit within these
trees was a grammar (rule set) that described the user representation constituents and also
their combinations. The syntax trees are constructed using graphical syntax trees generator
software designed by Eisenbach & Eisenbach (2003) called phpSyntaxTree. The syntax tree
reflects a more visual underlying rule (production rule) set of the user’s representation
(Zander, 2009). For example, when the user dragged the information object into the
representation interface, the syntax tree is generated (see figure 5-5). Table 5-2 shows the
production rule for the syntax tree.
Figure 5-5: Syntax tree showing one information object
<Representation> → <doc>
Table 5-2: Production rule for syntax tree showing one information object

Chapter 5 Post hoc exploratory analysis
57
The next step of the user representation, they inserted another information object (see figure
5-6). The syntax tree generated is provided in figure 5-7. Figure 5-7 shows that the
representation now consists of two information objects. The production rule is provided in
table 5-3. In order to indicate entities that contain a potentially infinite number of a given
sub-entity in the production rule, the mathematical recursive rule was used. Recursive
rules are rules that define an entity by reference to itself. For example, instead of writing
<doc> multiple times, it is represented with <doc>n.
Figure 5-6: Representation showing two information objects
Figure 5-7: Syntax tree showing two information objects
<Representation> → <doc>n
Table 5-3: Production rule for syntax tree showing two information objects
In the next step, the user merged the information object with the information objects title and
date by linking them using an arrow (see figure 5-8). After observing several actions, the
combination of an information object and its title and date was named as an information
object surrogate because of the function it plays in the user representation. It functions as a
proxy for the information object itself. The syntax tree of the representation is provided in
figure 5-9. Table 5-4 shows the production rule for the syntax tree in figure 5-9.
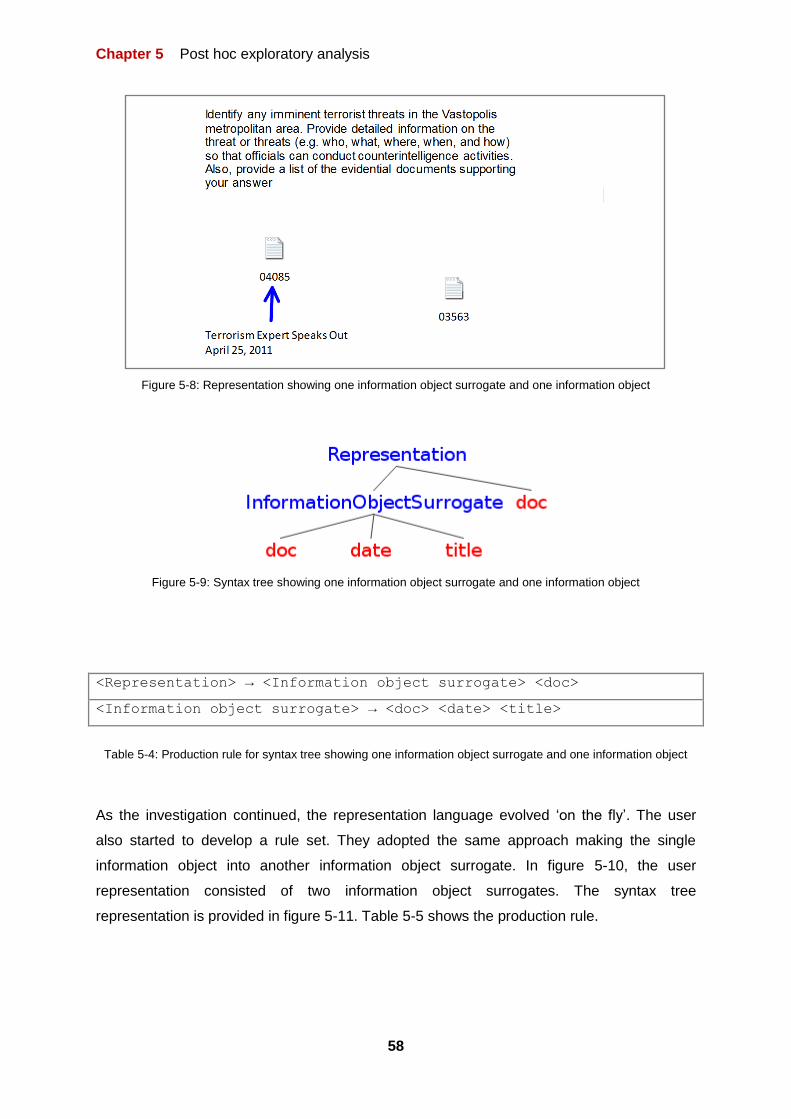
Chapter 5 Post hoc exploratory analysis
58
Figure 5-8: Representation showing one information object surrogate and one information object
Figure 5-9: Syntax tree showing one information object surrogate and one information object
<Representation> → <Information object surrogate> <doc>
<Information object surrogate> → <doc> <date> <title>
Table 5-4: Production rule for syntax tree showing one information object surrogate and one information object
As the investigation continued, the representation language evolved ‘on the fly’. The user
also started to develop a rule set. They adopted the same approach making the single
information object into another information object surrogate. In figure 5-10, the user
representation consisted of two information object surrogates. The syntax tree
representation is provided in figure 5-11. Table 5-5 shows the production rule.

Chapter 5 Post hoc exploratory analysis
59
Figure 5-10: Representation showing two information object surrogates
Figure 5-11: Syntax tree showing two information object surrogates
<Representation> → <Information object surrogate>n
<Information object surrogate> → <doc> <date> <title>
Table 5-5: Production rule for syntax tree showing two information object surrogates
As the investigation continued, they adopted a quicker approach in creating the information
object surrogates (see figure 5-12). This was done by merging the constituents of the
information object together rather than spending more seconds to draw arrows i.e. arrows
exchanged for proximity to signal association. This we assume was a more efficient use of
space and easier to create. That is, they were also considering what they did in terms of the
cost (time) it took to create those relations. The syntax tree and production rule remains the
same as in figures 5-11 and table 5-5 respectively.

Chapter 5 Post hoc exploratory analysis
60
Figure 5-12: Representation showing multiple information objects surrogates
As they continued with their investigations, when they reviewed an information object they
considered as relevant, they created information object surrogates of them all. Also, as the
investigation continued, they started to see similar themes within the information objects. So,
they needed to expand the language they had already set by adopted a new language of
theming (thematic association) (see figure 5-13). Figure 5-13 shows themed information
object surrogates. The syntax tree generated and production rule is provided in figure 5-14
and table 5-6 respectively.
Figure 5-13: Representation showing multiple information objects surrogates in a theme

Chapter 5 Post hoc exploratory analysis
61
Figure 5-14: Syntax tree showing multiple information objects surrogates and a theme
<Representation> → <Theme> <Information object surrogate>n
<Theme> → <Information object surrogate>n
<Information object surrogate> → <doc> <date> <title>
Table 5-6: Production rule for syntax tree showing multiple information objects surrogates and a theme
The next phase, colour coding was introduced to distinguish themes (see figure 5-15). This
we assume leverages pre-attentive processing. Pre-attentive processing is “the ability of the
low-level human visual system to rapidly identify certain basic visual properties” (Healey &
Enns, 2012, p. 1170). From figure 5-15, we can also observe that the information object
surrogates are chronologically sorted within their specific themes. Here, the user had a
timeline relation embedded in a theme relation. The syntax tree generated and production
rule are provided in figure 5-16 and table 5-7 respectively.
Figure 5-15: Representation showing colour coded themes
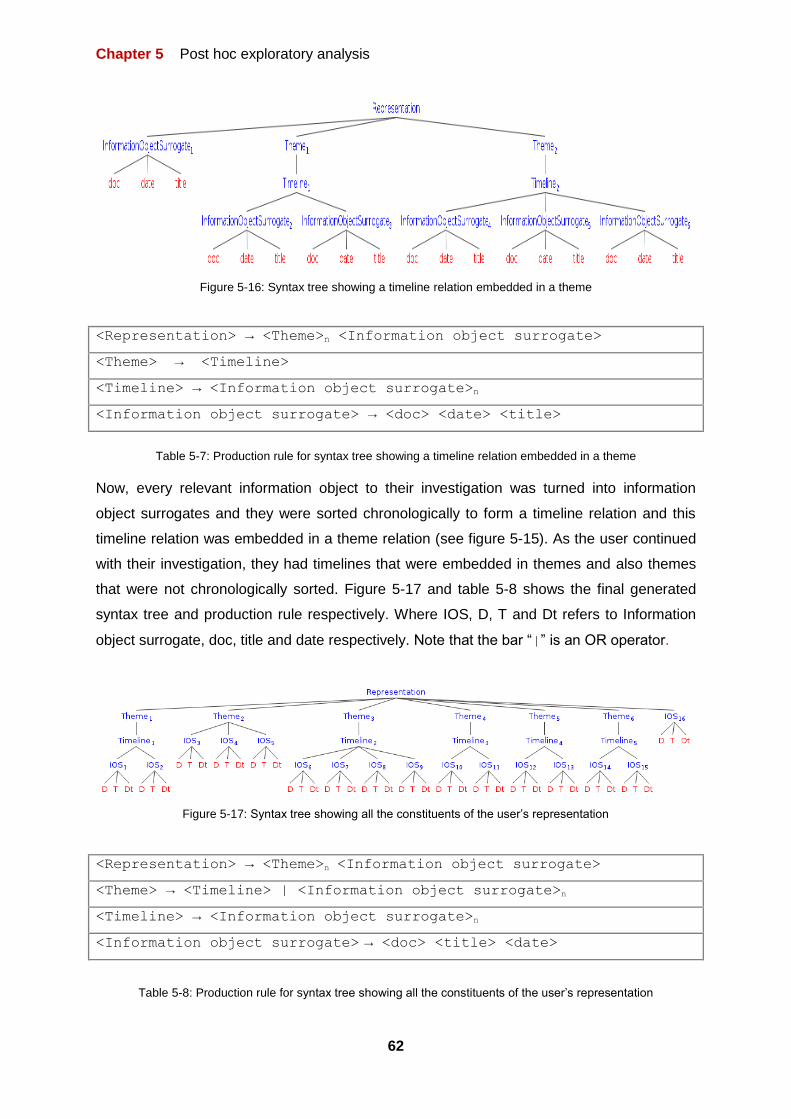
Chapter 5 Post hoc exploratory analysis
62
Figure 5-16: Syntax tree showing a timeline relation embedded in a theme
<Representation> → <Theme>n <Information object surrogate>
<Theme> → <Timeline>
<Timeline> → <Information object surrogate>n
<Information object surrogate> → <doc> <date> <title>
Table 5-7: Production rule for syntax tree showing a timeline relation embedded in a theme
Now, every relevant information object to their investigation was turned into information
object surrogates and they were sorted chronologically to form a timeline relation and this
timeline relation was embedded in a theme relation (see figure 5-15). As the user continued
with their investigation, they had timelines that were embedded in themes and also themes
that were not chronologically sorted. Figure 5-17 and table 5-8 shows the final generated
syntax tree and production rule respectively. Where IOS, D, T and Dt refers to Information
object surrogate, doc, title and date respectively. Note that the bar “|” is an OR operator.
Figure 5-17: Syntax tree showing all the constituents of the user’s representation
<Representation> → <Theme>n <Information object surrogate>
<Theme> → <Timeline> | <Information object surrogate>n
<Timeline> → <Information object surrogate>n
<Information object surrogate> → <doc> <title> <date>
Table 5-8: Production rule for syntax tree showing all the constituents of the user’s representation
Chapter 5 Post hoc exploratory analysis
63
5.2.3.1 Conclusion
In conclusion of this section (section 5.2), we can say that (1) the timeline and argumentation
conditions tend towards the freeform condition. That is, if users are left to their own devices
in a sensemaking task (i.e. without adequate constrictions), users will create hybrid type
representations consisting of various structural activities while having similar information
seeking and interaction behaviours. (2) The users representation grammar evolves,
becomes increasingly sophisticated over time as their representation expands, (3) users will
consider what they do in terms of the costs (time and cognition) it takes to construct various
relations and it seems that these entities and multiple relation types are embedded within
others.
Chapter 5 Post hoc exploratory analysis
64
5.3 Understanding the embedding of structural
conventions in freeform conditions
There is a reason to believe from the section on analysing and comparing representational
structuring across conditions over time (see section 5.2) that when users are left to their own
devices in a sensemaking task, they create complex heterogeneous representations
consisting of various entities and multiple relation types. Further, it seems that these entities
and multiple relation types are embedded within others (see section 5.2.3) so there is a need
for a hierarchical theory to unpack them.
Also we assume users do what they do for a reason. When provided with some tools to
solve a sensemaking problem, they will use those tools in a way that supposedly supports
their cognition. They will, presumably, also consider what they do in terms of the costs (time
or cognition) it takes to do it but, what they do reflects their needs. So by understanding what
they do, we are in a better position to understand their needs and therefore to design for
them. By understanding representation elements and how they relate to each other (their
relations), we can think about how to enable users to create them and relate them easily.
Also, we can think about why they find them helpful and also the frequency with which they
create them in different circumstances. Hence, it possibly represents a way of characterising
and measuring what is important as well as the impact of sensemaking manipulations.
5.3.1 The functional theory of embedded representational
structuring (ERST)
What we wanted to do is to find a theory that helps to characterise and describe these
complex heterogeneous representations primarily in terms of their relations and elements. In
order to do this, a functional theory of embedded representational structuring (ERST) was
developed. The functional theory of embedded representational structuring (ERST)
describes and characterises embedded representational structuring primarily in terms of
their function (roles or use) in a representation. The significance of creating a functional
theory of embedded representational structuring is that it provides an abstraction of the rules
underlying a representation. That is, a way of understanding what the units of a
representation are. Also, how they can be combined with the rules that the user has set up
and these rules are important because they provide a basis for interpretation. Therefore
analysis of multiple entities and element relation seems appropriate.

Chapter 5 Post hoc exploratory analysis
65
The theory had to take an interpretative analysis path because we are interested in the
meaning that certain relations had to the user, irrespective of their spatial features. We are
making an attempt to capture user intent based on the analyst’s interpretation of intended
meaning and a given meaning or intent may be represented in any number of ways. It is the
intent that the user captures in their representation. For example, the user expressing that
two things are related in virtue of one providing an explanation of the other, or that they are
related by a single theme, or that they are distributed over time. So, the analysis had to be
anchored in meaning and not form. The approach is not guided by objectively observable
features, ‘not positivist’ like the approach used by Kong, Zhang, & Zeng (2006) to describe
the physical layout and abstract structure of graphical user interfaces that determine
relationships based on spatial relationships and a fixed grammar but ‘interpretative’ like the
approached used by Mann & Thompson (1988) in the definition of the Rhetorical Structure
Theory (RST).
RST “…is a descriptive theory of a major aspect of the organisation of natural text. It
is a linguistically useful method for describing natural texts, characterising their
structure primarily in terms of relations that hold between parts of the text.” (Mann &
Thompson, 1988 p. 243).
Mann & Thompson (1988) indicated that there are no particular indicators or cues that signal
a particular relation. That it is down to the interpretation of the analyst.
The difference between the Embedded Representational Structuring Theory (ERST) and
Rhetorical Structure Theory (RST) lies in their mapping and the independence of their parts.
RST analyses text and text are linear constructs (one dimensional in nature). In contrary the
ERST analyses representation structures and representations are best described using
more than one dimension (multi-dimensions). For example, complex objects such as tables,
may be difficult to express in RST. What are their constituents? Are they rows and columns?
The problem is that RST assumes that each object is independent (Mann & Thompson,
1988) which leads to a “mono-hierarchical mapping” (Will & Will, 2009). In contrary, that is
not the case with ERST. It assumes that relations can be independent and also dependent
on other relations or elements. That is, a single relation can be part of other relations leading
to a “poly-hierarchical mapping” (Will & Will, 2009). This definitely transgresses the axiom of
RST.
Since the work is interpretative, it has to follow the principles of interpretative research. Klein
& Myers (1991) provided a set of principles for conducting and evaluating interpretative field
studies in information systems of which two are particularly important here or applicable to

Chapter 5 Post hoc exploratory analysis
66
the current work: the fundamental principle of the hermeneutic circle and the principle of
abstraction and generalisation.
The fundamental principle of the hermeneutic circle is an iterative process that follows the
idea that from the understanding of parts and their relationships, we come to understand a
complex whole and from the whole we come to understand the parts (Klein & Myers, 1991).
It is only through this hermeneutic circle understanding of “parts to whole and from the whole
back to its parts” that we can understand each part and the entire representation. So every
single representation was attended to in similar matter.
The principle of abstraction and generalisation requires providing a theory from the data
collected and then provide idiographic details to support that theory (Klein & Myers, 1991)
i.e. relating the idiographic details acquired from the interpretation of the data to theoretical
principles. This allows the reader to be able to follow the researcher’s theoretical insight.
5.3.1.1 How the theory was generated
The Embedded Representational Structure Theory (ERST) was generated from (1) the
analysis of the freeform participants representations using the fundamental principle of the
hermeneutic circle and the principle of abstraction and generation. The fundamental principle
of the hermeneutic circle was used to get an understanding of every representation and their
units. This was then generalised and backed up with idiographic details. (2) The analysis of
the representation syntax trees and their production rules (see section 5.2.3).
5.3.1.2 Relations of the Embedded Representational Structure Theory
The relations of the ERST consist of elements and elements are constituents of relations.
For example the information object surrogate relation has summary, source and date as its
elements. An element can either be mandatory or optional, a mandatory element is an
element that a relation must have and an optional element qualifies a relation and can be
added to a relation but does not have to be present. For example in the information object
surrogate relation, the mandatory element is the summary element and the optional
elements are the date and source elements.
Relations are polyhierarchical meaning that an element can independently be a member of
more than one relation resulting in a polyhierarchical syntax tree. This we have discussed in
the ERST section earlier (see section 5.3.1). An example is the justification relation which is

Chapter 5 Post hoc exploratory analysis
67
expressed as a combination of a claim or imperative and its evidential support but, in one of
the examples of a justification relation, a justification relation is expressed as a combination
of a claim element and a timeline relation acting as its evidential support.
Relations are defined in functional terms. For example the explanation relation elements are
explanans and explanandum they are defined by their roles in the representation as
intended by the user as well as the elements that constitute them.
5.3.1.3 Relations and their definitions
A number of relations and their elements were identified. They are presented in the table 5-9
Information object surrogate relation Mandatory element: Summary (can either be title or gist or both) Optional element: Date Optional element: Source
Timeline relation Multiple Information object surrogate relation with mandatory date element
Themed grouping relation Multiple Information object surrogate relation
Explanation relation Mandatory element: Explanans Mandatory element: Explanandum
Justification relation Mandatory element: Claim Mandatory element: Evidential support
Table 5-9: Relations and elements of the ERST
5.3.1.3.1 Information object surrogate relation
An information object surrogate relation is a combination of a summary element (which can
either be a gist or a title), a date and source element where the summary element is a
mandatory element and the date and source elements are both qualifiers (optional elements)
(see table 5-10). The information object surrogate relation stands as a proxy of the
information object itself (see section 5.2.3). It allows the user to review an information object
at a glance and access its contents easily. An information object could be a document or a
video or sound file etc.
Information object surrogate Relation Summary ( title or gist or both) mandatory element Date optional element Source optional element
Table 5-10: Information object surrogate relation and elements

Chapter 5 Post hoc exploratory analysis
68
Information object surrogate elements
Summary element
The summary element is a statement of content of an information object. It consists of a gist
or title or both. The title is the title or headline of an information object while the gist is a
summary or a significant subset of the object’s content. It allows the user to view the central
idea of an information object without reopening the actual object i.e. it reminds the user of
the significant content in the information object.
Date element
The date element allows the user to keep track of events as they occur. It is the date that an
information object is published or that a reported event occurred.
Source element
The source element is an information object icon or text string with the information object
identification number (e.g. 03040) or a combination of both. The source element acts as a
reference or pointer to the information object itself. It allows the user to have a ready access
to the actual information object i.e. a means through which the user can refind the original
information object.
Examples of information object surrogate relation
The information object surrogate can occur in various ways. Figure 5-18 shows an example
created by participant 16. In the study, the user created these by (1) opening an information
object from the search tool (Microsoft Windows Explorer) (on the left) by clicking on it to
open it (figure 5-19 shows a sample of the information object when opened). For example,
they click on the information object inside the red rectangle on the left which opens it in
figure 5-19 (2) reviewing it, (3) producing a summary of the information object content (gist
element) on the right and (4) dragging an information object icon that represents a source
from the search tool that displays the information objects into the representation interface
(Microsoft OneNote). The combination of both the source and the gist elements (highlighted
in the red rectangle on the right in figure 5-18) forms an information object surrogate.

Chapter 5 Post hoc exploratory analysis
69
Figure 5-18: Information object surrogate relation with gist and source elements created by participant 16
Figure 5-19: Sample information object (document) when opened
Figures 5-20 and 5-21 shows another example of the information object surrogate relation
created by participants 9 and 25. In the study, the users created these by (1) opening an
information object from the search tool (Microsoft Windows Explorer), (2) reviewing it, (3)
producing a summary of the information object content representing the gist (4) documenting
the date the information object was published (date element) and (5) dragging an information
object icon that represents a source from the search tool that displays the information
objects into the representation interface. The combination of the date, source and gist

Chapter 5 Post hoc exploratory analysis
70
elements (highlighted in the red rectangle on the right in figures 5-20 and 5-21) forms an
information object surrogate.
Figure 5-20: Information object surrogate relation with gist, source and date elements created by participant 9
Figure 5-21: Information object surrogate relation with gist, source and date elements created by participant 25
An alternative to the example in figures 5-20 and 5-21 is shown in figure 5-22. The only
difference here is the last step where instead of dragging an information object icon that
represents a source from the search tool, the user simply produced (typed out) the
document identification number (e.g. 04085) that represents the source of the information
object.

Chapter 5 Post hoc exploratory analysis
71
Figure 5-22: Information object surrogate relation with gist, source and date elements created by participant 20
Other information object surrogates examples with (1) title and date, (2) title, source and
date and (3) title, gist, source and date elements combinations can be found appendix E.
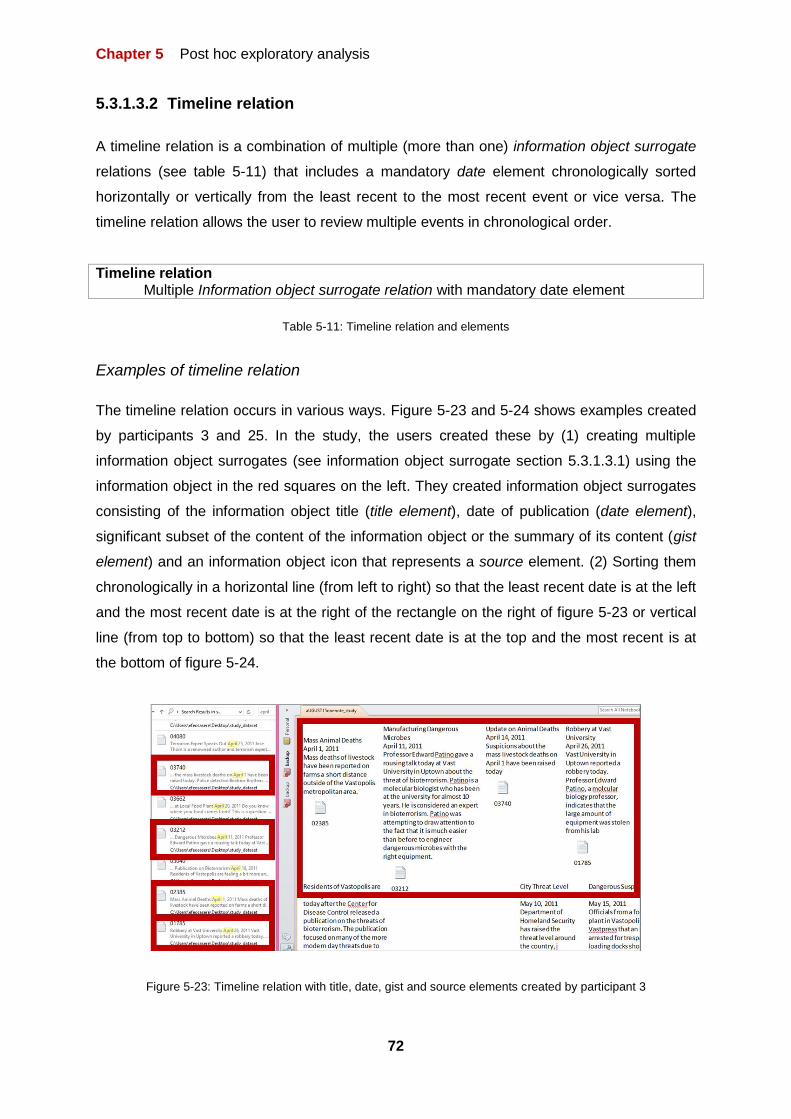
Chapter 5 Post hoc exploratory analysis
72
5.3.1.3.2 Timeline relation
A timeline relation is a combination of multiple (more than one) information object surrogate
relations (see table 5-11) that includes a mandatory date element chronologically sorted
horizontally or vertically from the least recent to the most recent event or vice versa. The
timeline relation allows the user to review multiple events in chronological order.
Timeline relation Multiple Information object surrogate relation with mandatory date element
Table 5-11: Timeline relation and elements
Examples of timeline relation
The timeline relation occurs in various ways. Figure 5-23 and 5-24 shows examples created
by participants 3 and 25. In the study, the users created these by (1) creating multiple
information object surrogates (see information object surrogate section 5.3.1.3.1) using the
information object in the red squares on the left. They created information object surrogates
consisting of the information object title (title element), date of publication (date element),
significant subset of the content of the information object or the summary of its content (gist
element) and an information object icon that represents a source element. (2) Sorting them
chronologically in a horizontal line (from left to right) so that the least recent date is at the left
and the most recent date is at the right of the rectangle on the right of figure 5-23 or vertical
line (from top to bottom) so that the least recent date is at the top and the most recent is at
the bottom of figure 5-24.
Figure 5-23: Timeline relation with title, date, gist and source elements created by participant 3
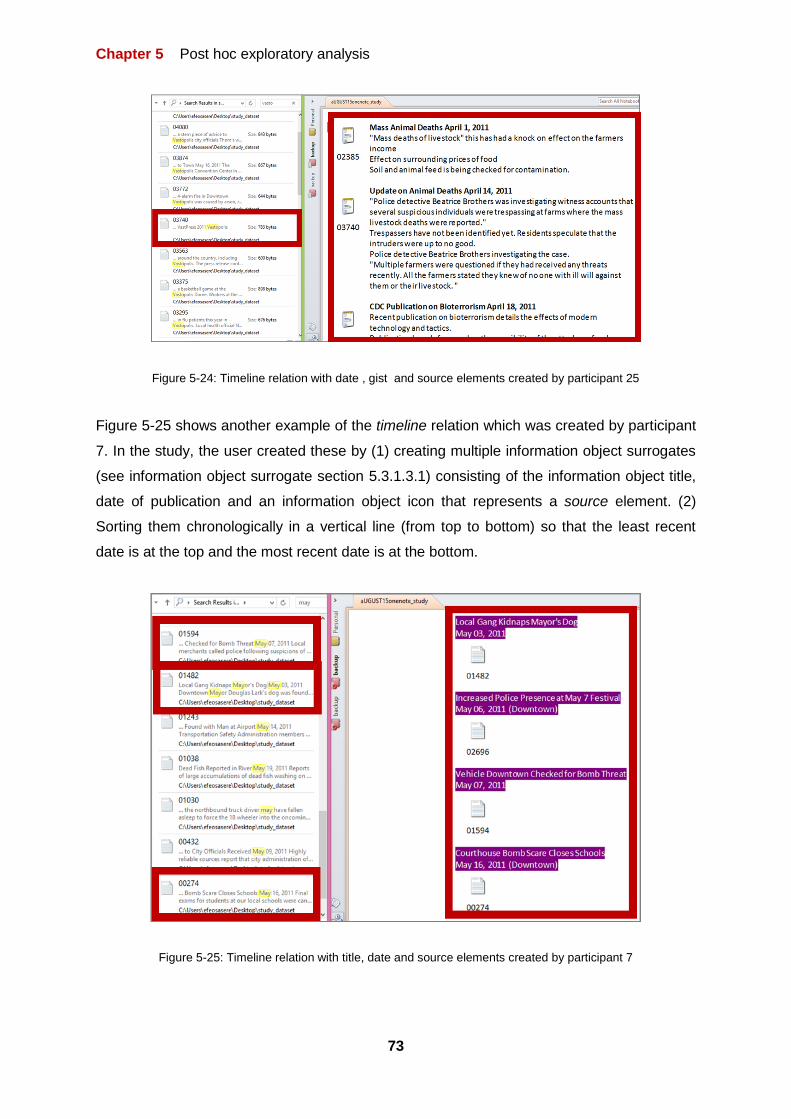
Chapter 5 Post hoc exploratory analysis
73
Figure 5-24: Timeline relation with date , gist and source elements created by participant 25
Figure 5-25 shows another example of the timeline relation which was created by participant
7. In the study, the user created these by (1) creating multiple information object surrogates
(see information object surrogate section 5.3.1.3.1) consisting of the information object title,
date of publication and an information object icon that represents a source element. (2)
Sorting them chronologically in a vertical line (from top to bottom) so that the least recent
date is at the top and the most recent date is at the bottom.
Figure 5-25: Timeline relation with title, date and source elements created by participant 7

Chapter 5 Post hoc exploratory analysis
74
Other timeline examples with (1) title, date and gist and (2) date, gist and source elements
combinations chronologically sorted together can be found in appendix E.
5.3.1.3.3 Themed grouping relation
A themed grouping relation is a combination of multiple (more than one) information object
surrogate relations (see table 5-12) on a given theme or topic. The themed grouping relation
allows the user to review multiple events of the same theme.
Themed grouping relation Multiple Information object surrogate relation
Table 5-12: Themed grouping relation and elements
Examples of themed grouping relation
The themed grouping relation occurs in various ways. Figure 5-26 shows one example
created by participant 9. In the study, the user created these by (1) creating multiple
information object surrogates (see information object surrogate section 5.3.1.3.1) consisting
of the summary of the content of the information object (gist element) and an information
object icon or information object identification number that represents a source element. (2)
Then they drew a line to relate them together and documented (typed out) “threat” to indicate
that they are both linked by a single theme “threat”.
Figure 5-26: Themed grouping relation created by participant 9 using lines

Chapter 5 Post hoc exploratory analysis
75
Figure 5-27 shows another example of the theme grouping relation which was created by
participant 7. In the study, the user created these by (1) creating multiple information object
surrogates consisting of the information object title, date of publication (date element) and an
information object icon that represents a source element. (2) Sorting them chronologically in
a vertical line so that the least recent date is at the top and the most recent at the bottom. (3)
Then, highlighted various surrogates and filled them with colour to indicate that they are
related to a single theme.
The information object surrogate filled with the red colour in figure 5-27 represents a
“bioterrorism equipment” theme. While the information object surrogate filled with purple,
yellow and blue colours represents “isolated cases”, “citizens for ethical treatment of lab
mice” which is one of the potential terrorist groups and “bioterrorism” respectively.
Figure 5-27: Themed grouping relation created by participant 7 using colour

Chapter 5 Post hoc exploratory analysis
76
5.3.1.3.4 Explanation relation
An explanation relation is a combination of two information object surrogate relations which
are linked through an explanatory relation with one in the role of explanans and the other
taking the role of explanandum (see table 5-13). The explanation relation allows the user to
express that an event explains why another event occurred or to express what caused an
event and the resulting effect of that cause.
Explanation relation Explanans mandatory element Explanandum mandatory element
Table 5-13: Explanation relation and elements
Explanation elements
Explanans element
The explanans is an element that is part of an explanatory relation whose role is to offer
explanation. It allows the user to express the cause of an event.
Explanandum element
The explanandum is an element that is part of an explanatory relation whose role is to be
explained. It allows the user to express the effect of a cause of an event.
Examples of explanation relation
The explanation relation occurs in various ways. Figure 5-28 shows one example created by
participant 3. The user created these by first relating two information object surrogates
together using arrows where the information object surrogate at the top left acts as the
explanans and the information object surrogate at the bottom right acts as the explanandum.
The temporal order at which the events occurred helped us to answer the question of which
information object surrogate is explaining which. We know this because of the temporal
order at which the events occurred, the first in April 26 and the other May 18.

Chapter 5 Post hoc exploratory analysis
77
Figure 5-28: Explanation relation with two information object surrogates created by participant 3
Figure 5-29 shows another example of the explanation relation which was created by
participant 3. The user creates these by relating three information object surrogate together
using arrows. The information object surrogate at the bottom left acts as an explanans
explaining the information object surrogate at the top. The information object surrogate at the
top in turns acts as an explanans explaining the other information object surrogate at the
bottom right. One can say that the information object surrogate in the middle is holding a
“dual role” in this relation i.e. it is two relations with the one in the middle participating in
both, first as an explanandum for the information object surrogate in the bottom left and an
explanans for the information object surrogate at the bottom right. The temporal order at
which the events occurred helps us to answer the question of which information object
surrogate is explaining which. Although the date of publication (date element) of the
information object surrogate on the left is not provided in the representation, but if one refers
back to the actual information object, it was published in April 18 i.e. before May 15 and the
information object surrogate at the middle was reported before the other information object
surrogate reported May 19.
One might ask what the difference between this example and a timeline relation is as they
are both chronologically sorted. In an easy way, the timeline relation shows the entire events
in the data set however, this example shows an explanatory chain consisting of explanation
pairs.

Chapter 5 Post hoc exploratory analysis
78
Figure 5-29: Explanation relation with three information object surrogates created by participant 3

Chapter 5 Post hoc exploratory analysis
79
5.3.1.3.5 Justification relation
A justification relation is a combination of a claim or imperative and its evidential support
(see table 5-14). The justification relation allows the user to express a claim and provide
support to increase the belief in the claim i.e. to show the argumentational support for a
claim.
Justification relation Claim mandatory element Evidential support mandatory element
Table 5-14: Justification relation and elements
Justification elements
Claim element
A claim is a statement or proportion. The claim allows the users to document their thinking or
inference.
Evidential support element
An evidential support is a visible representation of the information object. For example the
document icon or a text string with the document identification number (e.g. 03040) or a
combination of both. It allows the user to provide an evidential support to their claim in order
to support their belief or validate their claim.
Examples of justification relation
The justification relation occurs in various ways. Figure 5-30 shows an example of the
justification relation which was created by participant 14. Here, the user is answering the
question “who the potential terrorist were” which is one of the questions they were asked to
answer in their task. The user creates these by (1) producing (clicking on the representation
interface and typing) a claim “[the most likely terrorist group involved is the] Anarchists for
Freeform”. The Anarchists for Freeform is one of the terrorist groups mentioned in the data
set (2) the user associated their claim with an arrow to an evidential support which provides
evidence to support their thinking. This is done by dragging an information object from the
search tool into the representation interface. The information object used by the participant
mentions their choice (Anarchists for Freeform) as a threat (see figure 5-31).

Chapter 5 Post hoc exploratory analysis
80
Figure 5-30: Justification relation with a claim and evidential support created by participant 14
Figure 5-31: Sample of the information object’s content used by participant 14 to justify their claim
Figure 5-32 shows another example of the justification relation which was also created by
participant 14. Here, the user is answering the question of where the threat is likely to occur
which also is part of the questions they were asked to answer. The user starts by (1)
producing a claim “[the locations where the threat is likely to occur is] Downtown, Vastopolis,
Airport, Local plant, farm”. (2) Then they dragged multiple information objects from the
search tool to represent their evidential support. Each information object refers to these
place names giving reasons to believe that these are locations for possible threat.

Chapter 5 Post hoc exploratory analysis
81
Figure 5-32:Justification relation with single claim and multiple evidential support created by participant 14
For example the participant mentioned “Airport” as a likely location and one of the
information objects they used as their evidential support (document 01243) refers to the
location as under possible threat (see figure 5-33)
.
Figure 5-33: Sample information object used by participant 14 to provide support to their claim
Other justification relation examples with (1) imperative and evidential support and (2) claim
and timeline combinations can be found in appendix E.
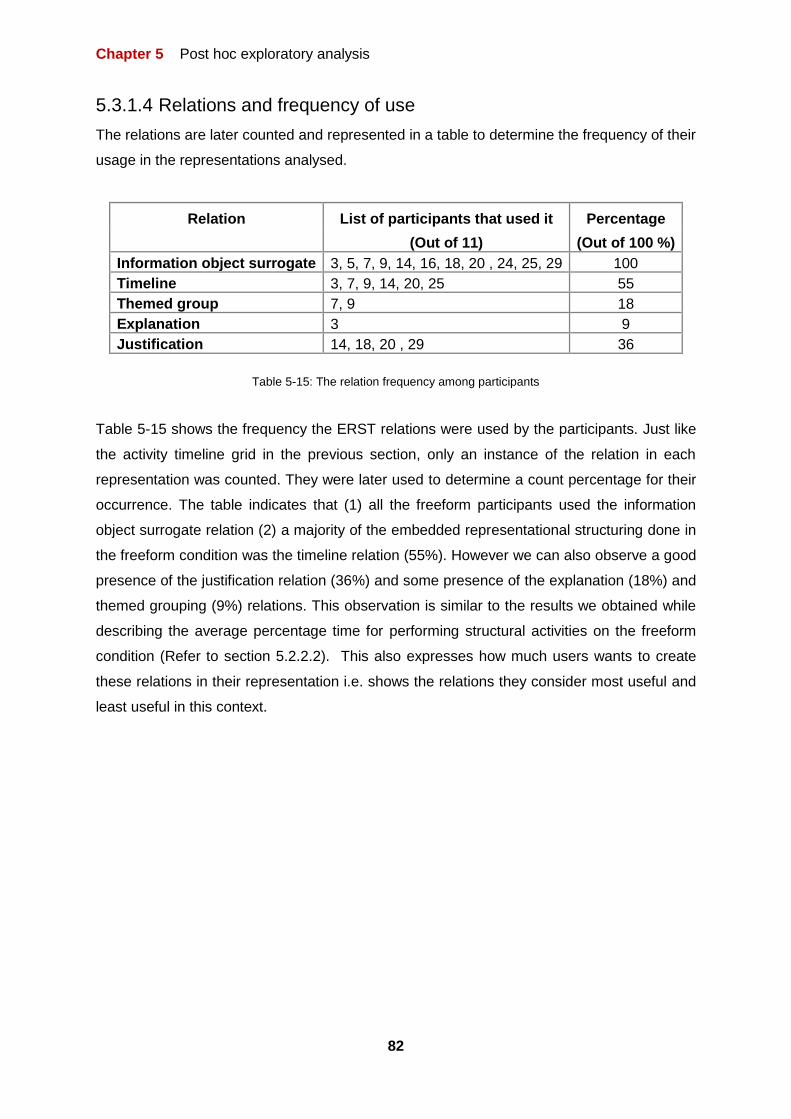
Chapter 5 Post hoc exploratory analysis
82
5.3.1.4 Relations and frequency of use
The relations are later counted and represented in a table to determine the frequency of their
usage in the representations analysed.
Relation List of participants that used it Percentage
(Out of 11) (Out of 100 %)
Information object surrogate 3, 5, 7, 9, 14, 16, 18, 20 , 24, 25, 29 100
Timeline 3, 7, 9, 14, 20, 25 55
Themed group 7, 9 18
Explanation 3 9
Justification 14, 18, 20 , 29 36
Table 5-15: The relation frequency among participants
Table 5-15 shows the frequency the ERST relations were used by the participants. Just like
the activity timeline grid in the previous section, only an instance of the relation in each
representation was counted. They were later used to determine a count percentage for their
occurrence. The table indicates that (1) all the freeform participants used the information
object surrogate relation (2) a majority of the embedded representational structuring done in
the freeform condition was the timeline relation (55%). However we can also observe a good
presence of the justification relation (36%) and some presence of the explanation (18%) and
themed grouping (9%) relations. This observation is similar to the results we obtained while
describing the average percentage time for performing structural activities on the freeform
condition (Refer to section 5.2.2.2). This also expresses how much users wants to create
these relations in their representation i.e. shows the relations they consider most useful and
least useful in this context.

Chapter 6 Discussion and Conclusion
83
Chapter 6 Discussion and Conclusion
Chapter 6 Discussion and Conclusion
84
6 Discussion and conclusion
6.1 Result summary and explanation
The outcome of the study to explore the effects that different types of representational
structuring (argumentation, timeline and freeform) have on performance and user experience
during intelligence type investigations indicated that the difference in user performance
across conditions were not significant. On face value, this indicates that timeline
representation did not offer an advantage in terms of user performance in relation to the
argumentation representation. However, we noted that participants in the timeline and
argumentation conditions deviated from their constrictions and constructed heterogeneous
representations (figure 5.3). This we can explain might be because participants in the
timeline and argumentation conditions were told to conduct their investigations using timeline
and argumentation representations respectively however; they were not constricted to do so.
There is room for a type II error i.e. saying that there is no significant differences when
there might be one (Campbell, 2013).
However, the outcome of the study indicates that there was a significant difference of
cognitive load across conditions. We found that (1) participants in the timeline condition
experienced lower cognitive load compared to the participants in the argumentation
condition. Pennington & Hastie (1986, 1988, 1992) stated that people structure court room
evidence in narrative form. We assume that cognitive load will be lower when users are
using methods which are natural to them. (2) The results also showed that the participants in
the freeform condition experienced lower cognitive load than those participants in the
argumentation condition. This could be explained by figure 5.3. Figure 5.3 allows us to
assume that the freeform condition contains a prominent percentage of timeline structural
activities. This we assume was a more natural way of performing sensemaking. (3) There
was no significant difference of cognitive load on freeform and timeline. This might be
because the freeform and timeline conditions have a near equal proportion of timeline
structuring in their average percentage time for performing structural activities (see section
5.2.2.2). In other words, cognitive load may directly co-vary with the proportion of timeline
structuring and also may inversely co-vary with the proportion of argumentation structuring.
Bex et al. (2010) stated that sometimes (in some aspects of a sensemaking task), the
argumentation approach is the most natural approach for sensemaking. This explains figure
5.3 that shows a heterogeneous representation in the freeform approach. We can infer that
when the freeform participants found timeline structuring as more natural, they used timeline

Chapter 6 Discussion and Conclusion
85
and when they found the argumentation approach as more natural, they used the
argumentation approach.
6.2 Embedded Representational Structure Theory
(ERST)
When creating external representations to support investigatory sensemaking, these
representations tend towards embedded, heterogeneous forms. The representational
‘language’ evolves in emergent, ad-hoc ways, becoming more sophisticated over time. We
assume that the chosen forms and their implementations depend on users- considerations of
cognitive task needs and characteristics of available tools. User-generated representations
can be described in terms of constituent structures. The Embedded Representational
Structure Theory (ERST) offers a developing approach to capture this. ERST may offer an
approach for systematically considering design alternatives for sensemaking tools and also
analysing user generated representations.
By analysing user generated representations, this can enable systematic comparisons to be
made between representations that are created under different independent variable
conditions, for example, task, source data, participants, and interface tools. Comparisons
can be made in terms of the kinds of relational structures that users create or metrics
associated with creating similar relational structures, such as those relating to usability or
user-experience.
Also, ERST may inform the design of sensemaking tools. The specification of interface tools
both in terms of the range of relational structures supported, and the specific means by
which they are realised may be identified.
However, there may be some limitations with respect to generalisation. ERST has only been
used in one study which makes it nearly impossible for generalisation. However, this leads
us to ways it can be expanded. Future studies can be conducted using a variety of tasks,
source data, participants and interface tools. This will provide ways the theory could be
expanded and also show how applicable the theory is.

Chapter 6 Discussion and Conclusion
86
6.2.1 Design suggestions
From the post hoc analysis sections, we have come to understand that users do what they
do for a reason. Given a sensemaking problem and some tool to help solve it, they will use
the tools in a way that supposedly supports their cognition. They will, presumably, also
consider what they do in terms of the costs (time or cognition) it takes to do it but, what they
do reflects their needs. So by understanding what they do, we are in a better position to
understand their needs and therefore to design for them.
From the study, design requirements can be suggested to support these kinds of task. The
requirements that can be suggested are; (1) sensemaking tools that support these kinds of
task should allow for the various variations of approaches a user can take with various
relations. This may save the time it takes to create the individual relations. (2) Sensemaking
tools that support these kinds of task should allow for a design tool kit that consists of a
composition of design languages (such as Information object surrogate, justification,
timeline, theme grouping and explanation relations) that a user can simply drag and drop
instead of creating them individually. For example, in design applications such as Autodesk
Homestyler, a free home design software where instead of constructing a chair, a user can
easily drag and drop an ‘already constructed’ chair into the visual canvas. In this case, the
user can for example drag a justification block into the visual canvas instead of creating a
claim, evidence and creating an association between them. (3) Sensemaking tools that
support these kinds of task may consider automatically turning the information objects into
information object surrogates and placing them into a timeline relation.
6.3 Study limitations
The following are the limitations of the study;
1. A possible criticism of the study as a means for testing the hypothesis is that
participants in the timeline and argumentation conditions were asked to construct
their representations using timeline and argumentation representations but where not
constricted to do so. Future research should take greater care to ensure that the
participants in the constricted conditions are adequately constricted to their
conditions, which might have a significant effect on their performance and user
experience.

Chapter 6 Discussion and Conclusion
87
2. Another criticism of the study was the number of participants used for the study.
Future research should take greater care to allow for more participants in each
condition. This might also have a significant effect on the results acquired for
performance and user experience
6.4 Conclusion
In conclusion, the results of the study suggested that: (a) users experience lower cognitive
load when they are free to structure information as they wish, (b) during their investigation
they create complex heterogeneous representations consisting of various entities and
multiple relation types and (c) their structuring activities can be described by a finite set of
embedded structuring conventions. In order to explore and analyse the embedding of
structural conventions within a single representation, the ERST was developed. ERST
provides an abstraction of a representation which therefore supports the analyst and
interface designer in considering representational sub-element independently in terms of
important factors such as the user-costs associated with creating them and their associated
cognitive affordances.

88
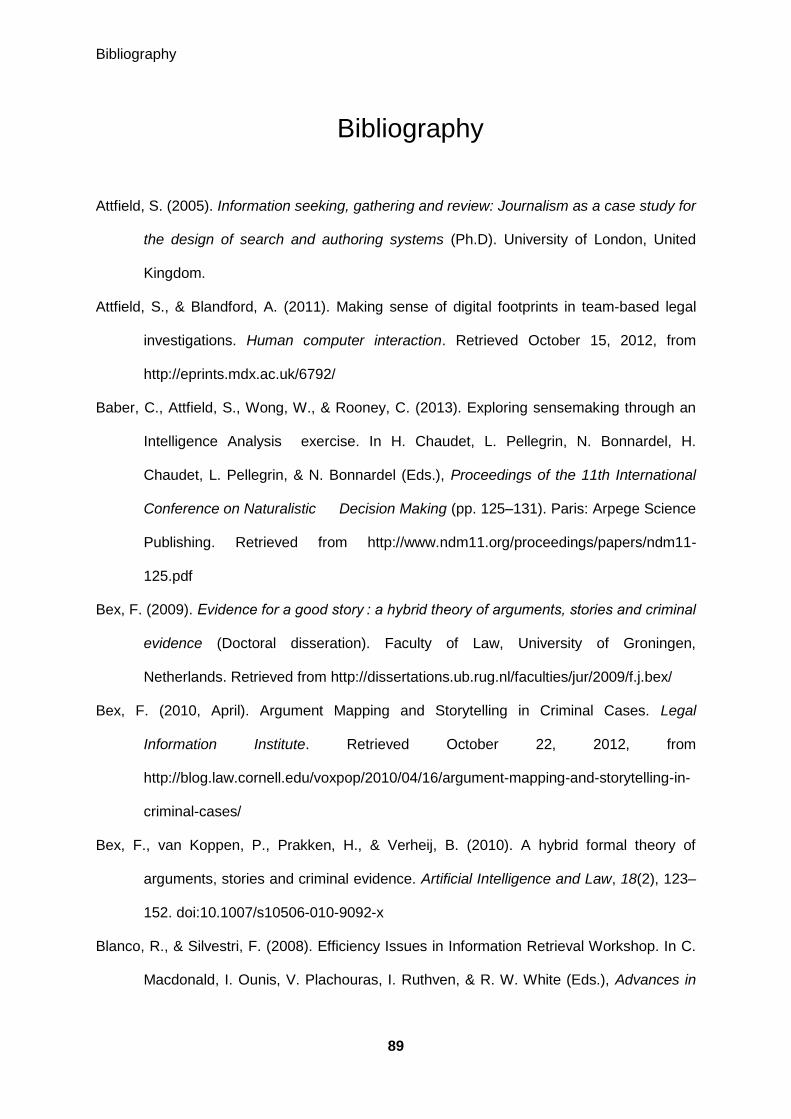
Bibliography
89
7 Bibliography
Attfield, S. (2005). Information seeking, gathering and review: Journalism as a case study for
the design of search and authoring systems (Ph.D). University of London, United
Kingdom.
Attfield, S., & Blandford, A. (2011). Making sense of digital footprints in team-based legal
investigations. Human computer interaction. Retrieved October 15, 2012, from
http://eprints.mdx.ac.uk/6792/
Baber, C., Attfield, S., Wong, W., & Rooney, C. (2013). Exploring sensemaking through an
Intelligence Analysis exercise. In H. Chaudet, L. Pellegrin, N. Bonnardel, H.
Chaudet, L. Pellegrin, & N. Bonnardel (Eds.), Proceedings of the 11th International
Conference on Naturalistic Decision Making (pp. 125–131). Paris: Arpege Science
Publishing. Retrieved from http://www.ndm11.org/proceedings/papers/ndm11-
125.pdf
Bex, F. (2009). Evidence for a good story : a hybrid theory of arguments, stories and criminal
evidence (Doctoral disseration). Faculty of Law, University of Groningen,
Netherlands. Retrieved from http://dissertations.ub.rug.nl/faculties/jur/2009/f.j.bex/
Bex, F. (2010, April). Argument Mapping and Storytelling in Criminal Cases. Legal
Information Institute. Retrieved October 22, 2012, from
http://blog.law.cornell.edu/voxpop/2010/04/16/argument-mapping-and-storytelling-in-
criminal-cases/
Bex, F., van Koppen, P., Prakken, H., & Verheij, B. (2010). A hybrid formal theory of
arguments, stories and criminal evidence. Artificial Intelligence and Law, 18(2), 123–
152. doi:10.1007/s10506-010-9092-x
Blanco, R., & Silvestri, F. (2008). Efficiency Issues in Information Retrieval Workshop. In C.
Macdonald, I. Ounis, V. Plachouras, I. Ruthven, & R. W. White (Eds.), Advances in

Bibliography
90
Information Retrieval (pp. 711–711). Springer Berlin Heidelberg. Retrieved from
http://ecir2008.dcs.gla.ac.uk/t_w_pdf/w2.pdf
Block, R. A., Hancock, P. A., & Zakay, D. (2010). How cognitive load affects duration
judgments: A meta-analytic review. Acta psychologica, 134(3), 330–343.
doi:10.1016/j.actpsy.2010.03.006
Block, R. A., & Zakay, D. (1997). Prospective and retrospective duration judgments: A meta-
analytic review. Psychonomic Bulletin & Review, 4(2), 184–197.
doi:10.3758/BF03209393
Brassil, D., Hogan, C., & Attfield, S. (2009). The centrality of user modeling to high recall
with high precision search. In IEEE International Conference on Systems, Man and
Cybernetics, 2009. SMC 2009 (pp. 91 –96). doi:10.1109/ICSMC.2009.5346738
Bruin, J. (2011). Central limit theorem. UCLA: Statistical Consulting Group. Retrieved July
3, 2013, from http://www.ats.ucla.edu/stat/stata/ado/teach/clt.htm
Calloway, J. (2013). Commentary: Predictive coding in e-discovery inescapable.
Massachusetts Lawyers Weekly.
Campbell, R. B. (2013). Type I and II error. University of Northern Iowa. Academic.
Retrieved November 11, 2013, from http://www.cs.uni.edu/~campbell/stat/inf5.html
Chalamish, M., Gabbay, D., & Schild, U. (2011). Intelligent evaluation of evidence using
Wigmore diagrams. In Proceedings of the 13th International Conference on Artificial
Intelligence and Law (pp. 61–65). New York, NY, USA: ACM.
doi:10.1145/2018358.2018366
Chapin, L., Attfield, S., & Okoro, E. M. (2013). Predictive Coding, Storytelling and God:
Narrative Understanding in e-Discovery. Presented at the DESI V Workshop,
Consiglio Nazionale delle Ricerche, Rome, Italy. Retrieved from
http://www.umiacs.umd.edu/~oard/desi5/Chapin-final.pdf
Chatman, S. (1980). Story and Discourse: Narrative Structure in Fiction and Film. Cornell
University Press.
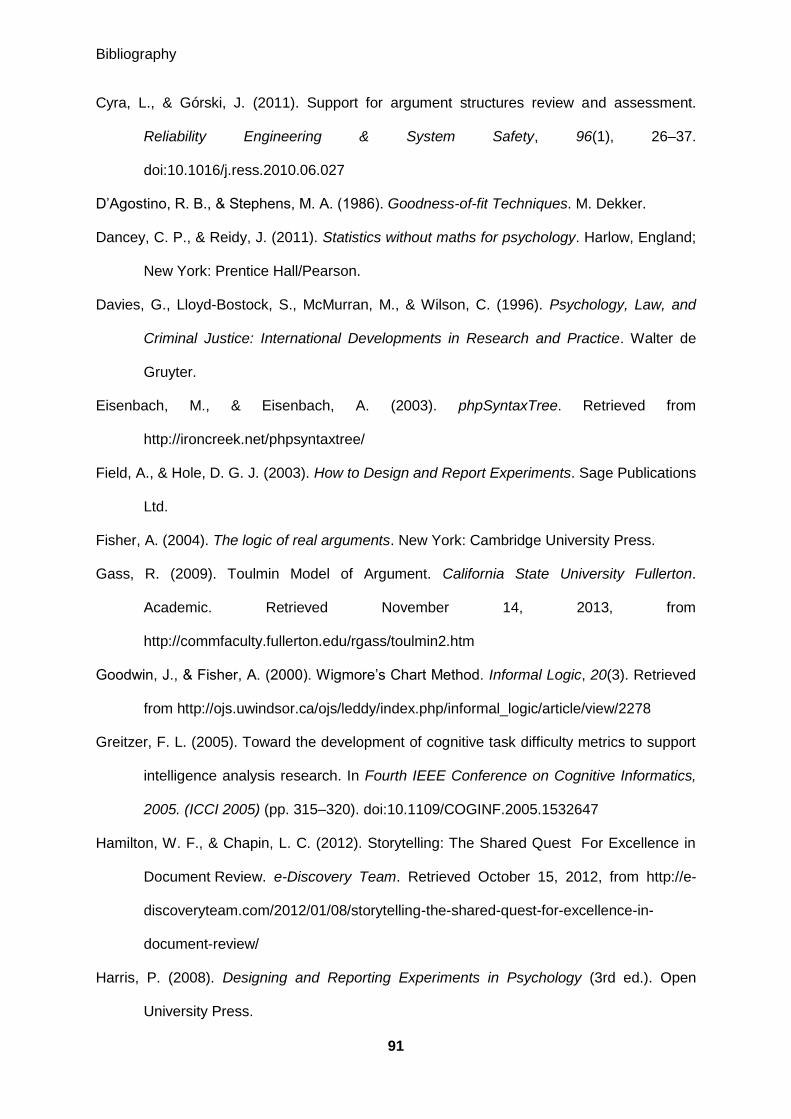
Bibliography
91
Cyra, L., & Górski, J. (2011). Support for argument structures review and assessment.
Reliability Engineering & System Safety, 96(1), 26–37.
doi:10.1016/j.ress.2010.06.027
D’Agostino, R. B., & Stephens, M. A. (1986). Goodness-of-fit Techniques. M. Dekker.
Dancey, C. P., & Reidy, J. (2011). Statistics without maths for psychology. Harlow, England;
New York: Prentice Hall/Pearson.
Davies, G., Lloyd-Bostock, S., McMurran, M., & Wilson, C. (1996). Psychology, Law, and
Criminal Justice: International Developments in Research and Practice. Walter de
Gruyter.
Eisenbach, M., & Eisenbach, A. (2003). phpSyntaxTree. Retrieved from
http://ironcreek.net/phpsyntaxtree/
Field, A., & Hole, D. G. J. (2003). How to Design and Report Experiments. Sage Publications
Ltd.
Fisher, A. (2004). The logic of real arguments. New York: Cambridge University Press.
Gass, R. (2009). Toulmin Model of Argument. California State University Fullerton.
Academic. Retrieved November 14, 2013, from
http://commfaculty.fullerton.edu/rgass/toulmin2.htm
Goodwin, J., & Fisher, A. (2000). Wigmore’s Chart Method. Informal Logic, 20(3). Retrieved
from http://ojs.uwindsor.ca/ojs/leddy/index.php/informal_logic/article/view/2278
Greitzer, F. L. (2005). Toward the development of cognitive task difficulty metrics to support
intelligence analysis research. In Fourth IEEE Conference on Cognitive Informatics,
2005. (ICCI 2005) (pp. 315–320). doi:10.1109/COGINF.2005.1532647
Hamilton, W. F., & Chapin, L. C. (2012). Storytelling: The Shared Quest For Excellence in
Document Review. e-Discovery Team. Retrieved October 15, 2012, from http://e-
discoveryteam.com/2012/01/08/storytelling-the-shared-quest-for-excellence-in-
document-review/
Harris, P. (2008). Designing and Reporting Experiments in Psychology (3rd ed.). Open
University Press.

Bibliography
92
Hastie, R., Penrod, S. D., & Pennington, R. H. S. P. N. (1983). Inside the Jury. The Lawbook
Exchange, Ltd.
Healey, C. G., & Enns, J. T. (2012). Attention and Visual Memory in Visualization and
Computer Graphics. IEEE Transactions on Visualization and Computer Graphics,
18(7), 1170–1188. doi:10.1109/TVCG.2011.127
Hertzum, M., & Holmegaard, K. D. (2013). Perceived Time as a Measure of Mental
Workload: Effects of Time Constraints and Task Success. International Journal of
Human-Computer Interaction, 29(1), 26–39. doi:10.1080/10447318.2012.676538
Heuer, R. J. (1999). Psychology of Intelligence Analysis. Lulu.com. Retrieved from
http://vadl.cc.gatech.edu/documents/5_Heuer,%20Jr._Psych_of_Intel_Analy_CIA_-
_Heuer.pdf
IBM Corporation. (2007, December). Summary Graph: Total Precision vs. Recall. IBM.
concept. Retrieved July 10, 2013, from
http://publib.boulder.ibm.com/infocenter/classify/v8r5/topic/com.ibm.classify.workben
ch.doc/c_WBG_Summary_Graph_Total_Precision_vs_Recall.htm
IEEE VAST. (2011a). Solutions. IEEE VAST Challenge 2011. Retrieved February 28, 2013,
from http://hcil.cs.umd.edu/localphp/hcil/vast11/index.php/solution/index
IEEE VAST. (2011b). Task Description. IEEE VASR Challenge. Retrieved February 28,
2013, from http://hcil.cs.umd.edu/localphp/hcil/vast11/index.php/taskdesc/index
Kirsh, D. (2009). Interaction, External Representation and Sense Making. In Proceedings of
the Thirty-First Annual Conference of the Cognitive Science Society. Mahwah, NJ.
Kirsh, D., & Maglio, P. (1994). On Distinguishing Epistemic from Pragmatic Action. Cognitive
Science, 18(4), 513–549. doi:10.1207/s15516709cog1804_1
Klein, G., Phillips, J. K., & Peluso, D. A. (2007). A Data-Frame Theory of Sensemaking.
Expertise Out of Context: Proceedings of the Sixth International Conference on
Naturalistic Decision Making.

Bibliography
93
Klein, Gary, Moon, B., & Hoffman, R. R. (2006). Making Sense of Sensemaking 2: A
Macrocognitive Model. IEEE Intelligent Systems, 21(5), 88–92.
doi:10.1109/MIS.2006.100
Klingberg, T. (2000). Limitations in information processing in the human brain: neuroimaging
of dual task performance and working memory tasks. Progress in brain research,
126, 95–102. doi:10.1016/S0079-6123(00)26009-3
Koji, Y. (2013). Kruskal-Wallis and Friedman test. Statistics for HCI Research. Academic.
Retrieved August 29, 2013, from http://yatani.jp/HCIstats/KruskalWallis#EffectSize
Le, N.-T., Niebuhr, S., Drexler, D., & Pinkwart, N. (2013). Scaffolding Computer Supported
Argumentation Processes through Mini Map Based Interaction Techniques. In A.
Marcus (Ed.), Design, User Experience, and Usability. Web, Mobile, and Product
Design (pp. 533–542). Springer Berlin Heidelberg. Retrieved from
http://link.springer.com/chapter/10.1007/978-3-642-39253-5_59
Macagno, F., Reed, C., & Walton, D. (2007). Argument Diagramming in Logic, Artificial
Intelligence, and Law (SSRN Scholarly Paper No. ID 1751655). Rochester, NY:
Social Science Research Network. Retrieved from
http://papers.ssrn.com/abstract=1751655
McDonald, J. H. (2009). Handbook of Biological Statistics: Kruskal–Wallis test and Mann-
Whitney U test. University of Delaware. Academic. Retrieved September 27, 2013,
from http://udel.edu/~mcdonald/statkruskalwallis.html
McElhaney, J. (2009, July 1). The Arsenal of Persuasion. ABA Journal. Retrieved from
http://www.abajournal.com/magazine/article/the_arsenal_of_persuasion/
Miller, G. A. (1956). The magical number seven, plus or minus two: some limits on our
capacity for processing information. Psychological Review, 63(2), 81–97.
doi:10.1037/h0043158
Naugle, D. (1999, February 5). Narrative and Life: The Central Role of Stories in Human
Experience. Retrieved from http://www3.dbu.edu/naugle/pdf/narrative_and_life.pdf
Norman, D. A. (2002). The Design of Everyday Things. Basic Books.

Bibliography
94
O’Brien, H. L. (2010). The User Engagement Scale.
O’Brien, H. L., & Toms, E. G. (2010). The development and evaluation of a survey to
measure user engagement. Journal of the American Society for Information Science
and Technology, 61(1), 50–69. doi:10.1002/asi.21229
Pennington, N., & Hastie, R. (1986). Evidence evaluation in complex decision making.
Journal of Personality and Social Psychology, 51(2), 242–258. doi:10.1037/0022-
3514.51.2.242
Pennington, N., & Hastie, R. (1988). Explanation-based decision making: Effects of memory
structure on judgment. Journal of Experimental Psychology: Learning, Memory, and
Cognition, 14(3), 521–533. doi:10.1037/0278-7393.14.3.521
Pennington, N., & Hastie, R. (1991). Cognitive Theory of Juror Decision Making: The Story
Model, A. Cardozo Law Review, 13, 519.
Pennington, N., & Hastie, R. (1992). Explaining the evidence: Tests of the Story Model for
juror decision making. Journal of Personality and Social Psychology, 62(2), 189–206.
doi:10.1037/0022-3514.62.2.189
Pennington, N., & Hastie, R. (n.d.). ATTITUDES AND SOCIAL COGNITION Explaining the
Evidence: Tests of the Story Model for Juror Decision Making. Retrieved from
http://130.203.133.150/viewdoc/summary;jsessionid=AEE219CAE5DF031511D6967
288798BF8?doi=10.1.1.189.4882
Pirolli, P., & Card, S. (2005). The sensemaking process and leverage points for analyst
technology as identified through cognitive task analysis. In Proceedings of
International Conference on Intelligence Analysis (Vol. 2005, pp. 2–4).
Ramsey, N. F., Jansma, J. M., Jager, G., Raalten, T. V., & Kahn, R. S. (2004).
Neurophysiological factors in human information processing capacity. Brain, 127(3),
517–525. doi:10.1093/brain/awh060
Reed, C. (2007). wigmore, toulmin and walton: the diagramming trinity and their application
in legal practice. In Graphic and Visual Representations of Evidence and Inference in
Legal Settings. Cardozo Law School, New York.

Bibliography
95
Rijsbergen, C. J. van. (1981). Retrieval effectiveness. In Information retrieval experiment
(pp. 32–43). Butterworths.
Rijsbergenr, C. J. van. (1979). Information retrieval. Butterworth-Heinemann. Retrieved from
http://www.dcs.gla.ac.uk/Keith/Preface.html
Rowe, G., & Reed, C. (2006). Translating Wigmore Diagrams. In Proceedings of the 2006
conference on Computational Models of Argument: Proceedings of COMMA 2006
(pp. 171–182). Amsterdam, The Netherlands, The Netherlands: IOS Press. Retrieved
from http://dl.acm.org/citation.cfm?id=1565233.1565254
Russell, D. M., Stefik, M. J., Pirolli, P., & Card, S. K. (1993). The cost structure of
sensemaking. In Proceedings of the INTERACT ’93 and CHI ’93 Conference on
Human Factors in Computing Systems (pp. 269–276). New York, NY, USA: ACM.
doi:10.1145/169059.169209
Sbarski, P., van Gelder, T., Marriott, K., Prager, D., & Bulka, A. (2008). Visualizing Argument
Structure. In G. Bebis, R. Boyle, B. Parvin, D. Koracin, P. Remagnino, F. Porikli, … L.
Monroe (Eds.), Advances in Visual Computing (pp. 129–138). Springer Berlin
Heidelberg. Retrieved from http://link.springer.com/chapter/10.1007/978-3-540-
89639-5_13
Simon, H. A., & Newell, A. (1971). Human problem solving: The state of the theory in 1970.
American Psychologist, 26(2), 145–159. doi:10.1037/h0030806
Simon, S., Erduran, S., & Osborne, J. (2006). Learning to Teach Argumentation: Research
and development in the science classroom. International Journal of Science
Education, 28(2-3), 235–260. doi:10.1080/09500690500336957
Stuhldreher, T. (2012). Predictive coding cuts discovery expenses. Central Penn Business
Journal, 28(37), 19.
Sucala, M., Scheckner, B., & David, D. (2011). Psychological Time: Interval Length
Judgments and Subjective Passage of Time Judgments. Current psychology letters.
Behaviour, brain & cognition, (Vol. 26, Issue 2, 2010). Retrieved from
http://cpl.revues.org/index4998.html
Bibliography
96
Teufel, S. (2006). An Overview of ev aluation methods in TREC Ad-hoc Information Retrieval
and TREC Question Answering. In Evaluation of Text and Speech Systems.
Dordrecht, The Netherlands: Springer.
The Oxford English Dictionary. (2013). Premise. The Oxford English Dictionary. Oxford, UK:
Oxford University Press. Retrieved from
http://www.oxforddictionaries.com/definition/english/premise
Thomas, J. J., & Cook, K. A. (Eds.). (2005). Illuminating the Path: The Research and
Development Agenda for Visual Analytics. National Visualization and Analytics Ctr.
Toulmin, S. E., Rieke, R. D., & Janik, A. (1979). An Introduction to reasoning. New York
[etc.]: Macmillan.
Twardy, D. C. R. (2003). Argument Maps Improve Critical Thinking. Preprint. Retrieved
September 17, 2013, from http://cogprints.org/3008/
United States Joint Chiefs of Staff. (2007). Joint Intelligence. Retrieved from
http://www.dtic.mil/doctrine/new_pubs/jp2_0.pdf
Van den Braak, S. W., Vreeswijk, G. A. W., & Prakken, H. (2007). AVERs: an argument
visualization tool for representing stories about evidence. In Proceedings of the 11th
international conference on Artificial intelligence and law (pp. 11–15). New York, NY,
USA: ACM. doi:10.1145/1276318.1276321
Van Gelder, T. (2002). Argument mapping with reason!able. The American Philosophical
Association Newsletter on Philosophy and Computers, 2(1), 85–90.
Van Gelder, T. (2009, February 17). What is argument mapping? Tim van Gelder. Retrieved
September 19, 2013, from http://timvangelder.com/2009/02/17/what-is-argument-
mapping/
Walker, I. (2008). Statistics for Psychology. University of Bath. Academic. Retrieved
September 27, 2013, from
http://staff.bath.ac.uk/pssiw/stats2/page2/page3/page3.html

Bibliography
97
Wigmore, J. H. (1913). The principles of judicial proof as given by logic, psychology, and
general experience, and illustrated in judicial trials; Boston : Little, Brown, and
company. Retrieved from http://archive.org/details/principlesofjudi00wigm
Zander, C. (2009). Language grammar. University of Washington. Academic. Retrieved
December 3, 2013, from
http://courses.washington.edu/css448/zander/Notes/langGrammar.pdf
Zhang, X., Qu, Y., Giles, C. L., & Song, P. (2008). CiteSense: supporting sensemaking of
research literature. In Proceedings of the twenty-sixth annual SIGCHI conference on
Human factors in computing systems (pp. 677–680). New York, NY, USA: ACM.
doi:10.1145/1357054.1357161
Zhao, Y. (2012). R and Data Mining: Examples and Case Studies. Academic Press,
Elsevier. Retrieved from http://www.rdatamining.com/books/rdm

Appendices
98
Appendices

Appendices
99
8 Appendices
8.1 Appendix A: Consent form and Questionnaire
8.1.1 Consent form
School of Science and Technology
Research Consent Form
NOTICE TO THE RESEARCH PARTICIPANT
This consent form, a copy of which has been given to you (the research participant), is only
part of the process of informed consent. It should give you the basic idea of what the
research is about and what your participation will involve. If you would like more details
about something mentioned here, or information not included here, please ask. Please take
the time to read this form carefully and to understand any accompanying information.
INFORMATION REGARDING THE RESEARCH PROJECT
Research Project Title:
Effects of visual representation structures on electronic discovery type investigations.
Name of Researcher:
Efeosasere Okoro
Purpose of Experiment:
To explore how the creation of different visual representation structures affects the sense
making process of legal professionals on electronic discovery type investigations in terms of
relevance, certainty, the decision process and engagement.
Participant Recruitment and Selection:
Postgraduate students are been recruited for this study
Procedure:
The procedure for the study is divided into three stages; training, task and post interview
Training:
The subjects would first be given a general tour of the platform for their representation
(Microsoft One Note) and also keyword searching and operations (AND, OR, IN) using Microsoft
Windows Explorer. They would also be trained on a specific representation style (Narrative,

Appendices
100
Argumentation or freeform) depending on the representation form they are randomly selected
to do.
Task:
They would be given an investigative task that requires them to perform an investigation using
a data set of 30 documents and then come up with conclusions using the representations they
have been trained to use.
The task is to identify any potential terrorist threat from the information in the documents.
Post task Interview and Questionnaire
After the task, interviews would be conducted to gather the subject’s general impressions of their
experience, and to report some measures such as confidence in their conclusions and engagement in
the task.
The average time taken for this study and training is 50 minutes.
Data Collection:
The following data would be collected.
The screen recording of the processes of investigations
The final representation
Time taken to complete the representation.
The interview recording and,
The data provided in the questionnaire
Confidentiality:
The data collected would be used specifically for the purpose of this study
Likelihood of Discomfort:
There is no notable likelihood of discomfort that can arise from this study.
Further information about the Researcher and the Project:
The researcher is a postgraduate Visual Analytics research student of Middlesex University. He
is been supervised by Dr. Simon Attfield
Finding out about Results:
If you have any interests in the outcome of the results of this study, the researcher would be
more than happy if you contact them on [email protected]
Appendices
101
AGREEMENT
Your signature on this form indicates that you (the research participant) have understood to your
satisfaction the information regarding participation in the research project and agree to participate as a
participant. In no way does this waive you legal rights nor release the researcher/investigator,
sponsors, or involved institutions from their legal and professional responsibilities. You are free to
not answer specific items or questions in interviews or on questionnaires. You are free to withdraw
from the study at any time without penalty. Your continued participation should be as informed as
your initial consent, so you should feel free to ask for clarification or new information throughout
your participation.
The researcher agrees to abide by the provisions of the UK Data Protection Act1998 and all other
relevant legal and ethical obligations. If you have further questions concerning matters related to this
research, please contact the researcher.
Participant Date
Researcher/Investigator Date
A copy of this completed consent form will be given to you to keep for your records and reference.
This form can be downloaded from: http://tinyurl.com/sst-ethics

Appendices
102
8.1.2 Background Information form
Age:
Gender:
Nationality:
Religion:
Are you a natural English speaker?
Preferences
Your movie genre preferences:
1. 1st Preference:
2. 2nd Preference:
3. 3rd Preference:
How often do you watch them?
You novel genre preference:
1. 1st Preference:
2. 2nd Preference:
3. 3rd Preference:
How often do you read novels?
Have you lost anyone in any terrorist attacks?
Representation to be used:

Appendices
103
8.1.3 Certainty questionnaire
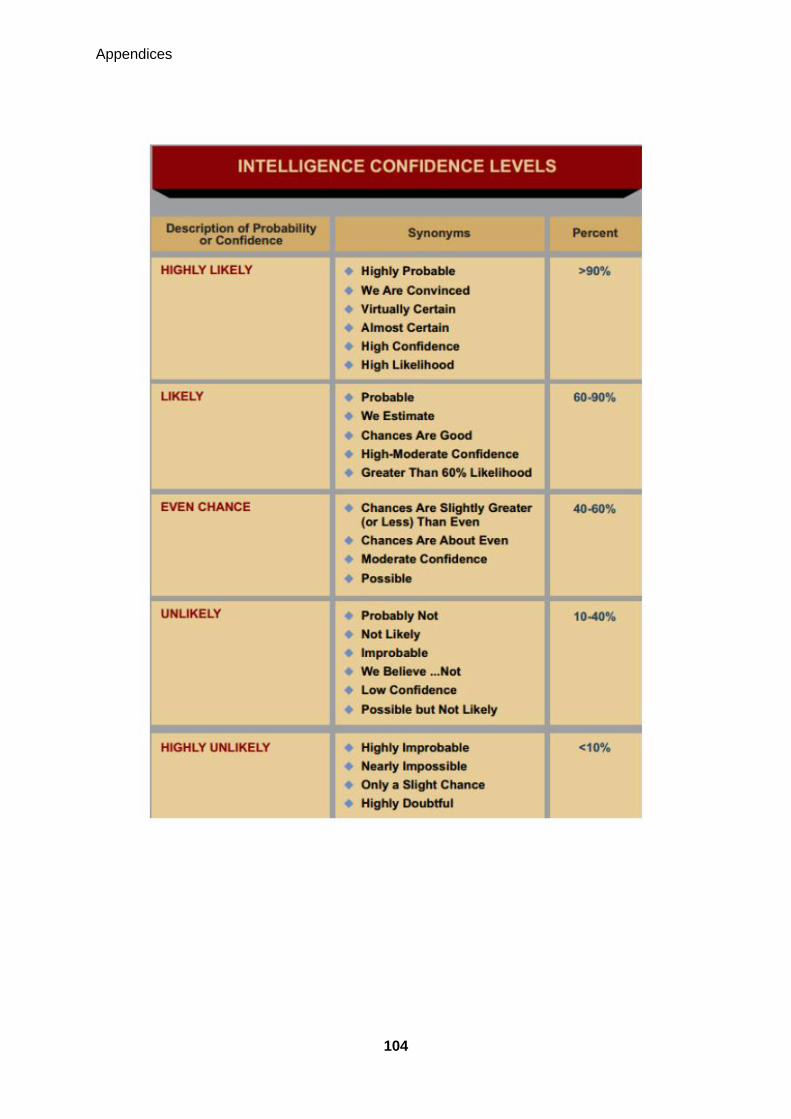
Appendices
104

Appendices
105
8.1.4 Engagement questionnaire

Appendices
106

Appendices
107
8.2 Appendix B: Study presentation slides
8.2.1 Argument condition presentation
Specific Group Training
Argument Representation
Techniques
• Search for relevant document using keywords
– Try as much range of keywords as possible
• Review each relevant document and come up with a conclusion.
– Support your conclusion
– Counter them if you can
• However, import the relevant documents as evidences

Appendices
108
Argument structure
Conclusion
SupportData
Data
Counter
Data
Data

Appendices
109
8.2.2 Timeline condition presentation
Technique
• Search for relevant document using keywords
– Try as much range of keywords as possible
• Create a timeline of events from your relevant document selection
Specific Group Training
Timeline Representation

Appendices
110
8.2.3 Freeform condition presentation
Specific Group training
Freeform Representation
Technique
• Use the data set you have been provide with to conduct your investigation using one note.
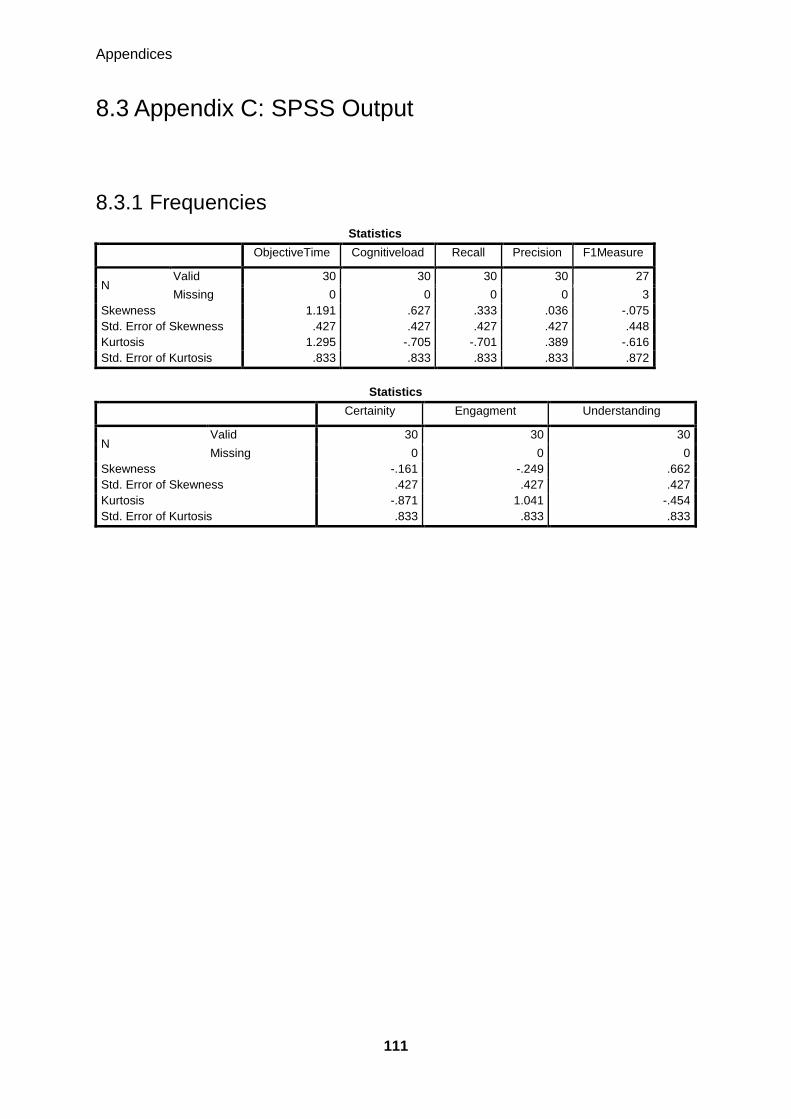
Appendices
111
8.3 Appendix C: SPSS Output
8.3.1 Frequencies
Statistics
ObjectiveTime Cognitiveload Recall Precision F1Measure
N Valid 30 30 30 30 27
Missing 0 0 0 0 3
Skewness 1.191 .627 .333 .036 -.075
Std. Error of Skewness .427 .427 .427 .427 .448
Kurtosis 1.295 -.705 -.701 .389 -.616
Std. Error of Kurtosis .833 .833 .833 .833 .872
Statistics
Certainity Engagment Understanding
N Valid 30 30 30
Missing 0 0 0
Skewness -.161 -.249 .662
Std. Error of Skewness .427 .427 .427
Kurtosis -.871 1.041 -.454
Std. Error of Kurtosis .833 .833 .833

Appendices
112
8.3.2 Histograms
8.3.2.1 Objective Time Histogram
8.3.2.2 Cognitive load Histogram

Appendices
113
8.3.2.3 Recall Histogram
8.3.2.4 Precision Histogram
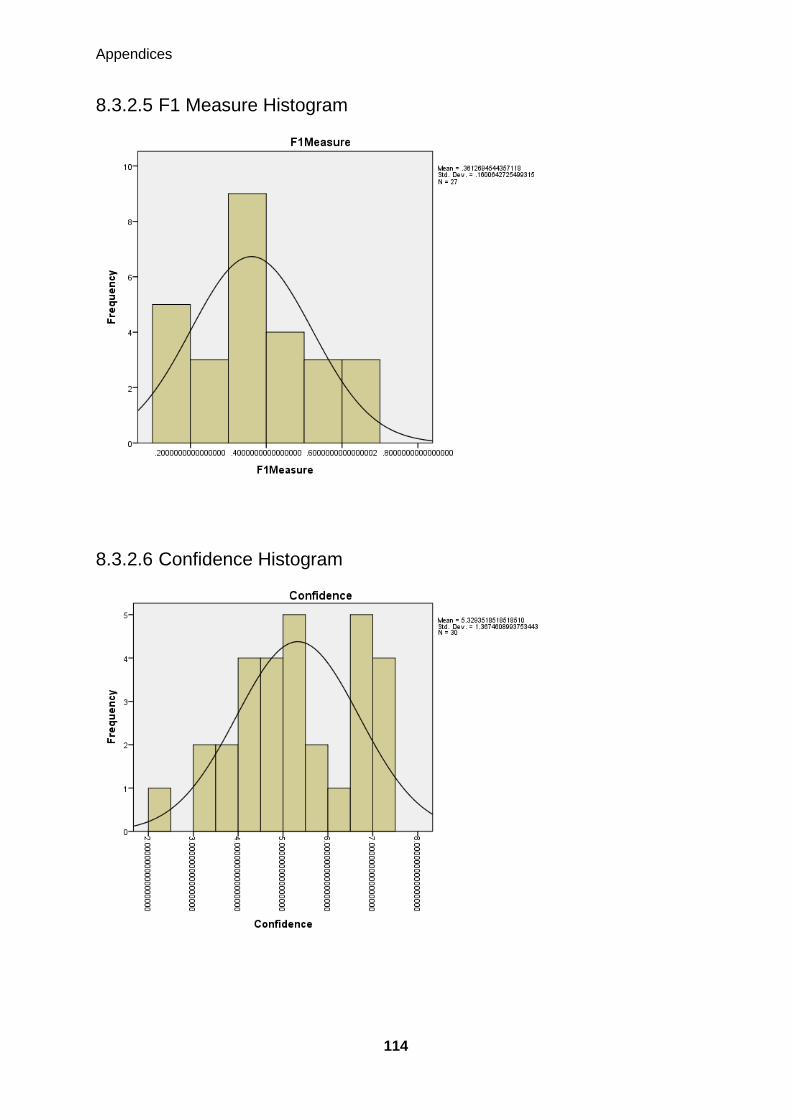
Appendices
114
8.3.2.5 F1 Measure Histogram
8.3.2.6 Confidence Histogram

Appendices
115
8.3.2.7 Engagement Histogram
8.3.2.8 Understanding Histogram

Appendices
116
8.3.3 Kruskal-Wallis Test For all dependent variables
Where conditions 1.0, 2.0 and 3.0 refers argument, freeform and timeline respectively
Ranks
Condition N Mean Rank
ObjectiveTime
1.0 9 13.11
2.0 11 17.23
3.0 10 15.75
Total 30
Cognitiveload
1.0 9 21.61
2.0 11 11.36
3.0 10 14.55
Total 30
Recall
1.0 9 12.50
2.0 11 18.23
3.0 10 15.20
Total 30
Precision
1.0 9 14.44
2.0 11 17.86
3.0 10 13.85
Total 30
F1Measure
1.0 9 12.39
2.0 11 18.64
3.0 10 14.85
Total 30
Certainity
1.0 9 15.11
2.0 11 14.00
3.0 10 17.50
Total 30
Engagment
1.0 9 20.44
2.0 11 14.45
3.0 10 12.20
Total 30
Understanding
1.0 9 15.72
2.0 11 16.14
3.0 10 14.60
Total 30

Appendices
117
Test Statistics
a,b
ObjectiveTime Cognitiveload Recall Precision F1Measure Certainity
Chi-Square 1.098 6.894 2.149 1.281 2.583 .853
df 2 2 2 2 2 2
Asymp. Sig. .578 .032 .341 .527 .275 .653
Test Statisticsa,b
Engagment Understanding
Chi-Square 4.399 .187
df 2 2
Asymp. Sig. .111 .911
a. Kruskal Wallis Test
b. Grouping Variable: Condition

Appendices
118
8.3.4 Mann-Whitney Test for the Argument (1.0) and Freeform
(2.0) conditions
Ranks
Condition N Mean Rank Sum of Ranks
ObjectiveTime
1.0 9 9.22 83.00
2.0 11 11.55 127.00
Total 20
Cognitiveload
1.0 9 14.00 126.00
2.0 11 7.64 84.00
Total 20
Recall
1.0 9 8.44 76.00
2.0 11 12.18 134.00
Total 20
Precision
1.0 9 9.78 88.00
2.0 11 11.09 122.00
Total 20
F1Measure
1.0 9 8.28 74.50
2.0 11 12.32 135.50
Total 20
Certainity
1.0 9 11.22 101.00
2.0 11 9.91 109.00
Total 20
Engagment
1.0 9 12.89 116.00
2.0 11 8.55 94.00
Total 20
Understanding
1.0 9 10.39 93.50
2.0 11 10.59 116.50
Total 20

Appendices
119
Test Statistics
a
ObjectiveTime Cognitiveload Recall Precision F1Measure
Mann-Whitney U 38.000 18.000 31.000 43.000 29.500
Wilcoxon W 83.000 84.000 76.000 88.000 74.500
Z -.875 -2.397 -1.414 -.495 -1.522
Asymp. Sig. (2-tailed) .381 .017 .157 .621 .128
Exact Sig. [2*(1-tailed Sig.)] .412b .016
b .175
b .656
b .131
b
Test Statisticsa
Certainity Engagment Understanding
Mann-Whitney U 43.000 28.000 48.500
Wilcoxon W 109.000 94.000 93.500
Z -.494 -1.633 -.080
Asymp. Sig. (2-tailed) .621 .102 .936
Exact Sig. [2*(1-tailed Sig.)] .656b .112
b .941
b
a. Grouping Variable: Condition
b. Not corrected for ties.

Appendices
120
8.3.5 Mann-Whitney Test for Argument (1.0) and Timeline (3.0)
conditions
Ranks
Condition N Mean Rank Sum of Ranks
ObjectiveTime
1.0 9 8.89 80.00
3.0 10 11.00 110.00
Total 19
Cognitiveload
1.0 9 12.61 113.50
3.0 10 7.65 76.50
Total 19
Recall
1.0 9 9.06 81.50
3.0 10 10.85 108.50
Total 19
Precision
1.0 9 9.67 87.00
3.0 10 10.30 103.00
Total 19
F1Measure
1.0 9 9.11 82.00
3.0 10 10.80 108.00
Total 19
Certainity
1.0 9 8.89 80.00
3.0 10 11.00 110.00
Total 19
Engagment
1.0 9 12.56 113.00
3.0 10 7.70 77.00
Total 19
Understanding
1.0 9 10.33 93.00
3.0 10 9.70 97.00
Total 19

Appendices
121
Test Statistics
a
ObjectiveTime Cognitiveload Recall Precision F1Measure
Mann-Whitney U 35.000 21.500 36.500 42.000 37.000
Wilcoxon W 80.000 76.500 81.500 87.000 82.000
Z -.821 -1.924 -.703 -.246 -.655
Asymp. Sig. (2-tailed) .412 .054 .482 .806 .512
Exact Sig. [2*(1-tailed Sig.)] .447b .053
b .497
b .842
b .549
b
Test Statisticsa
Certainity Engagment Understanding
Mann-Whitney U 35.000 22.000 42.000
Wilcoxon W 80.000 77.000 97.000
Z -.816 -1.878 -.262
Asymp. Sig. (2-tailed) .414 .060 .794
Exact Sig. [2*(1-tailed Sig.)] .447b .065
b .842
b
a. Grouping Variable: Condition
b. Not corrected for ties.

Appendices
122
8.3.6 Mann-Whitney Test for Freeform (2.0) and Timeline (3.0)
conditions
Ranks
Condition N Mean Rank Sum of Ranks
ObjectiveTime
2.0 11 11.68 128.50
3.0 10 10.25 102.50
Total 21
Cognitiveload
2.0 11 9.73 107.00
3.0 10 12.40 124.00
Total 21
Recall
2.0 11 12.05 132.50
3.0 10 9.85 98.50
Total 21
Precision
2.0 11 12.77 140.50
3.0 10 9.05 90.50
Total 21
F1Measure
2.0 11 12.32 135.50
3.0 10 9.55 95.50
Total 21
Certainity
2.0 11 10.09 111.00
3.0 10 12.00 120.00
Total 21
Engagment
2.0 11 11.91 131.00
3.0 10 10.00 100.00
Total 21
Understanding
2.0 11 11.55 127.00
3.0 10 10.40 104.00
Total 21
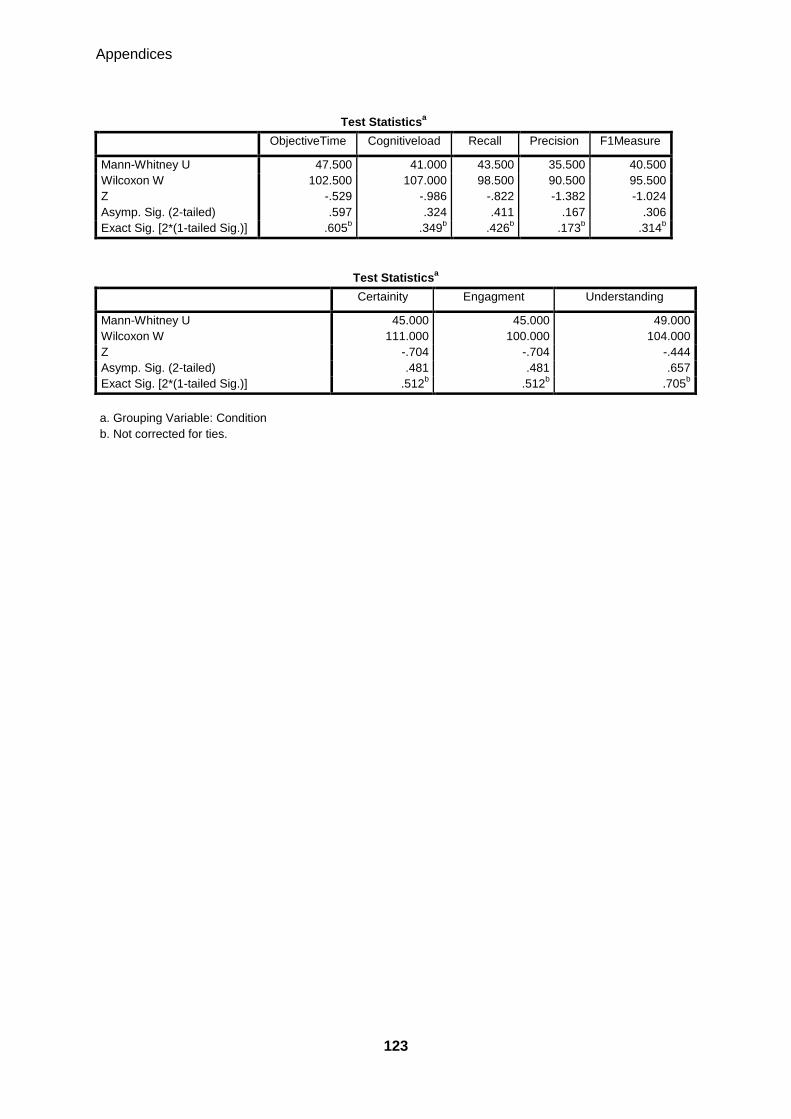
Appendices
123
Test Statistics
a
ObjectiveTime Cognitiveload Recall Precision F1Measure
Mann-Whitney U 47.500 41.000 43.500 35.500 40.500
Wilcoxon W 102.500 107.000 98.500 90.500 95.500
Z -.529 -.986 -.822 -1.382 -1.024
Asymp. Sig. (2-tailed) .597 .324 .411 .167 .306
Exact Sig. [2*(1-tailed Sig.)] .605b .349
b .426
b .173
b .314
b
Test Statisticsa
Certainity Engagment Understanding
Mann-Whitney U 45.000 45.000 49.000
Wilcoxon W 111.000 100.000 104.000
Z -.704 -.704 -.444
Asymp. Sig. (2-tailed) .481 .481 .657
Exact Sig. [2*(1-tailed Sig.)] .512b .512
b .705
b
a. Grouping Variable: Condition
b. Not corrected for ties.
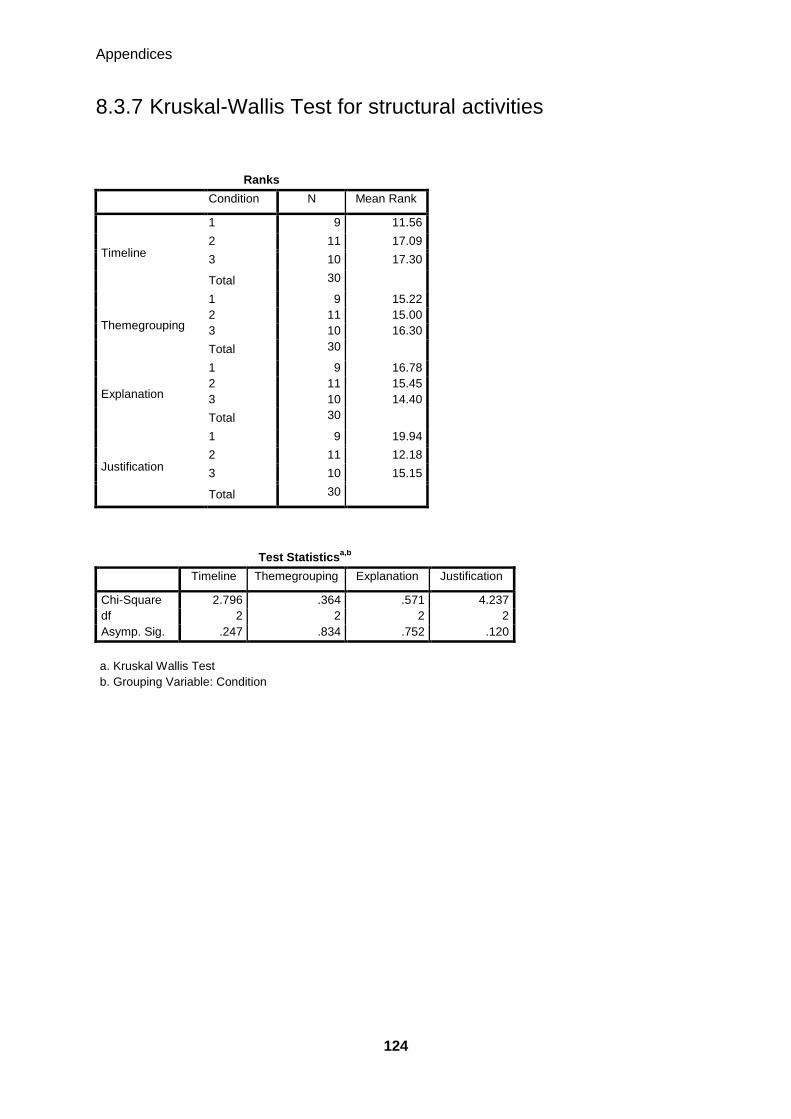
Appendices
124
8.3.7 Kruskal-Wallis Test for structural activities
Ranks
Condition N Mean Rank
Timeline
1 9 11.56
2 11 17.09
3 10 17.30
Total 30
Themegrouping
1 9 15.22
2 11 15.00
3 10 16.30
Total 30
Explanation
1 9 16.78
2 11 15.45
3 10 14.40
Total 30
Justification
1 9 19.94
2 11 12.18
3 10 15.15
Total 30
Test Statistics
a,b
Timeline Themegrouping Explanation Justification
Chi-Square 2.796 .364 .571 4.237
df 2 2 2 2
Asymp. Sig. .247 .834 .752 .120
a. Kruskal Wallis Test
b. Grouping Variable: Condition

Appendices
125
8.3.8 Kruskal-Wallis Test for information seeking and behaviour
activities
Ranks
Condition N Mean Rank
Search
1 9 15.61
2 11 15.18
3 10 15.75
Total 30
Review
1 9 14.22
2 11 15.27
3 10 16.90
Total 30
DocumentNote
1 9 15.94
2 11 17.14
3 10 13.30
Total 30
ImportDocument
1 9 15.94
2 11 15.05
3 10 15.60
Total 30
MergeDocumentWithNote
1 9 11.83
2 11 16.77
3 10 17.40
Total 30
Test Statistics
a,b
Search Review DocumentNote ImportDocument MergeDocumen
tWithNote
Chi-Square .024 .450 1.028 .055 2.659
df 2 2 2 2 2
Asymp. Sig. .988 .799 .598 .973 .265
a. Kruskal Wallis Test
b. Grouping Variable: Condition

Appendices
126
8.4 Appendix D: Activity timeline grids
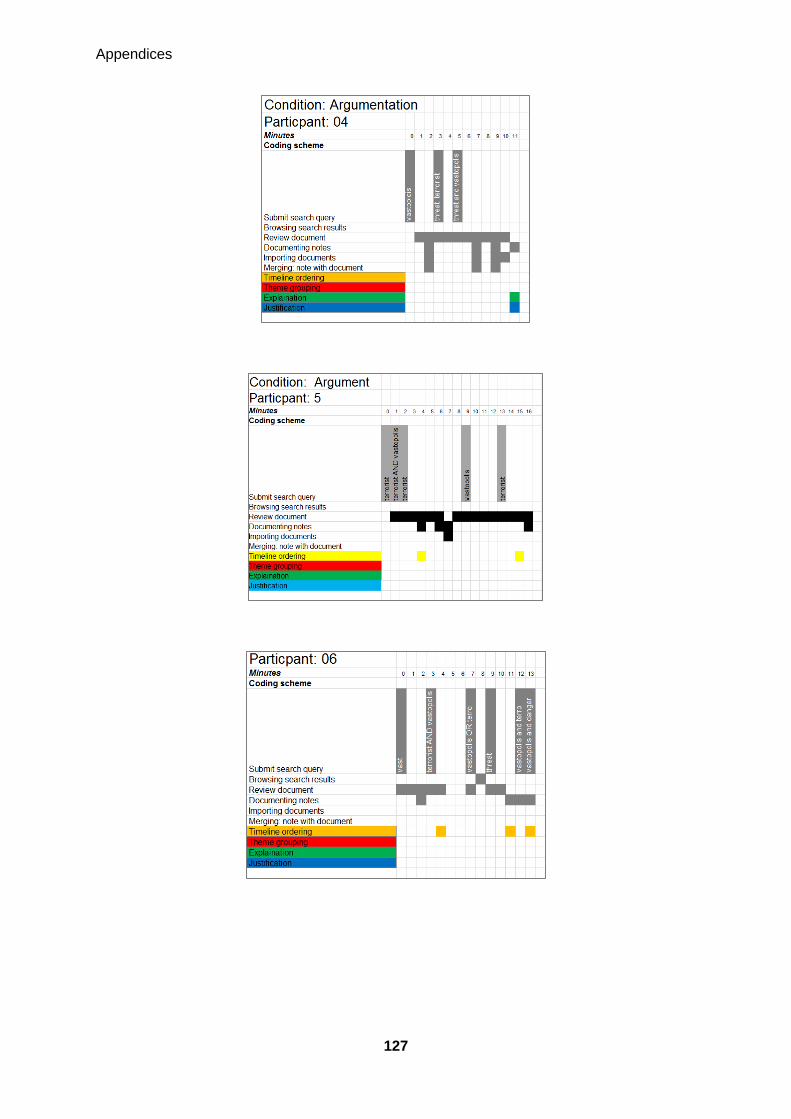
Appendices
127

Appendices
128
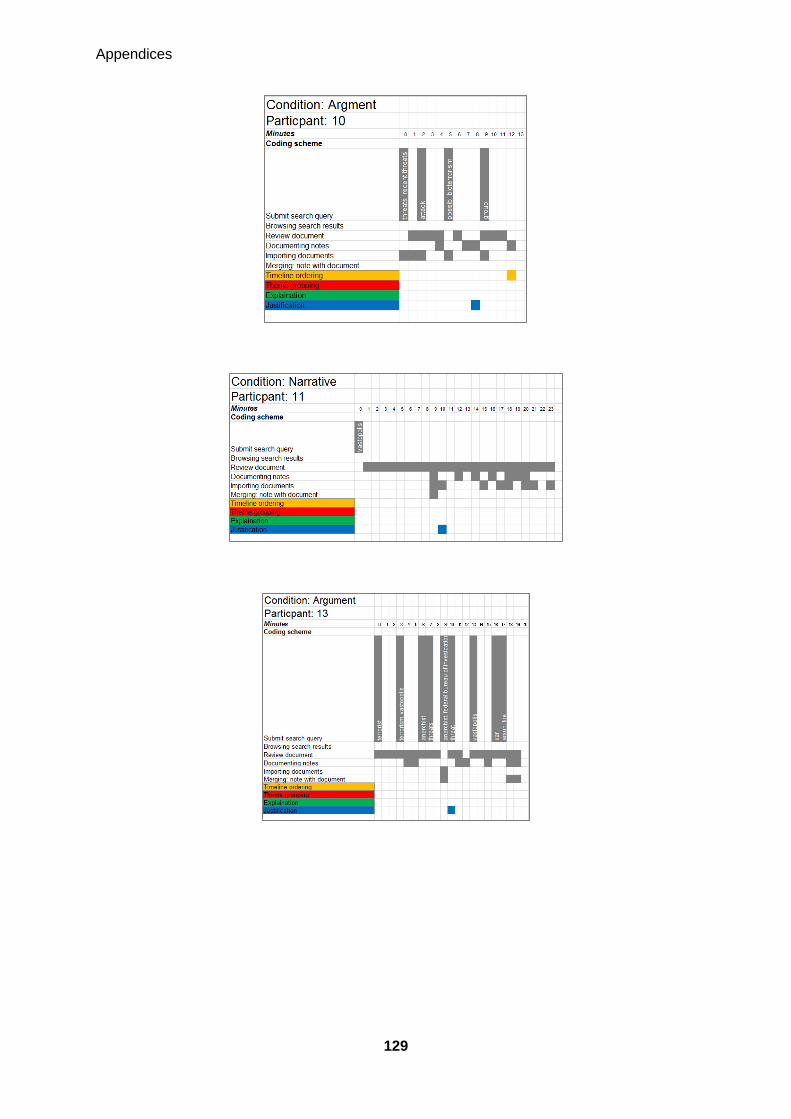
Appendices
129

Appendices
130
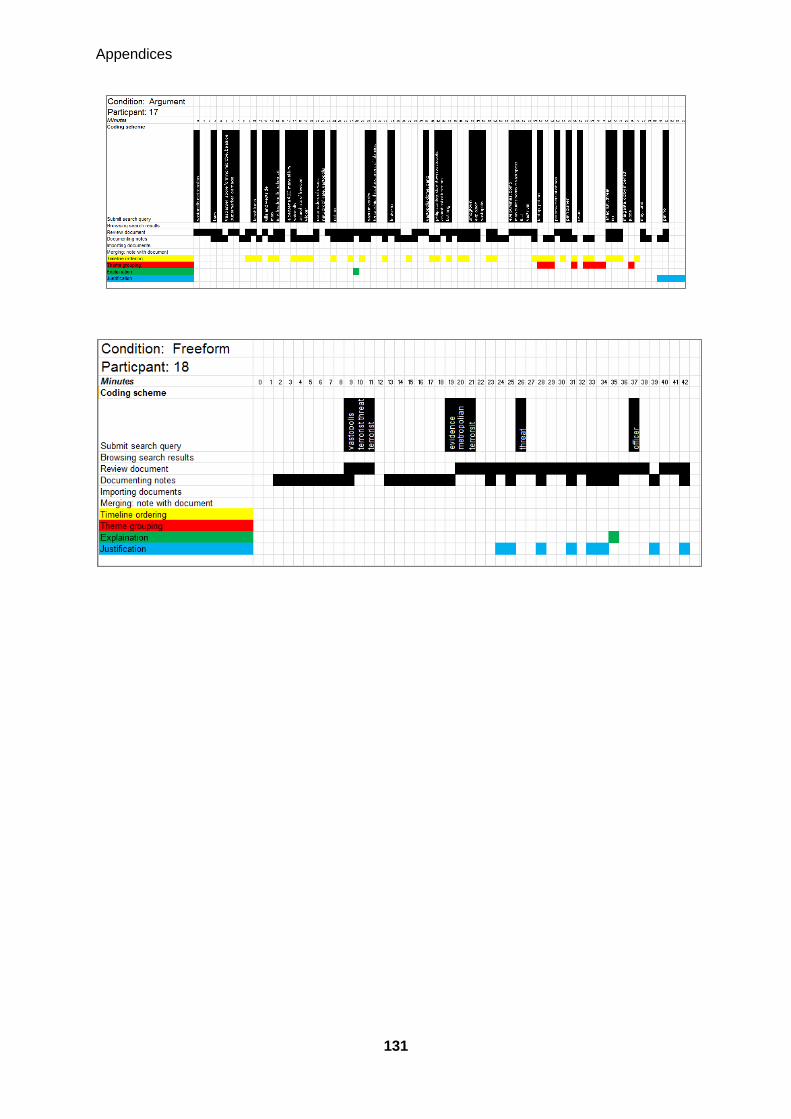
Appendices
131

Appendices
132

Appendices
133
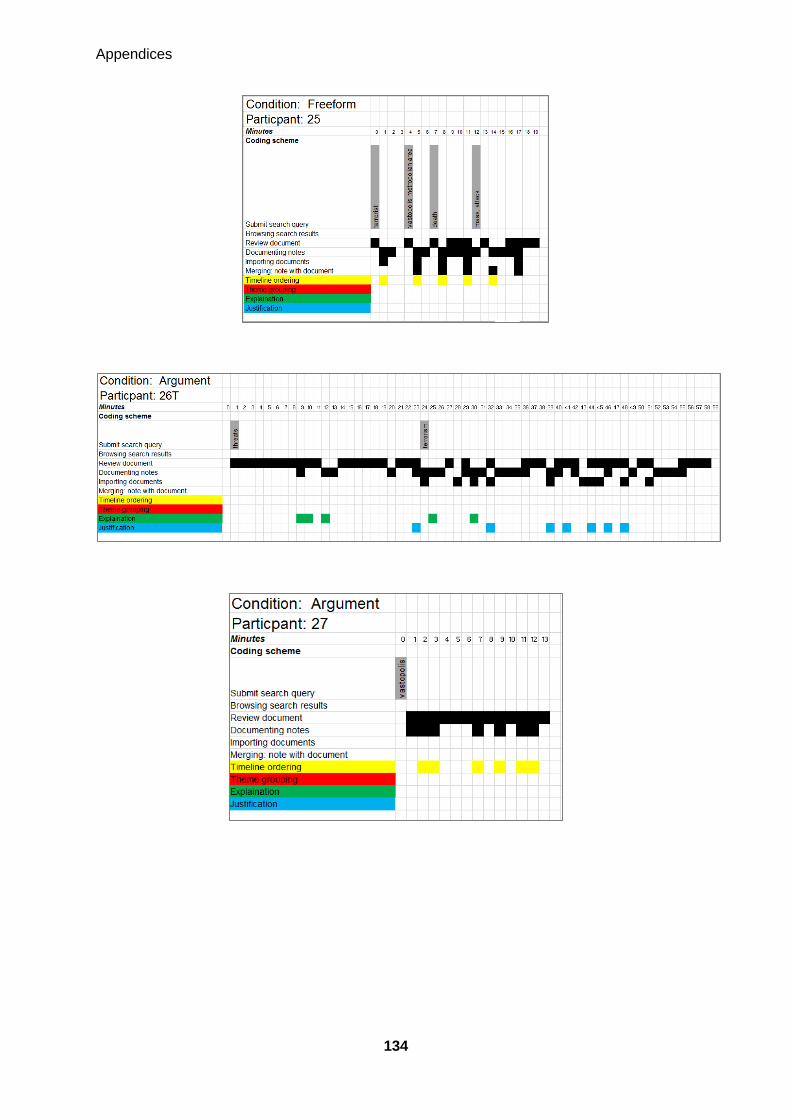
Appendices
134
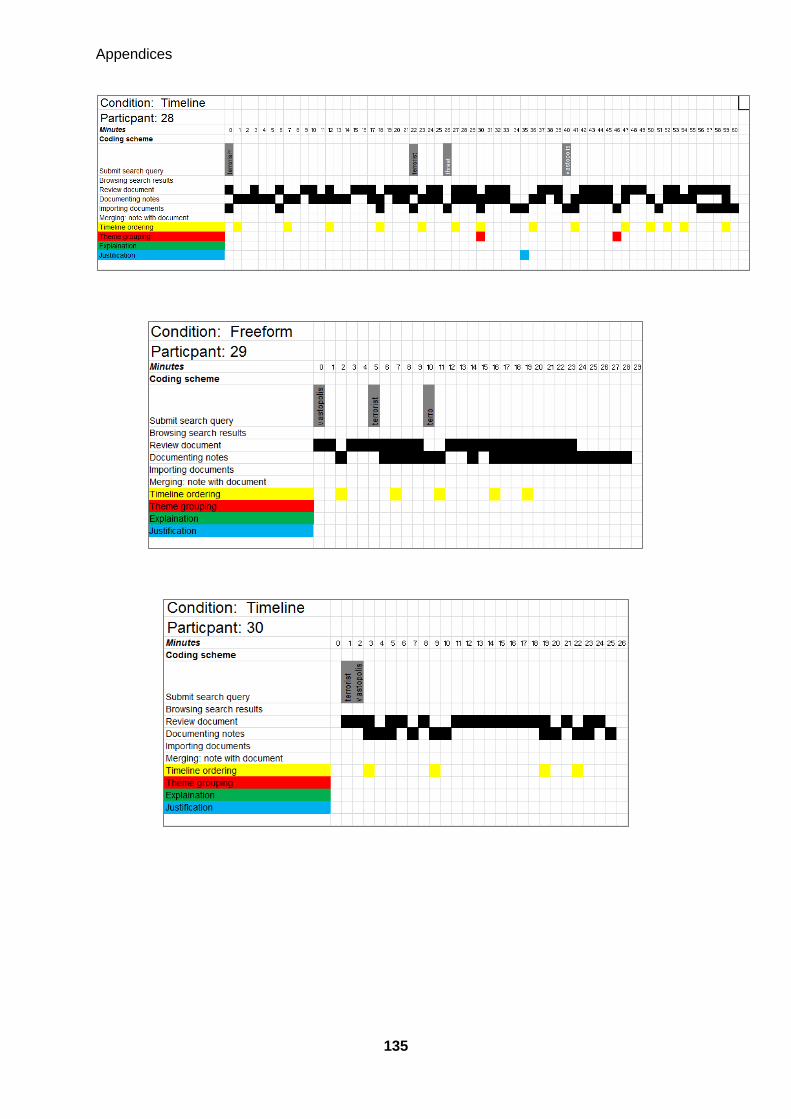
Appendices
135
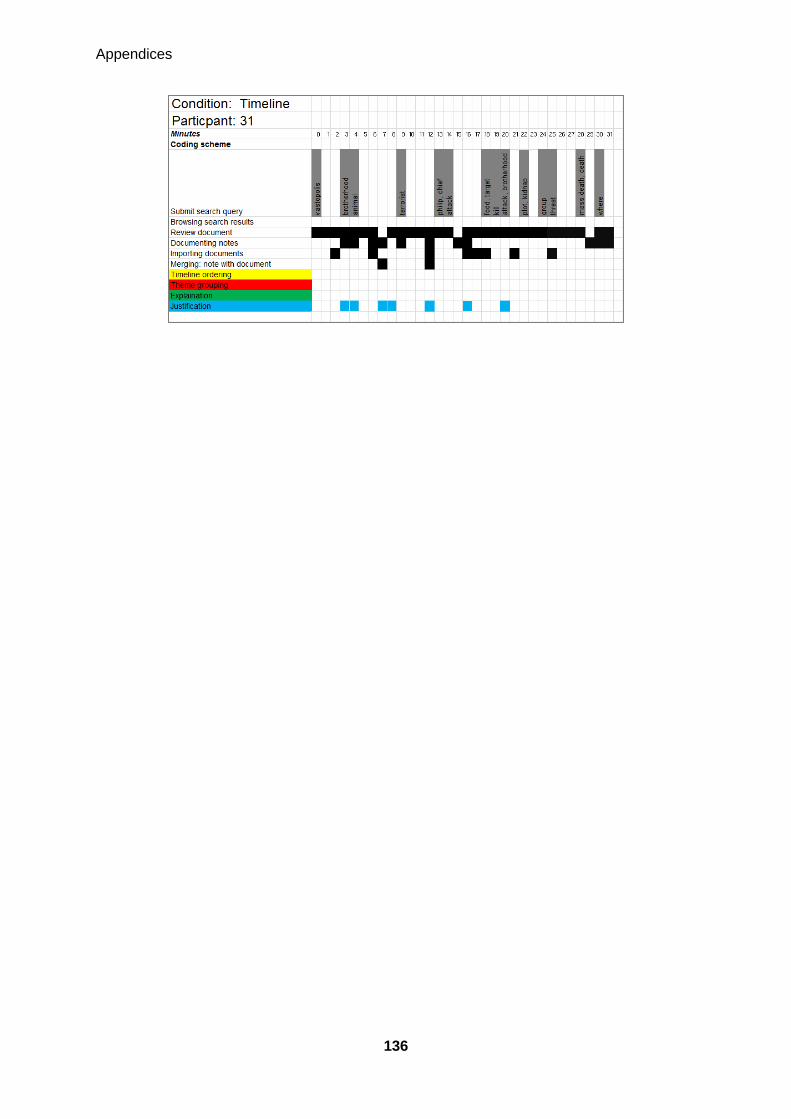
Appendices
136

Appendices
137
8.5 Appendix E: Other relations examples
8.5.1 Other information object surrogate relation examples
Figure 8-1 shows another example of the information object surrogate relation. This was
created by participant 14. In the study, the user created these by (1) opening an information
object from the search tool (Microsoft Windows Explorer) (on the left) by clicking on it to
open it, (2) reviewing it, (3) copying the title of the information object from the information
object and pasting it onto the representation interface (Microsoft OneNote) and (4)
documenting the date the information object was published. The combination of both the
summary (title) and the date elements (which are highlighted in the red rectangle on the right
in figure 8-1) forms an information object surrogate.
Figure 8-1: An information object surrogate relation with title and date elements created by participant 14
Figure 8-2 shows another example created by participant 7. In the study, the user created
these by (1) opening an information object from the search tool (Microsoft Windows
Explorer) (on the left) by clicking on it to open it, (2) reviewing it, (3) copying the title of the
information object from the information object and pasting it onto the representation interface
(Microsoft OneNote), (4) documenting the date the information object was published and (5)
dragging an information object icon that represents a source from the search tool that
displays the information objects into the representation interface. The combination of the
summary (title), source and the date elements (which are highlighted in the red rectangle on
the right in figure 8-2) forms an information object surrogate.

Appendices
138
Figure 8-2: An information object surrogate relation with title, source and date elements created by participant 7
And here is another example created by participant 3 (Figure 8-3). In the study, the user
created these by (1) opening an information object from the search tool (Microsoft Windows
Explorer) (on the left) by clicking on it to open it, (2) reviewing it, (3) copying the title of the
information object from the information object and pasting it onto the representation interface
(Microsoft OneNote), (4) documenting the date the information object was published , (5)
copying and pasting a significant subset of the content of the information object (gist) into the
representation interface and (6) dragging an information object icon that represents a
source from the search tool that displays the information objects into the representation
interface. The combination of the summary (both title and gist), source and the date
elements (which are highlighted in the red rectangle on the right in figure 8-3) forms an
information object surrogate.
Figure 8-3: An information object surrogate relation with title, gist, source and date elements created by
participant 3
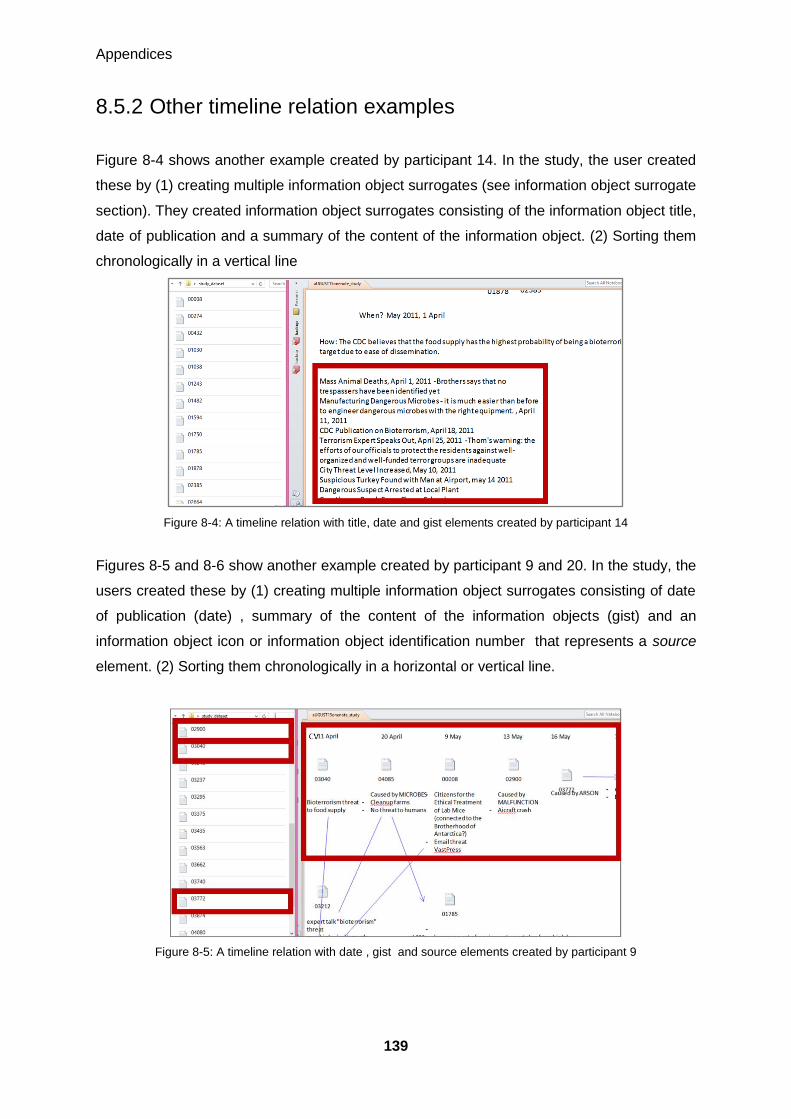
Appendices
139
8.5.2 Other timeline relation examples
Figure 8-4 shows another example created by participant 14. In the study, the user created
these by (1) creating multiple information object surrogates (see information object surrogate
section). They created information object surrogates consisting of the information object title,
date of publication and a summary of the content of the information object. (2) Sorting them
chronologically in a vertical line
Figure 8-4: A timeline relation with title, date and gist elements created by participant 14
Figures 8-5 and 8-6 show another example created by participant 9 and 20. In the study, the
users created these by (1) creating multiple information object surrogates consisting of date
of publication (date) , summary of the content of the information objects (gist) and an
information object icon or information object identification number that represents a source
element. (2) Sorting them chronologically in a horizontal or vertical line.
Figure 8-5: A timeline relation with date , gist and source elements created by participant 9

Appendices
140
Figure 8-6: A timeline relation with date , gist and source elements created by participant 20
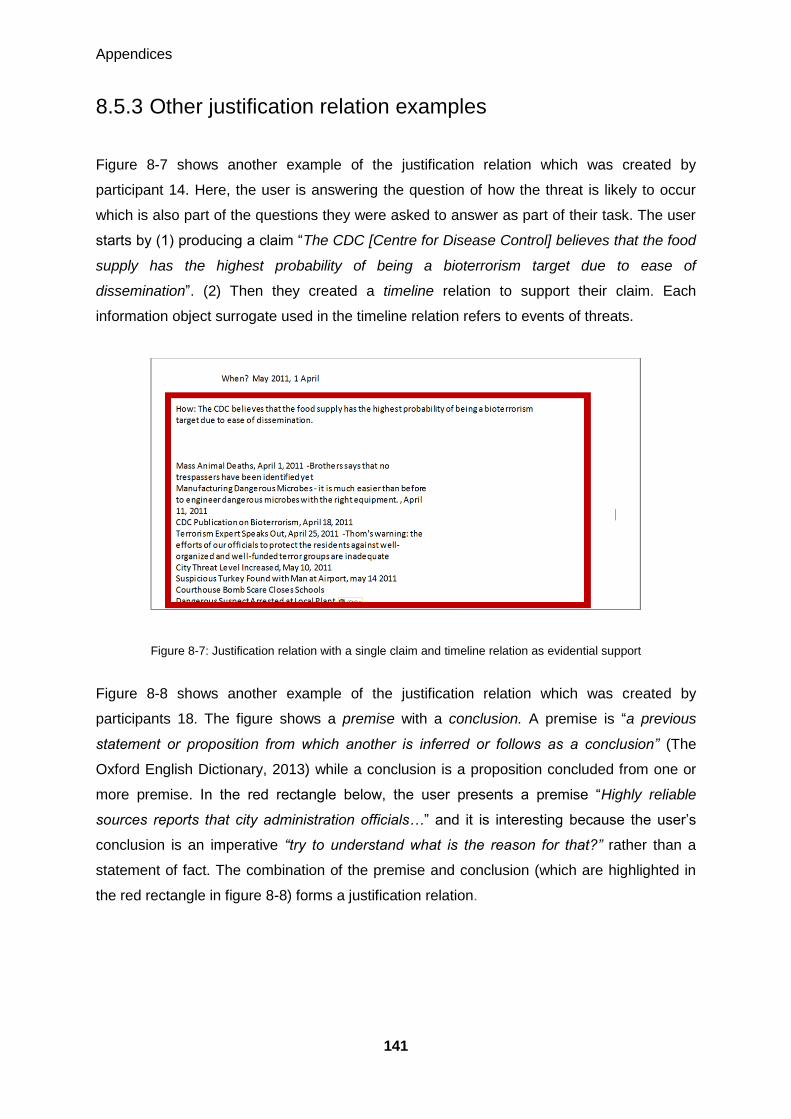
Appendices
141
8.5.3 Other justification relation examples
Figure 8-7 shows another example of the justification relation which was created by
participant 14. Here, the user is answering the question of how the threat is likely to occur
which is also part of the questions they were asked to answer as part of their task. The user
starts by (1) producing a claim “The CDC [Centre for Disease Control] believes that the food
supply has the highest probability of being a bioterrorism target due to ease of
dissemination”. (2) Then they created a timeline relation to support their claim. Each
information object surrogate used in the timeline relation refers to events of threats.
Figure 8-7: Justification relation with a single claim and timeline relation as evidential support
Figure 8-8 shows another example of the justification relation which was created by
participants 18. The figure shows a premise with a conclusion. A premise is “a previous
statement or proposition from which another is inferred or follows as a conclusion” (The
Oxford English Dictionary, 2013) while a conclusion is a proposition concluded from one or
more premise. In the red rectangle below, the user presents a premise “Highly reliable
sources reports that city administration officials…” and it is interesting because the user’s
conclusion is an imperative “try to understand what is the reason for that?” rather than a
statement of fact. The combination of the premise and conclusion (which are highlighted in
the red rectangle in figure 8-8) forms a justification relation.

Appendices
142
Figure 8-8: A justification relation created by participant 18
Another example of a justification relation is shown in the representation created by
participant 29 (figure 8-9). Here the user is trying to find out if the assumption that there is a
possible terrorist threat is valid or not. The assumption comes from the task question itself.
The user first produced (typed out) a claim “these presumptions [of possible threat] may
exist …such as”. They later produced (typed out) a list of evidential supports to support their
reason “a recent rousing talk delivered by Prof. Patino”, “some stern advice by
terrorism(expert) author Jose Tom or” etc. The combination of the claim and listed evidential
support (which are highlighted in the red rectangle in figure 8-9) forms a justification relation.
Figure 8-9: A justification relation created by participant 29

Appendices
143