middlesex county, nj substance abuse stats
TRANSCRIPT

New Jersey Drug and Alcohol Abuse Treatment
Substance Abuse Overview 2014
Middlesex County
Prepared by Limei Zhu
Department of Human Services Division of Mental Health and Addiction Services
Office of Planning, Research, Evaluation and Prevention Trenton, New Jersey
May 2015
DEPARTMENT OF HUMAN SERVICES
DIVISION OF MENTAL HEALTH AND ADDICTION SERVICES 222 SOUTH WARREN STREET
PO BOX 700 TRENTON, NJ 08625 Elizabeth Connolly
Act Commissioner Chris Christie
Governor LYNN A. KOVICH
Assistant Commissioner May 2015
This statewide Substance Abuse Overview provides statistics on substance abuse treatment in New Jersey for calendar year 2014. In 2014 there were 65,553 treatment admissions and 62,525 discharges reported to the New Jersey Department of Human Services, Division of Mental Health and Addiction Services by substance abuse treatment providers. These reports were submitted through the web-based New Jersey Substance Abuse Monitoring System (NJ-SAMS). A few changes in this report now include on Fee-For-Services admissions, Federal Poverty Level and discharge continuing care.
Reports for individual counties include:
° Admissions for Substance Abuse Treatment by County of Residence ° Admissions for Substance Abuse Treatment by County of Treatment Provider ° Substance Abuse Admissions by Municipality and Primary Drug ° Substance Abuse Admissions by Primary Drug within Municipality ° Map for Number of Substance Abuse Admissions by Municipality of Residence ° Admissions by Municipality of Residence, Age Group and Primary Drug ° Admissions by Age Group, Gender and Primary Drug ° Discharges for Substance Abuse Treatment by County of Residence ° Discharges for Substance Abuse Treatment by County of Treatment Provider
If you have any questions about this report you may contact us by email at [email protected] or by telephone at (609) 292-8930. Sincerely,
Suzanne Borys, Ed. D., Assistant Division Director Office of Planning, Research, Evaluation and Prevention
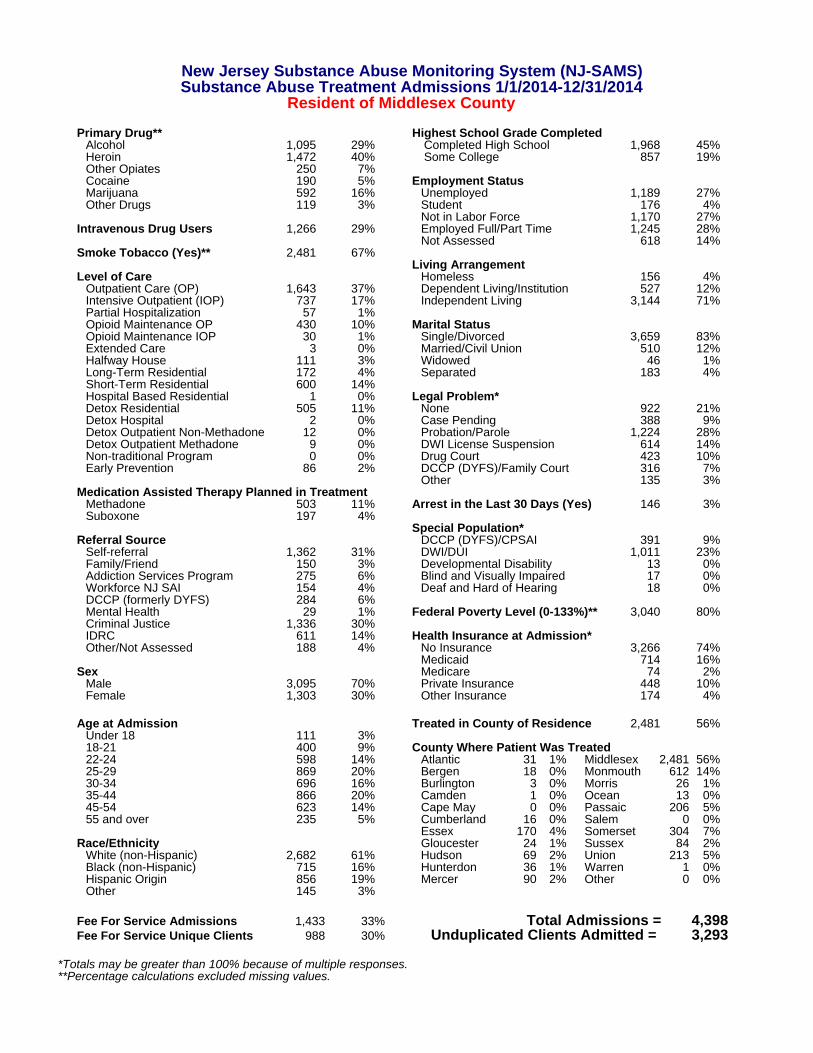
New Jersey Substance Abuse Monitoring System (NJ-SAMS) Substance Abuse Treatment Admissions 1/1/2014-12/31/2014 Resident of Middlesex County Primary Drug** Highest School Grade Completed Alcohol 1,095 29% Completed High School 1,968 45% Heroin 1,472 40% Some College 857 19% Other Opiates 250 7% Cocaine 190 5% Employment Status Marijuana 592 16% Unemployed 1,189 27% Other Drugs 119 3% Student 176 4% Not in Labor Force 1,170 27% Intravenous Drug Users 1,266 29% Employed Full/Part Time 1,245 28% Not Assessed 618 14% Smoke Tobacco (Yes)** 2,481 67% Living Arrangement Level of Care Homeless 156 4% Outpatient Care (OP) 1,643 37% Dependent Living/Institution 527 12% Intensive Outpatient (IOP) 737 17% Independent Living 3,144 71% Partial Hospitalization 57 1% Opioid Maintenance OP 430 10% Marital Status Opioid Maintenance IOP 30 1% Single/Divorced 3,659 83% Extended Care 3 0% Married/Civil Union 510 12% Halfway House 111 3% Widowed 46 1% Long-Term Residential 172 4% Separated 183 4% Short-Term Residential 600 14% Hospital Based Residential 1 0% Legal Problem* Detox Residential 505 11% None 922 21% Detox Hospital 2 0% Case Pending 388 9% Detox Outpatient Non-Methadone 12 0% Probation/Parole 1,224 28% Detox Outpatient Methadone 9 0% DWI License Suspension 614 14% Non-traditional Program 0 0% Drug Court 423 10% Early Prevention 86 2% DCCP (DYFS)/Family Court 316 7% Other 135 3% Medication Assisted Therapy Planned in Treatment Methadone 503 11% Arrest in the Last 30 Days (Yes) 146 3% Suboxone 197 4% Special Population* Referral Source DCCP (DYFS)/CPSAI 391 9% Self-referral 1,362 31% DWI/DUI 1,011 23% Family/Friend 150 3% Developmental Disability 13 0% Addiction Services Program 275 6% Blind and Visually Impaired 17 0% Workforce NJ SAI 154 4% Deaf and Hard of Hearing 18 0% DCCP (formerly DYFS) 284 6% Mental Health 29 1% Federal Poverty Level (0-133%)** 3,040 80% Criminal Justice 1,336 30% IDRC 611 14% Health Insurance at Admission* Other/Not Assessed 188 4% No Insurance 3,266 74% Medicaid 714 16% Sex Medicare 74 2% Male 3,095 70% Private Insurance 448 10% Female 1,303 30% Other Insurance 174 4% Age at Admission Treated in County of Residence 2,481 56% Under 18 111 3% 18-21 400 9% County Where Patient Was Treated 22-24 598 14% Atlantic 31 1% Middlesex 2,481 56% 25-29 869 20% Bergen 18 0% Monmouth 612 14% 30-34 696 16% Burlington 3 0% Morris 26 1% 35-44 866 20% Camden 1 0% Ocean 13 0% 45-54 623 14% Cape May 0 0% Passaic 206 5% 55 and over 235 5% Cumberland 16 0% Salem 0 0% Essex 170 4% Somerset 304 7% Race/Ethnicity Gloucester 24 1% Sussex 84 2% White (non-Hispanic) 2,682 61% Hudson 69 2% Union 213 5% Black (non-Hispanic) 715 16% Hunterdon 36 1% Warren 1 0% Hispanic Origin 856 19% Mercer 90 2% Other 0 0% Other 145 3% Fee For Service Admissions 1,433 33% Total Admissions = 4,398 Fee For Service Unique Clients 988 30% Unduplicated Clients Admitted = 3,293 *Totals may be greater than 100% because of multiple responses. **Percentage calculations excluded missing values.

New Jersey Substance Abuse Monitoring System (NJ-SAMS) Substance Abuse Treatment Admissions 1/1/2014-12/31/2014 Treatment Site in Middlesex County Primary Drug** Highest School Grade Completed Alcohol 988 34% Completed High School 1,578 51% Heroin 873 30% Some College 631 20% Other Opiates 209 7% Cocaine 146 5% Employment Status Marijuana 584 20% Unemployed 872 28% Other Drugs 70 2% Student 163 5% Not in Labor Force 748 24% Intravenous Drug Users 613 20% Employed Full/Part Time 1,177 38% Not Assessed 121 4% Smoke Tobacco (Yes)** 1,695 59% Living Arrangement Level of Care Homeless 53 2% Outpatient Care (OP) 1,677 54% Dependent Living/Institution 428 14% Intensive Outpatient (IOP) 721 23% Independent Living 2,501 81% Partial Hospitalization 11 0% Opioid Maintenance OP 323 10% Marital Status Opioid Maintenance IOP 33 1% Single/Divorced 2,519 82% Extended Care 1 0% Married/Civil Union 388 13% Halfway House 0 0% Widowed 29 1% Long-Term Residential 191 6% Separated 145 5% Short-Term Residential 1 0% Hospital Based Residential 1 0% Legal Problem* Detox Residential 0 0% None 572 19% Detox Hospital 0 0% Case Pending 212 7% Detox Outpatient Non-Methadone 40 1% Probation/Parole 1,023 33% Detox Outpatient Methadone 4 0% DWI License Suspension 592 19% Non-traditional Program 0 0% Drug Court 374 12% Early Prevention 78 3% DCCP (DYFS)/Family Court 284 9% Other 90 3% Medication Assisted Therapy Planned in Treatment Methadone 378 12% Arrest in the Last 30 Days (Yes) 84 3% Suboxone 48 2% Special Population* Referral Source DCCP (DYFS)/CPSAI 364 12% Self-referral 506 16% DWI/DUI 857 28% Family/Friend 68 2% Developmental Disability 13 0% Addiction Services Program 67 2% Blind and Visually Impaired 19 1% Workforce NJ SAI 159 5% Deaf and Hard of Hearing 11 0% DCPP (formerly DYFS) 282 9% Mental Health 22 1% Federal Poverty Level (0-133%)** 1,974 76% Criminal Justice 1,288 42% IDRC 599 19% Health Insurance at Admission* Other/Not Assessed 83 3% No Insurance 2,332 76% Medicaid 451 15% Sex Medicare 46 1% Male 2,220 72% Private Insurance 336 11% Female 861 28% Other Insurance 140 5% Age at Admission Treated in County of Residence 2,481 81% Under 18 92 3% 18-21 281 9% County of Residence 22-24 384 12% Atlantic 8 0% Middlesex 2,481 81% 25-29 578 19% Bergen 32 1% Monmouth 88 3% 30-34 476 15% Burlington 28 1% Morris 16 1% 35-44 649 21% Camden 3 0% Ocean 35 1% 45-54 465 15% Cape May 0 0% Passaic 47 2% 55 and over 155 5% Cumberland 1 0% Salem 0 0% Essex 13 0% Somerset 211 7% Race/Ethnicity Gloucester 4 0% Sussex 6 0% White (non-Hispanic) 1,614 52% Hudson 10 0% Union 51 2% Black (non-Hispanic) 637 21% Hunterdon 7 0% Warren 7 0% Hispanic Origin 708 23% Mercer 16 1% Other 17 1% Other 122 4% Fee For Service Admissions 1,044 34% Total Admissions = 3,081 Fee For Service Unique Client 759 28% Unduplicated Clients Admitted = 2,671 *Totals may be greater than 100% because of multiple responses. **Percentage calculation excluded missing values.

Substance Abuse Admissions by Municipality and Primary Drug 2014 NJ Resident Admissions
Primary Drug Alcohol Cocaine/
Crack Heroin Other
Opiates Marijuana/ Hashish
Other Drugs
Unknown Total
Middlesex County
N % N % N % N % N % N % N % N % Carteret Boro 34 3 6 3 42 3 1 0 22 4 2 2 11 2 118 3Cranbury Twp 11 1 1 0 5 1 17 0Dunellen Boro 12 1 2 1 15 1 7 3 5 1 2 2 4 1 47 1East Brunswick Twp 41 4 16 8 44 3 12 5 14 2 10 9 27 4 164 4Edison Twp 104 9 8 4 117 8 16 6 45 8 9 8 69 10 368 8Helmetta Boro 8 1 10 1 3 1 1 0 3 0 25 1Highland Park Boro 17 2 5 3 14 1 2 1 9 2 1 1 12 2 60 1Jamesburg Boro 12 1 23 2 2 1 2 0 2 2 10 1 51 1Metuchen Boro 19 2 1 1 28 2 4 2 8 1 10 1 70 2Middlesex Boro 88 8 15 8 122 8 21 8 60 10 7 6 37 5 350 8Milltown Boro 8 1 1 1 17 1 4 2 2 0 1 1 13 2 46 1Monroe Twp 23 2 1 1 57 4 9 3 9 2 6 5 25 4 130 3New Brunswick City 90 8 29 15 91 6 12 5 79 13 11 9 43 6 355 8North Brunswick Twp 38 3 16 8 64 4 5 2 44 7 7 6 22 3 196 4
Old Bridge Twp 68 6 10 5 115 8 21 8 13 2 8 7 51 8 286 7Perth Amboy City 106 10 23 12 116 8 9 3 70 12 6 5 24 4 354 8Piscataway Twp 45 4 3 2 55 4 18 7 49 8 4 3 24 4 198 5Plainsboro Twp 19 2 2 1 8 1 2 1 6 1 3 0 40 1Sayreville Boro 50 5 6 3 52 4 8 3 11 2 2 2 17 3 146 3South Amboy City 45 4 4 2 74 5 16 6 12 2 7 6 31 5 189 4South Brunswick Twp 23 2 1 1 42 3 12 5 14 2 3 3 11 2 106 2
South Plainfield B 43 4 3 2 33 2 14 5 12 2 1 1 25 4 131 3South River Boro 37 3 6 3 40 3 5 2 8 1 3 3 17 3 116 3Spotswood Boro 12 1 28 2 2 1 6 1 1 1 12 2 61 1Woodbridge Twp 77 7 12 6 119 8 29 11 40 7 11 9 31 5 319 7Not Stated 65 6 20 11 146 10 24 9 52 9 12 10 136 20 455 10Total 1095 100 190 100 1472 100 258 100 594 100 116 100 673 100 4398 100

Substance Abuse Admissions by Primary Drug within Municipality 2014 NJ Resident Admissions
Primary Drug Alcohol Cocaine/
Crack Heroin Other
Opiates Marijuana/ Hashish
Other Drugs
Unknown Total Middlesex County
N % N % N % N % N % N % N % N % Carteret Boro 34 29 6 5 42 36 1 1 22 19 2 2 11 9 118 100Cranbury Twp 11 65 1 6 5 29 17 100Dunellen Boro 12 26 2 4 15 32 7 15 5 11 2 4 4 9 47 100East Brunswick Twp 41 25 16 10 44 27 12 7 14 9 10 6 27 16 164 100Edison Twp 104 28 8 2 117 32 16 4 45 12 9 2 69 19 368 100Helmetta Boro 8 32 10 40 3 12 1 4 3 12 25 100Highland Park Boro 17 28 5 8 14 23 2 3 9 15 1 2 12 20 60 100Jamesburg Boro 12 24 23 45 2 4 2 4 2 4 10 20 51 100Metuchen Boro 19 27 1 1 28 40 4 6 8 11 10 14 70 100Middlesex Boro 88 25 15 4 122 35 21 6 60 17 7 2 37 11 350 100Milltown Boro 8 17 1 2 17 37 4 9 2 4 1 2 13 28 46 100Monroe Twp 23 18 1 1 57 44 9 7 9 7 6 5 25 19 130 100New Brunswick City 90 25 29 8 91 26 12 3 79 22 11 3 43 12 355 100North Brunswick Twp 38 19 16 8 64 33 5 3 44 22 7 4 22 11 196 100Old Bridge Twp 68 24 10 3 115 40 21 7 13 5 8 3 51 18 286 100Perth Amboy City 106 30 23 6 116 33 9 3 70 20 6 2 24 7 354 100Piscataway Twp 45 23 3 2 55 28 18 9 49 25 4 2 24 12 198 100Plainsboro Twp 19 48 2 5 8 20 2 5 6 15 3 8 40 100Sayreville Boro 50 34 6 4 52 36 8 5 11 8 2 1 17 12 146 100South Amboy City 45 24 4 2 74 39 16 8 12 6 7 4 31 16 189 100South Brunswick Twp 23 22 1 1 42 40 12 11 14 13 3 3 11 10 106 100South Plainfield B 43 33 3 2 33 25 14 11 12 9 1 1 25 19 131 100South River Boro 37 32 6 5 40 34 5 4 8 7 3 3 17 15 116 100Spotswood Boro 12 20 28 46 2 3 6 10 1 2 12 20 61 100Woodbridge Twp 77 24 12 4 119 37 29 9 40 13 11 3 31 10 319 100Not Stated 65 14 20 4 146 32 24 5 52 11 12 3 136 30 455 100Total 1095 25 190 4 1472 33 258 6 594 14 116 3 673 15 4398 100

Edison Township
Woodbridge Township
Perth Amboy City
New Brunswick City
Middlesex Borough
2014 Middlesex County Substance Abuse Admissions by Municipality of Residence
LegendMidCOUNT
17 - 2526 - 7071 - 146147 - 198199 - 368
Top Five Municipalities1 Edison Township 3682 New Brunswick City 3553 Perth Amboy City 3544 Middlesex Borough 3505 Woodbridge Township 319
Data: NJSAMS 2015 February DownloadReport Date: May, 2015
NJ Department of Human Services Division of Mental Health and Addiction Services Research, Planning and Evaluation Unit¹ 0 0.9 1.8 2.70.45
Miles

Admissions by Municipality of Residence, Age Group and Primary Drug 2014 NJ Resident Admissions
Alcohol Drugs Total 18 & Over Under
18 Total 18 & Over Under
18 Total 18 & Over Under
18 Total
Middlesex County
N % N % N % N % N % N % N % N % N % Carteret Boro 34 100 34 100 70 96 3 4 73 100 104 97 3 3 107 100Cranbury Twp 10 91 1 9 11 100 1 100 1 100 11 92 1 8 12 100Dunellen Boro 12 100 12 100 31 100 31 100 43 100 43 100East Brunswick Twp
41 100 41 100 93 97 3 3 96 100 134 98 3 2 137 100
Edison Twp 104 100 104 100 179 92 16 8 195 100 283 95 16 5 299 100Helmetta Boro 8 100 8 100 14 100 14 100 22 100 22 100Highland Park Boro
17 100 17 100 27 87 4 13 31 100 44 92 4 8 48 100
Jamesburg Boro 12 100 12 100 29 100 29 100 41 100 41 100Metuchen Boro 19 100 19 100 39 95 2 5 41 100 58 97 2 3 60 100Middlesex Boro 87 99 1 1 88 100 213 95 12 5 225 100 300 96 13 4 313 100Milltown Boro 8 100 8 100 25 100 25 100 33 100 33 100Monroe Twp 23 100 23 100 81 99 1 1 82 100 104 99 1 1 105 100New Brunswick City
90 100 90 100 204 92 18 8 222 100 294 94 18 6 312 100
North Brunswick Twp
38 100 38 100 132 97 4 3 136 100 170 98 4 2 174 100
Old Bridge Twp 68 100 68 100 165 99 2 1 167 100 233 99 2 1 235 100Perth Amboy City 106 100 106 100 221 99 3 1 224 100 327 99 3 1 330 100Piscataway Twp 45 100 45 100 121 94 8 6 129 100 166 95 8 5 174 100Plainsboro Twp 19 100 19 100 18 100 18 100 37 100 37 100Sayreville Boro 50 100 50 100 78 99 1 1 79 100 128 99 1 1 129 100South Amboy City
45 100 45 100 111 98 2 2 113 100 156 99 2 1 158 100
South Brunswick Twp
23 100 23 100 71 99 1 1 72 100 94 99 1 1 95 100
South Plainfield B 43 100 43 100 62 98 1 2 63 100 105 99 1 1 106 100South River Boro 36 97 1 3 37 100 62 100 62 100 98 99 1 1 99 100Spotswood Boro 12 100 12 100 36 97 1 3 37 100 48 98 1 2 49 100Woodbridge Twp 77 100 77 100 207 98 4 2 211 100 284 99 4 1 288 100 Not Stated 64 98 1 2 65 100 247 97 7 3 254 100 311 97 8 3 319 100Total 1091 100 4 0 1095 100 2537 96 93 4 2630 100 3628 97 97 3 3725 100* Missing primary drug or age admissions are not included.

Admissions by Age Group, Gender and Primary Drug 2014 NJ Resident Admissions
Gender Female Male
Total* Middlesex
N % N % N % Alcohol 3 75.0 1 25.0 4 100.0 Heroin 2 40.0 3 60.0 5 100.0 Marijuana/Hashish 19 22.4 66 77.6 85 100.0 Other Drugs 1 33.3 2 66.7 3 100.0 Unknown 4 28.6 10 71.4 14 100.0
0-17
Total* 29 26.1 82 73.9 111 100.0 Alcohol 51 26.8 139 73.2 190 100.0 Heroin 103 32.9 210 67.1 313 100.0 Other Opiates 11 30.6 25 69.4 36 100.0 Marijuana/Hashish 40 18.2 180 81.8 220 100.0 Other Drugs 14 40.0 21 60.0 35 100.0 Unknown 67 32.8 137 67.2 204 100.0
18-24
Total* 286 28.7 712 71.3 998 100.0 Alcohol 216 25.4 635 74.6 851 100.0 Heroin 359 31.4 785 68.6 1144 100.0 Other Opiates 89 40.8 129 59.2 218 100.0 Marijuana/Hashish 87 30.3 200 69.7 287 100.0 Other Drugs 82 31.1 182 68.9 264 100.0 Unknown 143 32.7 294 67.3 437 100.0
25-59
Total* 976 30.5 2225 69.5 3201 100.0 Alcohol 4 8.0 46 92.0 50 100.0 Heroin 2 20.0 8 80.0 10 100.0 Other Opiates 1 25.0 3 75.0 4 100.0 Marijuana/Hashish 2 100.0 2 100.0 Other Drugs 1 25.0 3 75.0 4 100.0 Unknown 4 22.2 14 77.8 18 100.0
60&Over
Total* 12 13.6 76 86.4 88 100.0 Alcohol 274 25.0 821 75.0 1095 100.0 Heroin 466 31.7 1006 68.3 1472 100.0 Other Opiates 101 39.1 157 60.9 258 100.0 Marijuana/Hashish 146 24.6 448 75.4 594 100.0 Other Drugs 98 32.0 208 68.0 306 100.0 Unknown 218 32.4 455 67.6 673 100.0
Total*
Total* 1303 29.6 3095 70.4 4398 100.0 * Unknown age or gender admissions are not included.
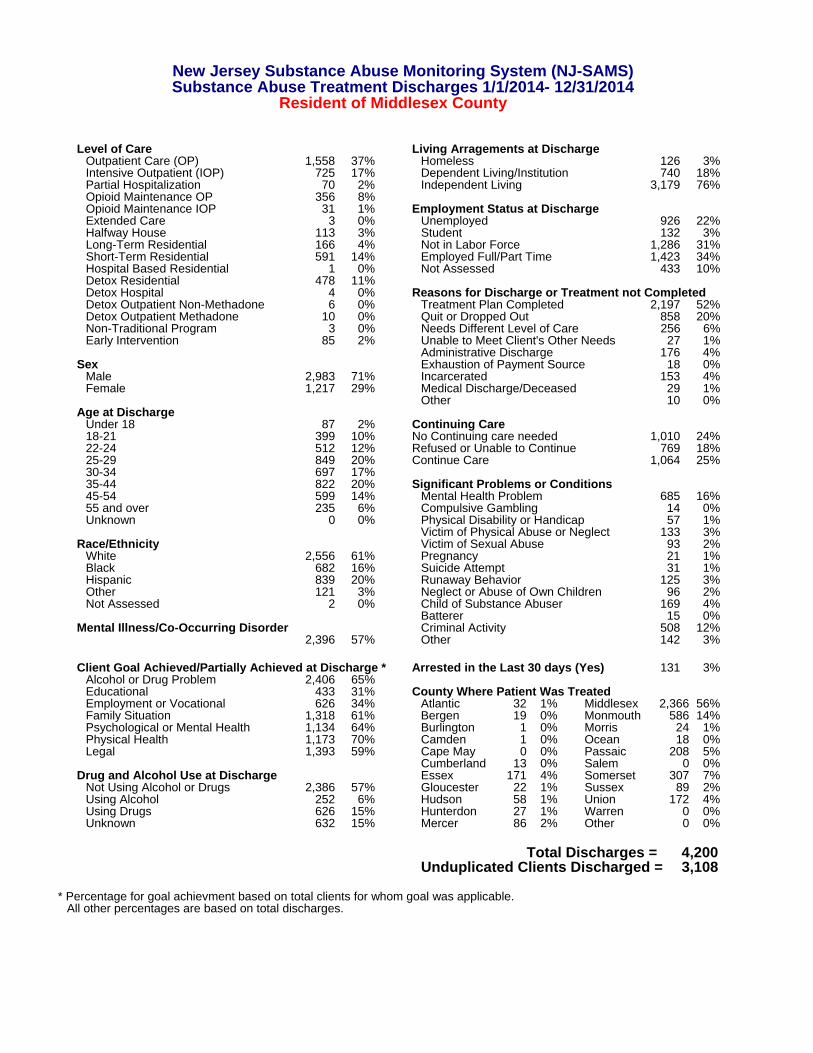
New Jersey Substance Abuse Monitoring System (NJ-SAMS) Substance Abuse Treatment Discharges 1/1/2014- 12/31/2014 Resident of Middlesex County Level of Care Living Arragements at Discharge Outpatient Care (OP) 1,558 37% Homeless 126 3% Intensive Outpatient (IOP) 725 17% Dependent Living/Institution 740 18% Partial Hospitalization 70 2% Independent Living 3,179 76% Opioid Maintenance OP 356 8% Opioid Maintenance IOP 31 1% Employment Status at Discharge Extended Care 3 0% Unemployed 926 22% Halfway House 113 3% Student 132 3% Long-Term Residential 166 4% Not in Labor Force 1,286 31% Short-Term Residential 591 14% Employed Full/Part Time 1,423 34% Hospital Based Residential 1 0% Not Assessed 433 10% Detox Residential 478 11% Detox Hospital 4 0% Reasons for Discharge or Treatment not Completed Detox Outpatient Non-Methadone 6 0% Treatment Plan Completed 2,197 52% Detox Outpatient Methadone 10 0% Quit or Dropped Out 858 20% Non-Traditional Program 3 0% Needs Different Level of Care 256 6% Early Intervention 85 2% Unable to Meet Client's Other Needs 27 1% Administrative Discharge 176 4% Sex Exhaustion of Payment Source 18 0% Male 2,983 71% Incarcerated 153 4% Female 1,217 29% Medical Discharge/Deceased 29 1% Other 10 0% Age at Discharge Under 18 87 2% Continuing Care 18-21 399 10% No Continuing care needed 1,010 24% 22-24 512 12% Refused or Unable to Continue 769 18% 25-29 849 20% Continue Care 1,064 25% 30-34 697 17% 35-44 822 20% Significant Problems or Conditions 45-54 599 14% Mental Health Problem 685 16% 55 and over 235 6% Compulsive Gambling 14 0% Unknown 0 0% Physical Disability or Handicap 57 1% Victim of Physical Abuse or Neglect 133 3% Race/Ethnicity Victim of Sexual Abuse 93 2% White 2,556 61% Pregnancy 21 1% Black 682 16% Suicide Attempt 31 1% Hispanic 839 20% Runaway Behavior 125 3% Other 121 3% Neglect or Abuse of Own Children 96 2% Not Assessed 2 0% Child of Substance Abuser 169 4% Batterer 15 0% Mental Illness/Co-Occurring Disorder Criminal Activity 508 12% 2,396 57% Other 142 3% Client Goal Achieved/Partially Achieved at Discharge * Arrested in the Last 30 days (Yes) 131 3% Alcohol or Drug Problem 2,406 65% Educational 433 31% County Where Patient Was Treated Employment or Vocational 626 34% Atlantic 32 1% Middlesex 2,366 56% Family Situation 1,318 61% Bergen 19 0% Monmouth 586 14% Psychological or Mental Health 1,134 64% Burlington 1 0% Morris 24 1% Physical Health 1,173 70% Camden 1 0% Ocean 18 0% Legal 1,393 59% Cape May 0 0% Passaic 208 5% Cumberland 13 0% Salem 0 0% Drug and Alcohol Use at Discharge Essex 171 4% Somerset 307 7% Not Using Alcohol or Drugs 2,386 57% Gloucester 22 1% Sussex 89 2% Using Alcohol 252 6% Hudson 58 1% Union 172 4% Using Drugs 626 15% Hunterdon 27 1% Warren 0 0% Unknown 632 15% Mercer 86 2% Other 0 0% Total Discharges = 4,200 Unduplicated Clients Discharged = 3,108 * Percentage for goal achievment based on total clients for whom goal was applicable. All other percentages are based on total discharges.

New Jersey Substance Abuse Monitoring System (NJ-SAMS) Substance Abuse Treatment Discharges 1/1/2014- 12/31/2014 Treatment Site in Middlesex County Level of Care Living Arragements at Discharge Outpatient Care (OP) 1,618 54% Homeless 75 3% Intensive Outpatient (IOP) 730 24% Dependent Living/Institution 407 14% Partial Hospitalization 16 1% Independent Living 2,435 81% Opioid Maintenance OP 301 10% Opioid Maintenance IOP 29 1% Employment Status at Discharge Extended Care 1 0% Unemployed 659 22% Halfway House 0 0% Student 110 4% Long-Term Residential 184 6% Not in Labor Force 721 24% Short-Term Residential 1 0% Employed Full/Part Time 1,311 44% Hospital Based Residential 1 0% Not Assessed 195 7% Detox Residential 0 0% Detox Hospital 0 0% Reasons for Discharge or Treatment not Completed Detox Outpatient Non-Methadone 27 1% Treatment Plan Completed 1,286 43% Detox Outpatient Methadone 7 0% Quit or Dropped Out 671 22% Non-Traditional Program 3 0% Needs Different Level of Care 244 8% Early Intervention 78 3% Unable to Meet Client's Other Needs 18 1% Administrative Discharge 145 5% Sex Exhaustion of Payment Source 25 1% Male 2,183 73% Incarcerated 156 5% Female 813 27% Medical Discharge/Deceased 23 1% Other 4 0% Age at Discharge Under 18 70 2% Continuing Care 18-21 262 9% No Continuing care needed 990 33% 22-24 338 11% Refused or Unable to Continue 527 18% 25-29 570 19% Continue Care 462 15% 30-34 496 17% 35-44 630 21% Significant Problems or Conditions 45-54 465 16% Mental Health Problem 467 16% 55 and over 165 6% Compulsive Gambling 7 0% Unknown 0 0% Physical Disability or Handicap 50 2% Victim of Physical Abuse or Neglect 98 3% Race/Ethnicity Victim of Sexual Abuse 60 2% White 1,563 52% Pregnancy 18 1% Black 619 21% Suicide Attempt 23 1% Hispanic 697 23% Runaway Behavior 56 2% Other 98 3% Neglect or Abuse of Own Children 71 2% Not Assessed 19 1% Child of Substance Abuser 96 3% Batterer 11 0% Mental Illness/Co-Occurring Disorder Criminal Activity 378 13% 2,008 67% Other 129 4% Client Goal Achieved/Partially Achieved at Discharge * Arrested in the Last 30 days (Yes) 121 4% Alcohol or Drug Problem 1,615 59% Educational 490 49% County of Residence Employment or Vocational 786 54% Atlantic 8 0% Middlesex 2,366 79% Family Situation 870 51% Bergen 28 1% Monmouth 103 3% Psychological or Mental Health 654 53% Burlington 30 1% Morris 11 0% Physical Health 517 55% Camden 2 0% Ocean 39 1% Legal 1,071 57% Cape May 0 0% Passaic 52 2% Cumberland 1 0% Salem 0 0% Drug and Alcohol Use at Discharge Essex 14 0% Somerset 203 7% Not Using Alcohol or Drugs 1,545 52% Gloucester 6 0% Sussex 5 0% Using Alcohol 270 9% Hudson 16 1% Union 54 2% Using Drugs 567 19% Hunterdon 6 0% Warren 5 0% Unknown 546 18% Mercer 23 1% Other 24 1% Total Discharges = 2,996 Unduplicated Clients Discharged = 2,582 * Percentage for goal achievment based on total clients for whom goal was applicable. All other percentages are based on total discharges.