middle school grades 5-8 student · pdf filemiddle school grades 5-8 student guide . 2 ......
TRANSCRIPT

Norristown Area School District Annual District-wide Science Fair
Middle School Grades 5-8
Student Guide

2
Science Fair Online Resources
Science Buddies
http://www.sciencebuddies.org/
Science Fair Project Resource Guide
http://www.ipl.org/div/projectguide/
Successful Science Fair Projects
http://faculty.washington.edu/chudler/fair.html
All Science Fair Projects
http://www.all-science-fair-projects.com/
Exploratorium: Science Fair
http://www.exploratorium.edu/lc/pathfinders/scifairs/index.ht
ml
Try Science!
http://tryscience.org/
Make It Solar
http://www.makeitsolar.com/science-fair-information/01-the-
scientific-method.htm
Welcome to the 2013 – 2014 Norristown Area School District Middle
School Science Fair. This handbook will provide students with
necessary information needed in order to conduct a successful science
fair project. Each participant is challenged to use the scientific method
to conduct a controlled investigation. All projects must be
experiments; Models or demonstrations will not be accepted for the
science fair.
Students are encouraged to seek assistance from parents/ guardians
and teachers in choosing a topic, conducting experiments, and gathering
materials. However, the finished project is expected to reflect the work,
thoughts, and efforts of the student.
A SCIENCE PROJECT IS…
Trying to answer a specific
question or solve a problem by
experimenting, making
observations, recording data and
drawing conclusions.
An opportunity for students to
experience the use of the
scientific method through real-
life experiences.
A SCIENCE PROJECT IS NOT…
Show-and-Tell
A Book report
Poster displays on scientific
literature
Making a model (volcano,
solar system, etc.)

3
SCIENCE FAIR CATEGORIES
Biochemistry (Chemistry of life processes): Molecular biology, molecular genetics,
enzymes, photosynthesis, blood chemistry, protein chemistry, food chemistry.
Botany (Study of plant life): Agriculture, agronomy, horticulture, forestry, plant
taxonomy, plant physiology, plant pathology, plant genetics hydroponics.
Chemistry (Study of nature and composition of matter and laws governing it):
Physical chemistry, organic chemistry (other than biochemistry), inorganic chemistry,
materials, plastics, fuels, pesticides, metallurgy, soil chemistry
Computer Science: Study and development of computer software and hardware and
associated logical devices
Consumer Science: The science of the normal use of consumer products
Earth and Space: Geology, mineralogy, oceanography, meteorology, climatology,
astronomy, geology, speleology, seismology, geography.
Engineering Technology: Projects that directly apply scientific principles to
manufacturing and practical uses- civil, mechanical, aeronautical, chemical, electrical,
photographic, sound, automotive, marine, heating and refrigerating, transportation,
environmental engineering.
Environmental Science: Study of pollution (air, water, and land) sources and their
control: ecology
Mathematics: Development of formal logical systems or various numerical and
algebraic computations, and the application of these principles- calculus, geometry,
abstract algebra, number theory, statistics, complex analysis, probability.
Physics: Theories, principles and laws governing energy and the effect of energy on
matter- solid state, optics, acoustics, particle, nuclear, atomic, plasma, superconductivity,
fluid and gas dynamics, thermodynamics, semiconductors, magnetism, quantum
mechanics, biophysics
Zoology (Study of animals): Animals genetics, ornithology, ichthyology, herpetology,
entomology, animal ecology, paleontology, cellular physiology, circadian rhythms, animal
husbandry, cytology, histology, animal physiology, invertebrate neurophysiology

4
ESSENTIAL PARTS OF A SUCCESSFUL PROJECT
Each project must follow the Scientific Method and must include all components below.
See pages 8-9 for more detailed explanations of each component.
1. Project Title/Problem: What do you want to find out?
2. Purpose: Why do you want to do this project?
3. Hypothesis: What do you think will happen?
4. Materials: What do you need to complete the project?
5. Procedure: How can you test what will happen?
6. Data Results: What happened?
7. Abstract & Conclusion: What did this experiment show?
8. Research Paper/Lab Book: What did I learn?
9. Oral Presentation: Can you explain your project?
DISPLAY BOARD
Complete the display board at home.
Use the diagram below to make sure you include everything that is required.
Name and school listed ONLY on the back of the display board.
Projects must be displayed on a standard stand-alone tri-fold board.
Boards should be neat and attractive.
Matting the headings and information on colorful paper is encouraged.
Label all parts of the project.
No living organisms (mold, plants, etc.) should be displayed.
No props attached. No free standing items. Pictures only.
The project title is the scientific question (or problem) to be solved. “Cutesy” titles are
allowed, but should be placed above the main project title on the display board.

5
WHAT DO I HAVE TO DO?
There are four parts to the science fair project:
1. Research Paper / Lab Report The research paper is a written report that
includes background information on the project topic along with what
was learned from the experiment. The research report will include a title
page, table of contents, introduction (background research), discussion or
overview of experiment, data & graphs, conclusion, and a bibliography.
2. Experiment You will follow the procedures you wrote at school to do
your experiment and collect data and record your results.
3. Display Board This is a visual display of your experiment. It should
include all essential parts on page 3. Your research paper is placed in
front of your display board and should not be attached to it.
4. Oral Presentation You will share everything you learned in
your experiment with your classmates. Your classmates will
have an opportunity to ask you questions.
GETTING STARTED
Pick your topic Ideas should come from things in your areas of interest. A hobby might
lead you to a good topic. What is going on in the world that you would like to know more
about? Most importantly, pick a question or problem that is not too broad and that can be
answered through scientific investigation.
Research your topic Go to the library or internet to learn more about your topic. Ask
yourself why or what if…Look for unexplained or unexpected results. Use your
“Problem” to guide your background research. This may only be a paragraph or two
within your research paper.
Plan and conduct your experiment Remember you must design your experiment so
that it is a ‘controlled’ experiment. This is one in which only one variable is changed at a
time. During experimentation, keep detailed notes of each and every experiment,
measurement and observation in a log book. Do not rely on memory. Use data tables or
charts to record your quantitative data.
Analyze your results When you complete your experiments, examine and organize
your findings. Use appropriate graphs to make ‘pictures’ of your data. Identify patterns
from the graphs. This will help you answer your testable question. Did your experiments
give you the expected results? Why or why not? Are there other explanations that you
had not considered or observed?
Draw conclusions Did the variable(s) tested cause a change when compared to the
standard you are using? What patterns do you see from your graph analysis that exists
between your variables? Did you collect enough data? Do you need to conduct more
experimentation? Never alter your results to fit your hypothesis. If your results do not
support your hypothesis, that’s ok.
6
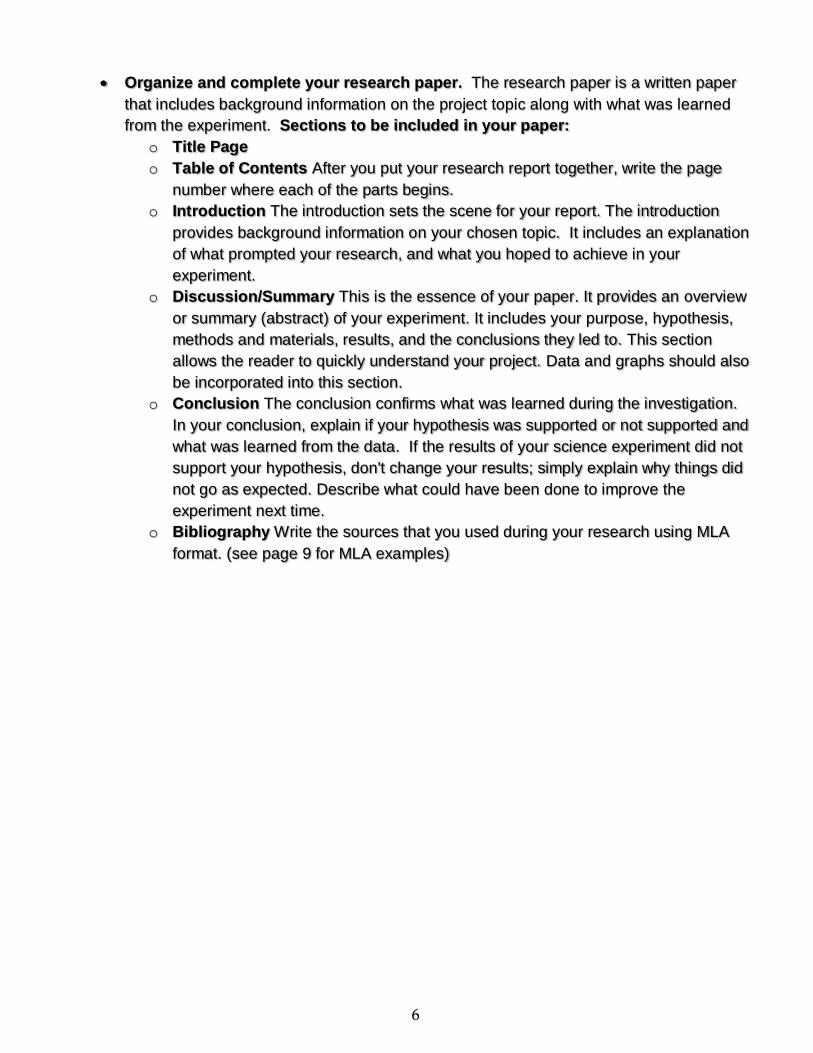
Organize and complete your research paper. The research paper is a written paper
that includes background information on the project topic along with what was learned
from the experiment. Sections to be included in your paper:
o Title Page
o Table of Contents After you put your research report together, write the page
number where each of the parts begins.
o Introduction The introduction sets the scene for your report. The introduction
provides background information on your chosen topic. It includes an explanation
of what prompted your research, and what you hoped to achieve in your
experiment.
o Discussion/Summary This is the essence of your paper. It provides an overview
or summary (abstract) of your experiment. It includes your purpose, hypothesis,
methods and materials, results, and the conclusions they led to. This section
allows the reader to quickly understand your project. Data and graphs should also
be incorporated into this section.
o Conclusion The conclusion confirms what was learned during the investigation.
In your conclusion, explain if your hypothesis was supported or not supported and
what was learned from the data. If the results of your science experiment did not
support your hypothesis, don't change your results; simply explain why things did
not go as expected. Describe what could have been done to improve the
experiment next time.
o Bibliography Write the sources that you used during your research using MLA
format. (see page 9 for MLA examples)
7
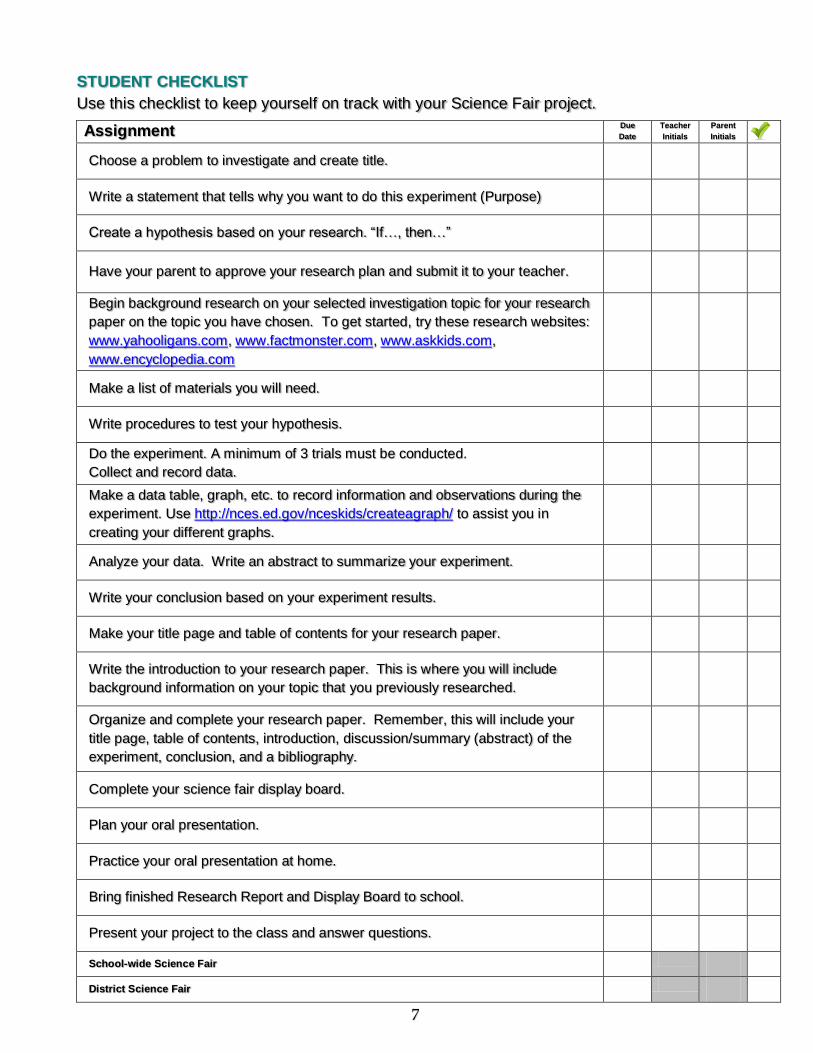
STUDENT CHECKLIST
Use this checklist to keep yourself on track with your Science Fair project.
Assignment Due
Date
Teacher
Initials
Parent
Initials
Choose a problem to investigate and create title.
Write a statement that tells why you want to do this experiment (Purpose)
Create a hypothesis based on your research. “If…, then…”
Have your parent to approve your research plan and submit it to your teacher.
Begin background research on your selected investigation topic for your research
paper on the topic you have chosen. To get started, try these research websites:
www.yahooligans.com, www.factmonster.com, www.askkids.com,
www.encyclopedia.com
Make a list of materials you will need.
Write procedures to test your hypothesis.
Do the experiment. A minimum of 3 trials must be conducted.
Collect and record data.
Make a data table, graph, etc. to record information and observations during the
experiment. Use http://nces.ed.gov/nceskids/createagraph/ to assist you in
creating your different graphs.
Analyze your data. Write an abstract to summarize your experiment.
Write your conclusion based on your experiment results.
Make your title page and table of contents for your research paper.
Write the introduction to your research paper. This is where you will include
background information on your topic that you previously researched.
Organize and complete your research paper. Remember, this will include your
title page, table of contents, introduction, discussion/summary (abstract) of the
experiment, conclusion, and a bibliography.
Complete your science fair display board.
Plan your oral presentation.
Practice your oral presentation at home.
Bring finished Research Report and Display Board to school.
Present your project to the class and answer questions.
School-wide Science Fair
District Science Fair

8
RESEARCH PLAN
Student: _________________________________________________
Grade: ________ Teacher: ___________________________________
Project Title (Question/Problem): _______________________________________________
__________________________________________________________________________
__________________________________________________________________________
Hypothesis: ________________________________________________________________
__________________________________________________________________________
__________________________________________________________________________
__________________________________________________________________________
Bibliography (Reference Resources): ____________________________________________
__________________________________________________________________________
__________________________________________________________________________
__________________________________________________________________________
__________________________________________________________________________
Project Category*: ____________________________________________________________
*Projects that involve human or animal subjects, potentially hazardous biological agents, or hazardous
chemicals, activities and devices require the completion of additional Montgomery County Science Fair
forms by the parent and student before the experiment can begin. Please be advised that the completion
of these forms does not guarantee a student’s participation at the Montgomery County Science Fair.
My child has permission to complete a science fair project according to the research plan
stated above. I agree to support my child to the best of my ability while s/he investigates
this problem.
____
Parent Signature Date
*************************************************************************************************************
To Be Completed by the Teacher:
Congratulations on completing the research plan for you science fair project! You have taken
the first step in your project. Getting an idea for a project and sketching out the project is
usually the hardest part. From now on you can work on researching your project, finalizing your
procedures, and performing the experiment.

9
Please note that it is ok to change your project a little as you progress with it. That is normal.
However, if you are going to switch topics, or make major changes, please speak with your
teacher.
Here are some specific comments/suggestions for your project:
____________________________________________________________________________
____________________________________________________________________________
____________________________________________________________________________
____________________________________________________________________________
____________________________________________________________________________
EXPLANATIONS OF THE ESSENTIAL PARTS OF A SUCCESSFUL PROJECT
PROJECT TITLE / PROBLEM
The problem is the scientific question to be solved. It also serves as the title of the project. The
title should be stated in the form of a question that can be answered through experimentation.
Use internet websites, magazines, encyclopedias, and books to decide on a problem that you
would like to solve.
PURPOSE
The purpose is a written statement that explains why the topic was chosen and what the
student hopes to learn. Describe the problem that is to be solved. The purpose should be one
that can be answered through an experiment.
HYPOTHESIS
The hypothesis should be based on a cause and effect relationship and should be written as an
“If...then” statement. It is your prediction about what will happen during your experiment. EXAMPLE: If the mass of an object is increased, then the speed of an object will decrease, because the
object will have more inertia.
MATERIALS
All materials being used in the experiment should be identified in list form. Include quantities
and sizes.
PROCEDURES
Procedures should be written as a step-by-step description of the investigation that tests your
hypothesis and includes at least three trials. Your variables should be identified in this section.
Independent Variables are changes that occur in an experiment that are directly caused
by the experimenter (you.)
Dependent Variables are changes that are made by the independent variables.
Controlled Variables are quantities that a scientist wants to remain constant.

10
DATA RESULTS & OBSERVATIONS
Observations made and data collected during the investigation are presented in the Data
Results section. Students must use tables, charts, graphs, and diagrams to show and explain
their results. Use METRIC units only (cm, m, mL, L, g, kg). Use the website
http://nces.ed.gov/nceskids/createagraph/ to assist you in creating your different graphs.
Data Table: Make a table to record the data you need to prove your hypothesis. You
may not need all of the rows depending on your experiment.
EXAMPLE: How much water do paper towels absorb?
What are you measuring and/or
observing? List the item in the
box below.
Trial #1
Trial #2
Trial #3
Bounty Paper Towels 10 mL 9 mL 10 mL
Brawny Paper Towels 8 mL 8 mL 9 mL
Store Brand Paper Towels 15 mL 16 mL 15 mL
Graph: Use the information from your data table to make a graph that shows your
experiment results clearly.
ABSTRACT
The abstract is an overview of the experiment or a summary of your science fair project and
should be limited to 250 words. It includes your hypothesis, your methods and materials, your
observations and results, and the conclusions they led to. The abstract allows the reader to
quickly understand your project. If you want judges and the public to be excited about your
science fair project, then write an exciting, engaging abstract!
CONCLUSION
The conclusion is a written statement confirming what was learned during the investigation. In
your conclusion, explain if your hypothesis was supported or not supported and what was
learned from the data. If the results of your science experiment did not support your hypothesis,
don't change your results; simply explain why things did not go as expected. Describe what
could have been done to improve the experiment next time.
RESEARCH PAPER / LAB BOOK
The research paper is a written statement that includes background information on the project
topic along with what was learned from the experiment. This will include your title page, table of
contents, introduction & background information, discussion or summary (abstract) of
experiment, data & graphs, conclusion, and a bibliography.
11
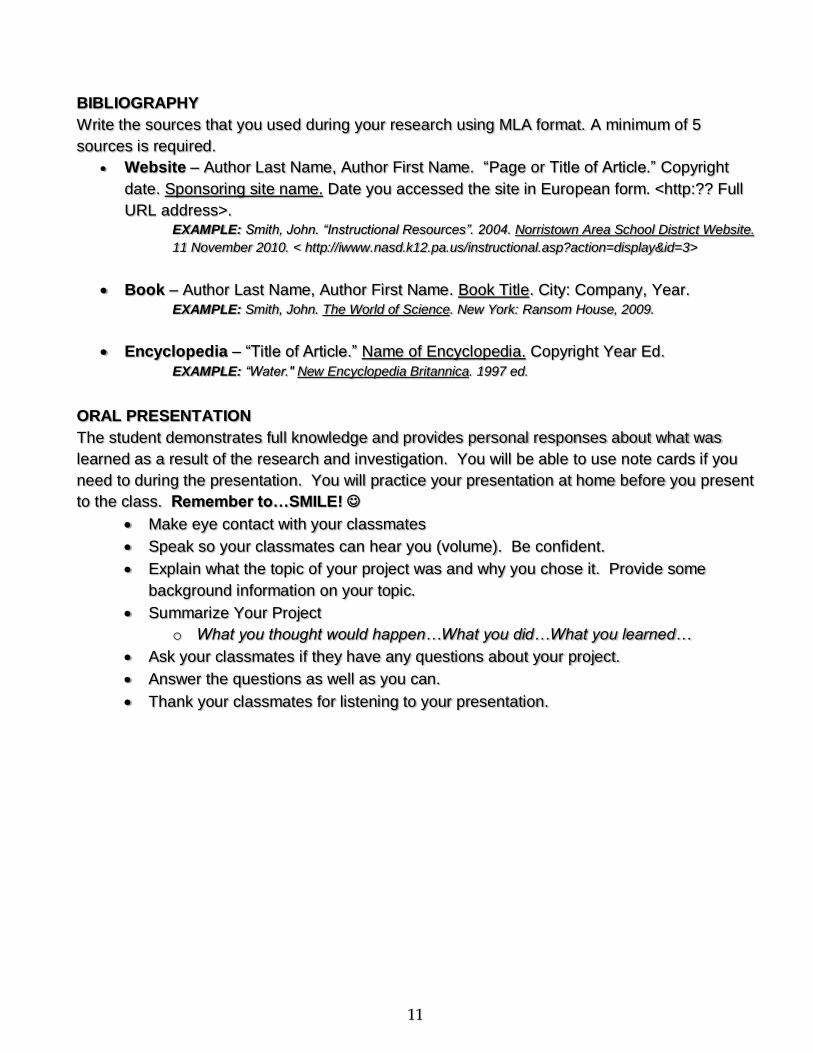
BIBLIOGRAPHY
Write the sources that you used during your research using MLA format. A minimum of 5
sources is required.
Website – Author Last Name, Author First Name. “Page or Title of Article.” Copyright
date. Sponsoring site name. Date you accessed the site in European form. <http:?? Full
URL address>. EXAMPLE: Smith, John. “Instructional Resources”. 2004. Norristown Area School District Website.
11 November 2010. < http://iwww.nasd.k12.pa.us/instructional.asp?action=display&id=3>
Book – Author Last Name, Author First Name. Book Title. City: Company, Year.
EXAMPLE: Smith, John. The World of Science. New York: Ransom House, 2009.
Encyclopedia – “Title of Article.” Name of Encyclopedia. Copyright Year Ed.
EXAMPLE: “Water." New Encyclopedia Britannica. 1997 ed.
ORAL PRESENTATION
The student demonstrates full knowledge and provides personal responses about what was
learned as a result of the research and investigation. You will be able to use note cards if you
need to during the presentation. You will practice your presentation at home before you present
to the class. Remember to…SMILE!
Make eye contact with your classmates
Speak so your classmates can hear you (volume). Be confident.
Explain what the topic of your project was and why you chose it. Provide some
background information on your topic.
Summarize Your Project
o What you thought would happen…What you did…What you learned…
Ask your classmates if they have any questions about your project.
Answer the questions as well as you can.
Thank your classmates for listening to your presentation.

12
DISPLAY BOARD GRADING RUBRIC
Student Name _________________________
Category Advanced
4 points Proficient
3 points
Basic
2 points
Below Basic
1 point Score
Investigative
Question
(Title)
Question includes the
independent variable(s) and
the dependent variable.
Easy to understand.
Question is clear/
complete. Some difficulty
in understanding.
Dependent variable may
be implied.
Question is unclear.
Unable to identify the
independent and
dependent variables.
Difficult to understand.
Title not stated in question
format. Unable to identify
the independent and
dependent variables.
Purpose
The investigation indicates
relevance and infers powerful
literacy objectives. Clear
authentic/ original rationale.
The problem to be solved
is somewhat defined.
Unoriginal / vague
rationale.
The problem is not clearly
defined. Inauthentic; no
clear rationale.
The problem is not defined.
Hypothesis
Uses an “If…Then.”
statement to answer the
Investigative Question clearly
identifies the relationship
between the independent
and dependent variables.
Uses an “I think….”
statement to answer the
Investigative Question.
The cause effect
relationship is unclear.
Does not answer the
Investigative Question.
Does not answer the
Investigative Question.
Materials
Identified in detail with
quantities, type, brand, etc.
Listed neatly. Includes all
tools to measure the results.
Are identified in some
detail, general. Includes
most of the tools used to
measure the results.
Some materials are
missing and/or are not
identified in detail.
Materials list not included.
Procedure
All steps listed sequentially.
Measures materials in
specific units. Controls are
clear. Identifies manipulation
of the variables. Can be
reproduced. Experiment
repeated at least three trials.
Most steps listed
somewhat in order.
Controls are not identified.
Experiment was repeated
at least two times. Some
difficulty in understanding
steps.
Steps are out of order
and/or missing details.
Experiment not repeated.
Difficulty in
understanding.
Procedure steps are
missing. Experiment not
repeated.
Data Results
Observations are clearly
written with relevant details
and all major observations
are highlighted. Accurately
represents observations in
graphs/tables/charts. Data
and charts are neat, accurate
and add to the reader's
understanding of the topic.
Observations are
somewhat clear with most
details. Highlights some
major observations.
Represents some
observations in graphs/
tables/charts. Data and
charts are neat and
accurate.
Observations are unclear
with many details
missing. Few highlights
given for major
observations.
Graphs/tables/charts are
unclear.
No highlights given for
major observations.
Graphs/tables/charts are
missing or are not
accurate.
Abstract
Provides a clear, thoughtful
overview or summary of the
investigation. It includes the
hypothesis, methods and
materials, results, and the
conclusions they led to.
Provides a basic overview
or summary of the
investigation. It includes
the hypothesis, methods
and materials, results, and
the conclusions they led to.
Attempts to provide an
overview or summary of
the investigation.
However, the hypothesis,
methods and materials,
results, and/or the
conclusions, are missing
from the abstract.
No abstract provided or
abstract does not
summarize the experiment.
Conclusion
Clearly states what was
learned as a result of the
investigation and whether
results support or do not
support the hypothesis.
Identifies ways to improve
the investigation.
Somewhat states what was
learned as a result of the
investigation and whether
the hypothesis was
supported or not.
Incomplete. Unclear
whether the hypothesis
was supported or not.
No statement whether the
hypothesis was supported
or not.
Total Score: _______
divided by 8 = _______ (Final Grade)
GRADE
4- Advanced
3- Proficient
2- Basic
1- Below Basic

13
ORAL PRESENTATION GRADING RUBRIC
Student Name _________________________
Category Advanced
4 points Proficient
3 points
Basic
2 points
Below Basic
1 point Score
Preparedness
(Note Cards are
allowed and
does not count
against student
preparedness)
Student is completely
prepared and has
obviously rehearsed.
Student seems pretty
prepared but might have
needed a couple more
rehearsals.
The student is somewhat
prepared, but it is clear that
rehearsal was lacking.
Student does not seem at
all prepared to present.
Volume,
Posture, and
Eye Contact
Volume is loud enough to
be heard by all audience
members throughout the
presentation. Student
stands up straight, looks
relaxed and confident.
Establishes eye contact
with everyone in the room
during the presentation.
Volume is loud enough to
be heard by most of the
audience members the
majority of the
presentation. Student
stands up straight and
establishes eye contact
most of the time with
everyone in the room
during the presentation.
Volume is inconsistent and
sometimes difficult to hear.
Sometimes stands up
straight and establishes
eye contact.
Volume often too soft to be
heard by all audience
members. Student
slouches and/or does not
look at people during the
presentation.
Subject
Knowledge &
Content
Student demonstrates full
knowledge (more than
required) by answering all
questions with
explanations and
elaboration. Student
provides personal
responses about what was
learned as a result of the
investigation. Shows a full
understanding of the topic.
Student is at ease;
provides expected answers
to all questions. When
prompted, student
elaborates or provides
personal insight to the
investigation. Shows a
good understanding of the
topic.
Student is somewhat at
ease, but has moments of
when s/he becomes
unsure; provides some
answers to questions.
Fails to elaborate or
provide personal insight to
the investigation. Shows a
basic understanding of
parts of the topic.
Student is uncomfortable
with providing information
and is unable to answer
fundamental questions.
Does not seem to
understand the topic very
well; Reads directly from
the project board to explain
the investigation.
Incorporation
of Graphs and
Data Table
Student makes appropriate
references to graphs and
data table when providing
answers to questions or
explaining investigation.
Student explains and
makes references to
graphs or data tables,
when prompted, to
answer questions or
explain investigation.
Little attempt to include
graphs or data tables when
answering questions or
explaining investigation.
No attempt to include
graphs or data tables when
answering questions or
explaining investigation.
Vocabulary
Uses vocabulary
appropriate for the
audience. Extends
audience vocabulary by
defining words that might
be new to most of the
audience.
Uses vocabulary
appropriate for the
audience. Includes 1-2
words that might be new to
most of the audience, but
does not define them.
Uses vocabulary
appropriate for the
audience. Does not include
any vocabulary that might
be new to the audience.
Uses several (5 or more)
words or phrases that are
not understood by the
audience.
Total Score: _______
divided by 5 = _______ (Final Grade)
GRADE
4- Advanced
3- Proficient
2- Basic
1- Below Basic

14
RESEARCH PAPER GRADING RUBRIC
Student Name _________________________
Category Advanced
4 points Proficient
3 points
Basic
2 points
Below Basic
1 point Score
Components
of Research
Report (For
additional
explanation,
please refer to
page 5)
1. Title Page
2. Table of
Contents
3. Introduction
4. Discussion/
Summary
(Abstract)
5. Conclusion
6. Bibliography
All required elements are
present (see left). Student
provides additional background
information on the topic being
investigated to enhance the
reader’s understanding.
Summary is a clear, thoughtful
overview of the investigation. It
includes the hypothesis,
methods and materials, results,
and the conclusions they led to.
Accurately represents
observations in
graphs/tables/charts. Data and
charts are neat, accurate. The
conclusion clearly states what
was learned as a result of the
investigation and whether results
support or do not support the
hypothesis. Identifies ways to
improve the investigation.
All required elements are
present (see left). Student
provides adequate
background information on
the topic being investigated.
Provides a basic summary of
the investigation. It includes
the hypothesis, methods and
materials, results, and the
conclusions they led to.
Represents some
observations in graphs/
tables/charts. The conclusion
somewhat states what was
learned as a result of the
investigation and whether
the hypothesis was
supported or not.
One or two required
elements are missing.
Attempts to provide an
overview or summary of
the investigation.
However, the hypothesis,
methods and materials,
results, and/or the
conclusions, are missing.
Graphs/tables/charts are
unclear. Incomplete
conclusion; unclear
whether the hypothesis
was supported or not.
Three or more required
elements are missing. No
summary of the experiment
provided. Graphs/tables/
charts are missing or are not
accurate. No conclusion
stating whether the
hypothesis was supported or
not.
Quality of
Information
Information clearly relates to the
main topic and experiment. It
includes a great deal of
supporting evidence or
examples.
Information clearly relates to
the main topic and
experiment. It provides 1-2
examples of supporting
evidence and/or examples.
Information clearly
relates to the main topic
or experiment; however
no evidence and/or
examples are given.
Information has little or
nothing to do with the main
topic or experiment.
Convention
Paragraph
Construction,
Organization, and
Mechanics
All paragraphs include
introductory sentence,
explanations or details, and
concluding sentence.
Information is very organized
with well-constructed paragraphs
and subheadings. No
grammatical, spelling, or
punctuation errors.
Most paragraphs include
introductory sentence,
explanations or details, and
concluding sentence.
Information is organized with
well-constructed paragraphs.
Almost no grammatical,
spelling, or punctuation
errors
Paragraphs included
related information but
were typically not
constructed well.
Information is organized,
but paragraphs are not
well-constructed. A few
grammatical, spelling, or
punctuation errors.
Paragraphing structure was
not clear and sentences
were not typically related
within the paragraphs.
The information appears to
be disorganized. Many
grammatical, spelling, or
punctuation errors.
Data & Charts
Observations are clearly written
with relevant details and all
major observations are
highlighted. Accurately
represents observations in
graphs/tables/charts. Data and
charts are neat, accurate and
enhance the reader's
understanding of the topic.
Observations are somewhat
clear with most details.
Highlights some major
observations. Represents
some observations in
graphs/ tables/charts. Data
and charts are neat and
accurate.
Summary is unclear with
many details missing.
Few highlights given for
major observations.
Graphs/tables/ charts are
unclear.
No highlights given for major
observations. Graphs/tables/
charts are missing or are not
accurate.
Sources
All sources (information and
graphics) are accurately
documented in MLA format.
All sources (information and
graphics) are accurately
documented, but a few are
not in MLA format.
All sources (information
and graphics) are
accurately documented,
but many are not in MLA
format.
Some sources are not
accurately documented.
Total Score: _______
divided by 5 = _______ (Final Grade)
GRADE 4- Advanced
3- Proficient
2- Basic
1- Below Basic