middle georgia state college complete college georgia … · middle georgia state college complete...
TRANSCRIPT

Middle Georgia State College (Macon State College and Middle Georgia College) Page 1 Rev. 8/22/12
MIDDLE GEORGIA STATE COLLEGE COMPLETE COLLEGE GEORGIA PLAN
History and Characteristics Effective January 8, 2013, Middle Georgia State College (MGSC) will be formed from the consolidation of two Level II COC-accredited colleges in the University System of Georgia, Macon State College (MSC) and Middle Georgia College (MGC). The mission of MGSC is to serve the educational needs of a diverse population through high quality programs connected to community needs in a global context and to serve as a leader for the intellectual, economic, and cultural life of the region. MGSC will be a Level II public 4-year college in the University System of Georgia with its main campus in Macon and satellite campuses in Cochran, Warner Robins, Dublin, and Eastman along with the Robins Residence Center at Robins Air Force Base in Warner Robins. The consolidated educational programs of MGSC will include a broad array of bachelor’s and associate’s degrees as well as certificate programs. The primary service area for the new institution will be the combined territories in the Central/Middle Georgia region that were previously served by MSC in Macon and MGC in Cochran which is about 50 miles southeast of the main campus. MGSC’s student body of approximately 10,000 students will be comprised of military personnel, early enrollment students, and traditional and non-traditional residential and commuter undergraduates from urban and rural environments. Admission to MCSC will follow the minimum standards established by the University System of Georgia and policies of the institution. Regular admission is based on students possessing a 2.0 academic core GPA and zero college preparatory deficiencies or a 2.2 GPA with college preparatory deficiencies, or passing GED scores.
Fall 2011 Student Profile
Gender # % Female 5,585 61.2% Male 3,541 38.8% Ethnicity # % White 5,212 57.1% Black 3,128 34.3%
Hispanic 289 3.2%
Asian/Pacific Islander 203 2.2% American Indian/Alaskan Native
24 0.3%
2 or more 201 2.2%
Unknown 69 0.8% Enrollment Status # % Full-Time 5,596 61.3% Part-Time 3,530 38.7% Residency # % Georgia 8,426 92.3% Out of State 545 6.0% Out of Country 155 1.7% Total Enrollment 9,126 100%
Source: MSC/MGC Offices of Institutional Research

Middle Georgia State College (Macon State College and Middle Georgia College) Page 2 Rev. 8/22/12
The early work at both colleges laid the foundation for the retention, progression, and graduation initiatives of the new institution. As part of this plan, we have included promising programs from both institutions that were started as early as 2010. In addition, we expanded and prioritized our efforts and strategically aligned personnel and financial resources with the mission of the new institution. In its first year of operation, the new institution will be engaged in building a strategic plan based on input from faculty, staff, students, and the surrounding communities. The MGSC Complete College Georgia Plan will be a critical component of this endeavor. As we go forward, we will monitor similar programs initiated at each institution and follow best practices as MGSC evolves.
Regional Economic Outlook MGSC serves 17 counties in central Georgia. The following major employers by counties were identified using the Georgia Department of Labor (2011) and area Chambers of Commerce.
County Major Employers
Bibb Medical Center of Central GA
GEICO Bibb County School District
City of Macon Coliseum Health Systems
Houston Robins Air Force Base
Houston County Schools and Govt.
Perdue Farms Frito-Lay Houston Medical Center
Bleckley Acuity Brands/ Lighting
Middle GA College
Bleckley County School District
Dodge Boys and Girls Club
Dodge County Hospital
GA Dept. of Corrections
Heart of GA Dynamics
Graphic Packaging Int.’l
Laurens Laurens County Schools, Gov.
VA Medical Center
Fairview Park Hospital
City of Dublin School District
YKK AP America
Monroe GA Dept. of Corrections
GA Power Company
Monroe County School System
Monroe County Hospital
Local Govt.
Jones Tri-County Electric
Reeves Construction
Ethica Health & Retirement
Jones County School System
Local Govt.
Crawford Dickey Farms Crawford County School District
Hammock-Wicks Timber
TT&E Enterprises (electricians)
Local Govt.
Peach Peach County School System
Blue Bird Fort Valley State University
Peach Medical Center
Local Govt.
Twiggs Twiggs County School System
Kamin Holding Co.
Epps Bros. (construction)
W& S Enterprises (Huddle House)
Local Govt.
Pulaski GA Dept. of Corrections
Pulaski County School System
Taylor Regional Hospital
Hollingsworth and Vose (engineered papers)
Local Govt.
Wilcox Wilcox County School System
GA Department of Corrections
Doster Warehouse
Upson Service Center
Local Govt.
Telfair Telfair County School System
GA Department of Corrections
Coca-Cola Bottling
North GA Detention Center
Local Govt.
Wheeler Wheeler County School System
Lower Oconee Community Hospital
North GA Detention Center
BP Timber Co Local Govt.
Middle Georgia State College (Macon State College and Middle Georgia College) Page 3 Rev. 8/22/12
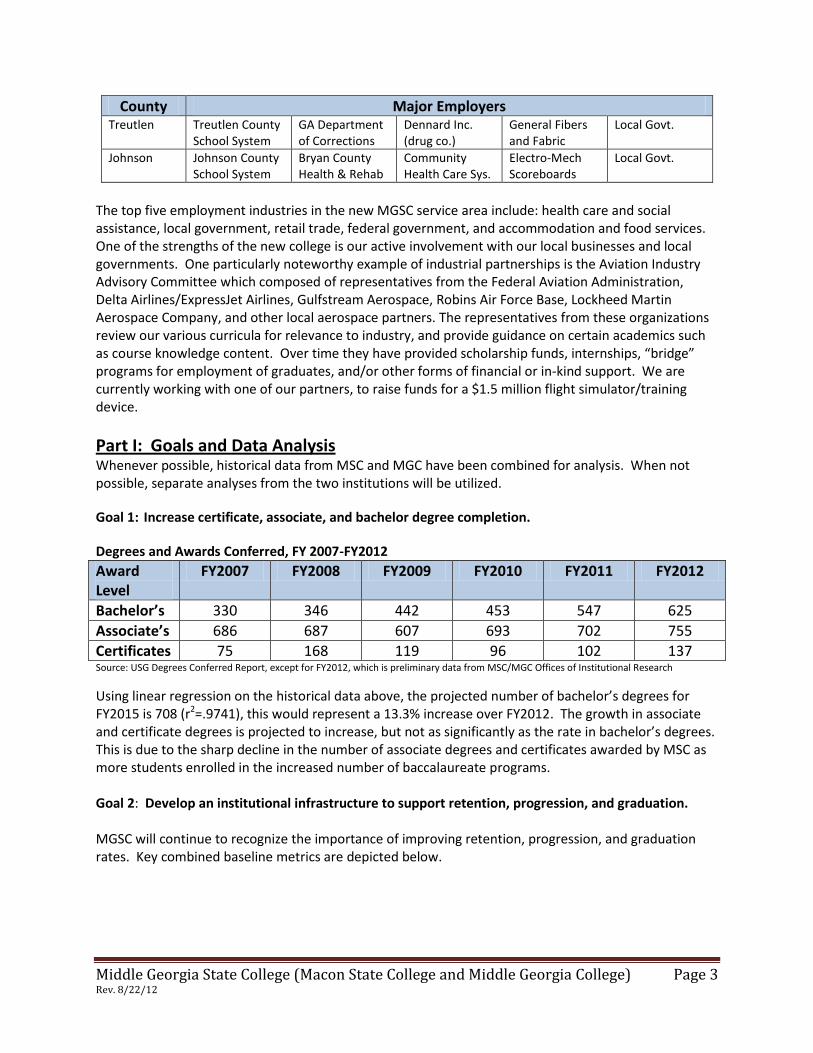
County Major Employers Treutlen Treutlen County
School System GA Department of Corrections
Dennard Inc. (drug co.)
General Fibers and Fabric
Local Govt.
Johnson Johnson County School System
Bryan County Health & Rehab
Community Health Care Sys.
Electro-Mech Scoreboards
Local Govt.
The top five employment industries in the new MGSC service area include: health care and social assistance, local government, retail trade, federal government, and accommodation and food services. One of the strengths of the new college is our active involvement with our local businesses and local governments. One particularly noteworthy example of industrial partnerships is the Aviation Industry Advisory Committee which composed of representatives from the Federal Aviation Administration, Delta Airlines/ExpressJet Airlines, Gulfstream Aerospace, Robins Air Force Base, Lockheed Martin Aerospace Company, and other local aerospace partners. The representatives from these organizations review our various curricula for relevance to industry, and provide guidance on certain academics such as course knowledge content. Over time they have provided scholarship funds, internships, “bridge” programs for employment of graduates, and/or other forms of financial or in-kind support. We are currently working with one of our partners, to raise funds for a $1.5 million flight simulator/training device.
Part I: Goals and Data Analysis Whenever possible, historical data from MSC and MGC have been combined for analysis. When not possible, separate analyses from the two institutions will be utilized.
Goal 1: Increase certificate, associate, and bachelor degree completion.
Degrees and Awards Conferred, FY 2007-FY2012
Award Level
FY2007 FY2008 FY2009 FY2010 FY2011 FY2012
Bachelor’s 330 346 442 453 547 625
Associate’s 686 687 607 693 702 755
Certificates 75 168 119 96 102 137 Source: USG Degrees Conferred Report, except for FY2012, which is preliminary data from MSC/MGC Offices of Institutional Research
Using linear regression on the historical data above, the projected number of bachelor’s degrees for FY2015 is 708 (r2=.9741), this would represent a 13.3% increase over FY2012. The growth in associate and certificate degrees is projected to increase, but not as significantly as the rate in bachelor’s degrees. This is due to the sharp decline in the number of associate degrees and certificates awarded by MSC as more students enrolled in the increased number of baccalaureate programs. Goal 2: Develop an institutional infrastructure to support retention, progression, and graduation. MGSC will continue to recognize the importance of improving retention, progression, and graduation rates. Key combined baseline metrics are depicted below.

Middle Georgia State College (Macon State College and Middle Georgia College) Page 4 Rev. 8/22/12
One-Year System-Wide Retention Rates
Cohort
Year Fall 2008 Fall 2009 Fall 2010 3-Year Average
Cohort Group # % # % # % 60.7% FTFTF All Degree
Types 1,220 62.9 1,162 58.0 1,089 61.4
Source: USG Retention Rate Reports
Three-Year Associate Degree System-Wide Graduation Rates
Cohort
Year Fall 2006 Fall 2007 Fall 2008
3-Year Average
Cohort Group # % # % # % 7.9%
FTFTF 133 8.1 119 7.1 143 8.4 Source: USG Graduation Rate Reports
Six-Year Bachelor’s Degree System-Wide Graduation Rates
Cohort
Year Fall 2003 Fall 2004 Fall 2005
3-Year Average
Cohort Group # % # % # % 25.7%
FTFTF 16 22.5 16 23.5 23 30.7 Source: USG Graduation Rate Reports
Combined course completion ratios can be found under Goal 4 and historical data regarding retention rates, graduation rates and course completion ratios are located in Appendices B and C (USG Metrics Working Group Recommended Metrics). Goal 3: Increase student success, especially for diverse learners and underrepresented groups (i.e., minorities, military, adult learners, low income, first generation, students with disabilities).
Number and Percent of Enrollment for Underrepresented Groups
Student Population Fall 2007 Fall 2008 Fall 2009 Fall 2010 Fall 2011
# % # % # % # % # %
Minorities 4,397
44.4 4,279
43.4 4,494
43.9 4,196
43.1 3,856
42.3
Adult Learners 4,513
45.5 4,314
43.7 4,472
43.7 4,314
44.3 4,171
45.7
Pell Eligible 4,447
44.9 4,423
44.8 5,091
49.8 5,218
53.6 4,989
54.7
Students w/Disabilities*
335 3.4 293 3.0 371 3.6 399 4.1 417 4.6
*Disability data is for the academic year. Source: MSC/MGC Offices of Institutional Research
Enrollment trends, course completion ratios, retention rates, and graduation rates will be collected for underrepresented groups as Blackboard Analytics is implemented across the new Banner system (“Banner C”) in March 2013 after the consolidation has been completed. Data on first generation and

Middle Georgia State College (Macon State College and Middle Georgia College) Page 5 Rev. 8/22/12
military students have not been available in the past but steps are being taken to identify these students in the future. Goal 4: Implement specific strategies that support student success throughout a college career.
Student success will be supported by new strategies, such as the use of professional advisors in the Mathematics Academic Resource Center (MARC), and will be measured by retention, course completion, progression, and graduation. Combined course completion ratios for all students and all courses are as follows:
Course Completion Ratio (Credit Hours Earned vs. Credit Hours Attempted), Fall 2009 – Fall 2011
Term Earned Hours Attempted Hours
Ratio 3-year average
Fall 2011 73,270 97,402 75.2% 73.8%
Fall 2010 77,041 103,011 74.8%
Fall 2009 76,620 107,033 71.6% Source: MSC/MGC Offices of Institutional Research
Campus Strengths, Areas for Improvement, and Key Gaps
1. Campus strengths:
17 professional baccalaureate degrees strategically aligned to the Middle Georgia region
Aviation, Business, Education, GAMES, IT, and Nursing programs
Student Success Center and programs for at-risk students like the Early Alert system and African-American Male Initiative (AAMI)
Strong administrative and faculty commitment to retention, progression, and graduation
An effective, stable, sustainable, and robust data system (i.e., Blackboard Analytics)
2. Areas for improvement:
Ensuring that all units work together for student success and that more students succeed in completing a certificate or degree program
Developing community partners to maintain connections to the region
Creating faculty and staff development opportunities and providing resources to assist faculty in understanding and using data analytics to improve programs, implementing new classroom pedagogies, implementing early assessments and early warning systems, and making referrals to professional advisors and career counseling
3. Key gaps: Accuracy of data in Banner Tracking changes in majors Use of metrics across all units of the college for decision making and planning new
strategies for improving recruitment, admissions, testing, financial aid, orientation, advising, and retention

Middle Georgia State College (Macon State College and Middle Georgia College) Page 6 Rev. 8/22/12
Information Needs
Graduate employment data
Military and first generation student data
Transfer rates within and outside the USG, broken down by age, race, ethnicity, gender, socio-economic status, and veteran status
It is difficult at this time to anticipate all of the future information needs of Middle Georgia State College. The resources at Macon State College (SLPM and Blackboard Analytics) will support the new institution at no additional costs. However, integration of data collection will not happen until the new Banner C is implemented in March 2013. Some funding for personnel is needed to produce data reports.
Part II: Strategies and Objectives Strategy 1: Partnerships with K-12
Objective 1: Increase Dual Enrollment Student Population
Description of Initiative: Dual enrollment/dual credit programs in Georgia are available for eligible 11th
and 12
th grade students on a part-time or full-time basis.
Target Group: High School Students
Alignment to CCGA Increase numbers and access
Increase efficiencies
Initiatives 1.1 Reallocate personnel in Enrollment Management to lead dual enrollment efforts
1.2 Develop and implement academic planning for all dual enrollment students 1.3 Develop a detailed plan of action to increase the enrollment and retention of
dual enrollment students
Key Performance Indicators/Metrics (KPIs)
Number of dual enrollment students in the general education core
Course success rates of dual enrolled students
Number of dual enrolled students who obtain any certificate or degree from any institution
Successful transition of economically disadvantaged dual enrolled students into full-time degree-seeking students
Baseline Data & Projection
Fall Enrollment of Dual Enrolled Students
2007 179
2008 165
2009 154
2010 220
2011 209
Using linear regression based on this historical data, the projected number of dual enrolled students is 254 (r
2=.4136) for Fall 2015. This represents a 21.5% increase
over Fall 2011.
Planning and Implementation
We have a variety of outreach initiatives involving K-12 and these will increase as the new institution evolves. The Coordinator of Enrollment Support and Retention will be housed at the Warner Robins campus and will serve all campuses of Middle Georgia State College.
Ongoing Feedback/Evaluation
This set of strategies and accountability metrics will be the responsibility of the Vice President of Enrollment Management and the Dean of Admissions. They will create a strategic plan and present it to the President’s Cabinet for review and approval. An end of semester report, including metrics, targets (utilizing Blackboard Analytics and other data analytics), and additional resource needs/budget implications, will be presented at a bi-annual meeting of the CCGA planning team and the President’s Cabinet.

Middle Georgia State College (Macon State College and Middle Georgia College) Page 7 Rev. 8/22/12
Objective 2: Expand high quality GAMES program
Description of Initiative: Georgia Academy of Aviation, Mathematics, Engineering, and Sciences (GAMES) is a dual enrollment, residential program for high school students. Students in this program complete the requirements of their high school diploma and an Associate’s degree program at the college simultaneously. Target Group: High achieving high school students who
have a minimum cumulative GPA of 3.5 on a 4.0 scale in academic core courses and are on an accelerated College Preparatory Curriculum
have a SAT math/critical reading aggregate score of 1100 with a minimum math score of 560 and minimum critical reading score of 530 or have an ACT score of 24 including a minimum math score of 24 and a minimum English score of 23
Alignment to CCGA Increase numbers and access
Increase efficiencies
Initiatives
2.1 Strengthen GAMES recruitment strategies 2.2 Improve social support structure for GAMES students 2.3 Provide additional academic opportunities like undergraduate research
projects, seminars, field trips, science club activities, etc. 2.4 Expand community project involvement to include service learning,
volunteerism, community-based learning for GAMES students 2.5 Increase need-based funding 2.6 Increase participation of under-represented populations
KPIs Number of students enrolled in the GAMES program
Number of GAMES students who earn associate degrees
Number of GAMES students retained in USG and in other institutions of higher education
Number of GAMES students who graduate with an associate’s degree in 2 or 3 years and a bachelor’s degree in 4, 5 and 6 years
Baseline Data
Fall Enrollment of GAMES Students
2007 90
2008 68
2009 75
2010 69
2011 62
2012 77
Institution-specific retention rates for GAMES students can be found in Appendix A.
Planning and Implementation
Enhance recruitment efforts at the high schools by participating in college fairs, providing information on the college through brochures and flyers, sending emails and links to the website to potential students. Expand the number of high schools visited by the recruiters. Strengthen the GAMES program by adding additional experiences and opportunities for students.
Ongoing Feedback/Evaluation
The GAMES Director, GAMES Advisor, Dean of Science and Math, Dean of Admissions, the VPSA and the VPAA will study data drawn from Blackboard Analytics to define and evaluate the initiatives planned for the program in the future.
Objective 3: Increase access to high school students
Description of Initiative: Encourage high school students to apply to the college through increased recruitment efforts. Target Group: High school students
Alignment to CCGA Increase numbers
Increase quality
Initiatives
3.1 Offer the COMPASS exam in high schools 3.2 Participate in Apply to College Month 3.3 Host summer camps for elementary, middle, and high school students 3.4 Participate in “Partners in Excellence” program in elementary schools
KPIs
Offer the COMPASS exam in two additional high schools every year
Participate in Apply to College Month every year
Middle Georgia State College (Macon State College and Middle Georgia College) Page 8 Rev. 8/22/12
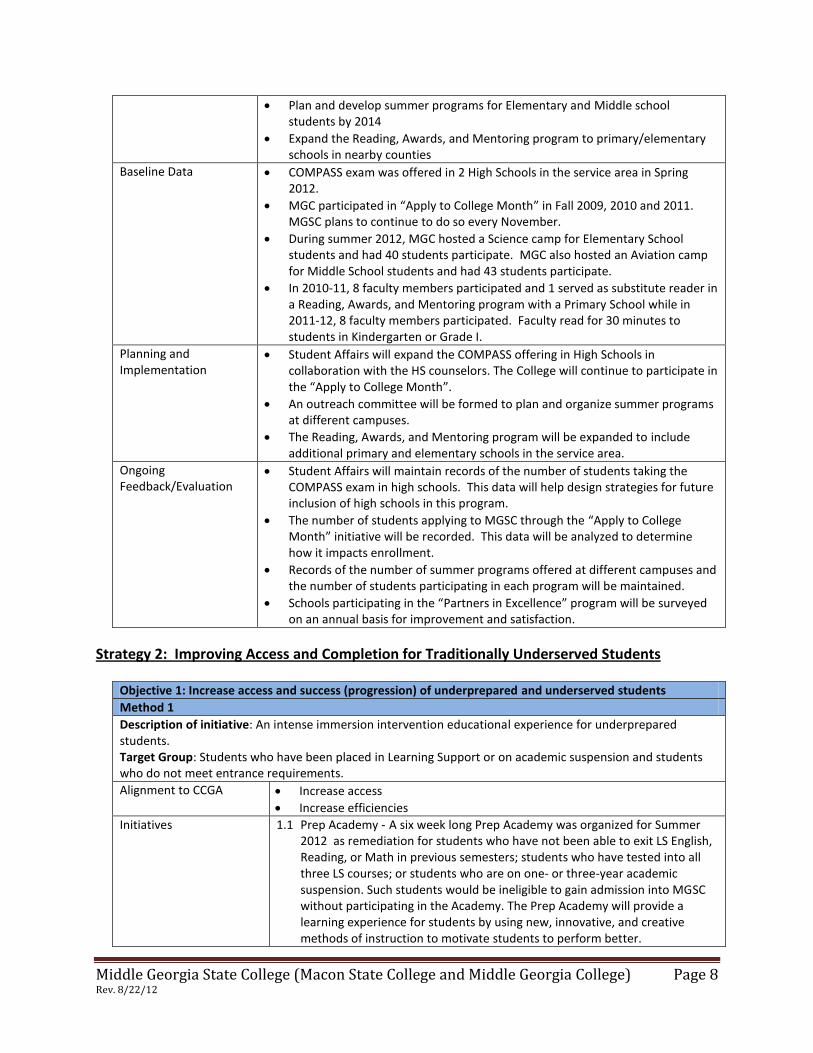
Plan and develop summer programs for Elementary and Middle school students by 2014
Expand the Reading, Awards, and Mentoring program to primary/elementary schools in nearby counties
Baseline Data
COMPASS exam was offered in 2 High Schools in the service area in Spring 2012.
MGC participated in “Apply to College Month” in Fall 2009, 2010 and 2011. MGSC plans to continue to do so every November.
During summer 2012, MGC hosted a Science camp for Elementary School students and had 40 students participate. MGC also hosted an Aviation camp for Middle School students and had 43 students participate.
In 2010-11, 8 faculty members participated and 1 served as substitute reader in a Reading, Awards, and Mentoring program with a Primary School while in 2011-12, 8 faculty members participated. Faculty read for 30 minutes to students in Kindergarten or Grade I.
Planning and Implementation
Student Affairs will expand the COMPASS offering in High Schools in collaboration with the HS counselors. The College will continue to participate in the “Apply to College Month”.
An outreach committee will be formed to plan and organize summer programs at different campuses.
The Reading, Awards, and Mentoring program will be expanded to include additional primary and elementary schools in the service area.
Ongoing Feedback/Evaluation
Student Affairs will maintain records of the number of students taking the COMPASS exam in high schools. This data will help design strategies for future inclusion of high schools in this program.
The number of students applying to MGSC through the “Apply to College Month” initiative will be recorded. This data will be analyzed to determine how it impacts enrollment.
Records of the number of summer programs offered at different campuses and the number of students participating in each program will be maintained.
Schools participating in the “Partners in Excellence” program will be surveyed on an annual basis for improvement and satisfaction.
Strategy 2: Improving Access and Completion for Traditionally Underserved Students
Objective 1: Increase access and success (progression) of underprepared and underserved students
Method 1
Description of initiative: An intense immersion intervention educational experience for underprepared students. Target Group: Students who have been placed in Learning Support or on academic suspension and students who do not meet entrance requirements.
Alignment to CCGA Increase access
Increase efficiencies
Initiatives 1.1 Prep Academy - A six week long Prep Academy was organized for Summer 2012 as remediation for students who have not been able to exit LS English, Reading, or Math in previous semesters; students who have tested into all three LS courses; or students who are on one- or three-year academic suspension. Such students would be ineligible to gain admission into MGSC without participating in the Academy. The Prep Academy will provide a learning experience for students by using new, innovative, and creative methods of instruction to motivate students to perform better.

Middle Georgia State College (Macon State College and Middle Georgia College) Page 9 Rev. 8/22/12
1.2 Redesign courses with low success rates (e.g., LS Math and Math curriculum review).
1.3 Emphasize retention, progression, and graduation as a campus-wide initiative by including it in the promotion and tenure review.
1.4 Increase need-based scholarships. 1.5 Align degrees so students can transition smoothly from a certificate to an
associate to a baccalaureate degree program at this institution or to another institution.
1.6 Developmental advising.
KPIs Exit learning support (COMPASS Test)
Success in entry-level college courses
Alternate educational pathways with the TCSG or other career fields for students with extended academic challenges.
Baseline Data Summer 2012 - 43 students participating in the Prep Academy 24 out of 32 (75%) students passed LS Math 7 out of 17 (44%) students passed LS Reading 12 out of 15 (80%) students passed LS English 2 students in all 3 LS classes exited
Planning and Implementation
The Prep Academy committee will be expanded to include different stakeholders to work out the implementation of the program. There will be a frequent review of the curriculum based on student performance. The scholarship committee will be expanded.
Ongoing Feedback/Evaluation
Each student’s performance at the end of the Academy will be evaluated and placement into collegiate courses in the Fall semester will be tracked. Student success in collegiate courses will be monitored and retention and graduation rates for this group will be analyzed.
Method 2
Description of Initiative: Decentralized advising with professional advisors in each academic school. Replace semester to semester student planning with long-term academic planning, with a view towards graduation. Target Group: Part-time and full-time freshman and sophomore students
Alignment to CCGA Increased efficiencies
Increased quality
Initiatives 1.1 Improve the advising process using Degree Works 1.2 Track student success with Blackboard Analytics
KPIs
Retention
Hours to degree for Bachelor’s
Hours to degree for Associate’s
Hours to degree for Certificates
Award/degree attainment at Certificate, Associate and Bachelor levels
Baseline Data
Baseline data for the intentional advising intervention will be the exit profile of first time full time students and transfers for academic years 2010-2011 and 2011-2012. This intervention will be evaluated using the same data fields and a follow-up survey of students who leave MGSC.
Planning and Implementation
In 2011-2012, Academic Deans were given the autonomy to design an advising model that was in the best interest of their students. Professional Advisors previously assigned to a centralized academic advising center were reassigned to each school. There are five distinct academic advising models presently in operation. Concurrent with this change in administrative structure is a shift in advising practices. Academic advising will no longer function as a registration service but will instead serve as a teaching and learning experience that spans the student's academic career. Implementation of the advising software program Degree Works is planned for 2013. To ensure consistency in following Board of

Middle Georgia State College (Macon State College and Middle Georgia College) Page 10 Rev. 8/22/12
Regents and MGSC policies and procedures across the advising models, Professional Advisors meet regularly to discuss common concerns and to create common documents (e.g., an advising syllabi). A shared web portal is being created for archiving and sharing their individual work. To date, this has been through email listserv. Professional development activities have been scheduled by the Vice President for Student Success, Office of the Provost, on recurring themes for the 2012-2013 AY.
Ongoing Feedback/Evaluation
The Assistant VP of Student Success (Office of the Provost), the Academic Deans, and the Office of IR work in concert to review and evaluate the professional advising model using data analytics, feedback from the professional advisors, and evaluations by students to make needed changes. An end of semester report, including metrics, targets (utilizing Blackboard Analytics and other data analytics), and additional resource needs/budget implications, will be presented at a bi-annual meeting of the CCGA planning team and the President’s Cabinet.
Method 3
Description of Initiative: Implement student success initiatives to promote retention and graduation Target Group: Minorities, first generation students, students with disabilities, low income students, adult and military students
Alignment to CCGA Increased efficiencies
Increased numbers
Improve quality
Initiatives 1.1 Cohort approach 1.2 Early Alert Warning System 1.3 Supplemental Instruction 1.4 African-American Male Initiative (AAMI) 1.5 Developmental Advising 1.6 Learning Communities 1.7 Mentoring 1.8 Tutoring 1.9 Career Planning
KPIs Retention rates
Certificate and degree attainment
Exit rates for LS students
Core course success rates
Baseline Data The AAMI organized 33 events/meetings with a total attendance of over 530 students during AY12. These included sessions on such topics as study skills, Georgia Career Information Systems, stress management, race and healthy relationships, financial seminars, and dining etiquette. Refer to Appendix A for baseline data and Appendix B for historical data.
Planning and Implementation
Student success initiatives will be strengthened by involving representatives from all disciplines and other non-academic areas. A director will be hired to supervise Supplemental Instruction. More funds will be acquired for AAMI, and the program will be modified to include female minority students. Student use of tutoring facilities will be monitored via “Tutor Track.” A peer mentoring system will be established.
Ongoing Feedback/Evaluation
The VPAA, the VPSA, the Academic Deans, and the Office of IR work in concert to review and evaluate the student success data using data analytics, feedback from the professional advisors, and evaluations by students to make needed changes. An end of semester report, including metrics, targets (utilizing Blackboard Analytics and qualitative analysis), and additional resource needs/budget implications, will be presented at a bi-annual meeting of the CCGA planning team and the President’s

Middle Georgia State College (Macon State College and Middle Georgia College) Page 11 Rev. 8/22/12
Cabinet.
Objective 2: Increase access and success (progression) of adult learners
Description of Initiative: Expand the Center for Adult Learners (CAL) - The mission of CAL is to support degree completion and career advancement of adults. The center’s goals are to promote more successful transitions to college and to increase graduation rates. CAL will centralize resources adult students need to make a seamless transition to a postsecondary degree. Adult learners will be assisted through E.A.S.E. (Enhanced Advising in a Supportive Environment), making educational opportunities more easily accessible. Target Group: Part-time adult learners in the education program (pilot)
Alignment to CCGA Increase access/numbers
Increase efficiencies
Initiative 2.1 Seek System funding 2.2 Create infrastructure
KPIs % of PT adult learners retained one year
% of PT Pell adult learners retained one year
% of part time students achieving bachelor degrees in 4,5,6, and 8 years Baseline Data TBD – will establish baseline in Fall 2012
Planning and Implementation
This proposal was presented to and approved by the Provost’s Office in June 2012. The pilot program will be implemented with the new part-time working adult cohort seeking a bachelor degree in ECE/SPED. This cohort will begin Fall, 2012.
Ongoing Feedback/Evaluation
The School of Education will develop an ongoing feedback/evaluation process with the support of the Office of Institutional Research. An end of semester report, including metrics, targets (utilizing Blackboard Analytics and other data analytics), and additional resource needs/budget implications, will be presented at a bi-annual meeting of the CCGA planning team and the President’s Cabinet.
Strategy 3: Shorten Time to Degree
Objective 1: Increase opportunities for USG and TCSG students to transfer seamlessly into MGSC.
Description of Initiative: Articulation agreements between MGSC and TCSG, for example, the School of Information Technology has partnered with 6 Technical Colleges, 3 USG state colleges, and an international program in Serbia are in effect. Target Group: Working adults, military students, technical college graduates, international students
Alignment to CCGA Increase efficiencies
Increase quality
Initiatives 1.1 Dedicate a recruiter to establish a bridge to MGSC for TCSG students 1.2 Develop a marketing strategy 1.3 Increase opportunities for seamless transfer of students into other MGSC
degree programs
KPIs Number of transfer students from target articulation institutions
Number of hours to degree
Bachelor degree attainment
Baseline Data Transfer students enrolled since articulations n= 19 Current transfer students eligible to take advantage of this n=50
Planning and Implementation
The Vice President for Enrollment Management and Student Affairs is reallocating one of the full time recruiters to focus on our technical school partners in Fall 2012. A faculty advisor works closely with technical school students who articulate to MGSC in order to facilitate their acclimation to the campus and progression through the curriculum.
Ongoing Feedback/Evaluation
Each School is responsible for annual program evaluation which includes the use of data analytics, course evaluations, and feedback from the professional community advisory board. An end of semester report, including metrics, targets (utilizing

Middle Georgia State College (Macon State College and Middle Georgia College) Page 12 Rev. 8/22/12
Blackboard Analytics and other data analytics), and additional resource needs/budget implications, will be presented at a bi-annual meeting of the CCGA planning team and the President’s Cabinet.
Objective 2: Increase opportunities for students to use Prior Learning Assessments (PLA) and alternative course examinations (AP, CLEP, DANTES)
Method 1
Description of Initiative: To use nationally recognized assessments to support students who come to college with extensive work experience/knowledge. Target Group: Working Adults, Military Students, Underrepresented, low income students
Alignment to CCGA Increase access and numbers
Increase efficiencies
Initiatives 2.1 Establish baseline data 2.2 Maintain membership in the Adult Learning Consortium (ALC) 2.3 Develop an awareness campaign to market PLA, AP, CLEP, and DANTES
KPIs College certificate and degree attainment of the target group
Hours to completion
Baseline Data None – initial stage of development
Planning and Implementation
Macon State College was awarded the Georgia’s College Access Challenge Grant (CACG) in January 2012. The School of Information Technology (SOIT) is spearheading this initiative. The faculty in the SOIT and the faculty senate approved the PLA course in Spring 2012. Faculty will be trained to assess PLA portfolios in 2012-2013. In addition, our testing center is recognized as an approved DANTES testing site.
Ongoing Feedback/Evaluation
The School of Information Technology, Enrollment Services, and the Office of the Provost will establish a work plan for the 2012-13 year and concentrate efforts on outreach and enrollment of students who can take advantage of PLA as well as other alternatives (CLEP, DANTES, AP credit). An end of semester report, including metrics, targets (utilizing Blackboard Analytics and other data analytics), and additional resource needs/budget implications, will be presented at a bi-annual meeting of the CCGA planning team and the President’s Cabinet.
Method 2
Description of Initiative: 1. Implement Student Success initiatives. 2. Increase the online offerings. 3. Continue to offer credit for AP/IB/CLEP courses. 4. PLA credit
Target Group: Working adults, military students, underrepresented, low income students, first generation students
Alignment to CCGA Increase efficiencies
Increase numbers
Increase quality
Initiatives 3.1 Developmental advising, tutoring, mentoring and workshops 3.2 Use of Degree works 3.3 Additional online courses and degree programs
KPIs Number of students using services provided by the Student Success Center
Number of courses and degrees offered online and via IP teleconferencing
Use of GA TRACS and Degree Works
Retention rates of target group
Credit hours to degree completion for target group
Graduation rates for target group
Baseline Data Baseline retention rate, graduation rate, and credit hours to completion data can

Middle Georgia State College (Macon State College and Middle Georgia College) Page 13 Rev. 8/22/12
be found in Appendices B and C. Other baseline data to be determined.
Planning and Implementation
Establish a Student Progress Committee to study data derived from these initiatives. Use Tutor Tracks to record student use of tutoring facilities. Put procedures and metrics in place to grant credit by using PLA. Strengthen the online degree and course development initiative. Migrate to Desire to Learn by 2012-13 academic year. Provide frequent faculty professional development workshops for these initiatives.
Ongoing Feedback/Evaluation
Data will be collected each semester and evaluated by the Student Progress Committee to make modifications in the programs as needed. Blackboard Analytics and Degree Works will be used to collect data. We will continue credit granting opportunities, which will continue to be assessed.
Strategy 4: Restructuring Instructional Delivery
Objective 1: To increase and improve quality of alternative delivery modes of instruction
Description of Initiative: Provide opportunities to employed adults in the fields of education and nursing to further their education attainment. Target Group: Employed adults in the fields of education and nursing
Alignment to CCGA Increase access and numbers
Increase efficiencies
Initiatives 1.1 Establish baseline data 1.2 Implement R.N. to B.S.N. Online Program 1.3 Implement hybrid, part-time education program (flipped classrooms) 1.4 Recruit students
KPIs Number of enrolled students
Retention
Graduation
Baseline Data None – initial stage of development
Planning and Implementation
Currently in the planning phase with each program starting in Fall 2012. Both programs will provide an avenue for working adults to complete a Bachelor’s degree. Macon State College received special initiative funding to grow the nursing faculty in order to develop and expand the nursing cohorts.
Ongoing Feedback/Evaluation
The Schools of Education and Nursing will completing an end of semester report, including metrics, targets (utilizing Blackboard Analytics and other data analytics), and additional resource needs/budget implications, to be presented at a bi-annual meeting of the CCGA planning team and the President’s Cabinet.
Objective 2: Improve core curriculum pedagogy
Method 1
Description of Initiative: Prior to consolidation, MSC has been engaged in core redesign in Math 1101 and Math 1111 due to the high D, W, F rates. This year, MSC received approximately $400,000 in special initiative funding for new faculty lines in order to develop a “Core Teaching Faculty Fellows” program. Target Group: Freshmen and Sophomore students (all subgroups)
Alignment to CCGA Increase efficiencies
Initiatives 2.1 Core instructional redesign 2.2 Implement “Core Teaching Faculty Fellows” program
KPIs
Success rates in Math 1101* (A, B, C)
Success rates in Math 1111* (A, B, C)
Withdrawal rates and success rates by subgroups.
Baseline Data
Prior to Implementation - success rates
FY2009 FY2010 FY2011 FY2012
MATH 1101 55.0% 61.2% 68.0% 69.2%
Middle Georgia State College (Macon State College and Middle Georgia College) Page 14 Rev. 8/22/12
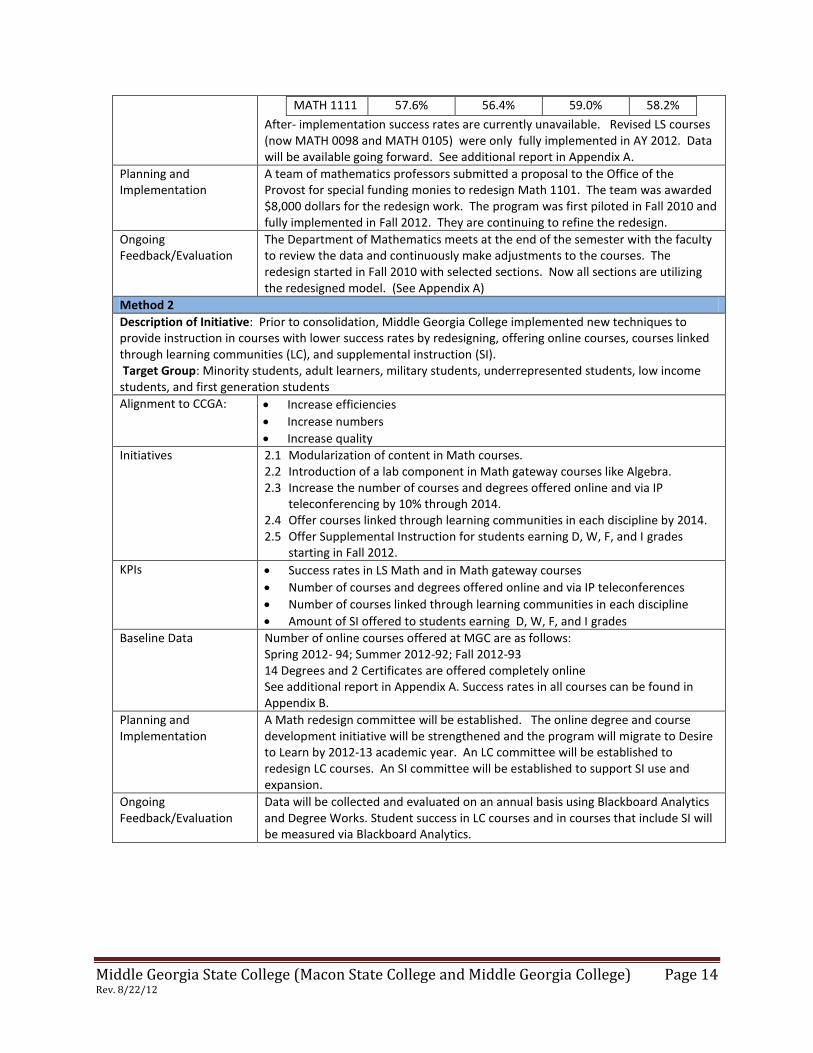
MATH 1111 57.6% 56.4% 59.0% 58.2%
After- implementation success rates are currently unavailable. Revised LS courses (now MATH 0098 and MATH 0105) were only fully implemented in AY 2012. Data will be available going forward. See additional report in Appendix A.
Planning and Implementation
A team of mathematics professors submitted a proposal to the Office of the Provost for special funding monies to redesign Math 1101. The team was awarded $8,000 dollars for the redesign work. The program was first piloted in Fall 2010 and fully implemented in Fall 2012. They are continuing to refine the redesign.
Ongoing Feedback/Evaluation
The Department of Mathematics meets at the end of the semester with the faculty to review the data and continuously make adjustments to the courses. The redesign started in Fall 2010 with selected sections. Now all sections are utilizing the redesigned model. (See Appendix A)
Method 2
Description of Initiative: Prior to consolidation, Middle Georgia College implemented new techniques to provide instruction in courses with lower success rates by redesigning, offering online courses, courses linked through learning communities (LC), and supplemental instruction (SI). Target Group: Minority students, adult learners, military students, underrepresented students, low income students, and first generation students
Alignment to CCGA: Increase efficiencies
Increase numbers
Increase quality
Initiatives 2.1 Modularization of content in Math courses. 2.2 Introduction of a lab component in Math gateway courses like Algebra. 2.3 Increase the number of courses and degrees offered online and via IP
teleconferencing by 10% through 2014. 2.4 Offer courses linked through learning communities in each discipline by 2014. 2.5 Offer Supplemental Instruction for students earning D, W, F, and I grades
starting in Fall 2012.
KPIs Success rates in LS Math and in Math gateway courses
Number of courses and degrees offered online and via IP teleconferences
Number of courses linked through learning communities in each discipline
Amount of SI offered to students earning D, W, F, and I grades
Baseline Data Number of online courses offered at MGC are as follows: Spring 2012- 94; Summer 2012-92; Fall 2012-93 14 Degrees and 2 Certificates are offered completely online See additional report in Appendix A. Success rates in all courses can be found in Appendix B.
Planning and Implementation
A Math redesign committee will be established. The online degree and course development initiative will be strengthened and the program will migrate to Desire to Learn by 2012-13 academic year. An LC committee will be established to redesign LC courses. An SI committee will be established to support SI use and expansion.
Ongoing Feedback/Evaluation
Data will be collected and evaluated on an annual basis using Blackboard Analytics and Degree Works. Student success in LC courses and in courses that include SI will be measured via Blackboard Analytics.

Middle Georgia State College (Macon State College and Middle Georgia College) Page 15 Rev. 8/22/12
Strategy 5: Transforming Remediation
Objective 1: Increase student success rates in Learning Support courses.
Method 1
Description of Initiative: Prior to consolidation, Middle Georgia College decentralized Learning Support (LS), implemented new techniques to provide instruction in LS courses, launched the Prep Academy to improve preparation of underprepared students, began providing Supplemental Instruction, and expanded student success initiatives. Target Group: Students in remedial courses.
Alignment to CCGA Increase efficiencies
Increase numbers
Increase quality
Initiatives 1.1 Redesign math, English and reading learning support (LS) courses by 2014 1.2 Offer Prep Academy every summer 1.3 Expand student success initiatives at each campus to include advising,
mentoring, workshops, and tutoring 1.4 Offer Supplemental Instruction for students earning D, W, F, and I grades
starting in Fall 2012.
KPIs Student success rates in passing LS courses/COMPASS exam
Enrollment in student success programs
Amount of SI offered for students earning D, W, F, and I grades
Prep Academy data
Baseline Data Summer 2012 - 43 students participating in the Prep Academy 24 out of 32 (75%) students passed LS Math 7 out of 17 (44%) students passed LS Reading 12 out of 15 (80%) students passed LS English 2 students in all 3 LS classes exited Initial LS Math redesign data and LS cohort retention rates can be found in Appendix A. Additional baseline data will be established as programs are implemented.
Planning and Implementation
An LS committee will be set up to redesign courses. The campus-wide Prep Academy committee will be expanded to include representatives from different academic areas and campuses. A Student Success Center will be established at each campus. SI use and expansion will be supported.
Ongoing Feedback/Evaluation
Data will be evaluated on an annual basis using Blackboard Analytics. Academic success patterns for Prep Academy students in collegiate courses will be studied. Student success in courses that include SI will be analyzed. Data will be evaluated on an annual basis using Blackboard Analytics.
Method 2
Description of Initiative: Redesign of learning support (see Appendix A). In the two years prior to consolidation, Macon State College has undergone an extensive redesign of Learning Support, moving from a centralized division of learning support to a decentralized model for learning support. We continue to evaluate and improve the program. Target Group: Underprepared students with 1 or 2 learning support requirements
Alignment to CCGA Increase efficiencies
Initiatives 2.1 LS Faculty realigned with the academic units (English, Math) 2.2 Co-teams (LS faculty and content faculty) redesigned the courses to strengthen
the content and to align with the academic core content class immediately following exit of learning support.
2.3 New LS courses in English, Math, Reading

Middle Georgia State College (Macon State College and Middle Georgia College) Page 16 Rev. 8/22/12
KPIs Success rates in LS courses by subgroups
Compass pass rates (exit)
Success rates in core content course (English 1101, Math 1101 or Math 1111) Baseline Data
LS Course Success Rates Before and After Redesign
COURSE Fall 2009 Fall 2010 Fall 2011
ENGL 99 47.2% 48.2% ENGL 99A 79.8% ENGL 99B 75.6%
READ 99 45.1% 51.2% READ 99A 79.8% READ 99B 75.6%
MATH 97 MATH 99
59.6% 51.4%
57.0% 60.1%
MATH 98 42.0% MATH 105 59.4%
Planning and Implementation
Planning took place in 2010-2011 and changes were implemented for the first time in Fall 2011.
Ongoing Feedback/Evaluation
The Department of Mathematics and the Department of English review success rates, withdrawal rates and unsuccessful rates at the end of each semester. Each department makes adjustments as needed.
Part III: Planning and Implementation
The process for planning and implementation is included in the above section for each strategy. Where MSC and MGC have the same objectives with different methods (such as redesign of Learning Support programs), best practices will be followed as we go forward as Middle Georgia State College.
Part IV: Ongoing Feedback/Evaluation The MGSC Complete College Georgia Team is tasked with monitoring the effectiveness of CCG initiatives, sharing program information with the college community, and providing leadership in continuous quality improvement. Members of the MGSC CCGA Team are as follows:
Team Member Title Institution Dr. John Black Interim President MSC Dr. Michael Stoy President MGC Dr. Martha Venn Provost and VPAA MSC Dr. Mary Lou Frank Interim VPAA MGC Dr. Deepa Arora Interim AVPAA MGC Dr. Mary Wearn Provost’s Leadership Fellow MSC Dr. Alex Koohang Dean, School of Information Technology MSC Dr. Stephen Svonavec Director, Dublin Campus MGC Dr. Jeff Stewart Interim VP SA and EM MSC Ms. Jennifer Brannon Interim VP of Student and Public Affairs MGC Dr. John Trimboli Institutional Research Fellow and Associate
Professor of Mathematics MSC
Ms. Michele Swafford Director of Institutional Research MGC Working closely with the Office of Institutional Research, the Complete College Georgia Team will collect and evaluate program data and provide a yearly assessment report to all key constituents across the college. After careful review of internal program data, data from peer institutions, and key constituency

Middle Georgia State College (Macon State College and Middle Georgia College) Page 17 Rev. 8/22/12
feedback, the CCG team will recommend appropriate program modifications, establishing new measures of success as needed. In order to assure timely and transparent dissemination of program data across the college and to promote the Complete College Georgia mission, the CCG Team will partner with the MGSC Office of Communication. The Office of Communication will advertise CCG initiatives and provide updates through media channels such as campus email, websites, and newsletters, and community sources. More specific feedback and evaluation processes are articulated for each strategy in the “Strategies and Objectives” section of this report.
Middle Georgia State College (Macon State College and Middle Georgia College) Page 18 Rev. 8/22/12
APPENDIX A
Supporting Documentation from
Strategies and Objectives

Middle Georgia State College (Macon State College and Middle Georgia College) Page 19 Rev. 8/22/12
Strategy 1: Partnerships with K-12 Objective 2: Expand high quality GAMES program
MGC Institution-Specific Retention Rates: GAMES Students vs. FTFTF All Degree Types
Semester FTFTF Fall to
Spring Retention GAMES Fall to
Spring Retention FTFTF Fall to Fall
Retention GAMES Fall to Fall Retention
Fall 2006 88.86% 95.83% 60.31% 79.17%
Fall 2007 86.22% 78.85% 56.96% 53.85%
Fall 2008 83.09% 90.24% 53.45% 78.05%
Fall 2009 85.20% 95.45% 53.14% 84.09%
Fall 2010 87.63% 92.75% 60.02% 75.36% Sources: USG Office of Research and Policy Analysis Retention Rate Report/MGC Office of Institutional Research Banner Reports
Strategy 2: Improving Access and Completion for Traditionally Underserved Students Objective 1: Increase Access and Success (progression) of Underprepared and Underserved Students Method 3 Student Success Initiatives:
a) Mentoring: During Fall 2011, 18 mentors from the Student Success Center (SSC) were assigned a total of 85 students who were Learning Support cohort and GPA presidential exception students. Mentors were able to successfully contact and mentor 32 of these students with each student receiving from one to seven mentoring sessions for a total of 97 mentoring sessions for the term. Mentees also participated in two campus events. In Spring 2012, neither Learning Support cohort students nor GPA presidential exception students were required to meet with mentors. An invitation was sent via email to get students interested in selecting a mentor. This resulted in 11 mentors meeting with 19 students for a total of 42 mentoring sessions for the term. Mentees participated in four community service events and two campus events. Assigning mentors to at-risk students and having the mentor initiate contact results in more students getting the help they need to succeed. We plan to continue this model in Fall 2013.
b) Student Success Advising: 92 students across all at-risk categories (LS or Presidential Exception Cohorts, Early Alert, Academic Appeal) were seen by the SSC in Fall 2011 for a total of 446 advising sessions.
c) Career Planning: In Spring 2012, the SSC emailed all freshmen to invite them to mandatory career planning sessions. 241 students responded for a total of 645 career planning sessions being held.
d) Tutoring: The SSC provided almost 456 hours of tutoring to students in Spring 2012.

Middle Georgia State College (Macon State College and Middle Georgia College) Page 20 Rev. 8/22/12
Strategy 4: Restructuring Instructional Delivery Objective 2: Improve Core Curriculum Pedagogy Method 1
Submitted by Dr. John Trimboli, Associate Professor of Mathematics and Institutional Research Fellow in the Office of the Provost
Note: success ratio is usually defined as
the number of students receiving A, B, C, P, or S grades
the number of students receiving A, B, C, P, S, D, F, U, W, or WF grades
MATH 0098 (Algebraic Concepts & Applications) Only data currently available is AY2012
Fall 2011 success ratio: 139
331= 42.0%
Spring 2012 success ratio: 105
251= 41.8% AY2012 success ratio:
279
660= 42.3%
Summer 2012 success ratio: 35
78= 44.9%
Note: We consider an IP grade in MATH 0098 as a success. This is because the student has made successful progress in completing a previous two semester sequence in a single semester. MATH 0105 (Bridge to College Mathematics) Only data currently available is AY2012
Fall 2011 success ratio: 19
32= 59.4%
Spring 2012 success ratio: 60
99= 60.6% AY2012 success ratio:
97
161= 60.2%
Summer 2012 success ratio: 18
30= 60.0%
Note: Of particular interest, for both fall 2011 and spring 2012 semesters, no statistical association existed between one’s grade in MATH 0098 and their Compass Entrance Exam Score, at the .05 level of significance. MATH 1101 (Introduction to Mathematical Modeling)
FY2009 success ratio: 842
1530= 55.0%
FY2010 success ratio: 962
1573= 61.2%
FY2011 success ratio: 979
1440= 68.0%
FY2012 success ratio: 817
1180= 69.2%
MATH 1101 Three-Year Average = 2758
4193= 65.8%

Middle Georgia State College (Macon State College and Middle Georgia College) Page 21 Rev. 8/22/12
Notes:
MATH 1101 Grades and Gender are statistically independent variables ( 2 = 1.019, P-value = .907). That
is, no statistical association exists between one’s 1101 Grade and one’s gender.
MATH 1101 Grades and Race are statistically dependent variables ( 2 = 71.330, P-value = .000). That is,
a statistical association exists between one’s 1101 Grade and one’s Race. In general, Caucasians tend to be over-represented in the higher grades, as well as under-represented in the lower grades, when compared to African Americans. There is no statistical difference between the average MATH 1101 grade for white males and white females, nor between black males and black females. However, on average, both white males and white females tend to outperform both black males and black females (Tukey HSD Test, P-value = .000). Lastly, the average MATH 1101 grade for students under age 25 is statistically higher than the average grade for students at least age 25 (t = 3.355, P-value = .000). MATH 1111 (College Algebra)
FY2009 success ratio: 348
604= 57.6%
FY2010 success ratio: 326
578= 56.4%
FY2011 success ratio: 314
532= 59.0%
FY2012 success ratio: 336
577= 58.2%
MATH 1111 Three-Year Average = 976
1687= 57.9%
Notes:
MATH 1111 Grades and Gender are statistically independent variables ( 2 = 1.027, P-value = .906). That
is, no statistical association exists between one’s 1111 Grade and one’s gender.
MATH 1111 Grades and Race are statistically dependent variables ( 2 = 47.374, P-value = .000). That is,
a statistical association exists between one’s 1111 Grade and one’s Race. In general, Caucasians tend to be over-represented in the higher grades, as well as under-represented in the lower grades, when compared to African Americans. There is no statistical difference between the average MATH 1111 grade for white males and white females, nor between black males and black females. However, on average, both white males and white females tend to outperform both black males and black females (Tukey HSD Test, P-value = .000). Lastly, the average MATH 1111 grade for students under age 25 is statistically higher than the average grade for students at least age 25 (t = 2.046, P-value = .021). Conclusions: Starting with the fall semester of 2011, the Learning Support mathematics curriculum has undergone some major changes. Two 4-hour courses, MATH 0097 (Introductory Algebra) and MATH 0099 (Intermediate Algebra), were changed into a single 4-hour course, MATH 0098. Under the old model, all students who would have entered into MATH 0097 would have had to have taken at least 2 semesters

Middle Georgia State College (Macon State College and Middle Georgia College) Page 22 Rev. 8/22/12
to complete MATH 0097 and MATH 0099. That is, those students who would have been placed in MATH 0097 under the old model were expected to take 2 semesters to complete MATH 0098. We therefore expect, to some degree, an initial low success rate in MATH 0098. As a result of these and other changes, like the addition of our new MATH 0105 course, the percent withdrawal rate has gone down in MATH 1101 from 19.3% in 2010 to 14.9% in 2012. Also, the average grade in MATH 1101 has increased in each of the last three years, from 2.1 in 2009 to 2.4 in 2012. We have gone from a traditional lecture mode format in MATH 1111 to a computer aided instruction mode of learning using the software ALEKS. As a result, we have seen a statistically significant drop off in student withdrawal counts. In the fall semester of 2010, 35 females and 20 males withdrew from MATH 1111. These numbers fell to 22 females and 14 males in fall semester of 2011. From analyzing this data, we understand a need for improving the success of our African American students, as well as our adult learners, if we are to move the needle forward in the overall mathematical performances of our students. Our newly developed MATH 0098 course still has a very low success ratio. The Mathematics Department is currently looking into these statistics, in an attempt to make further improvements that will significantly increase our success ratio. Proposal for an Alternative Statistical Track in Learning Support and Core Level Mathematics (as a response to the immediately aforementioned empirical statistical analyses)
Submitted by Barry J. Monk, Ph.D., Chair of MSC Mathematics Department and Associate Professor of Mathematics
Background Unfortunately, many students see Mathematics Learning Support as a barrier – one that potentially may end their college aspirations. This is a problem not only in Georgia, but across the nation (Bailey, 2009). Part of the problem is that many students do not see mathematics as an essential part of their lives. The current algebra-based curriculum does little to engage students and show them how mathematics is relevant. The current curriculum is appropriate for students who intend to major in STEM disciplines because the path for those students is fairly evident: Algebra to Precalculus to Calculus, and beyond. However, the skills necessary in the non-STEM professions are more closely aligned to quantitative and statistical reasoning (Byrk & Treisman, 2010). Proposal Implement a Mathematics Learning Support track for non-STEM majors that focuses on quantitative and statistical reasoning while integrating developmental mathematics concepts as necessary. This track continues through Areas A & D with the inclusion of two new courses that are statistical in nature. The non-STEM statistical track includes two four-credit hour courses at the developmental level (MATH 0091: Developing Numeracy through Data Analysis I, MATH 0092: Developing Numeracy through Data Analysis II), followed by a three-credit hour course, MATH 1202: Principles of Statistics with Applications in Area A, and a three-credit hour course, MATH 1205: Statistical Inference, in Area D. Effectively, this creates two paths through Mathematics Learning Support, an algebra-based track (for STEM majors) and a quantitative and statistical reasoning track. There would also be two paths for continuation into Areas A and D that could equally apply for non-STEM majors.

Middle Georgia State College (Macon State College and Middle Georgia College) Page 23 Rev. 8/22/12
All courses will adhere to guidelines for statistical instruction as stated by the American Statistical Association (http://www.amstat.org/education/gaise/). This track will be applicable to non-STEM degree programs whose mathematical requirements do not go beyond those stated in the core. Courses MATH 0091 – Developing Numeracy through Data Analysis I Credit: 4 hours Description: This course focuses on developing numeracy, linear relationships, and multiple representations of functions within a statistical context. Topics include statistical studies, sampling, graphical summaries of data, numerical summaries of data, comparing distributions, and reasoning about bivariate data. Lab/Lecture Hours: Four lecture hours per week MATH 0092 – Developing Numeracy through Data Analysis II Credit: 4 hours Description: This course focuses on developing numeracy, linear and nonlinear relationships, representations of functions, and mathematical modeling within a statistical context. Topics include correlation, linear regression, nonlinear regression, modeling with data, and reasoning with probability. Lab/Lecture Hours: Four lecture hours per week MATH 1202 – Principles of Statistics with Applications Description: This course focuses on using data in the real world. Topics include data organization, data description, probability, normal distributions, and sampling distributions. Lecture/Lab Hours: Three lecture hours per week MATH 1205 – Statistical Inference Credit: 3 hours
Middle Georgia State College (Macon State College and Middle Georgia College) Page 24 Rev. 8/22/12
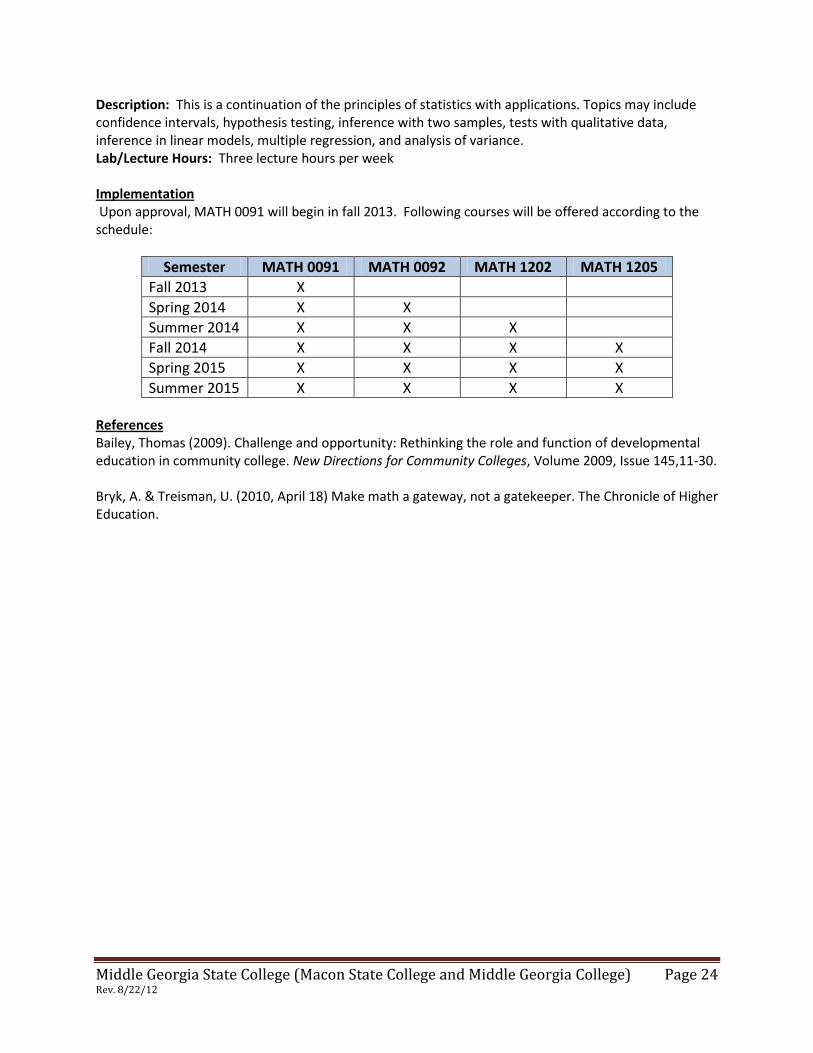
Description: This is a continuation of the principles of statistics with applications. Topics may include confidence intervals, hypothesis testing, inference with two samples, tests with qualitative data, inference in linear models, multiple regression, and analysis of variance. Lab/Lecture Hours: Three lecture hours per week Implementation Upon approval, MATH 0091 will begin in fall 2013. Following courses will be offered according to the schedule:
Semester MATH 0091 MATH 0092 MATH 1202 MATH 1205
Fall 2013 X
Spring 2014 X X
Summer 2014 X X X
Fall 2014 X X X X
Spring 2015 X X X X
Summer 2015 X X X X References Bailey, Thomas (2009). Challenge and opportunity: Rethinking the role and function of developmental education in community college. New Directions for Community Colleges, Volume 2009, Issue 145,11-30. Bryk, A. & Treisman, U. (2010, April 18) Make math a gateway, not a gatekeeper. The Chronicle of Higher Education.

Middle Georgia State College (Macon State College and Middle Georgia College) Page 25 Rev. 8/22/12
Progress Metric 2: Success in Remedial Education (Fall 2010; Pre-redesign)
Key Performance
Indicators (KPI)
Total
Math Only
English Only
Reading Only
Math & English
Math & Reading
Engl & Reading
Math, English,
& Reading
# % # % # % # % # % # % # % # %
Percent in Each Cohort 895 100.0% 388 43.4% 75 8.4% 41 4.6% 95 10.6% 74 8.3% 51 5.7% 171 19.1%
Success in Remediation
777
53.3%
252
64.9%
54
72.0%
25
70.0%
109
57.4%
81
54.7%
47
46.1%
209
40.7%
Female
611
68.3%
264
68.0%
47
62.7%
28
68.3%
69
72.6%
54
73.0%
27
52.9%
122
71.3% Male 284 31.7% 124 32.0% 28 37.3% 13 31.7% 26 27.4% 20 27.0% 24 47.1% 49 28.7%
White
326
36.4%
188
48.5%
26
34.7%
12
29.3%
39
41.1%
20
27.0%
7
13.7%
34
19.9% Black 481 53.7% 173 44.6% 31 41.3% 22 53.7% 51 53.7% 50 67.6% 31 60.8% 123 71.9%
American Indian 4 0.4% 1 0.3% 1 1.3% 0 0.0% 0 0.0% 1 1.4% 1 2.0% 0 0.0%
Native Hawaiian 1 0.1% 0 0.0% 0 0.0% 0 0.0% 0 0.0% 0 0.0% 0 0.0% 1 0.6%
Asian 22 2.5% 2 0.5% 9 12.0% 2 4.9% 1 1.1% 0 0.0% 5 9.8% 3 1.8%
Hispanic 26 2.9% 8 2.1% 1 1.3% 2 4.9% 3 3.2% 3 4.1% 3 5.9% 6 3.5%
Multi-racial 30 3.4% 13 3.4% 6 8.0% 3 7.3% 0 0.0% 0 0.0% 4 7.8% 4 2.3%
Unknown 5 0.6% 3 0.8% 1 1.3% 0 0.0% 1 1.1% 0 0.0% 0 0.0% 0 0.0%
17-19
414
46.3%
136
35.1%
48
64.0%
25
61.0%
44
46.3%
37
50.0%
27
52.9%
97
56.7% 20-24 175 19.6% 83 21.4% 13 17.3% 7 17.1% 17 17.9% 14 18.9% 13 25.5% 28 16.4%
25+ 306 34.2% 169 43.6% 14 18.7% 9 22.0% 34 35.8% 23 31.1% 11 21.6% 46 26.9%
*Success rate defined as an individual passing with a grade of A-C.
*Note: Please see below chart to reflect success rates for above cohorts.
# of # of Success Grades
Total 777 1457 Math Only 252 388 English Only 54 75 Reading Only 25 41 Math & English 109 190 Math & Reading 81 148 English & Reading 47 102 Math, English, & Reading 209 513
*LS Classes include: English 99, Math 97/99, Reading 99
Overall Success Rates for Learning Support
English Math Reading
Cohort # % Cohort # % Cohort # % Total Number in Each Coh 392 188 48.0% 728 418 57.4% 337 171 50.7%
Female
265
130
49.1%
509
306
60.1%
231
118
51.1% Male 127 58 45.7% 219 112 51.1% 106 53 50.0%
White
106
74
69.8%
281
195
69.4%
73
56
76.7% Black 236 80 33.9% 397 190 47.9% 226 89 39.4%
American Indian/Alaska Na 2 1 50.0% 2 2 100.0% 2 2 100.0% Native Hawaiian/Other Pa 1 1 100.0% 1 1 100.0% 1 1 100.0% Asian 18 14 77.8% 6 5 83.3% 10 8 80.0% Hispanic 13 8 61.5% 20 12 60.0% 14 9 64.3% Multi-racial 14 8 57.1% 17 9 52.9% 11 6 54.5% Unknown 2 2 100.0% 4 4 100.0% 0 0 0.0%
17-19
216
113
52.3%
314
202
64.3%
186
107
57.5% 20-24 71 32 45.1% 142 77 54.2% 62 28 45.2%
25+ 105 43 41.0% 272 139 51.1% 89 36 40.4%

Middle Georgia State College (Macon State College and Middle Georgia College) Page 26 Rev. 8/22/12
Strategy 4: Restructuring Instructional Delivery Objective 2: Improve Core Curriculum Pedagogy Method 2
Percentage of “Unsuccessful” Completion of Select Courses Enrollment > 200 students AND Unsuccessful Rate > 40%
Course Fall 2006 Fall 2007 Fall 2008 Fall 2009 Fall 2010 Fall 2011
ENGL 0099 58.89% 63.37% 68.52% 72.80% 60.67% 61.54%
MATH 0097 26.98% 40.93% 53.33% 45.25% 60.56% 58.56%
MATH 0099 48.85% 63.05% 68.23% 62.96% 59.29% 64.03%
READ 0099 46.53% 48.91% 55.81% 60.80% 60.15% 63.60% Source: MGC Institutional Research Department Banner Reports Note: Successful completion is defined as earning a grade of A, B, C, or S.
“Select” Courses - with Enrollment > 200 and an Unsuccessful Rate > 40% Fall 2007 Fall 2008 Fall 2009 Fall 2010
Learning Support English II Learning Support English II Learning Support English II Learning Support English II
Learning Support Math (Foundations of Algebra II)
Learning Support Math (Foundations of Algebra II)
Learning Support Math (Foundations of Algebra II)
Learning Support Math (Foundations of Algebra II)
Learning Support Reading II
Learning Support Reading II
Learning Support Reading II
Learning Support Reading II
Learning Support Math (Foundations of Algebra I)
Learning Support Math (Foundations of Algebra I)
Learning Support Math (Foundations of Algebra I)
Learning Support Math (Foundations of Algebra I)
Anatomy & Physiology I Anatomy & Physiology I Anatomy & Physiology I Anatomy & Physiology I
United States History I United States History I United States History II American Government
College Algebra College Algebra Introduction to Psychology
Principles of Biology I Principles of Biology I
Introduction to Psychology
Plane Trigonometry
American Government Source: MGC Institutional Research Department Banner Reports Note: Successful completion is defined as earning a grade of A, B, C, or S.
Strategy 5: Transforming Remediation Objective 1: Increase Student Success Rates in Learning Support Courses Method 1 LS Math Redesign:
a) Math 98 pilot: A Math 98 course was developed to include the content covered in both Math 97 and Math 99. The section was limited to students who had declared one of the STEM areas as their major, who had to exit only LS Math and tested into Math 97, and who had just graduated from high school. Students who did not perform well had the option of dropping down to the regular Math 97 course. Once the semester was over, students who did pass the course could be placed either into Math 97 or Math 99 based on their performance. The traditional teaching method was followed supplemented with MyMathLab (MML) for

Middle Georgia State College (Macon State College and Middle Georgia College) Page 27 Rev. 8/22/12
assigning homework and for practice. Help sessions were offered outside of class time for one hour twice a week.
Math 98 Pilot Results # % of Total Fall 2011 Math 98 Pilot Cohort 15 100% Passed Department Math 99 Final Exam 3 20% Students recommended to take the COMPASS 9 60% Students who passed the COMPASS 9 60%
Note: 100% of students who were recommended to take the COMPASS exam passed the COMPASS exam.
Observation: Out of the 6 students who did not exit Learning Support, 2 passed the Math 97 portion and were placed into Math 99 the following semester; the remaining 4 were placed back into Math 97. Therefore, while 60% of the Math 98 cohort exited Learning Support, another 13.33% passed Math 97 bringing the overall success rate to 73.33%.
b) Modularization of content: The Math 99 content was provided in the form of modules with built-in practice and assessment procedures. The course was not taught in the traditional way but was facilitated by an instructor in a computer lab. The grades for this course were compared to those from another section of Math 99 taught during the same term and using the traditional approach (lectures and MML).
Fall 2011 Math 99 Pilot Grades vs. Traditional Math 99 Grades
Final Grade Traditional Math 99
n=33 Redesigned Math 99
n=22
# % # %
A 3 9.1% 1 4.5%
B 4 12.1% 7 31.9%
C 9 27.3% 3 13.6%
IP 3 9.1% 11 50.0%
F 14 42.4% 0 0%
COMPASS Pass Rate
48.5% 50.0%
Observation: The passing rates in both sections does not seem to be significantly different, however, the number of ‘F’ grades in the redesigned course is zero as compared to 14 (42.4%) in the traditional class.
One-Year Retention Rates for FTFTF w/No Learning Support Requirements
Semester Cohort No LS
Classes
Returned Following
Spring
Fall to Spring Retention
Rate Returned
Following Fall
Fall to Fall Retention
Rate
Fall 2006 377 346 91.78% 239 63.40%
Fall 2007 414 361 87.20% 252 60.87%
Fall 2008 495 431 87.07% 303 61.21%
Fall 2009 540 482 89.26% 343 63.52% Source: MGC Institutional Research Department Banner Reports

Middle Georgia State College (Macon State College and Middle Georgia College) Page 28 Rev. 8/22/12
One-Year Retention Rates for FTFTF for the Learning Support Cohort
Semester LS
Cohort % of Overall FTFT Cohort
Returned Following
Spring
Fall to Spring Retention
Rate
Returned Following
Fall
Fall to Fall Retention
Rate
Fall 2006 539 58.84% 468 86.83% 315 58.44%
Fall 2007 544 56.78% 465 85.48% 286 52.57%
Fall 2008 540 52.17% 429 79.44% 246 45.56%
Fall 2009 576 51.61% 472 81.94% 253 43.92% Source: MGC Institutional Research Department Banner Reports
One-Year Retention Rates of Learning Support for FTFTF (Fall to Fall)
Semester
All
FTFTF
No LS Req.
One LS
Req.
Two LS
Req.
Three LS
Req.
MATH 0097* or
MATH 0099*
LS ENGL and/or LS READ only
Fall 2006 60.48% 63.40% 55.51% 63.64% 58.65% 58.26% 59.34%
Fall 2007 56.16% 60.87% 51.39% 56.00% 51.05% 49.78% 67.44%
Fall 2008 53.04% 61.21% 48.83% 46.24% 36.94% 44.69% 50.63% Source: MGC Institutional Research Department Banner Reports *Rates for the students enrolled in Math 0097 and Math 0099 are regardless of other Learning Support requirements.

Middle Georgia State College (Macon State College and Middle Georgia College) Page 29 Rev. 8/22/12
Appendix B
Middle Georgia College
USG Metrics Working Group
Recommended Metrics

Middle Georgia State College (Macon State College and Middle Georgia College) Page 30 Rev. 8/22/12
Middle Georgia College I. Increased Efficiencies A. Graduation Rates
Three-Year System-Wide Graduation Rates
Cohort Year
Student Type Fall
2006 Fall
2007 Fall
2008 3-Year
Average
Associate’s Degree
All First-Time Freshmen 12.14% 9.26% 12.23% 11.21%
FTFT Freshmen 12.35% 9.78% 12.56% 11.56%
FTPT Freshmen 10.28% 3.49% 8.33% 7.37% Note: Students are counted if they graduated from MGC or any other System institution within the noted timeframe. Source: USG Office of Research and Policy Analysis Graduation Rate Reports
Two-Year System-Wide Graduation Rates
Cohort Year
Student Type Fall
2006 Fall
2007 Fall
2008 3-Year
Average
Associate’s Degree
All First-Time Freshmen 5.06% 4.92% 4.39% 4.79%
FTFT Freshmen 5.31% 5.26% 4.78% 5.12%
FTPT Freshmen 2.80% 1.16% 0.0% 1.32% Note: Students are counted if they graduated from MGC or any other System institution within the noted timeframe. Source: USG Office of Research and Policy Analysis Graduation Rate Reports
Four-Year System-Wide Graduation Rates
Cohort Year
Student Type Fall
2005 Fall
2006 Fall
2007 3-Year
Average
Associate’s Degree
All First-Time Freshmen 16.14% 15.36% 12.15% 14.55%
FTFT Freshmen 16.71% 15.71% 12.51% 14.98%
FTPT Freshmen 10.39% 12.15% 8.14% 10.23% Note: Students are counted if they graduated from MGC or any other System institution within the noted timeframe. Source: USG Office of Research and Policy Analysis Graduation Rate Reports
Middle Georgia State College (Macon State College and Middle Georgia College) Page 31 Rev. 8/22/12
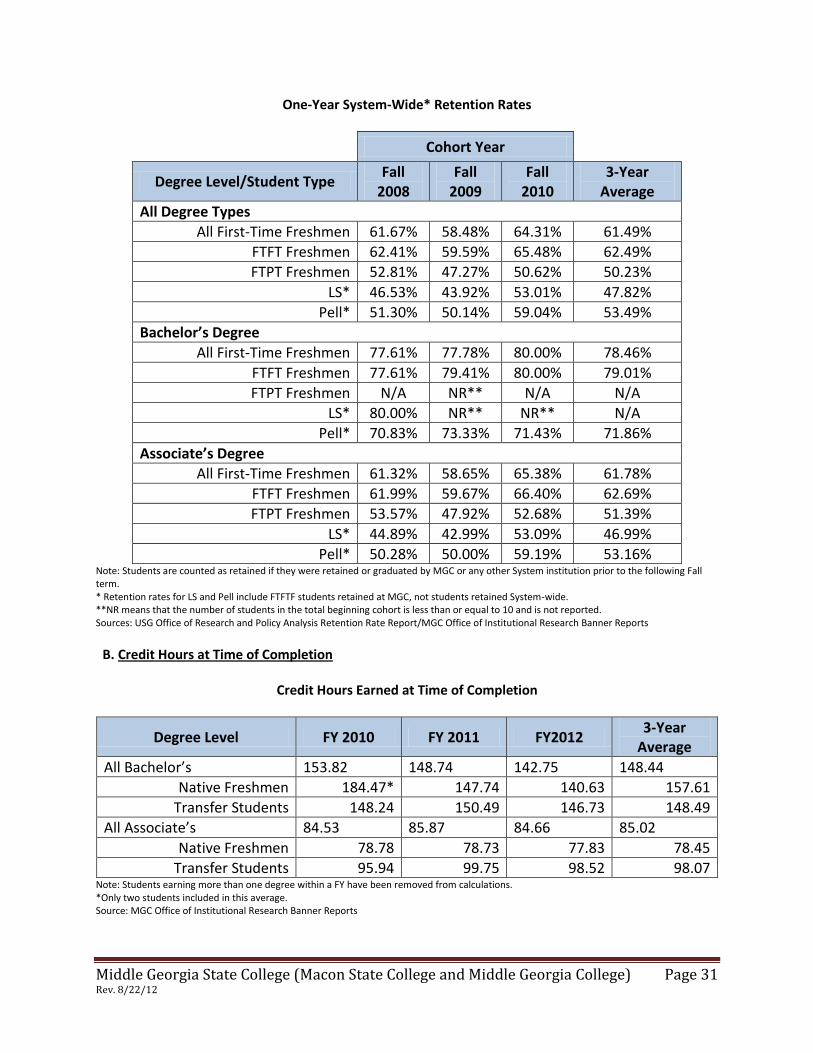
One-Year System-Wide* Retention Rates
Cohort Year
Degree Level/Student Type Fall
2008 Fall
2009 Fall
2010 3-Year
Average
All Degree Types
All First-Time Freshmen 61.67% 58.48% 64.31% 61.49%
FTFT Freshmen 62.41% 59.59% 65.48% 62.49%
FTPT Freshmen 52.81% 47.27% 50.62% 50.23%
LS* 46.53% 43.92% 53.01% 47.82%
Pell* 51.30% 50.14% 59.04% 53.49%
Bachelor’s Degree
All First-Time Freshmen 77.61% 77.78% 80.00% 78.46%
FTFT Freshmen 77.61% 79.41% 80.00% 79.01%
FTPT Freshmen N/A NR** N/A N/A
LS* 80.00% NR** NR** N/A
Pell* 70.83% 73.33% 71.43% 71.86%
Associate’s Degree
All First-Time Freshmen 61.32% 58.65% 65.38% 61.78%
FTFT Freshmen 61.99% 59.67% 66.40% 62.69%
FTPT Freshmen 53.57% 47.92% 52.68% 51.39%
LS* 44.89% 42.99% 53.09% 46.99%
Pell* 50.28% 50.00% 59.19% 53.16% Note: Students are counted as retained if they were retained or graduated by MGC or any other System institution prior to the following Fall term. * Retention rates for LS and Pell include FTFTF students retained at MGC, not students retained System-wide. **NR means that the number of students in the total beginning cohort is less than or equal to 10 and is not reported. Sources: USG Office of Research and Policy Analysis Retention Rate Report/MGC Office of Institutional Research Banner Reports
B. Credit Hours at Time of Completion
Credit Hours Earned at Time of Completion
Degree Level FY 2010 FY 2011 FY2012 3-Year
Average
All Bachelor’s 153.82 148.74 142.75 148.44
Native Freshmen 184.47* 147.74 140.63 157.61
Transfer Students 148.24 150.49 146.73 148.49
All Associate’s 84.53 85.87 84.66 85.02
Native Freshmen 78.78 78.73 77.83 78.45
Transfer Students 95.94 99.75 98.52 98.07 Note: Students earning more than one degree within a FY have been removed from calculations. *Only two students included in this average. Source: MGC Office of Institutional Research Banner Reports
Middle Georgia State College (Macon State College and Middle Georgia College) Page 32 Rev. 8/22/12
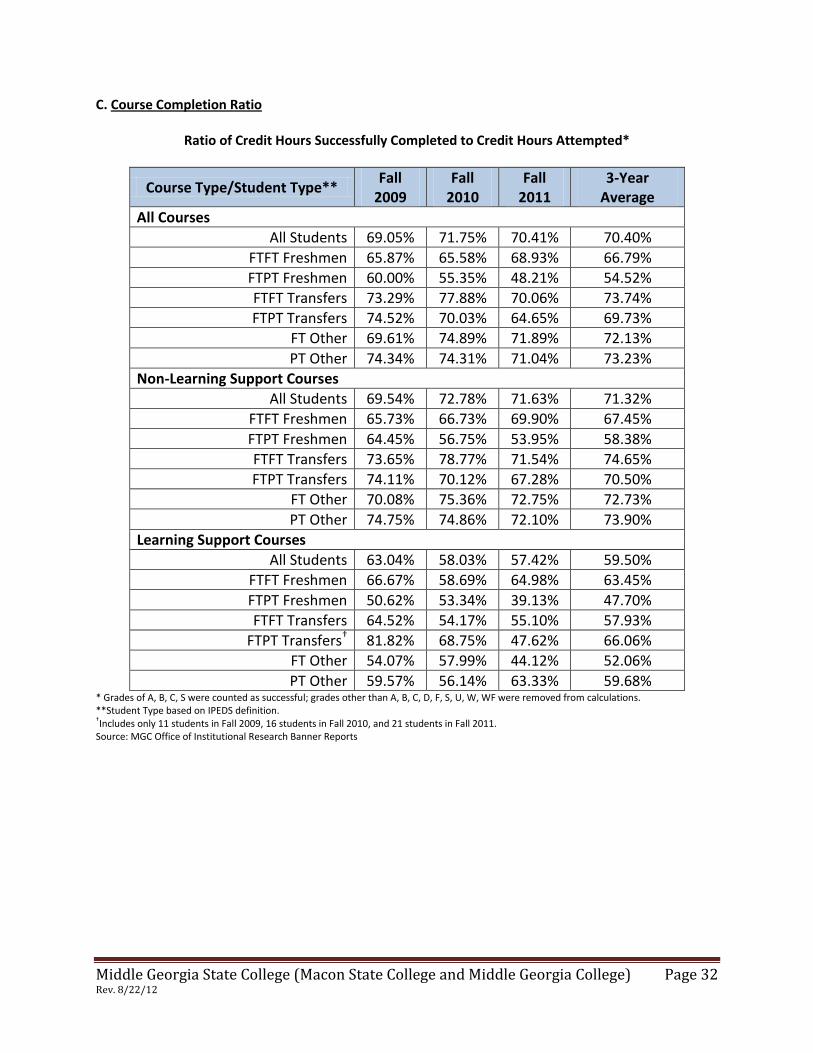
C. Course Completion Ratio
Ratio of Credit Hours Successfully Completed to Credit Hours Attempted*
Course Type/Student Type** Fall
2009 Fall
2010 Fall
2011 3-Year
Average
All Courses
All Students 69.05% 71.75% 70.41% 70.40%
FTFT Freshmen 65.87% 65.58% 68.93% 66.79%
FTPT Freshmen 60.00% 55.35% 48.21% 54.52%
FTFT Transfers 73.29% 77.88% 70.06% 73.74%
FTPT Transfers 74.52% 70.03% 64.65% 69.73%
FT Other 69.61% 74.89% 71.89% 72.13%
PT Other 74.34% 74.31% 71.04% 73.23%
Non-Learning Support Courses
All Students 69.54% 72.78% 71.63% 71.32%
FTFT Freshmen 65.73% 66.73% 69.90% 67.45%
FTPT Freshmen 64.45% 56.75% 53.95% 58.38%
FTFT Transfers 73.65% 78.77% 71.54% 74.65%
FTPT Transfers 74.11% 70.12% 67.28% 70.50%
FT Other 70.08% 75.36% 72.75% 72.73%
PT Other 74.75% 74.86% 72.10% 73.90%
Learning Support Courses
All Students 63.04% 58.03% 57.42% 59.50%
FTFT Freshmen 66.67% 58.69% 64.98% 63.45%
FTPT Freshmen 50.62% 53.34% 39.13% 47.70%
FTFT Transfers 64.52% 54.17% 55.10% 57.93%
FTPT Transfers† 81.82% 68.75% 47.62% 66.06%
FT Other 54.07% 57.99% 44.12% 52.06%
PT Other 59.57% 56.14% 63.33% 59.68% * Grades of A, B, C, S were counted as successful; grades other than A, B, C, D, F, S, U, W, WF were removed from calculations. **Student Type based on IPEDS definition. †Includes only 11 students in Fall 2009, 16 students in Fall 2010, and 21 students in Fall 2011.
Source: MGC Office of Institutional Research Banner Reports
Middle Georgia State College (Macon State College and Middle Georgia College) Page 33 Rev. 8/22/12
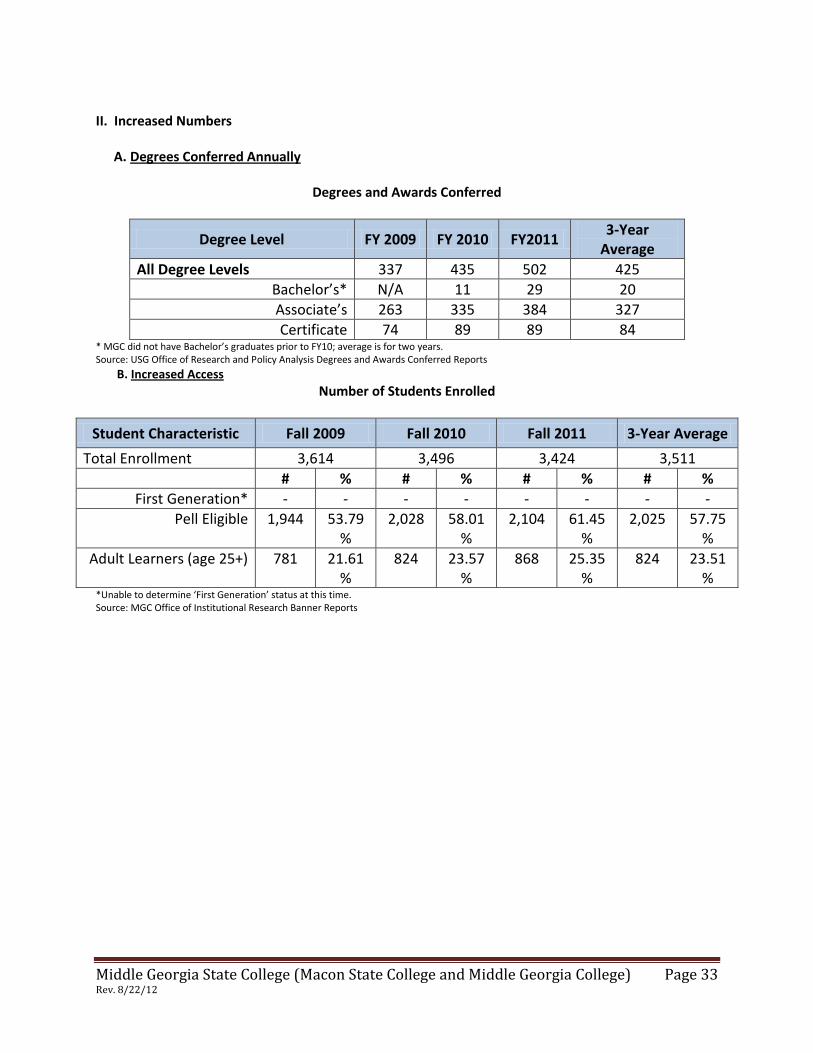
II. Increased Numbers A. Degrees Conferred Annually
Degrees and Awards Conferred
Degree Level FY 2009 FY 2010 FY2011 3-Year
Average
All Degree Levels 337 435 502 425
Bachelor’s* N/A 11 29 20
Associate’s 263 335 384 327
Certificate 74 89 89 84 * MGC did not have Bachelor’s graduates prior to FY10; average is for two years. Source: USG Office of Research and Policy Analysis Degrees and Awards Conferred Reports
B. Increased Access
Number of Students Enrolled
Student Characteristic Fall 2009 Fall 2010 Fall 2011 3-Year Average
Total Enrollment 3,614 3,496 3,424 3,511
# % # % # % # %
First Generation* - - - - - - - -
Pell Eligible 1,944 53.79%
2,028 58.01%
2,104 61.45%
2,025 57.75%
Adult Learners (age 25+) 781 21.61%
824 23.57%
868 25.35%
824 23.51%
*Unable to determine ‘First Generation’ status at this time. Source: MGC Office of Institutional Research Banner Reports

Middle Georgia State College (Macon State College and Middle Georgia College) Page 34 Rev. 8/22/12
Appendix C
Macon State College
USG Metrics Working Group Recommended Metrics

Middle Georgia State College (Macon State College and Middle Georgia College) Page 35 Rev. 8/22/12
I. Increased Efficiencies
Graduation Rates- Macon State College
Cohort Year
Student Type Fall
2006 Fall
2007 Fall
2008 3-Year
Average
Associate’s Degree (3 years)
All First-Time Freshmen 2.51% 3.07% 2.87% 2.82%
FTFT Freshmen 2.59% 3.64% 2.97% 3.07%
FTPT Freshmen 2.27% 1.01% 2.54% 1.94% Source: USG/ Academic Data Mart, rates reflect system-wide data
Learning Support Students Cohort Year
Student Type Fall
2006 Fall
2007 Fall
2008 3-Year
Average
Associate’s Degree (3 years)
All First-Time Freshmen
0.4% 0.0% 0.6% 0.3%
Source: MSC Office of Institutional Research & Planning, Banner & IPEDS files
Federal Financial Aid Recipients Cohort Year
Student Type Fall
2006 Fall
2007 Fall
2008 3-Year
Average
Associate’s Degree
All First-Time Freshmen 1.3% 0.9% 1.8% 1.3% Source: MSC Office of Institutional Research & Planning, Banner & IPEDS files
Cohort Year
Student Type Fall
2003 Fall
2004 Fall
2005 6-Year
Average
Bachelor’s Degree (4-6 years)
All First-Time Freshmen 19.77% 19.28% 24.73% 21.26%
FTFT Freshmen 22.54% 23.53% 30.67% 25.58%
FTPT Freshmen 6.67% 0.00% 0.00% 2.22% Source: USG/ Academic Data Mart, rates reflect system-wide data
Learning Support Students
Cohort Year

Middle Georgia State College (Macon State College and Middle Georgia College) Page 36 Rev. 8/22/12
Student Type Fall
2003 Fall
2004 Fall
2005 3-Year
Average
Bachelor’s Degree (4-6 years)
All First-Time Freshmen 7.2% 9.5% 11.4% 9.4% Source: MSC Office of Institutional Research & Planning, Banner & IPEDS files
Federal Financial Aid Recipients Cohort Year
Student Type Fall
2003 Fall
2004 Fall
2005 3-Year
Average
Bachelor’s Degree (4-6 years)
All First-Time Freshmen 9.4% 10.7% 12.2% 10.8% Source: MSC Office of Institutional Research & Planning, Banner & IPEDS files
Retention Rates- Macon State College
One-Year System-Wide Retention Rates
Cohort Year
Degree Level/Student Type Fall
2008 Fall
2009 Fall
2010 3-Year
Average
Bachelor’s Degree
FTFT Freshmen 65.12% 70.15% 78.38% 71.22%
FTPT Freshmen 51.72% 52.38% 55.56% 53.22%
Associate’s Degree
FTFT Freshmen 63.11% 54.97% 66.40% 61.49%
FTPT Freshmen 53.39% 32.78% 36.16% 40.78% Source: USG/ Academic Data Mart, rates reflect system-wide data
Learning Support Students Cohort Year
Student Type Fall
2008 Fall
2009 Fall
2010 3-Year
Average
Bachelor’s Degree
All First Time Freshmen 77% 74% 70% 74%
Associate’s Degree
All First Time Freshmen 45% 35% 33% 38% Source: MSC Office of Institutional Research & Planning, Banner, SIRS, & IPEDS files

Middle Georgia State College (Macon State College and Middle Georgia College) Page 37 Rev. 8/22/12
Federal Financial Aid Cohort Year
Student Type Fall
2008 Fall
2009 Fall
2010 3-Year
Average
Bachelor’s Degree
All First Time Freshmen 75% 75% 76% 75%
Associate’s Degree
All First Time Freshmen 46% 36% 32% 38% Source: MSC Office of Institutional Research & Planning, Banner, SIRS, & IPEDS files
Credit Hours at Time of Completion
Credit Hours Earned at Time of Completion (Unduplicated)
Degree Level FY 2010 FY 2011 FY2012 3-Year
Average
All Bachelor’s
Native Freshmen 140.1 142.6 142.3 141.7
Transfer Students 151.6 160.5 156.8 156.3
All Associate’s
Native Freshmen 104.8 103.6 97.8 102.1
Transfer Students 131.0 127.9 123.1 127.3 Source: MSC Office of Institutional Research & Planning, Banner Originally there were 2,320 unduplicated graduates for FY10-12; however, 182 graduates were removed due to duplication (received more than one degree from MSC). These graduates account for 7.8% of the total graduating population.
Course Completion Ratio
Earned Hours Attempted Hours
Ratio 3-Year Average
Fall 2011 46,540 59,440 78% 76%
Fall 2010 48,394 63,087 77%
Fall 2009 48,755 66,676 73% Source: MSC Office of Institutional Research & Planning, Banner
II. Increased Numbers A. Degrees Conferred Annually
Degrees and Awards Conferred
Degree Level FY 2010 FY 2011 FY 2012 3-Year
Average
All Degree Levels 807 849 874 843
Bachelor’s 442 518 559 506
Associate’s 358 318 311 329
Certificate 7 13 4 8

Middle Georgia State College (Macon State College and Middle Georgia College) Page 38 Rev. 8/22/12
Source: MSC Registrar’s Office
Degree Production by Discipline (2011-2012)
Arts, Humanities,
Social Sciences Business Education STEM
Health (includes nursing) Total
Associate Degrees
86 28%
60 19%
20 6%
35 11%
110 35%
311
Bachelor Degrees
122 22%
150 27%
88 16%
84 15%
115 21%
559
Source: MSC Office of Institutional Research & Planning, Banner
B. Increased Access Number of Students Enrolled
Student Characteristic Fall 2009 Fall 2010 Fall 2011 3-Year Average
Total Enrollment 6615 6232 5702
# % # % # % # %
First Generation* 3184 48% 3010 48% 2764 48% 2986 48%
Pell Eligible 3147 48% 3190 51% 2885 51% 3074 50%
Adult Learners (age 25+) 2910 44% 2666 43% 2435 43% 2670 43% Source: MSC Office of Institutional Research & Planning, Admissions, and Financial Aid