midcontinental native american population dynamics and
TRANSCRIPT
1Scientific RepoRts | 7:41628 | DOI: 10.1038/srep41628
www.nature.com/scientificreports
Midcontinental Native American population dynamics and late Holocene hydroclimate extremesBroxton W. Bird1, Jeremy J. Wilson2, William P. Gilhooly III1, Byron A. Steinman3 & Lucas Stamps1
Climate’s influence on late Pre-Columbian (pre-1492 CE), maize-dependent Native American populations in the midcontinental United States (US) is poorly understood as regional paleoclimate records are sparse and/or provide conflicting perspectives. Here, we reconstruct regional changes in precipitation source and seasonality and local changes in warm-season duration and rainstorm events related to the Pacific North American pattern (PNA) using a 2100-year-long multi-proxy lake-sediment record from the midcontinental US. Wet midcontinental climate reflecting negative PNA-like conditions occurred during the Medieval Climate Anomaly (950–1250 CE) as Native American populations adopted intensive maize agriculture, facilitating population aggregation and the development of urban centers between 1000–1200 CE. Intensifying midcontinental socio-political instability and warfare between 1250–1350 CE corresponded with drier positive PNA-like conditions, culminating in the staggered abandonment of many major Native American river valley settlements and large urban centers between 1350–1450 CE during an especially severe warm-season drought. We hypothesize that this sustained drought interval rendered it difficult to support dense populations and large urban centers in the midcontinental US by destabilizing regional agricultural systems, thereby contributing to the host of socio-political factors that led to population reorganization and migration in the midcontinent and neighboring regions shortly before European contact.
The adoption of intensive agricultural practices allowed North American Pre-Columbian populations (pre-1492 CE) in the southwestern and eastern United States (US) to moderate subsistence shortfalls and thereby sustain larger populations with increasing socio-political complexity1–3. One consequence of this agricultural strategy, however, was an inherent susceptibility to climate change and water resource availability, especially in the absence of water retention and/or diversion infrastructure2,4–7. In the southwest, interrelationships between population dynamics, agricultural productivity, and climate are illustrated by the expansion of agriculturally based Native American populations during pluvial (wet) conditions prior to 1000 CE and their subsequent collapse during the Medieval Climate Anomaly (MCA) between 1000 and 1300 CE in response to a series of multi-decadal droughts that severely limited agricultural yields (Fig. 1) 7–9.
A similar climate-agriculture-population dynamic has been suggested to explain the arc of midcontinental Native American populations associated with Mississippian and related archaeological cultures of the Ohio River Valley (i.e., Fort Ancient and Monongahela) between 1000–1450 CE10–12. These populations collectively expanded between 1000–1200 CE, developing large villages and socio-cultural/religious centers with higher population densities likely sustained by the adoption of intensive maze agriculture by 1000 CE12–14. Maize was added to a diet including previously domesticated starchy and oily seeds of the Eastern Agricultural Complex and is believed to have been grown in both floodplain and upland contexts15. In the Mississippi and Ohio River drainages, hundreds of Mississippian villages and regional polities of varying sizes and configurations were developed during this time, including Cahokia, Kincaid and Angel, which were among the largest (Fig. 1). At their height, population densities in larger floodplains of the midcontinental US approached 27 individuals per km2 13, similar to that of modern-day Missouri16. At the same time, Fort Ancient and Monongahela polities also emerged further upstream along the Ohio River, relying on similar subsistence patterns to sustain increasing population aggregation in
1Department of Earth Sciences, Indiana University-Purdue University, Indianapolis, 46202, USA. 2Department of Anthropology, Indiana University-Purdue University, Indianapolis, 46202, USA. 3Large Lakes Observatory and Department of Earth and Environmental Sciences, University of Minnesota Duluth, Duluth, 55812, USA. Correspondence and requests for materials should be addressed to B.W.B. (email: [email protected])
received: 07 September 2016
Accepted: 21 December 2016
Published: 31 January 2017
OPEN

www.nature.com/scientificreports/
2Scientific RepoRts | 7:41628 | DOI: 10.1038/srep41628
smaller villages17. This late Pre-Columbian population reorganization, was soon followed by a period of increased warfare and militarization between 1250–1350 CE that culminated in the widespread and somewhat synchronous decline of population densities and urban centers across the central Mississippi and lower Ohio River valleys. The first indications of discord at Mississippian settlements occurred at Cahokia and within the American Bottom, where some upland urban centers and smaller settlements alike were abandoned starting around 1150 CE dur-ing a severe drought, culminating in the whole of the central Mississippi valley being depopulated by 1350 CE. Between ~1350–1450 CE, the Illinois and lower Ohio River valleys experienced a similar, progressive abandon-ment of larger centers with most Mississippian populations shifting to the lower Mississippi River valley and interior southeast by 1500 CE18. Population densities would remain low in this so-called midcontinental “Vacant Quarter” throughout the European contact phase, not reaching former levels until after the 1900s19,20.
While climate has been suggested as a component of late Pre-Columbian Native American settlement pat-terns and population dynamics in the midcontinental US20–23, paleoclimate records with the length, temporal resolution, and proxy sensitivity required to identify the potential effects of past climate change on agricultural potential are scarce and provide conflicting climatic information. Early work relying on a synthesis of tree-ring based drought reconstructions and archaeological records suggests that Cahokia developed during wet condi-tions prior to 1150 CE and that a switch to more frequent drought after this time contributed to its collapse7,21. In contrast, Munoz et al.23 identified suspected flood deposits in two lakes near Cahokia and suggested that increased regional precipitation and flooding after 1200 CE contributed to the collapse of Cahokia and other Mississippian city centers. Though these contrasting climatic scenarios for the late Pre-Columbian period are not mutually exclusive, they do illustrate the need for paleoclimate records that capture geographically broad climate processes capable of influencing populations spanning a large region.
To this end, we developed a high-resolution multi-proxy lake sediment record from Martin Lake, Indiana, USA (41.56°, − 85.38°, 274 m ASL; Fig. 1). This record captures both local and synoptic-scale (≥ 1000 km hori-zontal scale) climate variability related to the Pacific North American teleconnection (PNA). We use this dataset to investigate the potential linkages between abrupt climate change, the intensification of maize agriculture, and late Pre-Columbian population dynamics. Specifically, sub-decadally resolved down-core measurements of the oxygen isotopic composition of authigenic carbonates (δ 18Ocal) were used to reconstruct changes in the source and seasonality of precipitation, which are in turn correlated to PNA-like synoptic-scale atmospheric circulation patterns that affect climate across the Ohio River valley region. Local variations in the duration and intensity of the warm-season and associated rainfall events, both of which are also correlated to the mean state of the PNA for the central Mississippi and Ohio River valleys, were reconstructed using the carbon isotopic composition of authigenic carbonates (δ 13Ccal) and variations in the abundance of lithic material (terrestrially derived inorganic sediment), respectively. By linking synoptic-scale PNA variability with regional and local climatic changes, our multi-proxy approach provides an integrated perspective on midcontinental hydroclimate variability during the
Figure 1. Map of the continental US showing the location of Martin Lake (red circle), other paleoclimate records (white circles) and major midcontinental Native American sites (white squares). The white text rectangle indicates that drought and fire reconstructions are from the broader western US5,44. Gray boxes in the western US indicate locations of Anasazi (ANA), Fremont (FRE) and Lovelock (LOV) cultures that collapsed between 1000 and 1300 CE7. Colored shaded regions indicate correlations between growing season (Apr-Aug) CMAP-enhanced precipitation and the PNA index. Image provided by the NOAA/ESRL Physical Sciences Division, Boulder Colorado (http://www.esrl.noaa.gov/psd/).

www.nature.com/scientificreports/
3Scientific RepoRts | 7:41628 | DOI: 10.1038/srep41628
last 2100 years, lending new insight into the large-scale climate patterns associated with Pre-Colombian Native American cultural changes.
Results and DiscussionStudy Site. Martin Lake is a 17 meter-deep monomictic head-water kettle lake in northeastern Indiana (Figs 1 and S1). The lake is fed by ephemeral streams that merge into a single inflow on Martin Lake’s east side with additional hydrologic contributions from near surface groundwater (i.e., base flow)24. Year-round outflow drains to Olin Lake through a modified natural outlet on the lake’s western shore. Regional precipitation (910 mm yr−1) results in approximately 1.18 × 10⁷ m3 of precipitation over the lake’s 12.86-km2 catchment, which is more than ten times Martin Lake’s volume (1.11 × 10⁶ m3). This produces hydrologically open conditions and a short mean residence time of 103 days24. Despite its open hydrology, Martin Lake maintains persistent thermal stratifica-tion during the warm-season from April through November, which results in bottom water anoxia from March through December (Fig. S1)25. Also during the warm-season, biogenically mediated calcium carbonate is precip-itated in the lake’s upper water column, which under anoxic conditions results in the accumulation of rhythmi-cally repeating mm-scale couplets comprised of discrete detrital/organic matter and authigenic calcite laminae (Fig. S2).
Precipitation, Martin Lake Water and Authigenic Calcite δ18O. Event-based precipitation δ 18O meas-urements from Indianapolis, IN (n = 98) collected between December 2014 and November 2015 define a regional meteoric water line (RMWL) with a slope of 7.9 and y-intercept of 9.4, consistent with the global meteoric water line (GMWL; Fig. 2) 26. The unweighted annual δ 18Oprecip value of − 8.3‰ is similar to modeled annual average δ 18Oprecip for the region (− 8.1‰)27 and to the seasonally weighted annual δ 18Oprecip value (− 8.0‰) determined from back trajectory analysis of the event-based δ 18Oprecip measurements (discussed below). Surface and water column samples from Martin Lake (n = 44; average δ 18Olw = − 7.6‰) plot along the RMWL and are therefore consistent with meteoric waters (Fig. 2 and Table S1). Were Martin Lake influenced by evaporation, its surface waters would plot along the regional evaporation line (REL), which is defined by 449 surface water samples col-lected from lakes across Indiana between 2010 and 2015. Average Martin Lake δ 18Olw and δ Dlw are instead within 0.2‰ and 1.4‰ of their respective REL-RMWL intercept values (Table S1). The correspondence between Martin Lake surface water isotope values and the REL-RMWL intercept indicates that Martin Lake water reflects the regional average isotopic composition of precipitation for Indiana, which includes a large portion of the lower Ohio River valley.
Isotopic measurements of modern calcite from littoral vegetation at Martin Lake (− 8.4‰) are identical within error to predicted δ 18Ocal (− 8.5‰), given an average warm-season near-surface temperature of 18 °C25 and aver-age δ 18Olw of − 7.6‰. This indicates that authigenic calcite precipitates in equilibrium with Martin Lake surface water and thus that down-core measurements of δ 18Ocal can be used as a reliable proxy for past changes in regional δ 18Oprecip.
Modern δ18Oprecip Controls. Back trajectory and cluster analysis of the event-based precipitation samples were conducted with the US National Oceanic and Atmospheric Administration (NOAA) Hybrid Single-Particle Lagrangian Integrated Trajectories (HYSPLIT) model using the NOAA Global Data Assimilation System data28. Consistent with modern midcontinental climatology29, the results show that warm-season (Apr-Nov) rainfall accounts for 74.5% of mean annual precipitation and occurs mainly as discrete rainstorms when southerly mean atmospheric flow advects high δ 18Oprecip (− 5.5‰) from the Gulf of Mexico into the midcontinent (Fig. 3 and Table S1). Cold-season (Dec-Mar) precipitation accounts for 25.5% of annual totals and is sourced from Pacific
Figure 2. Hydrogen and oxygen isotope results for Indianapolis, IN, precipitation events (gray circles), Martin Lake, IN (red circles), Indiana lakes (light blue circles), and the White River, IN (green circles). The white box indicates the intersection between the REL and RMWL that defines average annual δ 18Oprecip for Indiana.

www.nature.com/scientificreports/
4Scientific RepoRts | 7:41628 | DOI: 10.1038/srep41628
and Arctic regions with characteristically low δ 18Oprecip (− 16.4‰), resulting in a moisture source δ 18O difference of 10.9‰. The average δ 18Oprecip, weighted to reflect warm and cold-season contributions, equals − 8.0‰. This is consistent with the REL-RMWL intercept, modeled δ 18Oprecip and average Martin Lake δ 18Olw, further supporting that Martin Lake δ 18Olw reflects regional climate.
Changes in the proportion of northerly and southerly moisture sources strongly affect δ 18Oprecip across the midcontinental US and are linked to the PNA30, the leading mode of continental US climate varia-bility on seasonal and longer timescales31. During negative (− ) PNA phases, the atmospheric circula-tion pattern increases midcontinental precipitation originating from 18O-enriched southerly moisture sources30–32, and reduces the amount of precipitation in the southwestern US. Conversely, during positive (+ ) PNA phases, the frequency of 18O-depleted northwesterly air mass incursions into the midcontinental US increases. As a result, the precipitation amount is reduced and δ 18Oprecip values are lower in the Midwest during + PNA phases, while portions of the western US become wetter. On decadal and longer timescales, the PNA is mod-ulated by the Pacific Decadal Oscillation (PDO)30,33, which is the multi-decadal, North Pacific expression of the El Niño-Southern Oscillation34, such that + PDO events are typically concurrent with a + PNA phase, and vice versa.
Relevant to this investigation, the strongest PNA-precipitation correlations in North America are located over Indiana and the central Mississippi and lower Ohio River valleys, with correlations (r) as high as − 0.71 (Fig. S4)32. Similar precipitation-PNA correlations (based on data from 1949 and 2015 CE) exist on seasonal (April-August) and annual timescales, demonstrating a consistent long-term PNA-hydroclimate relationship in the midconti-nental US (Figs 1 and S4). Paleoclimate records from the midcontinental US that can be linked to PNA variability are therefore useful for investigating regional hydroclimate patterns associated with this teleconnection and their relationship with Pre-Columbian Native American cultural changes.
Late Holocene Midcontinental Hydroclimate Variability. Continuous down-core δ 18Ocal meas-urements with a 5-year resolution from Martin Lake show considerable variability and a 12.5‰ range (Fig. 4). Temperature is unlikely to have contributed substantially to δ 18Ocal variability because the combined influence of temperature-controlled isotopic fractionation of liquid water in the air mass (+ 0.59‰ °C−1)26 and calcite from lake water (− 0.22‰ °C−1)35 would require an unrealistically large change in temperatures (e.g., a change of approximately 34 °C is needed to explain the full range). Instead, we contend that the 12.5‰ range in Martin Lake δ 18Ocal reflects mean state changes in the predominance of northerly and southerly moisture sources, which have an isotopic difference of 10.9‰ (Fig. 1). Because the PNA exerts strong control on regional midcontinen-tal δ 18Oprecip
30, we interpret periods with high δ 18Ocal to reflect sustained − PNA-like phases at Martin Lake, as well as over the central Mississippi and lower Ohio River valleys, leading to high δ 18Oprecip and δ 18Ocal values. Conversely, + PNA-like phases promoted cold-season-like northerly atmospheric flow over the midcontinental US, resulting in low δ 18Oprecip and δ 18Ocal values. This interpretation is supported by the strong correlation between Martin Lake δ 18Ocal and a reconstruction of the winter PNA index (wPNA) from 1725 to 1840 CE based on 12 tree-ring records from the continental US and Alaska36. The Martin Lake-wPNA δ 18O correlation (r = − 0.70,
Figure 3. Composite mean maps of (A) cold-season (Dec-Mar) and (B) warm-season (Apr-Nov) 850 hPa vector winds between 1949–2015 from the NCEP-NCAR reanalysis database. Arrows are wind directions with colored shading indicating velocity (m/s). Also plotted are mean back trajectories for cluster 1 (thick white line in A) and cluster 2 (thick red line in B) of the event-based Indianapolis, IN, precipitation samples. White squares are spaced at 24 hr intervals. White circles indicate the starting point from which back trajectories were calculated. The mean back trajectories are in good agreement with their respective seasonal atmospheric circulation patterns since 1949, indicating the precipitation back trajectories are representative of the modern climatological mean. Images provided by the NOAA/ESRL Physical Sciences Division, Boulder Colorado (http://www.esrl.noaa.gov/psd/).
www.nature.com/scientificreports/
5Scientific RepoRts | 7:41628 | DOI: 10.1038/srep41628
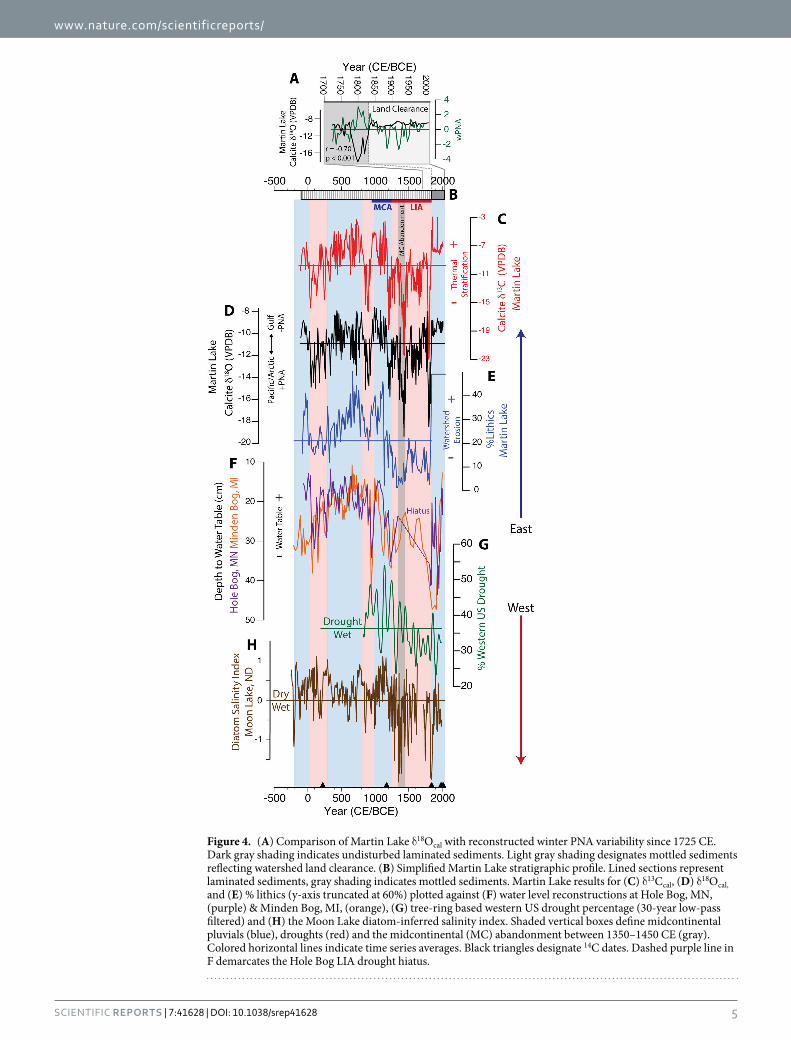
Figure 4. (A) Comparison of Martin Lake δ 18Ocal with reconstructed winter PNA variability since 1725 CE. Dark gray shading indicates undisturbed laminated sediments. Light gray shading designates mottled sediments reflecting watershed land clearance. (B) Simplified Martin Lake stratigraphic profile. Lined sections represent laminated sediments, gray shading indicates mottled sediments. Martin Lake results for (C) δ 13Ccal, (D) δ 18Ocal, and (E) % lithics (y-axis truncated at 60%) plotted against (F) water level reconstructions at Hole Bog, MN, (purple) & Minden Bog, MI, (orange), (G) tree-ring based western US drought percentage (30-year low-pass filtered) and (H) the Moon Lake diatom-inferred salinity index. Shaded vertical boxes define midcontinental pluvials (blue), droughts (red) and the midcontinental (MC) abandonment between 1350–1450 CE (gray). Colored horizontal lines indicate time series averages. Black triangles designate 14C dates. Dashed purple line in F demarcates the Hole Bog LIA drought hiatus.
www.nature.com/scientificreports/
6Scientific RepoRts | 7:41628 | DOI: 10.1038/srep41628
p < 0.001; Fig. 4) is similar to those of the modern PNA-precipitation relationship32, thus further supporting the use of down-core Martin Lake δ 18Ocal measurements as an indicator of synoptic-scale PNA-like variability. The Martin Lake record is strongly impacted by regional land clearance after the 1840 s37, with increased deposition from watershed erosion in response to deforestation and greater catchment discharge38. Therefore, the weakened post-1840 CE wPNA-Martin Lake δ 18Ocal correlation is interpreted to reflect a change in watershed hydrology as a result of large-scale land clearance, rather than a disconnect between δ 18Oprecip and the PNA. Nonetheless, high average δ 18Ocal at Martin after 1840 CE is in line with a generally negative PNA mean-state during the last two centuries36, and together with the strong pre-1840 correlation, supports interpreting down-core δ 18Ocal in terms of mean state changes in δ 18Oprecip related to PNA-like variability.
Changes in the relative contributions of moisture sources were estimated using a two-component δ 18Oprecip mixing model with end-member δ 18Oprecip values representing northwesterly (− 16.4‰; + PNA) and southerly (− 5.5‰; − PNA) moisture sources that were scaled to match past δ 18Ocal variability during specific time intervals (Tables S1 and S2). High δ 18Ocal between 950 and 1190 CE suggests that − PNA-like conditions prevailed at Martin Lake and over the central Mississippi and lower Ohio River valleys during the MCA, with southerly warm-season rainfall accounting for approximately 68% of annual precipitation during early population expansion among the Mississippian, Fort Ancient and Monongahela cultures (Fig. 4). Archaeological data show infrequent signs of warfare-related trauma and minimal construction of city center fortifications during this time, suggesting rela-tively low levels of conflict11,13. Decreasing δ 18Ocal between 1190–1250 CE marks a shift to + PNA-like conditions in the midcontinental US that persisted throughout the LIA. This time period was characterized by approxi-mately equal distributions of warm and cold-season precipitation and coincides with a rapid rise in fortification construction around Mississippian cities. Subsequently, an especially pronounced δ 18Ocal minimum between 1400–1470 CE marks the strongest + PNA-like phase of the last 2100 years, contemporaneous with the final abandonment of midcontinental Mississippian cities in the central Mississippi and lower Ohio River valleys. During this timeframe, midcontinental precipitation was largely from northerly cold-season sources (79%) and summer precipitation was substantially reduced. By 1500 CE, these same and related Mississippian populations were concentrated in the lower Mississippi River valley and interior of the Southeast where they encountered the Spanish during the 16th century11,20. Modern seasonal precipitation distributions were established after 1830 CE, as climate transitioned toward the current warm period (CWP; 1900 CE to present).
The strong covariance between Martin Lake δ 18Ocal and δ 13Ccal data (r = 0.81; p < 0.001; Fig. 4) supports the inferences on Pre-Columbian precipitation seasonality derived from the δ 18Ocal record alone. Prolonged warm-season thermal-stratification in midcontinental lakes similar to Martin Lake increases the sequestration of 13C-depleted organic matter in anoxic bottom water, leaving surface water enriched in 13C and resulting in high δ 13Ccal
39. Because midcontinental warm-season precipitation is dominated by southerly moisture sources with high δ 18O values, both δ 13Ccal and δ 18Ocal increase during extended warm-seasons39. The opposite occurs when climate is colder and moisture is predominantly sourced from northerly regions.
Prolonged stratification during the early expansion of late Pre-Columbian populations (950–1200 CE) indi-cates extended warmth that was associated with southerly sourced moisture. This is consistent with warmer Midwestern summers40 and above-average Northern Hemisphere temperatures41 during the MCA, suggesting the δ 13Ccal values reflect not only warmer temperatures at Martin Lake, but regionally across the midcontinental US (Fig. 5). In contrast, reduced stratification during the LIA when moisture was sourced from northerly regions indicates shorter warm-seasons, especially between 1400–1470 CE. These trends were associated with cooler Northern Hemisphere and Midwestern summer temperatures, supporting regionally cooler midcontinental tem-peratures during the LIA with peak cooling between 1400–1470 CE40 when the Vacant Quarter was established in the central Mississippi and lower Ohio River valleys (Fig. 5).
The concentration of lithic material (the inorganic clastic sediment fraction) in Martin Lake sediments (Fig. 4) provides a record of terrestrial erosion resulting from warm-season precipitation events critical for the non-irrigated maize agriculture practiced by the Mississippians and related late Pre-Columbian populations. Sediment delivery to Martin Lake occurs predominantly during the warm-season when the lake is ice-free and abundant rainfall from southerly derived rainstorms mobilizes watershed sediment. Greater warm-season precip-itation, i.e., more frequent rainstorm events, would therefore result in greater sediment delivery to Martin Lake; drier conditions would have the opposite effect. This interpretation is consistent with the co-occurrence of high lithic concentrations during the MCA when δ 18Ocal and δ 13Ccal values were also elevated, indicating enhanced warm-season rainfall and watershed erosion during warm, extended − PNA-like conditions. Conversely, low lithic abundances coincide with low δ 18Ocal and δ 13Ccal during the LIA, indicating reduced warm-season rainfall when cold-season conditions predominated under a more persistent + PNA-like mean state.
Although the lithics results are reflective of local precipitation over the Martin Lake watershed, they indicate changes in the frequency of southerly derived rainstorms, which follow trajectories that track over the central Mississippi and lower Ohio River valleys (Fig. 3). Changes in the frequency of these rainstorms therefore would impact areas along warm-season storm trajectories, including the central Mississippi and lower Ohio River val-leys. This is reflected in the modern relationship between midcontinental rainfall and the phase of the PNA (i.e., reduced during + PNA phases and increased during − PNA phases; Fig. 1)32. The Martin Lake lithics results there-fore suggest that regions which today experience increased warm-season precipitation during − PNA phases were wetter (i.e., more frequent southerly derived warm-season rainstorms) during the MCA, but drier during the LIA when + PNA-like conditions predominated. Minimum lithics concentrations between 1350–1450 CE during the strongest + PNA-like phase of the last 2100 years, indicate an especially pronounced PNA-related warm-season drought during the Mississippian abandonment of the midcontinent.
The occurrence of synchronous synoptic- and local-scale PNA-like hydroclimate variability in the midcon-tinental US suggested by the Martin Lake δ 18Ocal, δ 13Ccal and lithic data are supported by other regional paleo-climate records including amoeba testate water-table reconstructions from Minden (Michigan) and Hole Bog,

www.nature.com/scientificreports/
7Scientific RepoRts | 7:41628 | DOI: 10.1038/srep41628
MN (Mississippi headwaters; Fig. 4)42. These records, from locations that are today similarly affected by PNA variability, demonstrate generally elevated water tables during the MCA and CWP (− PNA). Conversely, water tables were lower at both sites during the LIA between 1250 and 1800 CE (+ PNA) with a depositional hiatus at Hole Bog during this time indicating a dry climate in the upper Mississippi watershed. These results are in good agreement with the Martin Lake record and indicate that midcontinental sites separated by as much as ~1000 km were similarly and synchronously affected by PNA-like hydroclimate variability during the MCA, LIA and CWP. This supports the synoptic-scale nature of the hydroclimate variability captured by the Martin Lake record and its extrapolation to adjacent regions in the central Mississippi and lower Ohio River valleys (~500 km from Martin Lake), where midcontinental Mississippians and related Pre-Columbian cultures were centered.
The strong evidence for regional midcontinental drought after 1250 CE contradicts assertions of a wetter LIA, and more specifically that suspected increases in flooding at Cahokia after 1200 CE were indicative of larger-scale flooding that contributed to the broader Mississippian abandonment of the midcontinent23. Cahokia’s location below the confluence of the Missouri and Mississippi Rivers complicates interpretations of flood records from this location, in that attribution to a specific river drainage is not possible, thus preventing any firm conclusion regard-ing the nature of climate change and the putative flood packages recorded in the American Bottom23. We there-fore suggest that if increased flooding did indeed occur at Cahokia after 1200 CE, it reflects increased discharge
Figure 5. PNA variability inferred from Martin Lake (A) δ 18Ocal (black) and δ 13Ccal (red) compared with (B) PDO and (C) Northern Hemisphere temperatures during the last 1500 years. (D) Martin Lake δ 13Ccal is compared with a multi-site pollen-based Midwestern summer temperature reconstruction, showing that thermal stratification closely follows regional temperature variability. Shaded boxes, horizontal lines and black triangles as defined in Fig. 4.
www.nature.com/scientificreports/
8Scientific RepoRts | 7:41628 | DOI: 10.1038/srep41628
from the Missouri River, for which the majority of the drainage basin is located in the western US. This assertion is consistent with records that indicate greater warm-season precipitation across much of the western US during the LIA, including the Missouri River drainage5,43,44, while midcontinental conditions were drier.
The PNA-like mean state changes in midcontinental hydroclimate variability identified in the Martin Lake and regional paleoclimate records are supported on a continental-scale by tree-ring drought reconstructions5, wild-fire histories44, and lake salinity43 records from the western US (Fig. 4). Regionally coherent western warm-season drought and increased fire occurrence during the MCA, when midcontinental records indicate pluvial conditions, mirrors modern east-west antiphased PNA-hydroclimate correlations (Fig. 1). The opposite conditions occurred during the LIA, consistent with a reversal in the US hydroclimate gradient. These paleo-climate inferences support the idea of a persistent east-west dipole pattern in warm-season precipitation across the continental US that closely resembles modern warm-season PNA-precipitation relationships and, further-more, that PNA-like hydroclimate variability has affected the distribution of pluvial and drought conditions on multi-decadal to centennial timescales during the last 2100 years.
Consistent with Pacific atmosphere-ocean modulation of the PNA and North American droughts, the PNA-like hydroclimate anomalies indicated by the Martin Lake and regional paleoclimate data largely track reconstructed PDO variability during the last 1500 years (r = 0.51, p < 0.01 for 15-yr moving averages of each time series; Fig. 5)4,33,41. Negative PNA-like mean states correspond to generally negative PDO-like conditions (the MCA) and vice versa (the LIA). The most prominent + PNA events recorded at Martin Lake (850–950, 1400–1470 and 1800–1820 CE) correspond to + PDO phases. Other δ 18Ocal minima (+ PNA) also correspond with + PDO events, but with differences in the δ 18Ocal response magnitude (Fig. 5).
Hydroclimate and Midcontinental Native American Cultural Trends. Late Pre-Columbian popula-tion growth between 1000 and 1200 CE was associated with extended warm-season conditions during the MCA that were accompanied by above average precipitation derived from southerly moisture sources (Fig. 6). These cli-matic conditions would have been favorable for the adoption of intensive swidden agriculture, maize in particular, which enabled population growth and sustained emerging population centers. This scenario is consistent with modeling results21 that demonstrate that early agriculture would have been positively impacted by increased pre-cipitation during late Pre-Columbian population expansion, when climatic conditions were favorable to growth and aggregation. An increased proportion of juveniles occurred in large skeletal assemblages from eastern North America dating to this timeframe45, suggesting elevated crude birth rates, consistent with more abundant and reliable food sources that positively impacted female reproductive ecology.
The widespread adoption of maize agriculture by midcontinental Native American populations during the early MCA is confirmed by a newly compiled regional database of human skeletal δ 13C comprised of more than 1300 individuals from across the eastern US that reflects dietary changes during the last 2300 years (Figs 6 and S5 and Table S3). An abrupt increase in human skeletal δ 13C from background values of − 20.3‰ (350 BCE to 950 CE) to − 15.9‰ between 950–1050 CE at sites across the Midwest and into Pennsylvania reflects a regional
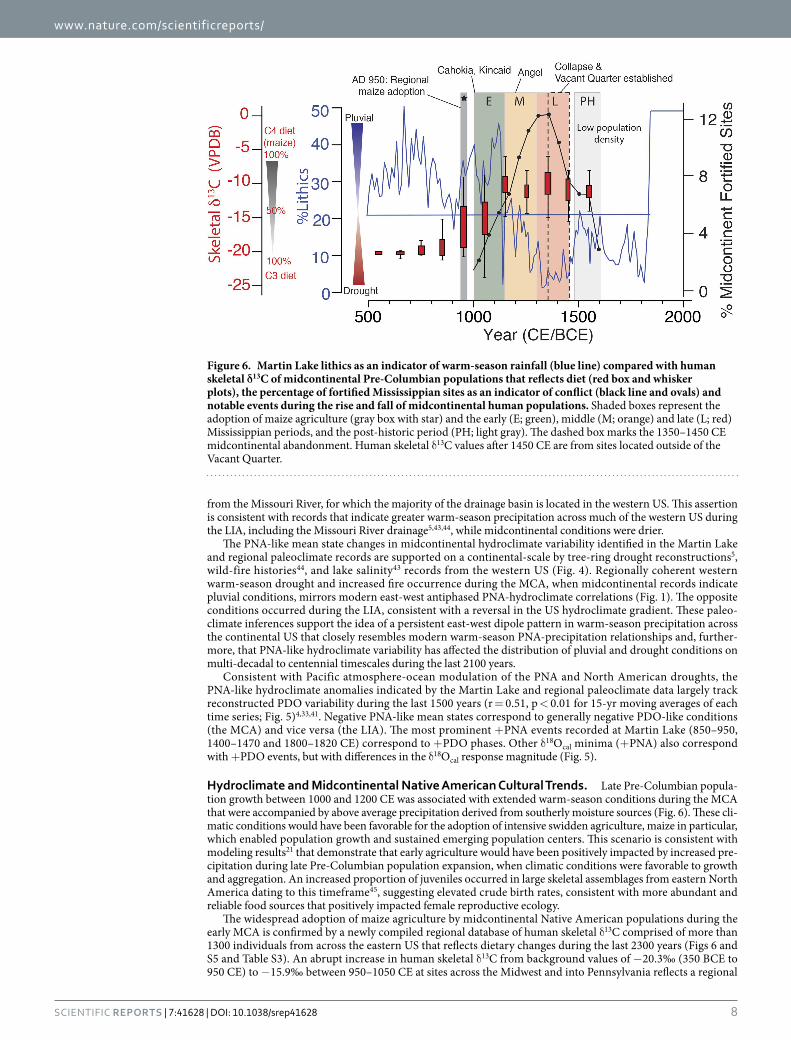
Figure 6. Martin Lake lithics as an indicator of warm-season rainfall (blue line) compared with human skeletal δ13C of midcontinental Pre-Columbian populations that reflects diet (red box and whisker plots), the percentage of fortified Mississippian sites as an indicator of conflict (black line and ovals) and notable events during the rise and fall of midcontinental human populations. Shaded boxes represent the adoption of maize agriculture (gray box with star) and the early (E; green), middle (M; orange) and late (L; red) Mississippian periods, and the post-historic period (PH; light gray). The dashed box marks the 1350–1450 CE midcontinental abandonment. Human skeletal δ 13C values after 1450 CE are from sites located outside of the Vacant Quarter.

www.nature.com/scientificreports/
9Scientific RepoRts | 7:41628 | DOI: 10.1038/srep41628
dietary change from one relying exclusively on C3 plants to one where 50% or more of protein was provided by C4 plants (i.e., maize)45. This supports the hypothesis that expanding populations, aggregation and social complexity were fueled by the rapid and widespread adoption of intensive maize agriculture between 950 and 1050 CE made possible by an opportune climate12,13.
The signatures of warfare and conflict, including skeletal trauma and active defensive features (i.e., palisades with bastions), increased markedly after 1150 CE across the midcontinent (Fig. 6)11. Consistent with the modeled climate-agriculture-population response12, these trends mirrored declining warm-season precipitation during the transition to the LIA, the very same period when maize consumption peaked among Native American popula-tions (i.e., human skeletal δ 13C values from − 10.3 to − 10.1‰ between 1150–1450 CE). As LIA aridity became the new mean climatic state, farmsteads and hamlets gave way to larger, aggregated villages in many major river val-leys, suggesting that safety superseded other necessities and constrained resource catchment areas18. In the central Illinois River valley, for example, several fortified villages show evidence for full-scale conflagration between 1200 and 1350 CE, alluding to frequent raiding and competition for declining resources. Furthermore, paleodemo-graphic analyses of skeletal samples from this region demonstrate an increasing age-specific risk of death that was particularly severe among reproductive-age Mississippian females, likely because pathogen loads and disease transmission were higher in “compact village life” conditions, which slowly eroded the reproductive ecology and sustainability of these villages46. The progressive collapse of Mississippian populations between 1350–1450 CE coincides with exceptionally severe warm-season drought and extended cold-seasons. Shorter and drier growing seasons during this time would have significantly reduced agricultural yields, thereby contributing to intensified resource-related conflict that ultimately undermined the socio-political fabric and population dynamics of mid-continental Mississippian societies10–13,22.
Native American populations in the upper Ohio River Valley associated with the Monongahela and Fort Ancient cultures, as well as Mississippian groups in the southeastern and eastern US, persisted after depopulation in the lower Ohio and central Mississippi River valleys. While it is not clear exactly how these populations in the upper Ohio River Valley persevered through the LIA-associated drought episodes, the spatial and temporal patterning of settlements indicate that they were less ubiquitous after 1500 CE, with significant buffer zones between communities18,20. There are also indications that Fort Ancient villages shifted from year-round to sea-sonal occupation during the LIA, with an increased emphasis on hunting, including bison, to potentially cope with food production shortfalls and reduced maize consumption17,47. These smaller, constrained populations may have persevered due to 1) local climatic conditions, 2) a reduced population size that could be supported by floodplain agriculture alone, or 3) local socio-political autonomy that was more resilient and responsive to drought-induced resource stress. In the southeastern and eastern US (e.g., New York, the Ontario Peninsula, and regions along the east coast and lower drainages of the Delaware and Susquehanna Rivers), the persistence and even thriving, of Native American populations during and following the midcontinental abandonment20 is consistent with a decreasing PNA influence on climate with increasing distance from the Ohio River Valley32, as illustrated by the attenuated variability in paleoclimate records spanning the last millennium as compared with the Martin Lake results48–50.
ConclusionsThe emergence and expansion of Mississippian and related populations of the midcontinental US after 1000 CE was associated with the adoption of intensive maize agriculture under favorable climatic conditions with extended warm-seasons and above average midcontinental rainfall during the MCA when a − PNA-like climate phase predominated. In contrast, Mississippian socio-political systems show evidence for increased stress and conflict during the transition to the LIA as the PNA switched to a more positive phase and midcontinental sum-mer precipitation was significantly reduced. Following this pattern, the ultimate abandonment of urban centers across the lower Ohio and central Mississippi River valleys between 1350–1450 CE was associated with sustained drought. These climatic-archaeological associations support the idea that although socio-political dynamics were likely an important factor in midcontinental Native American cultural changes during the last millennium, back-ground climatic conditions set the stage for cultural change and the movement of peoples by either favoring or discouraging the stability of large agriculturally based midcontinental Native American populations and associ-ated socio-political systems.
MethodsCore collection and processing. Ten surface and long sediment cores were retrieved from Martin Lake’s profundal zone between May and October 2013 using a modified Livingstone piston corer, a modified surface piston corer and freeze corer51,52. Core segments were overlapped by 30 to 50 cm to ensure complete recovery. All cores were transported to the IUPUI Paleoclimatology and Sedimentology Laboratory where they were stored at 4 °C. After being split into archive and work halves, cores were imaged using a GeoTek Multi Sensor Core Logger under cross-polarized LED lighting.
Sediment characterization. X-ray diffraction (XRD) and scanning electron microscope (SEM) analysis was conducted on six samples from core D13 Drive 1: 4–4.5, 54–54.5; Drive 2: 54.0–54.5; Drive 3: 34.0–34.5, 84.0–84.5; and Drive 4: 64.0–64.5 at the IUPUI Integrated Nanosystems Development Institute. Powdered XRD analysis was conducted using a Siemens (now Bruker) D5000. A JEOL 7800 F field emission SEM was used to characterize carbonate crystal morphology.
Age control. Accelerator mass spectrometry (AMS) radiocarbon (14C) ages were determined for eight sam-ples comprised of charcoal fragments or terrestrial plant material at the University of California Irvine (UCI) Keck Carbon Cycle AMS Facility (Table S4). Samples were collected using a binocular microscope, mechanically
www.nature.com/scientificreports/
1 0Scientific RepoRts | 7:41628 | DOI: 10.1038/srep41628
cleaned and pretreated with an acid-base-acid wash (1 N HCl and 1 N NaOH) following UCI protocols. AMS 14C ages were calibrated to common era and before common era years (CE/BCE) using the online application CALIB53. The online application CALIBomb was used for sample UCIAMS# 132273 because it contained excess 14C54. The age-depth model was created by fitting a 4th order polynomial to radiocarbon ages below 16 cm and a linear age model on two age control points above this depth (one 14C ages and the modern surface water interface of 2013 CE; Fig. S6).
Carbonate δ18O and δ13C analysis. Sediments were sampled continuously at 0.5 cm intervals for calcite oxygen and carbon isotope analysis (δ 18Ocal and δ 13Ccal). Calcite was isolated following standard proceedures55 and measured at the IUPUI Stable Isotope Biogeochemistry Laboratory on a MAT 252 isotope ratio mass spectrome-ter coupled with a GasBench II system after reaction with 100% phosphoric acid at 70 °C. Results are reported in delta notation and normalized relative to Vienna Pee Dee Belemnite (VPDB) using the international standards NBS-18, NBS-19 and IAEA CO-9 with 0.1‰ precision for δ 18O and δ 13C.
Percent Lithics. Approximately 1.0 g of wet sediment was collected at 1 cm intervals for grain size analysis. Following Gray et al.56, samples were dried at 60 °C for 24 hr, weighed, and then soaked for 24 hr in a 25 mL ali-quot of 30% H2O2 at room temperature to begin the process of removing organic material. Three to five additional 20 mL aliquots of 30% H2O2 were applied at 65 °C, followed by a rinse with DI water. Biogenic silica was removed by soaking samples in a 20 mL 1 N NaOH solution for 8 hr at 60 °C while carbonates were digested with a 1 N HCL solution for 1 hr at room temperature. Following these treatments, samples were freeze-dried and weighed again to calculate the abundance of lithic and mineral fragments (% lithics).
Meteoric and surface water isotope measurements. Precipitation events > 0.02 mm between 12/1/2014 and 11/30/2015 (n = 98) were collected in Indianapolis, IN, using an evaporation free system modified from57. Samples were collected in Indianapolis instead of at Martin Lake because the daily collection schedule required supervision that was not possible at the lake site. The annual average isotopic differences in δ 18Oprecip and δ Dprecip between Indianapolis and Martin Lake are small, however (0.5 and 6‰, respectively), supporting the regional application of our results from Indianapolis. The strong agreement between Martin Lake δ 18Olw and δ Dlw and Indiana δ 18Oprecip and δ Dprecip based on the former’s correspondence with the RMWL and REL additionally supports the regional similarity of the δ 18Oprecip signal captured in Indianapolis and at Martin Lake.
River water samples for δ 18O and δ D analysis were collected at least monthly from the White River, IN, (n = 29) between 11/14/2014 and 11/30/2015. The White River runs through Indianapolis, IN, and drains a watershed measuring 3265 km2. Water samples from natural lakes, reservoirs and impoundments across Indiana collected by the Indiana Clean Lakes Project at Indiana University between May 2010 and August 2015 were also analyzed for δ 18O and δ D (n = 449).
Water column samples for δ 18Olw and δ Dlw analysis were collected from Martin Lake in May, September, and October 2013. Simultaneous water column measurements of temperature (°C) and dissolved oxygen (DO mg/L) were obtained at 1 m intervals using a Hydrolab MS5. Water samples from May 2013 were collected at 3 m inter-vals from 0 to 16 m while those in September and October were collected at 1 m intervals from 0 to 16 m. Surface water samples from Martin Lake were additionally collected from June-September 2015 and in January 2016.
All water samples were analyzed at IUPUI for δ 18O and δ D using a Picarro L2130-i Analyzer coupled to an autosampler and high-precision water vaporizer unit. Measurements were corrected for memory and drift fol-lowing the methodology of Gröning et al.58. Final values were corrected to the VSMOW scale using calibrated standards from Los Gatos. Precision for δ 18O and δ D is 0.1 and 0.6‰, respectively.
Precipitation back trajectory analysis. Back trajectory analysis of the Indianapolis, IN, precipita-tion events (n = 98) was conducted with the US National Oceanic and Atmospheric Administration’s Hybrid Single-Particle Lagrangian Integrated Trajectories (HYSPLIT) model using Global Data Assimilation System (GADS) data. Back trajectories were initiated at 1500 m above ground level and calculated for the 72 hours prior to the precipitation event. Cluster analysis of the back trajectories was conducted with the HYSPLIT software.
Estimating past moisture source mixing. Variations in the contribution of northerly and southerly moisture sources to mean annual δ 18Oprecip were calculated for specific periods of interest using a simple binary mixing model:
= − − ∗X (C C )/(C C ) 1001 mix 2 1 2
where X1 is the proportion of end-member 1 in annual average δ 18Oprecip (in percent), C1 is the δ 18Oprecip value of end-member 1, C2 is the δ 18Oprecip value of end-member 2, and Cmix is the resulting annual average δ 18Oprecip (Tables S1 and S2).
End-member δ 18Oprecip values were set using the precipitation event cluster analysis with warm-season δ 18Oprecip representing end-member 1 (C1 = − 5.5‰) and cold-season δ 18Oprecip representing end-member 2 (C2 = − 16.4‰). For Cmix, δ 18Olw was used as a proxy for δ 18Oprecip given the close modern relationship between these variables. Average δ 18Olw was back calculated from δ 18Ocal using an average warm-season calcite precipitation temperature of 18 °C35. Changes in the temperature of calcite precipitation by ± 2 °C equate to ± 0.5‰ for δ 18Olw and ± 5% for proportional changes in seasonal moisture source contributions to estimated mean annual δ 18Oprecip.
Human skeletal carbon isotopes. Proxy δ 13C data on the incorporation of maize into the diet and sub-sistence systems of indigenous midcontinental populations from the middle to late Holocene were compiled
www.nature.com/scientificreports/
1 1Scientific RepoRts | 7:41628 | DOI: 10.1038/srep41628
from 28 sources, representing 1,303 individuals geographically spanning the Missouri, Mississippi, and Illinois River valley eastward through the Ohio River drainage system and southern Great Lakes (references in sup-plemental materials; Table S3). This dataset was supplemented by ongoing isotopic and geochemical research on the ~1725 BP skeletal assemblage from Mann site 12Po2, a Middle Woodland archaeological site in south-western Indiana. Where available, direct radiometric assays on bone collagen were recalibrated in OxCal 4.2. In instances where direct radiocarbon dates for interments were not obtained, the published chronometric dates for the archaeological site were recalibrated to develop a summed probability of site occupation. The median date for the individual or site was then used to calculate the age before present (BP; present = 1950 CE). One-hundred year, time-transgressive boxplots from 2300 to 300 BP were subsequently created to plot against the hydroclimate proxy measures and archaeological record of midcontinental fortifications.
Data Availability. All original data is archived with the NOAA Paleoclimatology Database (https://www.ncdc.noaa.gov/paleo/study/21061).
References1. Bocquet-Appel, J.-P. When the world’s population took off: the springboard of the Neolithic demographic transition. Science 333,
560–561 (2011).2. Kennett, D. J. & Marwan, N. Climatic volatility, agricultural uncertainty, and the formation, consolidation and breakdown of
preindustrial agrarian states. Phil. Trans. R. Soc. A 373, 20140458 (2015).3. Meeks, S. C. & Anderson, D. G. In Soils, Climate and Society: Archaeological Investigations in Ancient America (eds John D Wingard
& Sue Eileen Hayes) Ch. 3, 61–84 (University Press of Colorado, 2013).4. Graham, N. E. et al. Tropical Pacific–mid-latitude teleconnections in medieval times. Clim. Change 83, 241–285 (2007).5. Cook, E. R., Woodhouse, C. A., Eakin, C. M., Meko, D. M. & Stahle, D. W. Long-term aridity changes in the western United States.
Science 306, 1015–1018 (2004).6. deMenocal, P. B. Cultural responses to climate change during the late Holocene. Science 292, 667–673 (2001).7. Benson, L. V. et al. Possible impacts of early-11th-, middle-12th-, and late-13th-century droughts on western Native Americans and
the Mississippian Cahokians. Quat. Sci. Rev. 26, 336–350 (2007).8. Benson, L., Petersen, K. & Stein, J. Anasazi (pre-Columbian Native-American) migrations during the middle-12th and late-13th
centuries – Were they drought induced? Clim. Change 83, 187–213, doi: 10.1007/s10584-006-9065-y (2007).9. Schwindt, D. M. et al. The social consequences of climate change in the central Mesa Verde region. Am. Antiq. 81, 74–96 (2016).
10. Krus, A. Timing and tempo of pre-Columbian militarization in the US Midwest and Southeast. Am. Antiq. 81, 375–388 (2016).11. Milner, G. R., Chaplin, G. & Zavodny, E. Conflict and societal change in late Prehistoric eastern North America. Evolutionary
Anthropology: Issues, News, and Reviews 22, 96–102 (2013).12. Nolan, K. C. & Cook, R. A. An evolutionary model of social change in the Middle Ohio Valley: Was social complexity impossible
during the late woodland but mandatory during the late prehistoric? Journal of Anthropological Archaeology 29, 62–79 (2010).13. Milner, G. The Cahokia Chiefdom: The Archaeology of Mississippian Society. 216 (Smithsonian Institution Press, 1998).14. Pauketat, T. R. Ancient Cahokia and the Mississippians. 236 (Cambridge University Press, 2004).15. Delcourt, P. A. & Delcourt, H. R. Prehistoric Native Americans and ecological change: human ecosystems in eastern North America
since the Pleistocene. (Cambridge University Press, 2004).16. Bureau, U. S. S. (ed United States Census Bureau) (U.S. Government Printing Office, Washington, DC, 2012).17. Drooker, P. B. & Cowan, C. W. Transformation of the Fort Ancient cultures of the central Ohio Valley. Societies in Eclipse:
Archaeology of the Eastern Woodlands Indians, AD 1400, 1700 (2001).18. Milner, G. R., Anderson, D. G. & Smith, M. T. The distribution of Eastern Woodlands peoples at the prehistoric and historic interface.
9–18 (Smithsonian Institution Press, 2001).19. Williams, S. Vacant Quarter and other late events in the Lower Valley. 170–180 (University of Alabama Press, 1990).20. Milner, G. R. & Chaplin, G. Eastern North American population at ca. AD 1500. Am. Antiq. 75, 707–726 (2010).21. Benson, L. V., Pauketat, T. R. & Cook, E. R. Cahokia’s boom and bust in the context of climate change. Am. Antiq. 74, 467–483
(2009).22. Schroeder, S. Understanding variation in prehistoric agricultural productivity: the importance of distinguishing among potential,
available, and consumptive yields. Am. Antiq. 66, 517–525 (2001).23. Munoz, S. E. et al. Cahokia’s emergence and decline coincided with shifts of flood frequency on the Mississippi River. PNAS 112,
6319–6324 (2015).24. New, J. F. Oliver, Olin, and Martin Lakes diagnostic study La Grange County, Indiana. 280 (2009).25. Wetzel, R. Productivity investigations of interconnected marl lakes (I). The eight lakes of the Oliver and Walters Chains, northeastern
Indiana. Hydrobiological Studies 3, 91–143 (1973).26. Rozanski, K., Araguas-Araguas, L. & Conginatine, R. Isotopic patterns in modern global precipitation. In Climate Change in
Continental isotopic Records. Geophys. Monogr. 78, 1–36 (1993).27. Bowen, G. J. & Wilkinson, B. Spatial distribution of δ ¹⁸O in meteoric precipitation. Geology 30, 315–318 (2002).28. Stein, A. F. et al. NOAA’s HYSPLIT atmospheric transport and dispersion modeling system. Bull. Am. Meteorol. Soc. 96, 2059–2077,
doi: http://dx.doi.org/10.1175/BAMS-D-14-00110.1 (2015).29. Andresen, J., Hilberg, S., Kunkel, K. & Center, M. R. C. Historical climate and climate trends in the Midwestern USA. US National
Climate Assessment Midwest Technical Input Report. 1–18 (2012).30. Liu, Z., Yoshmura, K., Bowen, G. J. & Welker, J. M. Pacific–North American teleconnection controls on precipitation isotopes (δ 18O)
across the contiguous United States and adjacent regions: A GCM-based analysis. J. Clim. 27, 1046–1061 (2014).31. Leathers, D. J., Yarnel, B. & Plalecki, M. A. The Pacific/North American teleconnection pattern and the United States climate. Part I:
Regional temperature and precipitation associations. J. Clim. 4, 517–528 (1991).32. Coleman, J. S. & Rogers, J. C. Ohio River Valley winter moisture conditions associated with the Pacific-North American
teleconnection pattern. J. Clim. 16, 969–981 (2003).33. Yu, B. & Zwiers, F. W. The impact of combined ENSO and PDO on the PNA climate: a 1,000-year climate modeling study. Clim. Dyn.
29, 837–851 (2007).34. Shakun, J. D. & Shaman, J. Tropical origins of North and South Pacific decadal variability. Geophys. Res. Lett. 36, L19711 (2009).35. Kim, S.-T. & O’Neil, J. R. Equilibrium and nonequilibrium oxygen isotope effects in synthetic carbonates. Geochim. Cosmochim.
Acta 61, 3461–3475 (1997).36. Trouet, V. & Taylor, A. H. Multi-century variability in the Pacific North American circulation pattern reconstructed from tree rings.
Clim. Dyn. 35, 953–963, doi: 10.1007/s00382-009-0605-9 (2010).37. Williams, A. S. Late-glacial-postglacial vegetational history of the Pretty Lake region, northeastern Indiana. Report No. 2330-7102,
(US Govt. Print. Off., 1974).

www.nature.com/scientificreports/
1 2Scientific RepoRts | 7:41628 | DOI: 10.1038/srep41628
38. Bosch, J. M. & Hewlett, J. A review of catchment experiments to determine the effect of vegetation changes on water yield and evapotranspiration. J. Hydrol. 55, 3–23 (1982).
39. Drummond, C. N., Patterson, W. P. & Walker, J. C. Climatic forcing of carbon-oxygen isotopic covariance in temperate-region marl lakes. Geology 23, 1031–1034 (1995).
40. Viau, A., Gajewski, K., Sawada, M. & Fines, P. Millennial‐scale temperature variations in North America during the Holocene. Journal of Geophysical Research: Atmospheres 111 (2006).
41. Mann, M. E. et al. Global signatures and dynamical origins of the Little Ice Age and Medieval Climate Anomaly. Science 326, 1256–1260 (2009).
42. Booth, R. K., Notaro, M., Jackson, S. T. & Kutzbach, J. E. Widespread drought episodes in the western Great Lakes region during the past 2000 years: geographic extent and potential mechanisms. Earth Planet. Sci. Lett. 242, 415–427 (2006).
43. Laird, K. R., Fritz, S. C. & Cumming, B. F. A diatom-based reconstruction of drought intensity, duration, and frequency from Moon Lake, North Dakota: a sub-decadal record of the last 2300 years. J. Paleolimnol. 19, 161–179 (1998).
44. Marlon, J. R. et al. Long-term perspective on wildfires in the western USA. PNAS 109, E535–E543 (2012).45. Boutton, T., Klein, P., Lynott, M., Price, J. & Tieszen, L. In Stable isotopes in nutrition 191–204 (American Chemical Society, 1984).46. Wilson, J. J. Paradox and promise: Research on the role of recent advances in paleodemography and paleoepidemiology to the study
of “health” in Precolumbian societies. Am. J. Phys. Anthropol. 155, 268–280, doi: 10.1002/ajpa.22601 (2014).47. Cook, R. A. & Price, T. D. Maize, mounds, and the movement of people: isotope analysis of a Mississippian/Fort Ancient region.
Journal of Archaeological Science 61, 112–128 (2015).48. Kirby, M. E., Mullins, H. T., Patterson, W. P. & Burnett, A. W. Lacustrine isotopic evidence for multidecadal natural climate
variability related to the circumpolar vortex over the northeast United States during the past millennium. Geology 29, 807–810 (2001).
49. Zhao, C., Yu, Z., Ito, E. & Zhao, Y. Holocene climate trend, variability, and shift documented by lacustrine stable-isotope record in the northeastern United States. Quat. Sci. Rev. 29, 1831–1843 (2010).
50. Mandl, M. B., Shuman, B. N., Marsicek, J. & Grigg, L. Estimating the regional climate signal in a late Pleistocene and early Holocene lake-sediment δ 18O record from Vermont, USA. Quat. Res (2016).
51. Cushing, E. J. & Wright Jr, H. Hand-operated piston corers for lake sediments. Ecology 46, 380–384 (1965).52. Wright, H. E., Mann, D. H. & Glaser, P. H. Piston corers for peat and lake sediments. Ecology 65, 657–659 (1984).53. Reimer, P. J. et al. IntCal09 and Marine09 radiocarbon age calibration curves, 0–50,000 years cal BP. Radiocarbon 51, 1111–1150
(2009).54. Reimer, P. J., Brown, T. A. & Reimer, R. W. Discussion: reporting and calibration of post-bomb 14C data. Radiocarbon 46, 1299–1304
(2004).55. Bird, B. W., Abbott, M. B., Rodbell, D. T. & Vuille, M. Holocene tropical South American hydroclimate revealed from a decadally
resolved lake sediment δ 18O record. Earth Planet. Sci. Lett. 310, 192–202, doi: 10.1016/j.epsl.2011.08.040 (2011).56. Gray, A. B., Pasternack, G. B. & Watson, E. B. Hydrogen peroxide treatment effects on the particle size distribution of alluvial and
marsh sediments. The Holocene 20, 293–301, doi: 10.1177/0959683609350390 (2010).57. Gröning, M. et al. A simple rain collector preventing water re-evaporation dedicated for δ 18O and δ 2H analysis of cumulative
precipitation samples. J. Hydrol. 448, 195–200 (2012).58. Geldern, R. & Barth, J. A. Optimization of instrument setup and post‐run corrections for oxygen and hydrogen stable isotope
measurements of water by isotope ratio infrared spectroscopy (IRIS). Limnology and Oceanography: Methods 10, 1024–1036 (2012).
AcknowledgementsThis work was supported by funding from an Indiana University Collaborative Research Grant from IUPUI and a Research Support Funds Grant from Indiana University. G. William Monaghan, Gabriel Filippelli, John Southon, Christopher Lapish, Thomas Lowell and Malkah Bird are recognized for their support and contributions to this work. We also thank editor Karl Kreutz and two anonymous reviewers for strengthening this work.
Author ContributionsB.W.B., J.J.W. and W.P.G. designed and implemented the study. B.W.B., J.J.W., W.P.G., L.S. contributed to sample collection, data production, synthesis. B.A.S. contributed to data synthesis and interpretation. All authors contributed to writing the paper in the order listed.
Additional InformationSupplementary information accompanies this paper at http://www.nature.com/srepCompeting financial interests: The authors declare no competing financial interests.How to cite this article: Bird, B. W. et al. Midcontinental Native American population dynamics and late Holocene hydroclimate extremes. Sci. Rep. 7, 41628; doi: 10.1038/srep41628 (2017).Publisher's note: Springer Nature remains neutral with regard to jurisdictional claims in published maps and institutional affiliations.
This work is licensed under a Creative Commons Attribution 4.0 International License. The images or other third party material in this article are included in the article’s Creative Commons license,
unless indicated otherwise in the credit line; if the material is not included under the Creative Commons license, users will need to obtain permission from the license holder to reproduce the material. To view a copy of this license, visit http://creativecommons.org/licenses/by/4.0/ © The Author(s) 2017