mid-year - tax foundation
TRANSCRIPT

Mid-Year Update
MID-YEARRevenue Update
Commonwealth of Pennsylvania
January 29, 2018

Mid-Year Update
Three parts. Economic forecast: upward revisions due to recent data and tax reform. Federal tax cut: economic and General Fund impact. Revenues: FY 17-18 update; preliminary look at FY 18-19.
Public presentation later today. Rachel Carson Building at 2:30. Presentation to be posted to IFO website.
29.Jan.2018 2
Welcome to the IFO Mid-Year Update

Mid-Year Update29.Jan.2018 3
Annual Growth Rates or Change2016 2017 2018 2019
Real GDPJun 2017 1.1% 1.8% 1.9%Jan 2018 0.6% 2.0% 2.3% 2.3%
Wages-SalariesJun 2017 2.8% 3.7% 3.8%Jan 2018 1.3% 3.9% 4.3% 4.2%
Philadelphia CPI-UJun 2017 0.6% 2.0% 2.0%Jan 2018 0.6% 1.3% 2.3% 2.2%
Employment (000s)Jun 2017 52.2 54.4 52.5Jan 2018 52.2 60.4 61.8 60.1
Note: Real GDP and Wage data revised for 2016. Wage growth for 2017 based on withholding trends through December.Source: Historical data from U.S. Bureau of Economic Analysis and U.S. Bureau of Labor Statistics. Forecasts by IFO.
PA Economic Forecast Revisions
Final Preliminary Projection

Mid-Year Update29.Jan.2018 4
United States 2017.1 2017.2 2017.3 2017.4Real GDP 1.2% 3.1% 3.2% 2.6%
Personal Consumption 1.9% 3.3% 2.2% 3.8%Domestic Investment -1.2% 3.9% 7.3% 3.6%Government Expenditures -0.6% -0.2% 0.7% 2.9%
Corporate Domestic Profits 0.5% 6.2% 3.1% n.a.
PennsylvaniaReal GDP 0.3% 2.5% 3.2% n.a.Home Price Index 4.3% 4.6% 4.3% n.a.Philadelphia CPI-U 2.1% 1.0% 1.4% 0.8%Net Job Gains (000s) 68.9 57.2 69.8 70.2
Note: Real GDP and components are quarterly annualized rates. All others are year-over-year. Job gains represent annual rate of net job creation. All data except CPI-U are preliminary and subject to revision. Sources: U.S. Bureaus of Labor Statistics and Economic Analysis.
Recent Economic Trends

Mid-Year Update29.Jan.2018 5
2014 2015 2016 2017Mining-Logging 1.7 -3.8 -9.0 -1.2Construction 4.8 6.5 3.7 7.0Manufacturing 3.0 0.0 -9.3 -5.8Wholesale-Retail 2.8 1.0 -2.7 -4.1Transportation 7.4 11.2 9.0 6.5Professional Services 13.3 18.0 14.4 17.8Healthcare-Social 14.3 11.2 23.7 24.6Leisure-Hospitality 5.1 7.5 13.1 17.9State-Federal Govt -2.0 0.3 0.9 -2.0Local Government -7.3 -6.8 -0.9 -1.8All Other Sectors 4.3 1.5 9.3 7.7Total Job Gains 47.4 46.7 52.2 66.5Note: Figures represent change in average level for calendar year. Figure listed on PA Economic Forecast slide assumes that 2017 value will be revised down. Source: U.S. Bureau of Labor Statistics. Data for 2017 are preliminary and will be revised.
PA Employment Growth (000s)

Mid-Year Update
Federal Tax Changes
29.Jan.2018 6

Mid-Year Update
Changes to U.S. corporate net income tax. Lower rate and repatriations: higher PA cap gains, dividends, wages. 100% bonus depreciation (and corporate tax bulletin 2017-02). Eliminate/limit deductions: broadens PA tax base.
Changes to U.S. personal income tax. More disposable income: higher PA consumer spending (sales tax). Boost to PA capital gains and dividends forecast (income tax). Indirect effect: more consumer spending increases income.
29.Jan.2018 7
Federal Changes Impact PA General Fund

Mid-Year Update29.Jan.2018 8
Impact of Tax Change for SinglesWage
IncomeNumber Children
Itemized Deductions Change in Tax PaidStatus SALT Other Dollar PercentSingle $40,000 0 n.a. n.a. -$756 -19.3%Single 80,000 0 n.a. n.a. -2,091 -16.1%Single 80,000 0 $8,500 $11,500 -476 -5.0%Single 120,000 0 11,250 12,750 -926 -5.0%Single 180,000 0 14,000 14,000 -2,511 -7.3%Single 300,000 0 23,000 19,000 149 0.2%
Notes: Itemized deductions based on IRS tabulations for PA for tax year 2015. SALT is the state and local tax deduction for income (or sales) and property taxes. For PA, roughly 14% of taxpayers with AGI of $40,000 claimed an itemized SALT deduction. For AGI of $300,000, roughly 93% claimed the deduction. Simulation includes impact of EITC.Source: Tax Policy Center at http://tpc-tax-calculator.urban.org/.

Mid-Year Update29.Jan.2018 9
Impact of Tax Change for MarriedWage
IncomeNumber Children
Itemized Deductions Change in Tax PaidStatus SALT Other Dollar PercentMarried $40,000 2 n.a. n.a. -$1,417 refundMarried 80,000 2 n.a. n.a. -2,269 -49.2%Married 80,000 2 $8,500 $11,500 -1,219 -34.3%Married 150,000 2 12,500 13,000 -2,683 -14.7%Married 300,000 2 23,000 19,000 -9,278 -15.8%Married 600,000 2 44,500 25,500 -8,397 -5.3%
Notes: Itemized deductions based on IRS tabulations for PA for tax year 2015. SALT is the state and local tax deduction for income (or sales) and property taxes. For PA, roughly 14% of taxpayers with AGI of $40,000 claimed an itemized SALT deduction. For AGI of $300,000, roughly 93% claimed the deduction. Simulation includes impact of EITC and assumes children under age 17.Source: Tax Policy Center at http://tpc-tax-calculator.urban.org/.

Mid-Year Update29.Jan.2018 10
Two Estimates of Federal Tax CutFFY 2018-19 ($ billions)
Joint Committee U Penn WhartonIndividuals and Pass Throughs -$188.8 -$168.5Corporate - lower rate, broaden base -133.8 -129.2Corporate - tax on foreign profits 42.6 40.5Total Tax Cut -280.0 -257.2
All Individual and Pass Throughs -188.8 -168.5One-Third Net Corporate -30.4 -29.5Tax Cut Realized -219.2 -198.1
Estimated PA Share 3.5% 3.5%Increase PA Disposable Income 7.7 6.9
Note: Corporations use revenues from the tax cut to (1) pay dividends, (2) repurchase shares, (3) purchase equipment/structures, (4) pay workers, (5) pay down debt, (6) reduce prices or (7) simply retain the funds. The computation assumes that one-third of the tax cut in the first full fiscal year will flow through to individuals as higher dividends, capital gains or wages. Excludes indirect (dynamic) effects of tax cuts, which would manifest in later years.

Mid-Year Update
Most estimates assume $1.8 trillion tax cut over 10 years. This is a "static" estimate that does not include dynamic effects. The dynamic effect is the offsetting revenue from a larger economy.
29.Jan.2018 11
Economic Impact of Federal Tax Cut
Total Tax Cut Dynamic Extra Real GDP GrowthFFY 2018-27($ billions)
OffsetFFY 2018-27
OnlyCY 2018
Cumulative toCY 2027
Joint Committee -$1,770 26.4% 0.9% 0.7%Tax Policy Center -$1,770 12.8% 0.8% 0.0%U Penn Wharton -$2,296 13.4% 0.8% 0.8%IHS Markit -$1,770 n.a. 0.1% 0.6%Tax Foundation -$1,783 69.5% 0.5% 3.4%Note: Figures exclude the budget impact from eliminating the ACA individual mandate. JCT estimates that provision reduces outlays by $297 billion and reduces debt by $314 billion over ten years. Sources: Supporting documentation may be found at entity websites.

Mid-Year Update
Reduce federal tax rate from 35% to 21% (2018 and later). Shift income out, accelerate deductions into 2017. Pay down debt. FY 17-18: -$100 million | FY 18-19: +$20 million.
Federal 100% bonus depreciation (full expensing). Conformity: ~-$500 to -$600 million combined FY 17-18 + FY 18-19. Corp Revenue Bulletin 2017-02: decouples and denies deductions. FY 17-18: +$50 million | FY 18-19: +$160 million.
Eliminate/limit certain deductions (broaden tax base). Eliminate Section 199 deduction. Limit interest deduction. FY 17-18: +$40 million | FY 18-19: +$160 million.
29.Jan.2018 12
Corporate Net Income Tax Detail

Mid-Year Update
Pennsylvania does not use federal tax base. Main impact: consumers have more disposable income. Options: spend, save or pay down debt. Occurs with delay. IHS Markit assumes 6 months.
Sales tax: gain from higher disposable income and spending. FY 17-18: +$10-$20 million | FY 18-19: +$60-$80 million.
Income tax: direct and indirect effects. Direct: higher dividends and capitals gains. Indirect: new spending becomes taxable income for others. Some shifting of business profits out of 2017 to 2018.
29.Jan.2018 13
Personal Income and Sales Tax Detail

Mid-Year Update
Taxation of deferred foreign income (aka repatriation). JCT estimate assumes ~ $1.1 trillion in deferred income 2018 + 2019. Income was already invested, most likely in U.S. debt. Can now flow out as dividends, buybacks, wages and investment.
Some gains from migration to corporate business form. Significant corporate tax rate reduction. Large PA rate differential: 9.99 vs. 3.07.
Modest negative impact on housing market.
29.Jan.2018 14
Other Aspects of Federal Tax Change

Mid-Year Update
Revenue Update
29.Jan.2018 15

Mid-Year Update29.Jan.2018 16
Recent Tax Revenue TrendsFY 16-17 FY 17-18
2016.4 2017.1 2017.2 2017.3 2017.4General Fund Tax 2.3% 1.2% 4.1% 4.8% 5.3%Corporate Net Income -1.2% -12.3% 3.9% 10.9% -3.3%
Sales - Non-Motor 0.3% 1.1% 1.8% 3.0% 4.3%
Sales - Motor Vehicle -0.6% 9.7% 0.8% -0.9% 4.8%
Income - Withholding 2.7% 4.0% 3.7% 4.4% 4.3%
Income - Non-Withheld -7.9% 1.9% -0.9% 0.9% 35.1%
Cigarette 51.6% 45.3% 39.4% 10.6% -11.1%
All Other Tax -7.1% -4.0% 6.1% 5.1% 14.1%Note: PIT withheld adjusted for extra deposit days. Non-motor sales tax adjusted for tax law changes and miscellaneous transfers. Also uses one month lag.

Mid-Year Update29.Jan.2018 17
IFO Official FY 2017-18 EstimateJune 2017 Estimate Revenue Revised OfficialAmount Growth Package Total Growth
General Fund $32,491 2.6% $2,255 $34,745 9.7%Corporate Net Income 2,855 3.8% 218 3,072 11.7%Sales - Non-Motor 8,833 2.3% 5 8,837 2.3%Sales - Motor 1,404 2.7% 0 1,404 2.7%PIT - Withholding 9,975 3.8% 10 9,985 3.9%PIT - Other 3,347 9.7% -51 3,296 8.1%Cigarette 1,241 -1.7% 0 1,241 -1.7%Gaming Expansion 0 N/A 103 103 N/ALoan-Lease-Transfers 4 N/A 2,000 2,004 N/AAll Other 4,833 1.7% -30 4,803 1.1%
Note: dollar amounts in millions. June 2017 base growth rates were 4.7 percent, 3.2 percent and 10.7 percent for corporate net income, sales - non-motor and PIT - other, respectively. Revenue package includes a reduction of $33 million to insurance premiums tax for the anticipated increased usage of PHLIGA credits. PIT is personal income tax.

Mid-Year Update29.Jan.2018 18
Updated Estimate FY 2017-18Revenues Through January Mid-Year Update
Actual Growth Estimate $ Diff Total $ ChangeGeneral Fund $17,355 7.8% $16,906 $450 $34,780 $35
Corporate Net Income 1,320 6.1% 1,332 -11 2,991 -81Sales - Non-Motor 5,321 4.3% 5,306 15 8,852 14Sales - Motor 806 1.8% 815 -9 1,387 -16PIT - Withholding 5,836 6.2% 5,824 12 10,016 31PIT - Other 1,457 18.7% 1,335 122 3,284 -12Cigarette 705 -3.1% 723 -18 1,231 -10Gaming Expansion 96 N/A 27 70 188 85Loan-Lease-Transfers 216 N/A 2 214 1,937 -67All Other 1,598 8.8% 1,542 55 4,894 91
Note: dollar amounts in millions. PIT is personal income tax. All Other YTD gain from gross receipts ($11 million), insurance premiums ($10 million) and inheritance ($27 million) tax gains.

Mid-Year Update29.Jan.2018 19
Revisions to Official Estimate$ Change
from Official Notes on RevisionsGeneral Fund $35
Corporate Net Income -81 December weakness, income shiftingSales - Non-Motor 14 Solid, but January was flatSales - Motor -16 General weaknessPIT - Withholding 31 Steady gainsPIT - Other -12 Monies shifted from finals to quarterliesCigarette -10 Unusual recent weaknessGaming Expansion 85 Pick up from first two auctions; five assumedLoan-Lease-Transfers -67 $300 original lease-transfers, revised down to $233All Other 91 Inheritance +$40, VW Settlement +$40
Note: dollar amounts in millions. PIT is personal income tax.
Mid-Year Update29.Jan.2018 20
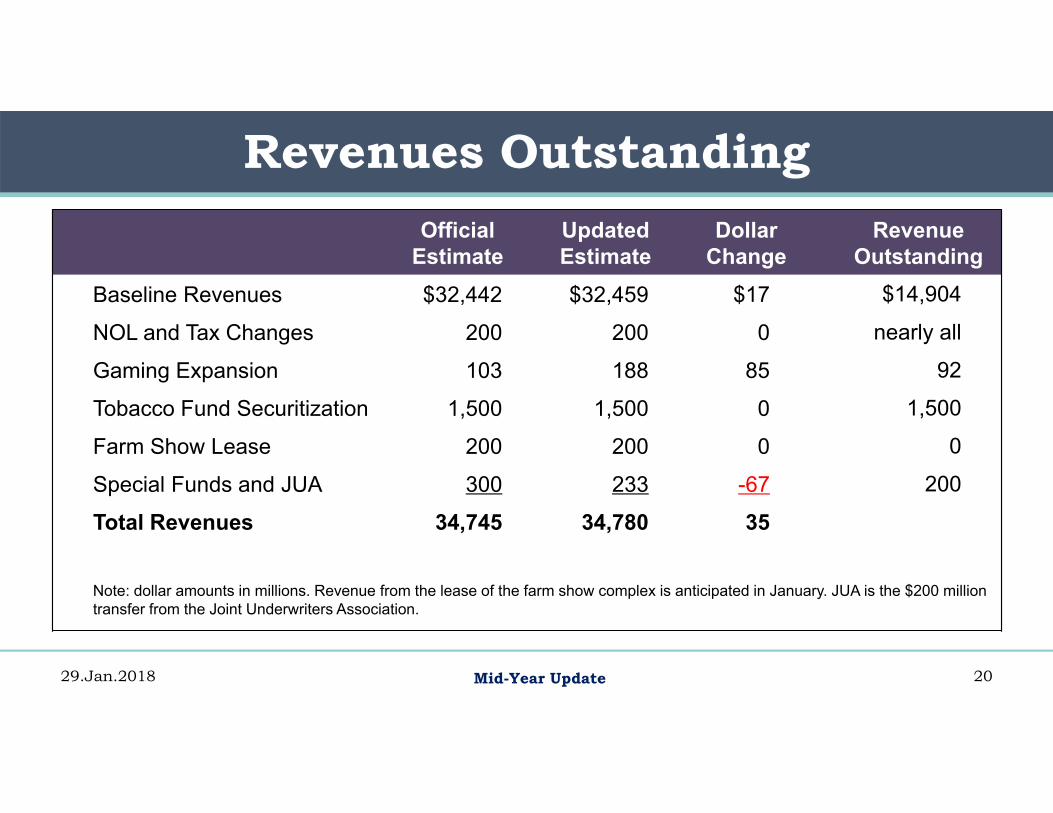
Revenues OutstandingOfficial
EstimateUpdatedEstimate
DollarChange
RevenueOutstanding
Baseline Revenues $32,442 $32,459 $17 $14,904
NOL and Tax Changes 200 200 0 nearly all
Gaming Expansion 103 188 85 92
Tobacco Fund Securitization 1,500 1,500 0 1,500
Farm Show Lease 200 200 0 0
Special Funds and JUA 300 233 -67 200
Total Revenues 34,745 34,780 35
Note: dollar amounts in millions. Revenue from the lease of the farm show complex is anticipated in January. JUA is the $200 million transfer from the Joint Underwriters Association.

Mid-Year Update
Withholding very close to forecast. CY 2017 growth at 4.0%. Forecast was 3.7%. Latest quarterly data show YOY gains of +4.3%.
Estimated payments very weak until December. Final Dec-Jan estimated payment up ~+$196 million (+33%). Accelerate payments to deduct against federal income tax. Shift from finals, purposeful overpayments.
Moderate growth in April final payments. Strong stock market gains (+17% annual growth) offsets some shifting.
29.Jan.2018 21
Personal Income Tax Trends

Mid-Year Update
Solid growth in non-motor vehicle revenues. Underlying base growth rate +4.3% for November to January. Strong holiday sales. But, January remittances are flat. Expect continued solid growth due to tax cut and wage gains.
Motor vehicle revenues slightly underperform. Number of U.S. light vehicle sales down 1.8% in 2017. U.S. CPI-U for 2017: new vehicles -0.2%; used vehicles -3.6%. Forecast decline of 1.3% for 2018 sales (IHS Markit). Saturated market.
29.Jan.2018 22
Sales-Use Tax Trends

Mid-Year Update
0.0%
1.0%
2.0%
3.0%
4.0%
5.0%
2015.1 2015.2 2015.3 2015.4 2016.1 2016.2 2016.3 2016.4 2017.1 2017.2 2017.3 2017.4
Income Tax Withholding
29.Jan.2018 23
NMV Sales Tax Growth Gap Closes
Non-Motor Sales Tax
FY 15-16Sales +2.7%
Withhold +2.5%
FY 16-17Sales +0.9%
Withhold +3.5%
FY 17-18Sales +3.7%
Withhold +4.3%
Note: Sales tax series controls for expanded tax base and transfers to various accounts and funds. Series lagged one month to control for payment rules.

Mid-Year Update
Non-financial domestic profits growth thru 2017 Q3 is 1.5%. Mar-Jun-Sept estimated payments up +4.5%. December up +7.0%. Anticipate relatively weak final payment due to shifting.
Corp. Bulletin 2017-02 decouples from federal bonus. Denies regular depreciation deductions until property is sold/disposed. Hedge: IFO has not reflected revenue impact in projections.
Risk: assumed revenue impact from NOL court case. IFO assumes +$215 million for FY 2017-18. Nearly all shows up in April-May final payment.
29.Jan.2018 24
Corporate Net Income Tax Trends

Mid-Year Update29.Jan.2018 25
Initial Outlook for FY 2018-19Preliminary Annual Increase
Amount Dollar PercentGeneral Fund $33,914 -$866 -2.5%
Corporate Net Income 3,318 327 10.9%Sales - Non-Motor 9,213 362 4.1%Sales - Motor 1,416 29 2.1%PIT - Withholding 10,454 438 4.4%PIT - Other 3,449 165 5.0%Cigarette 1,194 -37 -3.0%Gaming Expansion 82 -107 N/ALoan-Lease-Transfers 4 -1,933 N/AAll Other 4,784 -110 -2.2%
Note: dollar amounts in millions. Tax revenue growth rate is 3.9%.

Mid-Year Update
Significant revenue uncertainty for rest of fiscal year. NOL cap: $215 million (unclear how much has been received). JUA transfer: $200 million (included in estimate). Remaining gaming expansion monies: $92 million. Shifting vs. real monies: impact on final payments. Bonus depreciation and corporate tax bulletin.
Modest short-term economic bump from tax cut. Affects FY 2018-19. Little impact for FY 2017-18. Key: What will corporations do with tax cut? How quickly does it show up in the PA economy?
29.Jan.2018 26
Summary