mid - year fiscal position report
TRANSCRIPT
Mid - Year Fiscal Position rePort
2017
Ministry of Finance and Mass Media, sri lanka
ix
MID - YEAR FISCAL POSITION REPORT - 2017
Issued under Section 10 of the
Fiscal Management (Responsibility) Act, No. 3 of 2003
Mangala Samaraweera, M. P.Minister of Finance and Mass Media
30th June 2017
i
Mid-Year Fiscal Position Report
Issued by the Hon. Minister of Finance and Mass MediaUnder sections 10 of the Fiscal Management (Responsibility)
Act, No. 3 of 2003
In terms of Section 10 of the Fiscal Management (Responsibility) Act, No. 03 of 2003, the Minister of Finance is required to present the Mid-Year-Fiscal Position Report to the public by the last day of June of the year and thereafter lay before Parliament.
The purpose of this report is to provide updated information on the Government’s fiscal performance as per the fiscal strategy of the Government.
The report contains the performance of government revenue, expenditure, cash flow operations and borrowings during the first four months of the year 2017. The report also provides provisional budget outturn for the first four months of 2017, updated information depending on the availability of information relating to macroeconomic performance, price developments, foreign financing, government debt and official reserves as well as the performance of State Owned Business Enterprises.

ii
iii
Contents
Page No.
CHAPTER 1 The Economy
1.1 Economic Growth 11.2 Inflation 61.3 Money and Credit 71.4 Stock Market 71.5 External Sector Developments 8
CHAPTER 2 Global Economic Trends
2.1 Overview 112.2 Inflation 132.3 Interest Rates 132.4 Exchange Rates 132.5 Fiscal Deficits 132.6 Government Debt 142.7 International Trade 142.8 Commodity Prices 14
CHAPTER 3 Fiscal Developments
3.1 Overview 173.2 Government Revenue 203.3 Government Expenditure 293.4 Treasury Operations 56
CHAPTER 4 Performance of State Owned Business Enterprises
4.1 Overview 614.2 Review of the Ten Major SOBEs 61
CHAPTER 5 Foreign Financing
5.1 Foreign Financing Commitments 715.2 Foreign Financing Disbursements 745.3 Committed Undisbursed Balance (CUB) and Utilization 765.4 External Debt Stock and External Debt Service Payments 77

iv

v
Key Economic Indicators
Indicator Period UnitValue
2016 2017
ProvisionalREAL SECTOR
Economic Growth First Quarter % 5.5 3.8 Agriculture First Quarter % 1.9 (3.2) Industry First Quarter % 8.3 6.3 Services First Quarter % 4.9 3.5Inflation (Point to Point) End May % 4.8 6.0Inflation (Average) End May % 2.7 5.4Unemployment Rate Annual % 4.4 n.a.Labour Force Participation Rate Annual % 53.8 n.a.
FISCAL SECTOR Budget Deficit Jan-April Rs. Mn. -233,444 -233,171Total Revenue Jan-April Rs. Mn. 472,689 589,019 Tax Revenue Jan-April Rs. Mn. 441,211 554,294 Non Tax Revenue Jan-April Rs. Mn. 31,478 34,725Recurrent Expenditure Jan-April Rs. Mn. 559,697 626,049Public Investment Jan-April Rs. Mn. 151,978 201,012Government Debt End Dec Rs. Bn. 9,387.3 n.a.
EXTERNAL SECTOR Exports Jan-April US$ Mn. 3,450 3,569 o/w Agriculture Exports Jan-April US$ Mn. 722 852 Industrial Exports Jan-April US$ Mn. 2,714 2,701 Textile and Garments Jan-April US$ Mn. 1,710 1,626 Other Jan-April US$ Mn. 1,004 1,075Imports Jan-April US$ Mn. 6,055 6,883 Consumer Goods Jan-April US$ Mn. 1,426 1,516 Intermediate Goods Jan-April US$ Mn. 3,019 3,692 o/w Petroleum Products Jan-April US$ Mn. 687 1,208 Investment Goods Jan-April US$ Mn. 1,608 1,615Trade Balance Jan-April US$ Mn. -2,606 -3,314Tourist Arrivals Jan-May No. 846,229 887,093Earnings From Tourism Jan-May US$ Mn. 1,451.8 1,521.9Workers' Remittances Jan-April US$ Mn. 2,371 2,222Portfolio Investments – Equity (Net) Jan-April US$ Mn. -19.5 154.5Overall Balance of Payments (BOP) Jan-March US$ Mn. (720.2) (175.9)Gross Official Reserves End March US$ Mn. 6,221 5,117
Exchange Rate (End Month) End MayRs. Per
US$ 145.75 152.71
Exchange Rate (Monthly Average) Jan- MayRs. Per
US$ 145.65 152.33

vi
MONETARY SECTOR Standing Deposit Facility Rate (SDFR) End June % 6.50 7.25Standing Lending Facility Rate (SLFR) End June % 8.00 8.75Statutory Reserve Requirement (SRR) End June % 7.50 7.50Commercial Bank Average Weighted Prime Lending Rate (AWPLR) End June % 10.23 11.88Commercial Bank Average Weighted Lending Rate (AWLR) EndApril % 11.66 13.52Sri Lanka Inter Bank Offer Rate (SLIBOR ) (I Month) End June % 9.50 10.52W.A. Yield Rate of Treasury Bills (91 Days) End June % 8.86 9.60W.A. Yield Rate of Treasury Bills (364 Days) End June % 10.55 10.47
Growth in Money Supply (M2b)Apr 2017/ Apr 2016 % 18.2 20.1
Growth in Credit to the Private SectorApr 2017/ Apr 2016 % 28.1 20.0
Key Economic Indicators
Indicator Period UnitValue
2016 2017
Provisional
vii
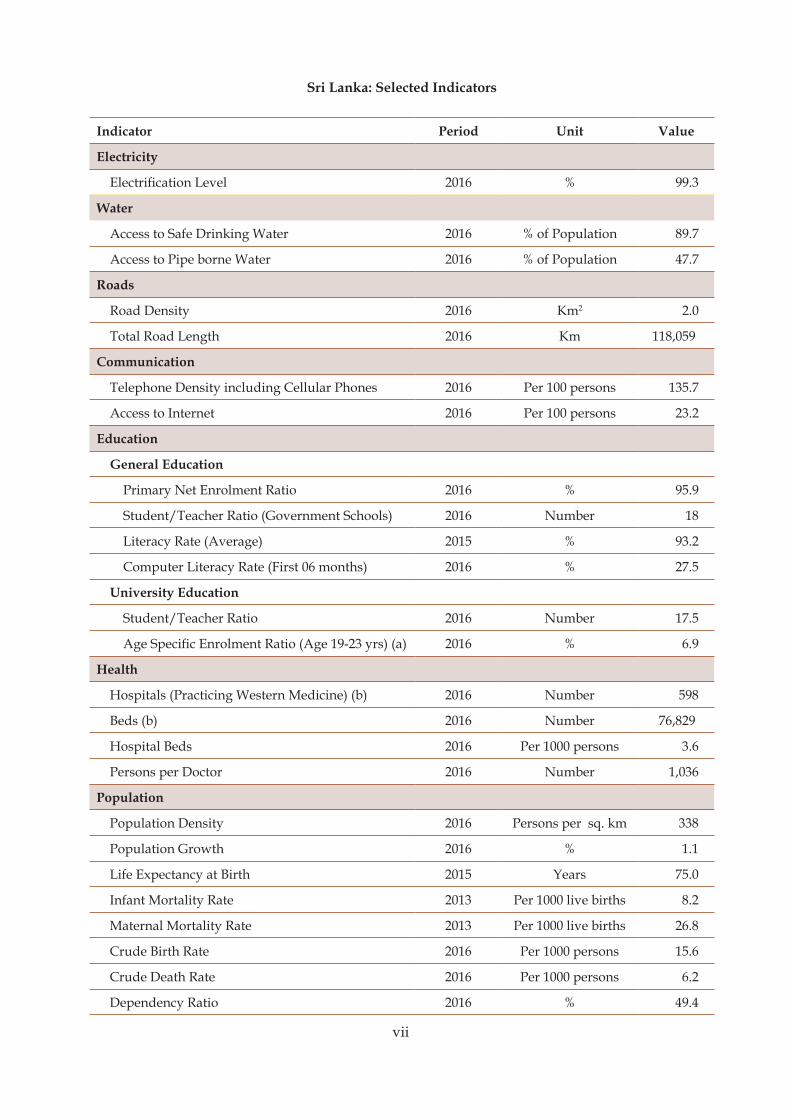
Sri Lanka: Selected Indicators
Indicator Period Unit Value
Electricity
Electrification Level 2016 % 99.3
Water
Access to Safe Drinking Water 2016 % of Population 89.7
Access to Pipe borne Water 2016 % of Population 47.7
Roads
Road Density 2016 Km2 2.0
Total Road Length 2016 Km 118,059
Communication
Telephone Density including Cellular Phones 2016 Per 100 persons 135.7
Access to Internet 2016 Per 100 persons 23.2
Education
General Education
Primary Net Enrolment Ratio 2016 % 95.9
Student/Teacher Ratio (Government Schools) 2016 Number 18
Literacy Rate (Average) 2015 % 93.2
Computer Literacy Rate (First 06 months) 2016 % 27.5
University Education
Student/Teacher Ratio 2016 Number 17.5
Age Specific Enrolment Ratio (Age 19-23 yrs) (a) 2016 % 6.9
Health
Hospitals (Practicing Western Medicine) (b) 2016 Number 598
Beds (b) 2016 Number 76,829
Hospital Beds 2016 Per 1000 persons 3.6
Persons per Doctor 2016 Number 1,036
Population
Population Density 2016 Persons per sq. km 338
Population Growth 2016 % 1.1
Life Expectancy at Birth 2015 Years 75.0
Infant Mortality Rate 2013 Per 1000 live births 8.2
Maternal Mortality Rate 2013 Per 1000 live births 26.8
Crude Birth Rate 2016 Per 1000 persons 15.6
Crude Death Rate 2016 Per 1000 persons 6.2
Dependency Ratio 2016 % 49.4

viii
Poverty
Poverty Head Count Index 2012/2013 % 6.7
Gini Coefficient of Household Income 2012/2013 Coefficient 0.48
Poverty Gap Index 2012/2013 % 1.2
Average Daily Calorie Intake 2012/2013 Kilocalories 2,111
International Rankings Rank
Human Development Index 2015Rank out of 188
Countries 73
Doing Business Index 2017Rank out of 190
Countries 110
Global Competiveness Index 2016/17Rank out of 138
Countries 71
Economic Freedom Index 2017Rank out of 180
Countries 112
Global Peace Index 2017Rank out of 163
Countries 80
e-Government Development Index 2015Rank out of 193
Countries 79
Indicator Period Unit Value
(a) Only includes internal enrolment of students
(b) Government

1
1.1 Economic GrowthSri Lankan economy grew by 3.8 percent, in real terms, in the first quarter of 2017 compared to 5.1 percent in the same period of 2016 amid a challenging both domestic and external environment. The growth was mainly driven by the marked improvements in construction, mining and quarrying, financial services, insurance, textile and apparel and inland and marine fishing industry. Manufacturing of other non-metallic mineral products, water supply and health activities are showing some signs of recovery after a slowdown. Meanwhile, Industry and Services sectors expanded by 6.3 percent and 3.5 percent, respectively in the first quarter of 2017. Despite the pickup of the certain economic activities, the contraction of the Agriculture sector was mainly attributable to the slowdown in GDP. Prolonged drought condition in certain areas and the floods and landslides occurred in
CHAPTER 1The Economy
percent and 4.7 percent, respectively in the first quarter of 2017. Value-added agricultural activities contracted by 3.2 percent in the first quarter of 2017 from 0.2 percent negative growth recorded in the same quarter of 2016. Agriculture sector was hindered by the contraction of value-added rice, cereals, coconut, tea, rubber, sugar and vegetable production mainly due to the inclement weather condition prevailed. However, inland and marine fishing, forestry, other field crops, spices and beverage crops and fruits contributed to the growth in Agriculture sector. Paddy production during 2016/17 Maha season declined significantly by 51.1 percent to 1.4 million metric tons compared to 2.9 million metric tons recorded in 2015/16 Maha season mainly due to the sharp reduction of extent under cultivation stemming from severe drought prevailed. Meanwhile, cereals sub-sector comprising cowpea, kurakkan and ground nuts contracted by 15.1 percent
several wet zones in the country adversely affected to the value-added production in the Agriculture sector.
Agriculture, Industry, Services and ‘Taxes less Subsidies on products’ contributed to GDP by 7.2 percent, 32.2 percent, 55.9
in the first quarter of 2017 compared to a positive growth of 5.6 percent recorded in the same quarter of 2016. Tea and rubber production declined considerably owing to both supply and demand factors. Tea production declined by 6.1 percent to 66.2 million kg in the first quarter of 2017
0.0
2.0
4.0
6.0
8.0
10.0
12.0
Q1 Q2 Q3 Q4 Q1 Q2 Q3 Q4 Q1 Q2 Q3 Q4 Q1
2014 2015 2016 2017
%
Chart 1.1: Quarterly GDP Growth
GDP Growth

2
compared to 70.4 million kg recorded in the same quarter of 2016, reflecting the prolonged drought in the tea growing areas, low global commodity prices and geopolitical uncertainty in several tea export destinations. Due to the supply shortages, the average prices recorded at the Colombo Tea Auction increased by 50.9 percent to Rs. 643.79 per kg in the first quarter of 2017 from Rs. 426.67 per kg in the same quarter of 2016. Meanwhile, the rubber production declined by 17.2 percent to 23.3 million kg in the review period compared to 28.2 million kg in the first quarter of 2016. The decline in rubber production was due to the drop in tapping days and low international rubber prices. The average prices at the Colombo Rubber Action declined. The average price of Ribbed Smoked Sheet 1 (RSS1) was Rs. 250 per kg, a decline by 10.3 percent in the first quarter of 2017 compared to the same quarter of 2016. Coconut production in the
Fisheries sector regained its momentum in the first quarter of 2017. Value-added inland and marine fish production increased significantly by 5.8 percent and 21.5 percent, respectively in the first quarter of 2017 after the contraction in the same period of 2016. Inland fishery sub-sector was benefitted by the increase in releasing fingerlings to the tanks while the marine fish sub-sector expanded due to the increase in demand for Sri Lankan sea foods exports after lifting the ban on the fish exports by the European Union (EU). Meanwhile, value-added livestock production increased by 6.9 percent in the review period mainly due to the Government policy towards increasing the production of milk and poultry sectors.
The value-added Industry sector expanded by 6.3 percent in the first quarter of 2017
Agriculture7%
Industry31%
Services52%
Taxes less Subsidies
10%
Chart 1.2: Sectoral Composition of GDP at curent prices -First Quarter 2017
first quarter of 2017 recorded a slowdown with a decline in production by 6.5 percent to 683.6 million nuts mainly due to the unfavourable weather condition prevailed in coconut growing areas. Vegetables and sugar sub-sectors contracted by 3.2 percent and 11 percent, respectively in the review period.
compared to 9.1 percent in the same quarter of 2016. Industry activities including mining and quarrying, construction, textile and apparel, manufacturing of paper products, basic metals machinery and equipment, water supply and sewerage and waste activities positively contributed to the growth in Industry sector. The construction activities expanded by 16.1 percent in the review
Chart 1.2: Sectoral Composition of GDP at curent prices - First Quarter 2017
3
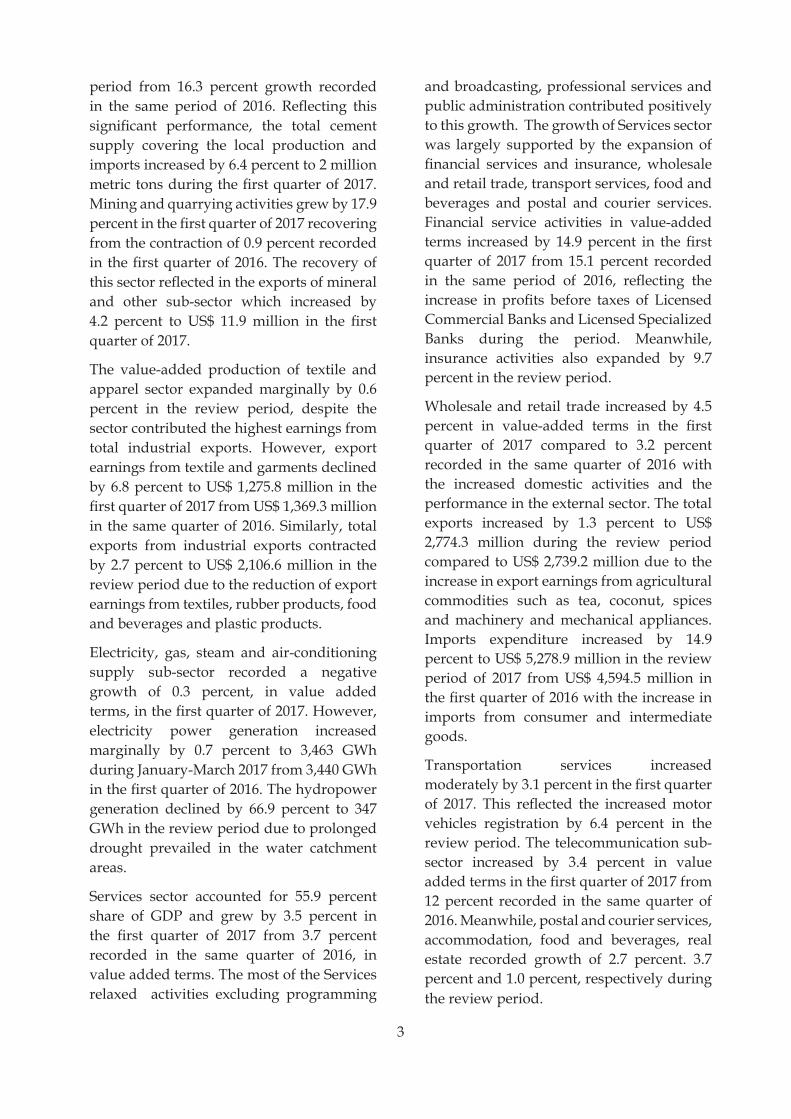
period from 16.3 percent growth recorded in the same period of 2016. Reflecting this significant performance, the total cement supply covering the local production and imports increased by 6.4 percent to 2 million metric tons during the first quarter of 2017. Mining and quarrying activities grew by 17.9 percent in the first quarter of 2017 recovering from the contraction of 0.9 percent recorded in the first quarter of 2016. The recovery of this sector reflected in the exports of mineral and other sub-sector which increased by 4.2 percent to US$ 11.9 million in the first quarter of 2017.
The value-added production of textile and apparel sector expanded marginally by 0.6 percent in the review period, despite the sector contributed the highest earnings from total industrial exports. However, export earnings from textile and garments declined by 6.8 percent to US$ 1,275.8 million in the first quarter of 2017 from US$ 1,369.3 million in the same quarter of 2016. Similarly, total exports from industrial exports contracted by 2.7 percent to US$ 2,106.6 million in the review period due to the reduction of export earnings from textiles, rubber products, food and beverages and plastic products.
Electricity, gas, steam and air-conditioning supply sub-sector recorded a negative growth of 0.3 percent, in value added terms, in the first quarter of 2017. However, electricity power generation increased marginally by 0.7 percent to 3,463 GWh during January-March 2017 from 3,440 GWh in the first quarter of 2016. The hydropower generation declined by 66.9 percent to 347 GWh in the review period due to prolonged drought prevailed in the water catchment areas.
Services sector accounted for 55.9 percent share of GDP and grew by 3.5 percent in the first quarter of 2017 from 3.7 percent recorded in the same quarter of 2016, in value added terms. The most of the Services relaxed activities excluding programming
and broadcasting, professional services and public administration contributed positively to this growth. The growth of Services sector was largely supported by the expansion of financial services and insurance, wholesale and retail trade, transport services, food and beverages and postal and courier services. Financial service activities in value-added terms increased by 14.9 percent in the first quarter of 2017 from 15.1 percent recorded in the same period of 2016, reflecting the increase in profits before taxes of Licensed Commercial Banks and Licensed Specialized Banks during the period. Meanwhile, insurance activities also expanded by 9.7 percent in the review period.
Wholesale and retail trade increased by 4.5 percent in value-added terms in the first quarter of 2017 compared to 3.2 percent recorded in the same quarter of 2016 with the increased domestic activities and the performance in the external sector. The total exports increased by 1.3 percent to US$ 2,774.3 million during the review period compared to US$ 2,739.2 million due to the increase in export earnings from agricultural commodities such as tea, coconut, spices and machinery and mechanical appliances. Imports expenditure increased by 14.9 percent to US$ 5,278.9 million in the review period of 2017 from US$ 4,594.5 million in the first quarter of 2016 with the increase in imports from consumer and intermediate goods.
Transportation services increased moderately by 3.1 percent in the first quarter of 2017. This reflected the increased motor vehicles registration by 6.4 percent in the review period. The telecommunication sub-sector increased by 3.4 percent in value added terms in the first quarter of 2017 from 12 percent recorded in the same quarter of 2016. Meanwhile, postal and courier services, accommodation, food and beverages, real estate recorded growth of 2.7 percent. 3.7 percent and 1.0 percent, respectively during the review period.

4
Table 1.1: Sectoral Composition of GDP at Constant (2010) Prices - First Quarter 2016-2017
Rs. Million
Sector 2016 2017 (Prov.)
Rate of Change
(%)
Agriculture, Forestry and Fishing 161,662 156,419 -3.2
1 Growing of Cereals (except rice) 4,104 3,483 -15.1
2 Growing of Rice 10,646 4,993 -53.1
3 Growing of Vegetables 13,851 13,406 -3.2
4 Growing of Sugar Cane, Tobacco and Other Non-perennial Crops 534 475 -11.0
5 Growing of Fruits 14,260 14,539 2.0
6 Growing of Oleaginous Fruits ( Coconut, King Coconut, Oil Palm) 18,884 16,966 -10.2
7 Growing of Tea (Green Leaves) 15,411 14,534 -5.7
8 Growing of Other Beverage Crops (Coffee, Cocoa etc,.) 338 341 0.9
9 Growing of Spices, Aromatic, Drug and Pharmaceutical Crops 17,081 18,115 6.1
10 Growing of Rubber 8,214 6,800 -17.2
11 Growing of Other Perennial Crops 4,042 4,481 10.9
12 Animal Production 12,625 13,498 6.9
13 Plant Propagation and Support Activities to Agriculture 2,399 2,556 6.5
14 Forestry and Logging 10,682 11,679 9.3
15 Marine Fishing and Marine Aquaculture 26,625 28,162 5.8
16 Fresh Water Fishing and Fresh Water Aquaculture 1,967 2,390 21.5
Industries 655,053 696,380 6.3
17 Mining and Quarrying 51,584 60,794 17.9
18 Manufacture of Food, Beverages and Tobacco Products 152,460 151,954 -0.3
19 Manufacture of Textile, Wearing Apparel and Leather Related products 97,119 97,736 0.6
20 Manufacture of Wood and Products of Wood and Cork, except Furniture 9,023 8,833 -2.1
21 Manufacture of Paper Products, Printing and Reproduction of Media Products 9,831 10,557 7.4
22 Manufacture of Coke and Refined Petroleum Products 13,569 11,463 -15.5
23 Manufacture of Chemical Products and Basic Pharmaceutical Products 19,355 19,337 -0.1

5
24 Manufacture of Rubber and Plastic Products 11,608 11,579 -0.2
25 Manufacture of Other Non-metallic Mineral Products 16,573 19,801 19.5
26 Manufacture of Basic Metals and Fabricated Metal Products 10,975 11,578 5.5
27 Manufacture of Machinery and Equipment i.e.. 11,485 13,579 18.2
28 Manufacture of Furniture 29,242 30,357 3.8
29 Other Manufacturing and Repair and Installation of Machinery and Equipment 21,120 18,973 -10.2
30 Electricity, Gas, Steam and Air Conditioning Supply 22,501 22,441 -0.3
31 Water Collection, Treatment and Supply 2,816 3,424 21.6
32 Sewerage, Waste, Treatment and Disposal Activities 5,996 6,793 13.3
33 Construction 169,794 197,182 16.1
Services 1,167,216 1,207,523 3.5
34 Wholesale and Retail Trade 233,533 244,006 4.5
35 Transport of Goods and Passenger including Warehousing 208,190 214,586 3.1
36 Postal Courier Activities 1,056 1,084 2.7
37 Accommodation, Food and Beverage Service Activities 34,377 35,658 3.7
38 Programming and Broadcasting Activities and Audio Video Productions 703 637 -9.4
39 Telecommunication 9,281 9,593 3.4
40 IT Programming Consultancy and Related Activities 3,133 3,223 2.9
41 Financial Service Activities and Auxiliary Financial Services 110,424 126,836 14.9
42 Insurance, Reinsurance and Pension Funding 15,152 16,628 9.7
43 Real Estate Activities, Including Ownership of Dwelling 127,798 129,137 1.0
44 Professional Services 37,606 37,153 -1.2
45 Public Administration and Defence; Compulsory Social Security 101,235 96,321 -4.9
46 Education 41,239 41,617 0.9
47 Human Health Actives, Residential Care and Social Work Activities 29,449 32,728 11.1
48 Other Personal Service Actives 214,040 218,315 2.0
Gross Value Added (GVA), at basic prices 1,983,930 2,060,322 3.9
(+) Taxes less Subsidies on Products 98,614 101,448 2.9
Gross Domestic Product(GDP), at market prices 2,082,544 2,161,770 3.8
Rs. Million
Sector 2016 2017 (Prov.)
Rate of Change
(%)

6
Table 1.2: Movements in Inflation (%)
Year Month
CCPI (2013 = 100) NCPI ( 2013=100)Headline Inflation Core Inflation* Headline
Inflation Core Inflation*
Point to
Point
Annual Average
Point to
Point
Annual Average
Point to
Point
Annual Average
Point to
Point
Annual Average
2016 January 1.7 2.1 3.6 4.9 -0.7 2.9 3.0 4.3February 2.9 2.1 4.4 5.0 1.7 2.6 4.6 4.4March 2.6 2.2 3.7 5.0 2.2 2.4 5.0 4.5April 3.4 2.4 3.5 4.9 4.3 2.6 5.9 4.7May 4.8 2.7 5.6 5.0 5.3 2.7 7.2 5.0June 5.5 3.0 5.4 5.1 6.4 3.1 7.5 5.3July 5.8 3.4 5.0 5.1 5.8 3.4 6.8 5.5August 4.4 3.7 3.8 4.9 4.5 3.6 6.0 5.6September 4.2 3.9 3.7 4.8 4.7 3.8 5.7 5.7October 4.1 4.0 3.8 4.6 5 4.0 5.7 5.7November 4.0 4.0 4.8 4.5 4.1 4.0 6.8 5.8December 4.5 4.0 5.8 4.4 4.2 4.0 6.7 5.9
2017 January 5.5 4.3 7.0 4.7 6.5 4.6 7.1 6.2February 6.8 4.6 7.1 5.0 8.2 5.1 7.1 6.4March 7.3 5.0 7.3 5.3 8.6 5.6 7.0 6.6April 6.9 5.3 6.8 5.5 8.4 6.0 5.9 6.6May 6.0 5.4 5.2 5.5 7.1 6.1 4.7 6.4
Source: Department of Census and Statistics
*Excluding Volatile Food, Energy and Transport
1.2 Inflation
Inflation, as measured by National Consumer Price Index (NCPI) (2013=100), declined to 7.1 percent in May 2017 compared to 8.4 percent in April 2017. Reflecting a base year effect, inflation in May 2017 increased from 5.3 percent recorded in May 2016. The inflation increased from 6.5 percent in January 2017 to 8.4 percent in April 2017 due to the unfavorable weather conditions, the effect of the revision of certain taxes and the increase in international commodity prices. The NCPI core inflation, which depicts the underlying inflation in the economy declined significantly to 4.7 percent in May 2017 from 7.2 percent in May 2016 on a year-on-year basis, reflecting a base year effect. However, annual average NCPI core inflation also increased to 6.4 percent in May 2017 from 5.0 percent in May 2016.
Meanwhile, Colombo Consumer’s Price Index (CCPI) (2013=100) based headline inflation increased to 6.0 percent, on year-on-year basis, in May 2017 from 4.8 percent recorded in May 2016. Contributions to the CCPI based inflation from food group and the non-food group were 2.70 percent and 3.27 percent, respectively in May 2017. The CCPI annual average inflation increased to 5.4 percent in May 2017 compared to 2.7 percent recorded in May 2016. However, Core inflation, which measures the price movements excluding volatile food, energy, and transport in terms of year-on-year, decreased to 5.2 in May 2017 compared to 5.6 percent recorded in May 2016. Annual average NCPI based core inflation increased to 5.5 percent in May 2017 from 5.0 percent in May 2016. Inflation is expected to remain mid-single digit level during 2017 with the gradual management of demand pressures.

7
1.3 Money and Credit
Growth in reserve money, broad money (M2b) and the private sector credit increased during the first four months of 2017. The Central Bank of Sri Lanka (CBSL) tightened its monetary policy by increasing Standing Deposit Facility Rate (SDFR) and Standing Lending Facility Rate (SLFR) by 25 basis points to 7.25 percent and 8.75 percent, respectively in March 2017. As a result, short-term interest rates increased substantially and the effect is gradually transmitting to the lending and deposit rates of the financial institutions.
Reserve money grew by 16 percent in April 2017 on year-on-year basis, while the year-on-year growth of broad money increased by 20.1 percent in April 2017 compared to 18.2 percent in April 2016 mainly due to the expansion of credit to the private sector and the Government. Meanwhile, private sector credit increased by 20 percent in April 2017 on year-on-year basis. With regard to the sectoral distribution of credit, Industry and Services sectors attracted the highest levels of credit disbursements while personal loans and advances also recorded a significant increase.
1.4 Stock Market
The stock market regained its momentum during the first five months of 2017 with increased net foreign inflows to the market. All Share Price Index (ASPI) increased by 1.4 percent to 6,610 points by end May 2017 and the S&P SL 20 Index increased by 10.2 percent to 3,786 points at end May 2017 compared to 3,436 points at end May 2016. The daily average turnover increased by 13.5 percent to Rs. 901 million at end May
2017 compared to Rs. 794 million in the corresponding period of the previous year. In addition, market capitalization increased by 4.8 percent to Rs. 2.9 trillion at end May 2017 from Rs. 2.8 trillion recorded in the same period of 2016. Meanwhile, cumulative foreign purchases increased significantly by 81 percent to Rs. 50 billion by end May 2017 whereas foreign sales declined by 6 percent to Rs. 32 billion by end May 2017, reflecting the increase in net inflows of Rs. 19 billion to the market.
Table 1.3 : Money and Private Sector Credit
Item
2016 2017
January February March April January February March April
2017 April/ 2016 April
Growth (%)
Reserve Money 718.6 739.3 791.6 763.1 828.5 847.6 892.2 885.6 16.1
Broad Money (M2b)
4,638.3
4,703.8
4,731.6
4,772.1
5,460.4
5,552.0
5,677.4 5,731.0 20.1
Private Sector Credit
3,493.1
3,546.8
3,634.6
3,662.0
4,222.3
4,293.2
4,375.2 4394.0 20.0
Source: Central Bank of Sri Lanka
Rs. Billion

8
Table 1.4 : Movements in the Capital Market
Indicators 2012 2013 2014 2015 2016End May
2016 2017All Share Price Index (1985=100) 5,643 5,913 7,299 6,895 6,228 6,516 6,610Milanka Price Index/ S&P SL 20 Index* 3,085 3,264 4,089 3,626 3,496 3,436 3,786
Market Capitalization (Rs. Bn.) 2,168 2,460 3,105 2,938 2,745 2,777 2,909No. of Listed Companies in Trading ** 287 289 294 294 295 294 296Daily Average Turnover (Rs.Mn.) 884 828 1,415 1,060 737 794 901Foreign Sales (Rs. Mn.) 33,954 60,873 83,554 89,790 74,270 33,649 31,615Foreign Purchases (Rs. Mn) 72,614 83,657 104,771 84,418 74,608 27,855 50,411Net Purchases (Rs. Mn) 38,660 22,784 21,217 -5,372 338 -5,794 18,796
Sources: Colombo Stock Exchange and Central Bank of Sri Lanka
* with effect from June 2012 Milanka Price Index has been replaced by S&P SL 20 Index
** Excluding Closed End Funds
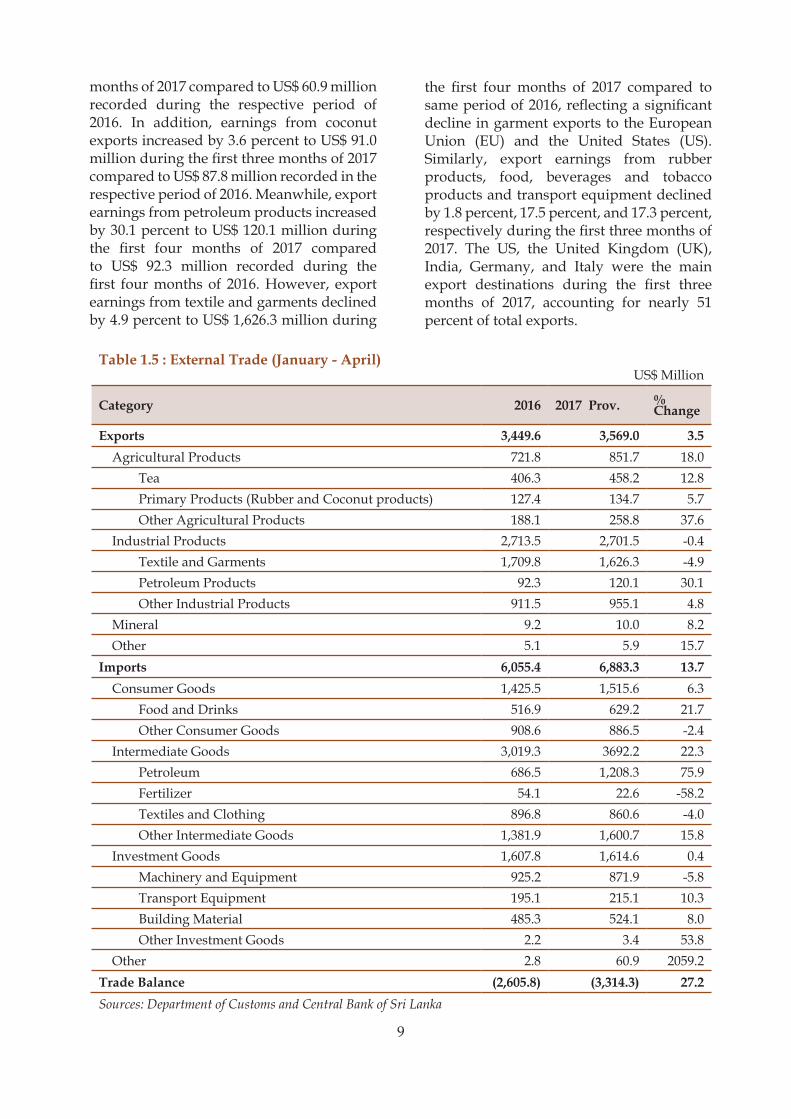
1.5 External Sector DevelopmentsThe external sector reflected a subdued performance during the first four months of 2017 with the expansion of trade deficit and the decline of workers’ remittances amidst the increase in earnings from tourism. The trade deficit expanded by 27.2 percent to US$ 3,313.8 million during the first four months of 2017 compared to US$ 3,314.3 million recorded in the same period of 2016, reflecting a substantial increase in import expenditure and the moderate increase in earnings from exports. The earnings from exports increased by 3.5 percent to US$ 3,569.0 million during this period and the expenditure on imports increased by 13.7 percent to US$ 6,883.3 million.
The remittances from overseas employments declined by 3.3 percent to US$ 1,733.7 million during the first three months of 2017 compared to US$ 1,793.4 million in the same period of 2016 resulting from the adverse economic and geopolitical conditions prevailing in the Middle Eastern region. However, earnings from tourism increased by 3.4 percent to US$ 1,037.9 million during the first three months of 2017 compared to US$ 1,003.3 million recorded during the same period of 2016. Meanwhile, gross official reserves stood at US$ 5.1 billion by end March 2017 which is equivalent to
3.1 months of imports while total reserves stationed at US$ 7.1 billion, which is sufficient for 4.2 months of imports.
ExportsEarnings from exports increased moderately by 3.5 percent to US$ 3,569.0 million during the first four months of 2017 compared to US$ 3,449.6 million recorded in the respective period of 2016 mainly due to the plunge in commodity prices in international market and the slow economic recovery of export destinations of Sri Lankan products. However, the increase in earnings from exports of tea, machinery, and mechanical appliances and spices contributed to this moderate growth. Amidst the decline in the volume of tea exported, the earnings from tea exports increased by 12.8 percent to US$ 458.2 million in the first four months of 2017 compared to the respective period of 2016 owing to a substantial increase in tea prices in the international market.
Meanwhile, export earnings from machinery and mechanical appliances increased by 37.8 percent to US$ 101.8 million in the first three months of 2017 compared to US$ 73.9 million recorded during the same period of 2016. With the increased export volumes of cloves, cinnamon, and pepper, the earnings from spices increased significantly by 41.1 percent to US$ 86.0 million in the first three
9
months of 2017 compared to US$ 60.9 million recorded during the respective period of 2016. In addition, earnings from coconut exports increased by 3.6 percent to US$ 91.0 million during the first three months of 2017 compared to US$ 87.8 million recorded in the respective period of 2016. Meanwhile, export earnings from petroleum products increased by 30.1 percent to US$ 120.1 million during the first four months of 2017 compared to US$ 92.3 million recorded during the first four months of 2016. However, export earnings from textile and garments declined by 4.9 percent to US$ 1,626.3 million during
the first four months of 2017 compared to same period of 2016, reflecting a significant decline in garment exports to the European Union (EU) and the United States (US). Similarly, export earnings from rubber products, food, beverages and tobacco products and transport equipment declined by 1.8 percent, 17.5 percent, and 17.3 percent, respectively during the first three months of 2017. The US, the United Kingdom (UK), India, Germany, and Italy were the main export destinations during the first three months of 2017, accounting for nearly 51 percent of total exports.
Table 1.5 : External Trade (January - April) US$ Million
Category 2016 2017 Prov. % Change
Exports 3,449.6 3,569.0 3.5Agricultural Products 721.8 851.7 18.0
Tea 406.3 458.2 12.8Primary Products (Rubber and Coconut products) 127.4 134.7 5.7Other Agricultural Products 188.1 258.8 37.6
Industrial Products 2,713.5 2,701.5 -0.4Textile and Garments 1,709.8 1,626.3 -4.9Petroleum Products 92.3 120.1 30.1Other Industrial Products 911.5 955.1 4.8
Mineral 9.2 10.0 8.2Other 5.1 5.9 15.7
Imports 6,055.4 6,883.3 13.7Consumer Goods 1,425.5 1,515.6 6.3
Food and Drinks 516.9 629.2 21.7Other Consumer Goods 908.6 886.5 -2.4
Intermediate Goods 3,019.3 3692.2 22.3Petroleum 686.5 1,208.3 75.9Fertilizer 54.1 22.6 -58.2Textiles and Clothing 896.8 860.6 -4.0Other Intermediate Goods 1,381.9 1,600.7 15.8
Investment Goods 1,607.8 1,614.6 0.4Machinery and Equipment 925.2 871.9 -5.8Transport Equipment 195.1 215.1 10.3Building Material 485.3 524.1 8.0Other Investment Goods 2.2 3.4 53.8
Other 2.8 60.9 2059.2Trade Balance (2,605.8) (3,314.3) 27.2Sources: Department of Customs and Central Bank of Sri Lanka
10
Imports
Expenditure on imports increased moderately by 13.7 percent to US$ 6,883.3 million during the first four months of 2017 compared to US$ 6,055.4 million in the same period of 2016 mainly due to the increase in expenditure on fuel including refined petroleum and coal, gold and cereals and milling industry products including rice. Import expenditure on fuel increased by 81.6 percent to US$ 882.1 million during the first three months of 2017 due to a higher expenditure on refined petroleum and coal imports to meet the increased demand for thermal and coal-based power generation.
In addition, import expenditure on diamonds, precious stones and metal category including gold increased by 116.5 percent to US$ 175.1 million during the first three months of 2017 compared to the same period of 2016. Meanwhile, import expenditure on cereals and milling industry products including rice increased by 1,972.4 percent to US$ 103.4
million during the first three months due to the increase in rice imports to meet the rice shortage in the domestic market. However, expenditure on vehicle imports declined by 17.2 percent to US$ 191.9 million during the first three months of 2017 compared to US$ 231.6 million recorded during the same period of 2016.
Import expenditure on textiles and textile articles also declined by 4.0 percent to US$ 860.6 million during the first four months of 2017 compared to US$ 896.8 million recorded during the respective period of 2016. In addition, import expenditure on machinery and equipment declined by 5.8 percent to US$ 871.9 million during this period mainly due to the decline in imports of machinery and equipment used in the telecommunication industry. India, China, the United Arab Emirates (UAE), Singapore and Japan were the main import origins during the first three months of 2017 which were responsible for about 59 percent of total imports.

11
2.1 Overview
The global economic outlook remains positive in 2017 with several encouraging signs in advanced and emerging economies. The global economic growth is forecast to pick up from 3.1 percent in 2016 to 3.5 percent in 2017 and 3.6 percent in 2018. This is in part due to the recovery of investment, trade and manufacturing sectors. Advanced economies are expected to grow at a moderate pace of 2.0 percent in 2017 compared to 1.7 percent in 2016 led by the improved performance in the United States partly due to the increased business confidence, strong labour market coupled with robust consumption growth. Meanwhile, the recovery of the Euro Area is expected to remain modest and is forecast to grow at 1.7 percent and 1.6 per cent in 2017 and 2018, respectively due to the heightened financial market volatility stemming from the outcome of the “Brexit” referendum in June 2016. Increased non-performing loans in some countries pose risks to the Euro area. However, the manufacturing activity and export growth in the euro area have been lifted by strengthening global trade with the gradual recovery of investment. The economic growth in Japan is expected to increase modestly to 1.2 percent in 2017 from 1.0 percent in 2016 with stimulus package announced in 2016 to boost the struggling Japanese economy coupled with the delay in a consumption tax increase.
Economic activity in emerging market and developing economies (EMDEs) remains resilient. Economic growth is expected to accelerate to 4.5 percent in 2017 from 4.1 percent in 2016 despite the gradual increase
in global demand. The growth in commodity importers particularly in East Asia and Pacific and South Asia remain robust with the solid domestic demand, strong infrastructure spending, FDI-led investment into highly competitive manufacturing sectors and services, and rising global demand. According to the “Global Economic Perspectives” of the World Bank, Asian EMDEs are also benefitted by the increased intraregional trade and investment flows which may receive a further boost from China’s “One Belt, One Road” initiative. Meanwhile, the growth in commodity exporters such as Argentina, Brazil, and Russia is expected to grow at 1.8 percent in 2017 and 2.8 percent, on average, in 2018-19 supported by improved confidence and rising commodity prices. China is expected to achieve growth targets in 2017 and 2018 mainly driven by policy reforms and robust credit growth.
The outlook for India remains important for Sri Lanka. As per the medium-term forecast, India remains the world’s fastest growing economy supported by the policy reforms being implemented in the financial and fiscal sector along with the measures taken to mitigate corruption. The economic growth in India is expected to be at around 7.2 percent and 7.7 percent in 2017 and 2018, respectively. However, the potential growth was dragged by the recent high-denomination currency exchange from circulation which has made a negative shock to the consumption. The economies such as Indonesia, the Philippines, and Vietnam have remained resilient while Malaysia and Thailand have been moderate.
CHAPTER 2Global Economic Trends

12
Low-income countries are expected to rebound the growth to 4.7 percent in 2017, after a slowdown in 2016, reflecting the increase in commodity prices and global trade and policy actions to tackle macroeconomic imbalances. Metals exporters such as Democratic Republic of Congo, Guinea, and Niger have been benefitted by the improvement of metal prices. In many non-resource intensive low-income countries (e.g., Ethiopia, Indonesia, Malaysia, Rwanda,
Table 2.1 : A Snapshot of the World Economy- 2016
Country
GDP Growth (Annual
percentage change)
Inflation (Percent)
Unemployment (Percent)
Fiscal Deficit
(Percent of GDP)
Gross Debt
(Percent of GDP)
Argentina -2.3 … 8.5 -5.8 51.3Australia 2.5 1.3 5.7 -2.7 41.1Brazil -3.6 8.7 11.3 -9.0 78.3Canada 1.4 1.4 7.0 -1.9 92.3Chile 1.6 3.8 6.5 -2.9 21.2China 6.7 2.0 4.0 -3.7 46.2France 1.2 0.3 10.0 -3.3 96.6Germany 1.8 0.4 4.2 0.8 67.6Greece 0.0 0.0 23.8 0.0 181.3India 6.8 4.9 … -6.6 69.5Indonesia 5.0 3.5 5.6 -2.5 27.9Italy 0.9 -0.1 11.7 -2.4 132.6Japan 1.0 -0.1 3.1 -4.2 239.2Korea 2.8 1.0 3.7 0.3 38.6Malaysia 4.2 2.1 3.5 -3.0 56.3Mexico 2.3 2.8 4.3 -2.9 58.1Russia -0.2 7.0 5.5 -3.7 17.0Singapore 2.0 -0.5 2.1 3.3 112.0South Africa 0.3 6.3 26.7 -3.5 50.5Spain 3.2 -0.2 19.6 -4.6 99.3Sri Lanka 4.4 4.0 4.4 -5.4 79.3Thailand 3.2 0.2 0.8 0.5 42.2United Kingdom 1.8 0.6 4.9 -3.1 89.2United States 1.6 1.3 4.9 -4.4 107.4Vietnam 6.2 2.7 2.4 -6.6 62.4
Sources: World Economic Outlook, IMF, April 2017; Fiscal Monitor, IMF, April 2017 and Annual Report 2016, Central Bank of Sri Lanka … Not Available
Senegal, and Tanzania) will expand at a faster pace supported by the expansion of services sector, infrastructure investment and agricultural activities. However, non-economic factors such as intensification of security threats, geopolitical uncertainty, the emergence of conflict and worsening weather conditions would severely affect economic performance in low-income countries and beyond.

13
2.2 Inflation
The global headline inflation is expected to increase in 2017 with the uptick in commodity prices in both advanced and emerging market and developing economies. Advanced economies with the exception of Norway inflation rates are expected to be higher in 2017 than in 2016. The consumer price inflation in advanced economies is forecast to be 2.0 percent in 2017 from 0.8 percent in 2016. The annual inflation in the United States (US) is expected to increase to 2.7 percent in 2017 from 1.3 percent in 2016 due to the rise in energy prices. Inflation in the Euro economies is expected to reach 1.7 percent in 2017 from 0.2 percent in 2016 reflecting the base year effects from energy and food prices. The inflation in the United Kingdom (UK) increased to 2.5 percent in 2017 from 0.6 percent in 2016 due to the decline in consumer spending stemming from the depreciation of the sterling pound and rise in energy prices. Inflation in Japan is expected to moderate to 1.0 percent with higher energy prices, the depreciation of the Yen and a moderate increase in wages in 2017.
Meanwhile, inflation in emerging market and developing economies (excluding Argentina and Venezuela) is expected to pick up to 4.7 percent in 2017 from 4.4 percent in 2016 mostly owing to the increase in commodity prices. The inflation in China rose to 2.4 percent in 2017 from 2.0 percent in 2016 due to the uptick in producer prices and recovery of real estate investment. Inflation in India is expected to be at around 4.8 percent and 5.1 percent in 2017 and 2018, respectively. However, inflation rates in Brazil and Russia are expected to continue to decline due to the measures taken to reduce the currency depreciations and administered price hikes.
2.3 Interest Rates The “World Economic Outlook” (WEO) 2017 hypothesizes that the London interbank
offered rate (LIBOR) on six-month U.S. dollar deposits, on average, will be 1.7 percent in 2017 and 2.8 percent in 2018. Meanwhile, the rate on three-month Euro deposits is expected to average –0.3 percent and –0.2 percent in 2017 and 2018, respectively. The interest rate on six-month Japanese Yen deposits will turn out to be 0.0 in 2017 and 2018, respectively.
2.4 Exchange RatesExchange rates in both advanced economies and emerging market and developing economies are expected to strengthen in 2017, reflecting the firming of commodity prices. The US dollar started appreciating, after the US elections and Fed rate increase. With widening interest differentials, the U.S. dollar has strengthened by about 3.5 percent between August 2016 and late March 2017, whereas the euro and especially the Japanese yen have weakened. Several emerging market currencies depreciated substantially in recent months, particularly the Turkish Lira and Mexican Peso. The sharp decline of emerging-market currencies against the dollar have contributed to the high level of dollar-denominated debt of many non-financial corporations in emerging markets. However, the currencies of some commodity exporters particularly Russia, have appreciated with the gradual recovery in oil prices.
2.5 Fiscal DeficitsThe average fiscal balance of the world contracted by 0.2 percentage points to 3.4 percent of GDP in 2017 from 3.6 percent of GDP in 2016 and it is expected to further narrow in 2018. This contraction was mainly due to the improvements in economic activities in both advanced and emerging market and developing economies, gradual recovery in commodity prices and the recovery of the global trade. The fiscal deficit to GDP ratio of advanced economies, on

14
average, marginally improved to 2.7 percent in 2017 and expected to remain at the same level in 2018. However, fiscal deficit to GDP ratio of the emerging market and middle-income economies slightly contracted to 4.4 percent in 2017 from 4.8 percent in 2016 owing to the expected rise in oil and metal prices coupled with measures taken to the reduction of the deficit. However, many commodity exporters face substantial consolidation needs to ensure fiscal sustainability in the medium-term. Furthermore, the average fiscal deficit in low-income developing economies remained unchanged at around 4.4 percent of GDP in 2017 with the expected gradual tightening of the fiscal position.
2.6 Government Debt
In 2017, the government debt as a percentage of GDP in the globe contracted to 83.1 percent from 83.6 percent in 2016. The gross government debt as a percentage of GDP in advanced economies declined marginally to 107.1 percent in 2017 from 107.6 percent in 2016 and it is expected to stabilize in the medium-term. In contrast, government debt to GDP ratio in emerging market and developing economies is estimated to be around 48.6 percent and 49.8 percent in 2017 and in 2018, respectively. The government debt to GDP ratio in EMDEs is on the increase due to the weak fiscal situation related to the slow growth, higher financing costs, and the depreciations exchange rate. Meanwhile, the government debt to GDP ratio in low-income developing countries is expected to increase to 41.9 percent in 2017 from 40.4 percent in 2016, due to the widened fiscal deficits as a result of low tax revenue, high public investments and current spending and high interest expenses.
2.7 International Trade
The growth in world trade has rebounded since the second half of 2016 and remains strong in the first quarter of 2017. The
recovery in trade growth in 2017 will be supported by stronger industrial activity, investment growth in advanced economies, increased trade flows to and from China, and a diminished drag from weak import demand from commodity exporting EMDEs. The world trade volume is expected to grow by 2.4 percent in 2017 from a sluggish rate of 1.3 percent in last year. In 2018, the World Trade Organization (WTO) forecasts trade growth between 2.1 percent and 4.0 percent. According to the latest update of the WTO, exports of developed and developing and emerging economies are expected to be at 2.8 percent and 2.2 percent, respectively in 2017. Meanwhile, imports of developed and developing and emerging countries are expected to grow at 3.0 percent and 2.2 percent, respectively in 2017. Meanwhile, services trade is expected to be remained stable during the year with the robust global consumer spending, particularly in major advanced economies and strengthening of global goods trade.
2.8 Commodity prices
Commodity prices are expected to strengthen in 2017. Oil production declined in early 2017 as a result of the implementation of production cuts agreed in November 2016 by some OPEC and non-OPEC producers. However, these cuts were partly offset by stronger than expected shale oil production in the United States, following steep productivity improvements. However, the crude oil prices are forecast to rise to an average of USD 55 per barrel in 2017 from USD 43 per barrel in 2016. This increase reflects the rise in oil demand and falling stocks and the extension of production cuts by OPEC and non-OPEC producers until March 2018. Agricultural prices are projected to remain stable in 2017 and 2018. According to the “WEO 2017 report” of the IMF, oils and meals prices are projected to increase 3 percent amid tight supplies in the East Asian and South American supplies.

15
Beverage prices are forecast to decline 6 percent in 2017 due to the large cocoa supplies from West Africa. Raw materials prices are projected to gain 4 percent because of a supply shortfall in natural rubber.
Fertilizer prices are projected to increase 1 percent. Metal prices are forecast to increase 16 percent in 2017 mainly due to the strong demand from China and tightening markets for most metals.
Table 2.2 : International Commodity PricesUS Dollar
Item UnitActual Projection
2015 2016 2017 Q1
2017 Q2
2017 Q3
2017 Q4
EnergyCoal, Australia $MT 62.7 70.1 87.9 84.0 78.9 77.4Crude oil, average* $/bbl 50.8 42.8 53.0 50.9 51.8 52.1
Natural gas, US $/MMBTU 2.6 2.5 3.0 3.2 3.3 3.4
Non-energyAgriculture
BeveragesCocoa Beans $MT 3,135.2 2,892.0 2,097.4 1,926.1 1,920.1 1,953.1Coffee, robusta cts/lb 94.2 94.3 110.5 103.4 103.7 103.7Tea cts/kg 340.4 287.4 369.2 369.8 378.3 378.3
FoodFats and OilsPalm oil $MT 565.1 639.8 698.9 647.6 602.5 573.7Soybean meal $MT 352.7 350.2 364.3 339.0 334.0 336.8Soybeans $MT 347.4 362.7 375.5 346.4 341.0 341.4
GrainsMaize $MT 169.8 159.2 160.6 158.4 163.7 170.0Rice $MT 380.0 388.3 369.6 397.3 423.4 436.5Wheat $MT 185.6 143.2 143.6 144.3 151.6 161.4
Other foodSugar, free market cts/lb 13.2 18.5 19.6 15.7 15.1 15.4Raw materialsCotton cts/lb 70.4 74.2 84.8 87.5 86.3 82.8Rubber cts/lb 70.7 74.5 115.4 100.0 92.6 87.0Sawn wood, Hardwood $/M3 833.3 738.9 674.9 688.4 688.4 688.4Metals and MineralsAluminum $MT 1,664.7 1,604.2 1,851.2 1,925.9 1,951.4 1,959.8Copper $MT 5,510.5 4,867.9 5,840.0 5,643.8 5,659.8 5,680.2Nickel $MT 11,862.6 9,595.2 10,273.1 9,277.1 9,077.5 9,133.3
Source: Adapted from the Price Forecast (29.05.2017) IMF, available at www.imf.org/external/np/res/commod/index.aspx
* Petroleum price is average of spot prices for U.K. Brent, Dubai and West Texas Intermediate.

16

17
3.1 Overview
The Government continued the implementation of revenue based fiscal consolidation process in the first four months of 2017 which will assist in containing budget deficit in the medium-term. Consistent with Government’s sturdy commitment towards returning the budget deficit to a sustainable level, the total revenue increased significantly by 24.6 percent to Rs. 589.7 billion in the review period of 2017 compared to Rs. 472.7 billion in the same period of 2016. Similarly, the non-tax revenue increased by 10.3 percent to Rs. 35 billion in the review period from Rs. 31 billion in the respective period of 2016. This fiscal consolidation helped relatively expand the fiscal space in the first four months of 2017 and allowed the Government to accommodate more resources for public investment. Total expenditure increased by 16.5 percent to Rs. 822.8 billion in the review period as a result of the increased expenditure on public investments by 32.3 percent to Rs. 201 billion in the first four months of 2017 compared to Rs. 152 billion in the same period of 2016.
The Several tax reforms were undertaken to augment the government revenue through broadening the tax base, simplifying the tax system, rationalizing the tax exemptions and strengthening the tax administration. The reforms included the increase in Value Added Tax (VAT) rate from 11 percent to 15 percent, the expansion of VAT base by reducing VAT registration threshold and removing several tax exemptions, reducing the threshold level of Nation Building Tax (NBT), Economic Service Charge (ESC) rate hike, the increase in unit rates of excise duty applicable to motor vehicles followed by strengthening the tax administration through the commencement of Revenue Management Information System (RAMIS) at the Inland Revenue Department (IRD),
Single Window System at the Sri Lanka Customs (SLC) and Integrated Treasury Management Information System (ITMIS) at the General Treasury. In addition, new Inland Revenue Act has been already drafted to simply the tax laws which will help increase tax revenue collection of the Government.
Benefiting from the policy measures taken by the Government coupled with the increase in domestic activities, the revenue generated from indirect taxes gained its momentum in the first four months of 2017. Domestic consumption-based taxes increased significantly by 32.3 percent to Rs. 177,153 million while import-based taxes increased by 22.5 percent to Rs. 277,927 million in the first four months of 2017 compared to same period of 2016. Revenue generated from Value Added Tax (VAT) on domestic activities increased by 88.6 percent to Rs. 96,811 million and VAT on imports increased by 95.1 percent to Rs. 55,759 million in the first four months of 2017 compared to same period of 2016 due to the increase in tax rate to 15 percent from 11 percent together with the expansion of the VAT base by reducing the VAT liable threshold to Rs. 12 million per annum and reducing the threshold of VAT liability turnover applicable for wholesale and retail trade to Rs. 12.5 million per quarter from Rs. 100 million per quarter. Revenue from NBT on domestic activities increased by 55.3 percent to Rs. 16,644 million, reflecting the policy decision taken to reduce the NBT threshold for registration from Rs. 15 million per annum to Rs. 12 million per annum. Meanwhile, NBT on import activities increased marginally by 1.6 percent to Rs. 6,119 million during the review period.
Revenue collected from excise duty on liquor and cigarette declined by 9.3 percent and 17.1 percent, respectively in the review period as a result of the decline in production coupled
CHAPTER 3Fiscal Developments
18
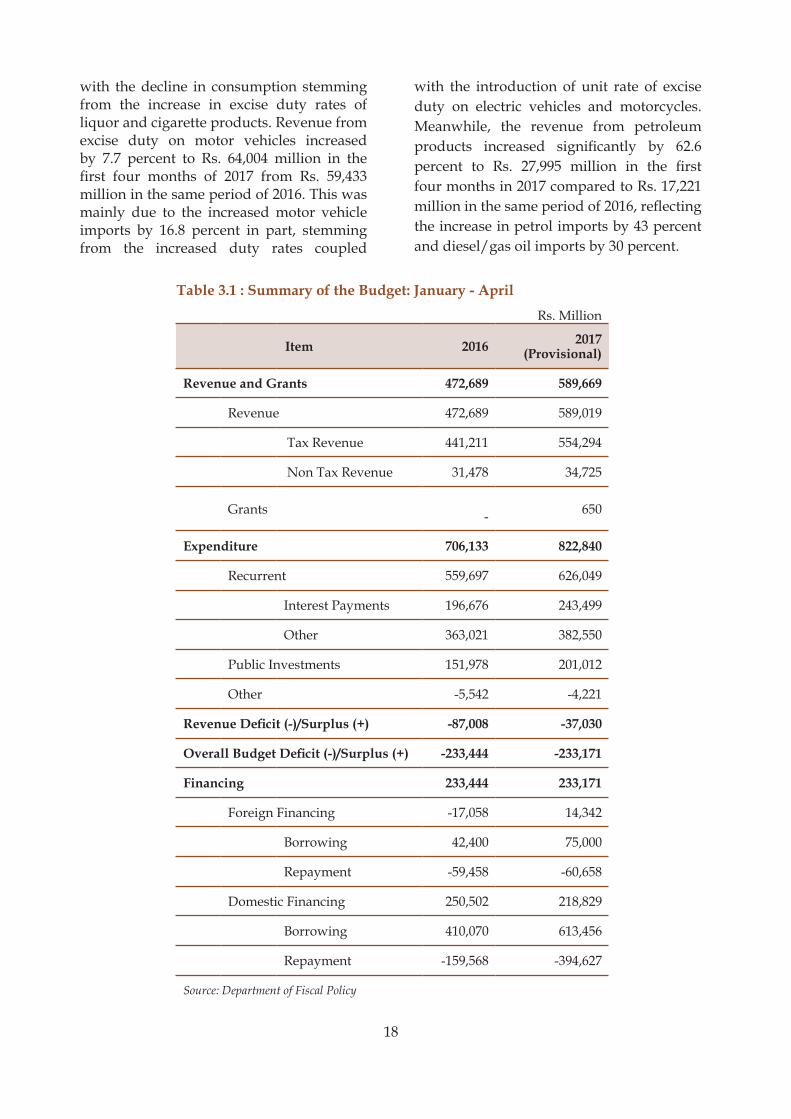
with the decline in consumption stemming from the increase in excise duty rates of liquor and cigarette products. Revenue from excise duty on motor vehicles increased by 7.7 percent to Rs. 64,004 million in the first four months of 2017 from Rs. 59,433 million in the same period of 2016. This was mainly due to the increased motor vehicle imports by 16.8 percent in part, stemming from the increased duty rates coupled
with the introduction of unit rate of excise duty on electric vehicles and motorcycles. Meanwhile, the revenue from petroleum products increased significantly by 62.6 percent to Rs. 27,995 million in the first four months in 2017 compared to Rs. 17,221 million in the same period of 2016, reflecting the increase in petrol imports by 43 percent and diesel/gas oil imports by 30 percent.
Rs. Million
Item 2016 2017 (Provisional)
Revenue and Grants 472,689 589,669
Revenue 472,689 589,019
Tax Revenue 441,211 554,294
Non Tax Revenue 31,478 34,725
Grants - 650
Expenditure 706,133 822,840
Recurrent 559,697 626,049
Interest Payments 196,676 243,499
Other 363,021 382,550
Public Investments 151,978 201,012
Other -5,542 -4,221
Revenue Deficit (-)/Surplus (+) -87,008 -37,030
Overall Budget Deficit (-)/Surplus (+) -233,444 -233,171
Financing 233,444 233,171
Foreign Financing -17,058 14,342
Borrowing 42,400 75,000
Repayment -59,458 -60,658
Domestic Financing 250,502 218,829
Borrowing 410,070 613,456
Repayment -159,568 -394,627
Source: Department of Fiscal Policy
Table 3.1 : Summary of the Budget: January - April

19
Revenue from Ports and Airports Development Levy (PAL) increased significantly by 18.1 percent to Rs. 32,353 million in the first four months of 2017 compared to Rs. 27,406 million in the same period of 2016 due to the increase in imports. Revenue from commodity export subsidy scheme (Cess) levy increased by 8.2 percent to Rs. 20,214 million and revenue from Special Commodity Levy (SCL) increased by 14.1 percent to Rs. 24,091 million in the review period owing to the rate revisions made in selected commodities to support domestic production. Meanwhile, revenue from import duties declined moderately by 2.2 percent to Rs. 47,392 million in the first four months of 2017.
In terms of direct taxes, the revenue generated from corporate and non-corporate income tax increased by 13.3 percent to Rs. 34,643 million in the first four months of 2017 reflecting the expansion of banking and financial services, wholesale trade and manufacturing sectors. The revenue from Pay-As-You-Earn (PAYE) tax enhanced by 24.9 percent to Rs. 12,274 million in the review period benefiting from the enhanced salaries and wages in both private and public sectors. Meanwhile, revenue collected from ESC increased significantly by 564.4 percent to Rs. 19,199 million during the review period as a result of the increase in ESC rate from 0.25 percent to 0.5 percent, the removal of existing exclusion of profit making business and imposition of ESC at the point of importation on certain goods. However, revenue from a tax on interest declined by 14.8 percent to Rs. 18,359 million in the review period of 2017.
Meanwhile, non-tax revenue increased by 10.3 percent to Rs. 34,725 million in the first four months of 2017 compared to Rs. 31,478 million in the same period of 2016. All sources of non-tax revenue covering rent, interest, sales and charges and social security contributed this increase. The only exception was the profit and dividends income which has declined by 44.1 percent in the review period.
The government expenditure increased by 16.5 percent to Rs. 822,840 million in the first four months of 2017 compared to Rs. 706,133 million recorded in the same period of 2016. The recurrent expenditure which constitutes of 78.1 percent of total expenditure, increased by 11.9 percent to Rs. 626,049 million while expenditure on public investments increased by 32.3 percent to Rs. 201,012 million during the review period. The government deficit marginally declined by 0.1 percent to Rs. 233,171 million during January to April 2017 compared to Rs. 233,444 million recorded in the same period of 2016.
The Government has taken several measures to contain government expenditure by rationalizing expenditure along with prioritizing public investments. Expenditure management and implementation of the zero-based budgetary system will pave the way to reduce unproductive expenditure. In addition, quarterly expenditure and revenue commitments would help efficient management of public finance. Meanwhile, structural adjustments on key State Owned Business Enterprises (SOBEs) are being undertaken to improve their efficiency and productivity.
Table 3.1 : Summary of the Budget: January - April
20
3.2 Government Revenue
Total government revenue, in nominal terms, increased by 24.6 percent to Rs. 589,017 million during the first four months of 2017 from Rs. 472,689 million recorded in the same period of 2016 benefiting from the increase in tax revenue and non- tax revenue in the period concerned. The tax revenue increased by 25.6 percent to Rs. 554,294 million during the first four months of 2017 from Rs. 441,211 million in the same period of 2016, reflecting the increase in the revenue from income tax, domestic consumption-based taxes and import-based taxes.
The domestic consumption-based taxes increased by 32.3 percent to Rs. 177,153 million in the first four months of 2017 compared to Rs. 133,862 million recorded in the same period of 2016 while import-based taxes increased by 22.5 percent to 277.927 million in the review period from Rs. 226,892 million in the same period of 2016. This surge was mainly due to higher revenue collection from VAT (90.9 percent),
Income tax (30.2 percent), excise tax on petroleum products (62.6 percent), Ports and Airports Development Levy (18.1 percent) and Nation Building Tax (36 percent). In particular, revenue from Economic Service Charge (ESC) significantly increased by 564.4 percent to Rs. 19,199 million in the first four months of 2017 mainly due to the increase in ESC rate from 0.25 percent to 0.5 percent and the removal of the maximum liability of Rs. 120 million per year coupled with the arrest of profit making business into ESC liability. However, the revenue from Excise duty on liquor, tobacco and cigarette, import duty, Telecommunication levy and Withholding tax declined during the first four months of 2017 compared to the same period of 2016.
Meanwhile, the non-tax revenue increased by 10.3 percent to Rs. 34,725 million in the first four months of 2017 benefiting from the increase in sales and chargers, social security contribution and rent income,. However, the revenue from profit and dividends transfers of State Owned Business Enterprises (SOBEs) declined during the period.
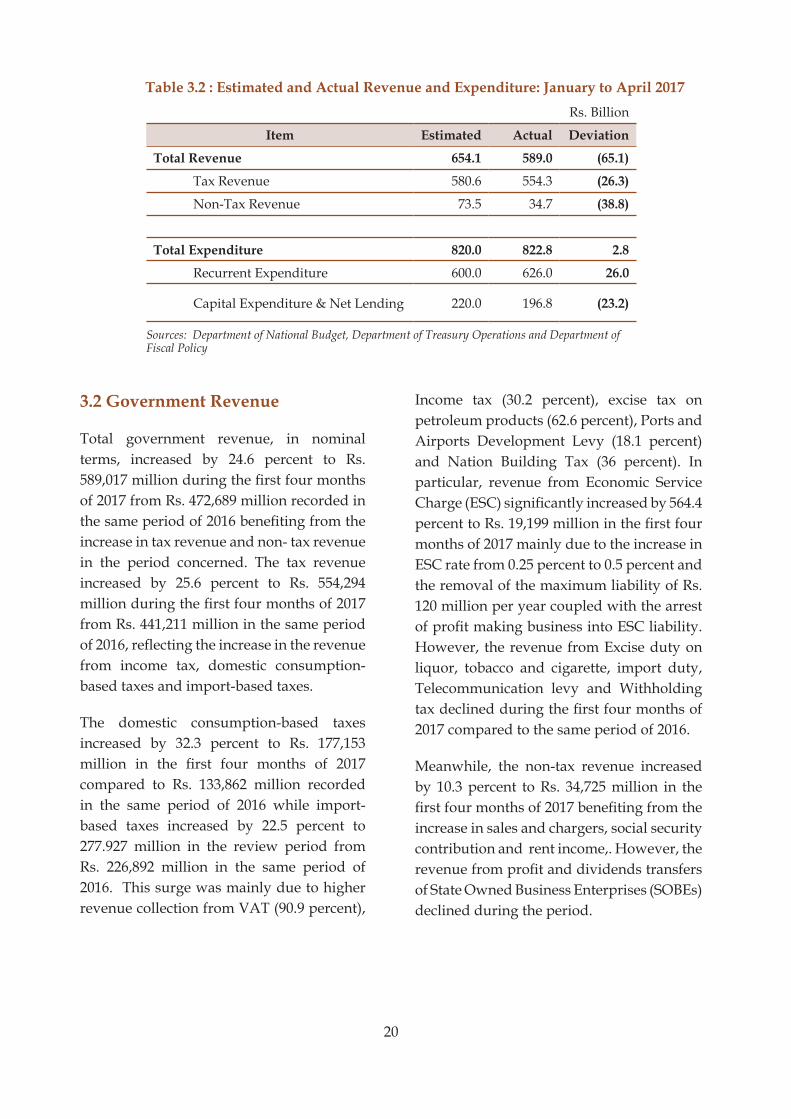
Rs. Billion
Item Estimated Actual Deviation
Total Revenue 654.1 589.0 (65.1)
Tax Revenue 580.6 554.3 (26.3)
Non-Tax Revenue 73.5 34.7 (38.8)
Total Expenditure 820.0 822.8 2.8
Recurrent Expenditure 600.0 626.0 26.0
Capital Expenditure & Net Lending 220.0 196.8 (23.2)
Sources: Department of National Budget, Department of Treasury Operations and Department of Fiscal Policy
Table 3.2 : Estimated and Actual Revenue and Expenditure: January to April 2017

21
Rs. Billion
Item Estimated Actual
Inland Revenue Department
Tax on Income and Profit 102.7 84.5
VAT - Domestic 75.0 96.8
NBT - Domestic 13.0 16.6
Sub Total 190.7 197.9
Customs Department
Import Duties 55.0 47.4
VAT - Imports 50.0 55.8
NBT - Imports 7.0 6.1
Ports and Airports Development Levy 35.0 32.4
Import/Export Cess 20.0 20.2
Special Commodity Levy & Other 20.0 24.1
Excise Special Provisions 121.8 117.4
Excise on Cigarettes 32.0 23.8
Petroleum Products 18.0 28.0
Motor Vehicle & Other 71.8 65.6
Sub Total 308.8 303.4
Excise Department
Liquor 55.0 38.3
Sub Total 55.0 38.3
Other
Telecommunication Levy 15.0 11.6
License Tax & Other 7.0 3.1
Sub Total 22.0 14.7
Total Tax Revenue 576.5 554.3
Source: Department of Fiscal Policy
Table 3.3 : Estimated and Actual Tax Revenue: January - April 2017
22
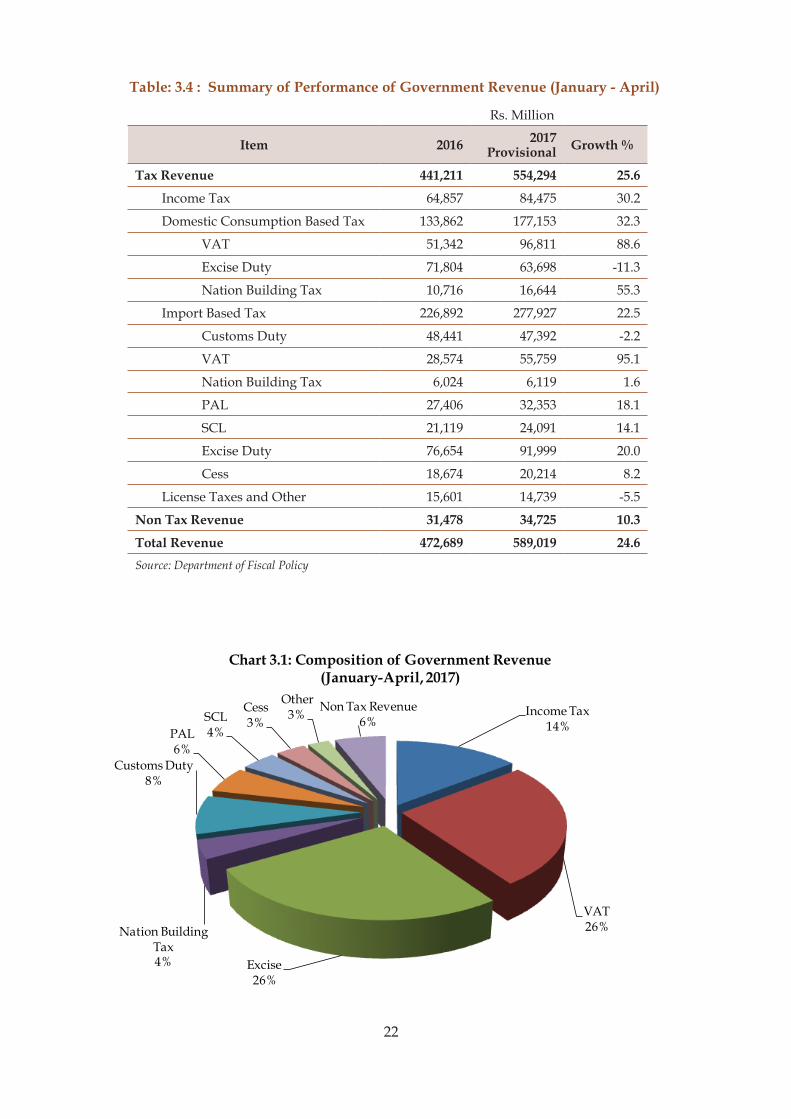
Item 2016 2017 Provisional Growth %
Tax Revenue 441,211 554,294 25.6
Income Tax 64,857 84,475 30.2
Domestic Consumption Based Tax 133,862 177,153 32.3
VAT 51,342 96,811 88.6
Excise Duty 71,804 63,698 -11.3
Nation Building Tax 10,716 16,644 55.3
Import Based Tax 226,892 277,927 22.5
Customs Duty 48,441 47,392 -2.2
VAT 28,574 55,759 95.1
Nation Building Tax 6,024 6,119 1.6
PAL 27,406 32,353 18.1
SCL 21,119 24,091 14.1
Excise Duty 76,654 91,999 20.0
Cess 18,674 20,214 8.2
License Taxes and Other 15,601 14,739 -5.5
Non Tax Revenue 31,478 34,725 10.3
Total Revenue 472,689 589,019 24.6Source: Department of Fiscal Policy
Table: 3.4 : Summary of Performance of Government Revenue (January - April)
Rs. Million
Income Tax14%
VAT26%
Excise26%
Nation Building Tax4%
Customs Duty8%
PAL6%
SCL4%
Cess3%
Other3% Non Tax Revenue
6%
Chart 3.1: Composition of Government Revenue (January-April, 2017)

23
Income TaxThe total revenue from income tax increased by 30.2 percent to Rs. 84,475 million during
Tax Base 2016 2017 Provisional % Change
Corporate and Non Corporate 30,582 34,643 13.3
PAYE 9,828 12,274 24.9
Tax on Interest Income 21,557 18,359 -14.8
Economic Service Charge 2,890 19,199 564.3
Total 64,857 84,475 30.2
Source: Department of Fiscal Policy
The revenue generated from corporate and non-corporate income tax significantly increased by 13.3 percent to Rs. 34,643 million in first four months of 2017 compared to Rs. 30,582 million in the respective period of 2016. Banking and financial services, wholesale trade and manufacturing sectors mainly contributed to this growth. During the first four months of 2017, the revenue from PAYE tax increased by 24.9 percent to Rs. 12,274 million from Rs. 9,828 million in the review period of 2016. The increase in salaries and wages in both private sector and the government sector and employment in high earning categories in sectors such as professional services, banking sector and tourism were attributable to this growth.
The tax on ESC increased significantly by 564.4 percent to Rs.19,199 million in the first for months of 2017, compared to the same period of 2016 benefiting from the broadening tax base by removing the tax exemption on profit making businesses and the increased tax rate from 0.25 percent to 0.5 percent. However, the revenue from tax on
interest declined by 14.8 percent to Rs. 18,359 million.
Value Added Tax (VAT)
Revenue collected from VAT increased significantly by 90.9 percent to Rs. 152,570 million during the first four months of 2017 compared to Rs. 79,916 million in the same period of 2016. This was mainly due to the increase in VAT rate from 11 percent to 15 percent, the expansion of VAT base by reducing VAT registration threshold and removing several tax exemptions, and increased VAT compliance with the commencement of Revenue Management Information System (RAMIS) at the Inland Revenue Department (IRD).
Revenue generated from VAT on domestic activities expanded by 88.6 percent to 96,811 million in the first four months of 2017 from Rs. 51,342 million recorded in the same period of 2016 while VAT revenue on imports increased by 95.1 percent to 55,759 million January-April 2017 compared to Rs. 28,574 million in the same period of 2016.
the first four months of 2017, compared to Rs. 64,857 million in the respective period of the previous year.
Rs. Million
Table 3.5 : Performance of Income Tax Revenue (January - April)

24
Rs. Million
Tax Base 2016 2017 Provisional Growth (% )
Domestic 51,342 96,811 88.6
Imports 28,574 55,759 95.1
Gross Revenue 79,916 152,570 90.9
Refunds 123 199 61.9
Net Revenue 79,793 152,371 91.0
Refunds as % of Gross Revenue 0.2 0.1
Source : Department of Fiscal Policy
Excise Duty
The revenue generated from excise duty increased by 4.9 percent to Rs. 155,697 million in the first four months of 2017 compared to Rs. 148,458 million in the same period of 2016 led by the increase in revenue from petroleum products and motor vehicles. The revenue from petroleum products
Rs. Million
Tax Base 2016 2017 Provisional
Growth (%)
Liquor 42,193 38,262 (9.3)
Cigarettes and Tobacco 28,764 23,840 (17.1)
Motor Vehicles 59,433 64,004 7.7
Petroleum 17,221 27,995 62.6
Other 847 1,596 88.5
Total 148,458 155,697 4.9
Source: Department of Fiscal Policy
significantly increased by 62.6 percent to Rs. 27,995 million in the first four months in 2017 compared to Rs. 17,221 million in the same period of 2016. This was mainly due to the increase in petrol imports by 43 percent and diesel/gas oil imports by 30 percent together with the enhanced domestic demand for such products in the economy.
Table 3.6 : Performance of Revenue of VAT (January - April)
Table 3.7: Performance of Excise Duty (January - April)

25
Revenue from motor vehicle imports increased by 7.7 percent to Rs. 64,004 million in the first four months of 2017 compared to Rs. 59,433 million in the same period of 2016. This increase was mainly owing to the increase in unit rates of excise duty applicable to motor vehicles during the reference period along with the Government policy towards discouraging high-emission vehicle imports to the country. Total vehicle imports increased by 16.8 percent to 155,942 during the review period of 2017 compared to 133,511 recorded in the same period of 2016. This was mainly benefited with increased motor cycle imports by 40.6 percent. However, imports of motor cars deelined by 13.8 percent and three-wheelers by 69.2 due to increased tax rates on Excise duty.
The revenue generated from liquor dropped by 9.3 percent to Rs. 38,262 million in January-April 2017 from Rs. 42,193 million in the same period of 2016 as a result of decline in production of hard liquor by 7.3 percent and malt liquor by 38.9 percent. Similarly, the revenue from cigarette and tobacco products declined by 17.1 percent to Rs. 23,840 million in the first four months of 2017 compared to Rs. 28,764 million in the same period of 2016. This was a combined effect of the drop in production of cigarette by 31 percent coupled with increased duty rates on cigarette sticks.
Table 3.8 : Motor Vehicle Imports and New Registration of Vehicles - January to April
Unit: Number
Item Imports New Registrations2016 2017 Change %
Change2016 2017 Change %
ChangeMotor Cars 15,436 13,313 -2,123 -13.8 15,300 12,760 -2,540 -16.6Three Wheelers 13,345 4,112 -9,233 -69.2 14,555 7,546 -7,009 -48.2Motor Cycles 88,198 123,999 35,801 40.6 99,006 113,225 14,219 14.4Passenger Vehicles 923 955 32 3.5 871 999 128 14.7Goods Transport Vehicles(a)
9,853 9,605 -248 -2.5 9,346 9,507 161 1.7
Land Vehicles (b) 5,756 3,958 -1,798 -31.2 4,103 4,398 295 7.2Total 133,511 155,942 22,431 16.8 143,181 148,435 5,254 3.7Source: Department of Customs and Department of Motor Traffic
(a) Lorries and Other Goods Transport Vehicles.
(b) Tractors, Hand Tractors and Other Land Vehicles.
-
10,000
20,000
30,000
40,000
50,000
60,000
70,000
Liquor Cigarettes and
Tobacco
Motor Vehicles
Petroleum Other
Rs.
Mn.
Chart 3.2: Performance of Excise Duty (January-April 2016 and 2017)
2016
2017
26
Import Duty and Special Commodity Levy (SCL)
Revenue generated from import duty moderately declined by 2.2 percent to Rs. 47,392 million during the first four months of 2017 compared to Rs. 48,440 million in the same period of 2016.
The revenue generated from Special Commodity Levy (SCL) increased by 14.1 percent to Rs. 24,091 million during the first four months of 2017, compared to Rs. 21,119 million recorded in the first four months of 2016. The increase of the revenue was mainly attributable to the increase of number of products coming under the SCL and upward revision of the SCL rates to encourage domestic production of potatoes, big onions, onions, green gram and sugar etc.
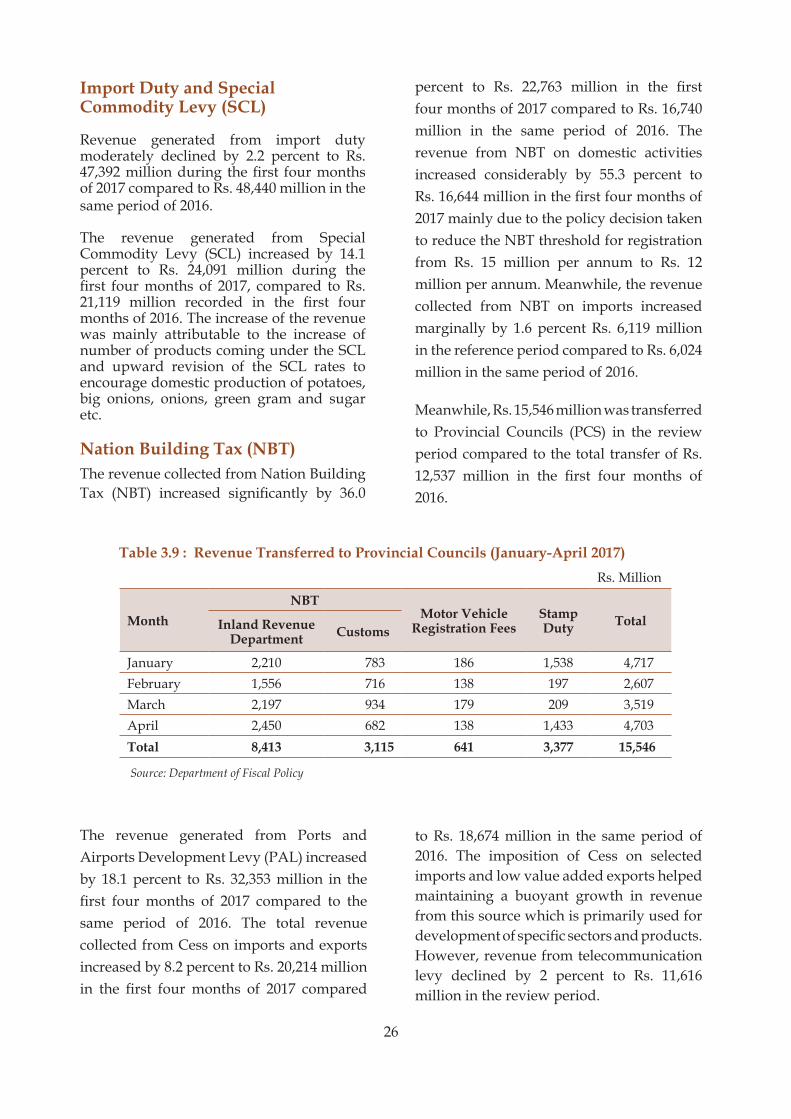
Nation Building Tax (NBT)The revenue collected from Nation Building Tax (NBT) increased significantly by 36.0
percent to Rs. 22,763 million in the first four months of 2017 compared to Rs. 16,740 million in the same period of 2016. The revenue from NBT on domestic activities increased considerably by 55.3 percent to Rs. 16,644 million in the first four months of 2017 mainly due to the policy decision taken to reduce the NBT threshold for registration from Rs. 15 million per annum to Rs. 12 million per annum. Meanwhile, the revenue collected from NBT on imports increased marginally by 1.6 percent Rs. 6,119 million in the reference period compared to Rs. 6,024 million in the same period of 2016.
Meanwhile, Rs. 15,546 million was transferred to Provincial Councils (PCS) in the review period compared to the total transfer of Rs. 12,537 million in the first four months of 2016.
Rs. Million
MonthNBT
Motor Vehicle Registration Fees
Stamp Duty TotalInland Revenue
Department Customs
January 2,210 783 186 1,538 4,717 February 1,556 716 138 197 2,607 March 2,197 934 179 209 3,519 April 2,450 682 138 1,433 4,703 Total 8,413 3,115 641 3,377 15,546
Source: Department of Fiscal Policy
The revenue generated from Ports and Airports Development Levy (PAL) increased by 18.1 percent to Rs. 32,353 million in the first four months of 2017 compared to the same period of 2016. The total revenue collected from Cess on imports and exports increased by 8.2 percent to Rs. 20,214 million in the first four months of 2017 compared
to Rs. 18,674 million in the same period of 2016. The imposition of Cess on selected imports and low value added exports helped maintaining a buoyant growth in revenue from this source which is primarily used for development of specific sectors and products. However, revenue from telecommunication levy declined by 2 percent to Rs. 11,616 million in the review period.
Table 3.9 : Revenue Transferred to Provincial Councils (January-April 2017)
27
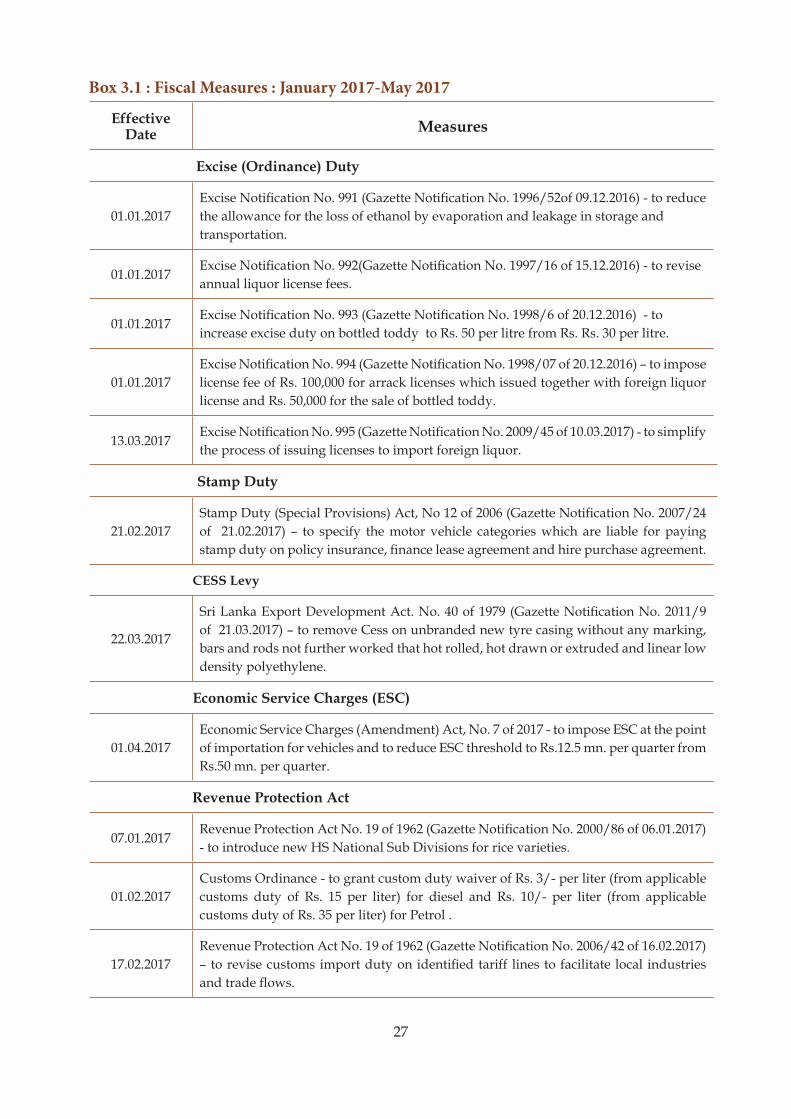
Box 3.1 : Fiscal Measures : January 2017-May 2017
Effective Date Measures
Excise (Ordinance) Duty
01.01.2017Excise Notification No. 991 (Gazette Notification No. 1996/52of 09.12.2016) - to reduce the allowance for the loss of ethanol by evaporation and leakage in storage and transportation.
01.01.2017Excise Notification No. 992(Gazette Notification No. 1997/16 of 15.12.2016) - to revise annual liquor license fees.
01.01.2017Excise Notification No. 993 (Gazette Notification No. 1998/6 of 20.12.2016) - to increase excise duty on bottled toddy to Rs. 50 per litre from Rs. Rs. 30 per litre.
01.01.2017Excise Notification No. 994 (Gazette Notification No. 1998/07 of 20.12.2016) – to impose license fee of Rs. 100,000 for arrack licenses which issued together with foreign liquor license and Rs. 50,000 for the sale of bottled toddy.
13.03.2017Excise Notification No. 995 (Gazette Notification No. 2009/45 of 10.03.2017) - to simplify the process of issuing licenses to import foreign liquor.
Stamp Duty
21.02.2017Stamp Duty (Special Provisions) Act, No 12 of 2006 (Gazette Notification No. 2007/24 of 21.02.2017) – to specify the motor vehicle categories which are liable for paying stamp duty on policy insurance, finance lease agreement and hire purchase agreement.
CESS Levy
22.03.2017
Sri Lanka Export Development Act. No. 40 of 1979 (Gazette Notification No. 2011/9 of 21.03.2017) – to remove Cess on unbranded new tyre casing without any marking, bars and rods not further worked that hot rolled, hot drawn or extruded and linear low density polyethylene.
Economic Service Charges (ESC)
01.04.2017Economic Service Charges (Amendment) Act, No. 7 of 2017 - to impose ESC at the point of importation for vehicles and to reduce ESC threshold to Rs.12.5 mn. per quarter from Rs.50 mn. per quarter.
Revenue Protection Act
07.01.2017Revenue Protection Act No. 19 of 1962 (Gazette Notification No. 2000/86 of 06.01.2017) - to introduce new HS National Sub Divisions for rice varieties.
01.02.2017Customs Ordinance - to grant custom duty waiver of Rs. 3/- per liter (from applicable customs duty of Rs. 15 per liter) for diesel and Rs. 10/- per liter (from applicable customs duty of Rs. 35 per liter) for Petrol .
17.02.2017Revenue Protection Act No. 19 of 1962 (Gazette Notification No. 2006/42 of 16.02.2017) – to revise customs import duty on identified tariff lines to facilitate local industries and trade flows.
28
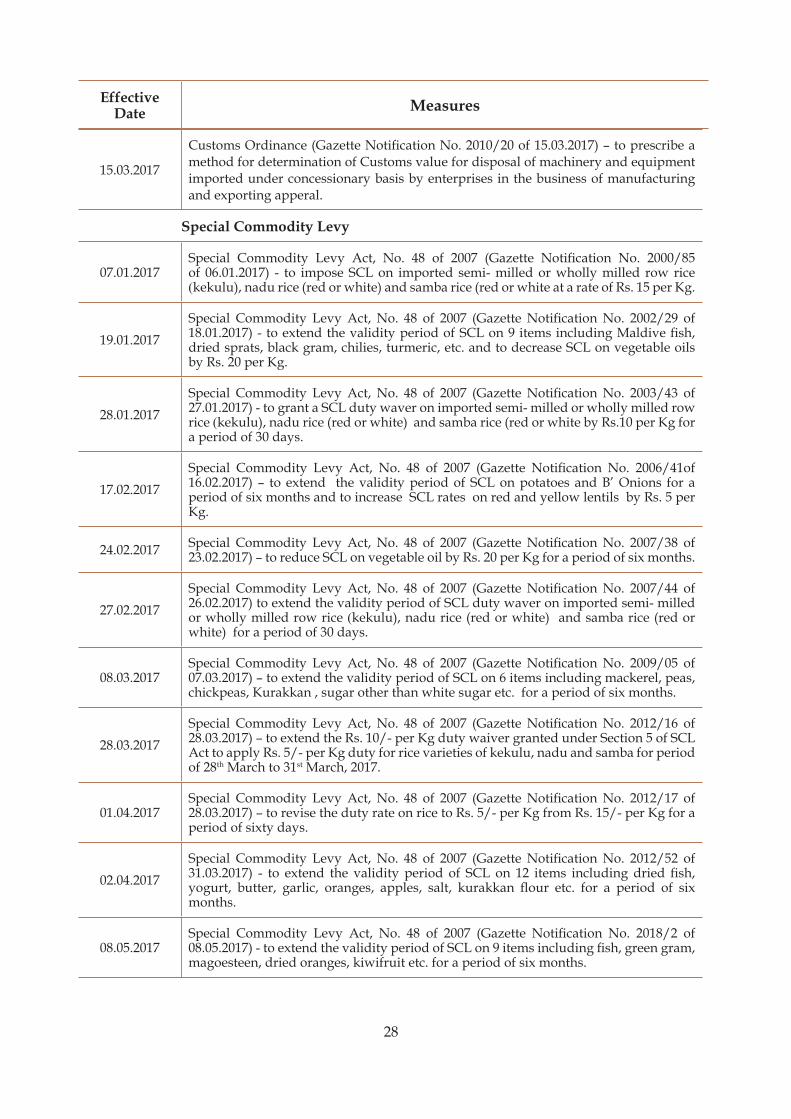
15.03.2017
Customs Ordinance (Gazette Notification No. 2010/20 of 15.03.2017) – to prescribe a method for determination of Customs value for disposal of machinery and equipment imported under concessionary basis by enterprises in the business of manufacturing and exporting apperal.
Special Commodity Levy
07.01.2017Special Commodity Levy Act, No. 48 of 2007 (Gazette Notification No. 2000/85 of 06.01.2017) - to impose SCL on imported semi- milled or wholly milled row rice (kekulu), nadu rice (red or white) and samba rice (red or white at a rate of Rs. 15 per Kg.
19.01.2017Special Commodity Levy Act, No. 48 of 2007 (Gazette Notification No. 2002/29 of 18.01.2017) - to extend the validity period of SCL on 9 items including Maldive fish, dried sprats, black gram, chilies, turmeric, etc. and to decrease SCL on vegetable oils by Rs. 20 per Kg.
28.01.2017Special Commodity Levy Act, No. 48 of 2007 (Gazette Notification No. 2003/43 of 27.01.2017) - to grant a SCL duty waver on imported semi- milled or wholly milled row rice (kekulu), nadu rice (red or white) and samba rice (red or white by Rs.10 per Kg for a period of 30 days.
17.02.2017Special Commodity Levy Act, No. 48 of 2007 (Gazette Notification No. 2006/41of 16.02.2017) – to extend the validity period of SCL on potatoes and B’ Onions for a period of six months and to increase SCL rates on red and yellow lentils by Rs. 5 per Kg.
24.02.2017 Special Commodity Levy Act, No. 48 of 2007 (Gazette Notification No. 2007/38 of 23.02.2017) – to reduce SCL on vegetable oil by Rs. 20 per Kg for a period of six months.
27.02.2017Special Commodity Levy Act, No. 48 of 2007 (Gazette Notification No. 2007/44 of 26.02.2017) to extend the validity period of SCL duty waver on imported semi- milled or wholly milled row rice (kekulu), nadu rice (red or white) and samba rice (red or white) for a period of 30 days.
08.03.2017Special Commodity Levy Act, No. 48 of 2007 (Gazette Notification No. 2009/05 of 07.03.2017) – to extend the validity period of SCL on 6 items including mackerel, peas, chickpeas, Kurakkan , sugar other than white sugar etc. for a period of six months.
28.03.2017Special Commodity Levy Act, No. 48 of 2007 (Gazette Notification No. 2012/16 of 28.03.2017) – to extend the Rs. 10/- per Kg duty waiver granted under Section 5 of SCL Act to apply Rs. 5/- per Kg duty for rice varieties of kekulu, nadu and samba for period of 28th March to 31st March, 2017.
01.04.2017Special Commodity Levy Act, No. 48 of 2007 (Gazette Notification No. 2012/17 of 28.03.2017) – to revise the duty rate on rice to Rs. 5/- per Kg from Rs. 15/- per Kg for a period of sixty days.
02.04.2017Special Commodity Levy Act, No. 48 of 2007 (Gazette Notification No. 2012/52 of 31.03.2017) - to extend the validity period of SCL on 12 items including dried fish, yogurt, butter, garlic, oranges, apples, salt, kurakkan flour etc. for a period of six months.
08.05.2017Special Commodity Levy Act, No. 48 of 2007 (Gazette Notification No. 2018/2 of 08.05.2017) - to extend the validity period of SCL on 9 items including fish, green gram, magoesteen, dried oranges, kiwifruit etc. for a period of six months.
Effective Date Measures
29
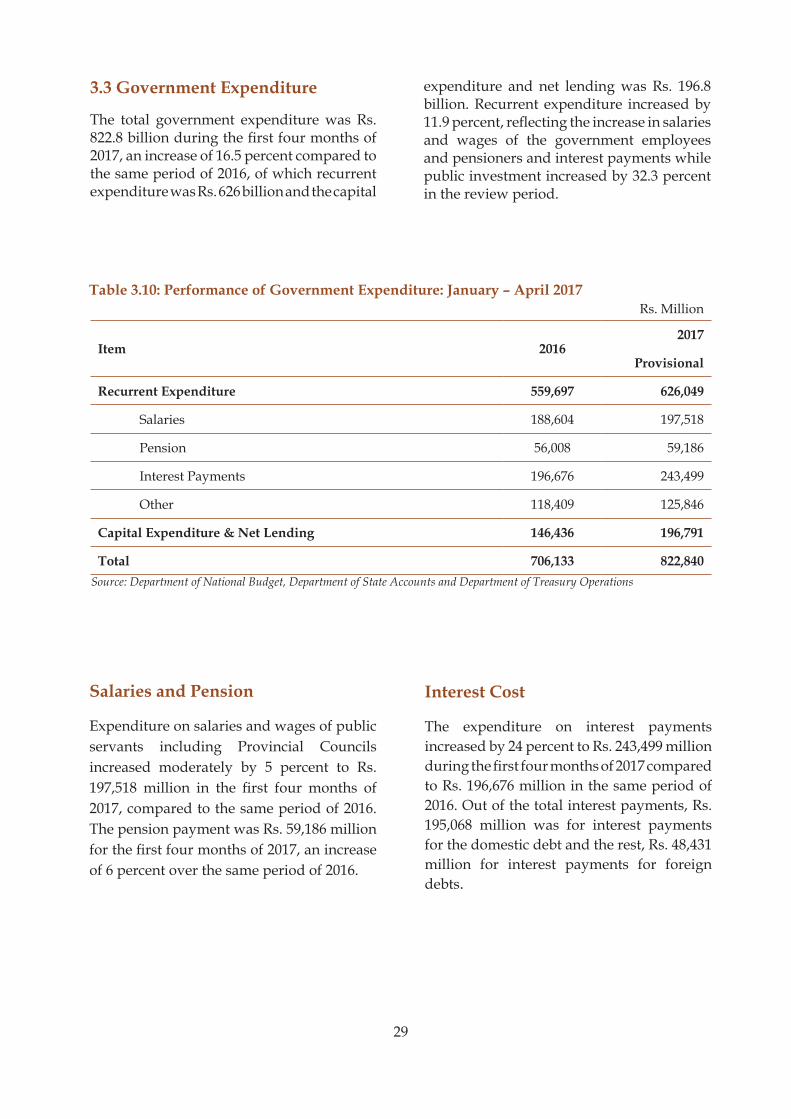
3.3 Government Expenditure
The total government expenditure was Rs. 822.8 billion during the first four months of 2017, an increase of 16.5 percent compared to the same period of 2016, of which recurrent expenditure was Rs. 626 billion and the capital
Salaries and Pension
Expenditure on salaries and wages of public servants including Provincial Councils increased moderately by 5 percent to Rs. 197,518 million in the first four months of 2017, compared to the same period of 2016. The pension payment was Rs. 59,186 million for the first four months of 2017, an increase of 6 percent over the same period of 2016.
expenditure and net lending was Rs. 196.8 billion. Recurrent expenditure increased by 11.9 percent, reflecting the increase in salaries and wages of the government employees and pensioners and interest payments while public investment increased by 32.3 percent in the review period.
Interest Cost
The expenditure on interest payments increased by 24 percent to Rs. 243,499 million during the first four months of 2017 compared to Rs. 196,676 million in the same period of 2016. Out of the total interest payments, Rs. 195,068 million was for interest payments for the domestic debt and the rest, Rs. 48,431 million for interest payments for foreign debts.
Rs. Million
Item 20162017
Provisional
Recurrent Expenditure 559,697 626,049
Salaries 188,604 197,518
Pension 56,008 59,186
Interest Payments 196,676 243,499
Other 118,409 125,846
Capital Expenditure & Net Lending 146,436 196,791
Total 706,133 822,840
Table 3.10: Performance of Government Expenditure: January – April 2017
Source: Department of National Budget, Department of State Accounts and Department of Treasury Operations

30
Period
Treasury Bills Treasury Bonds Monthly Average Exchange Rate (Rs./US$)
91 Days
182 Days
364 Days
2 Years
3 Years
4 Years
5 Years
2016
Jan 6.78 7.19 7.80 - - - - 143.94
Feb 7.14 8.07 8.50 10 - - 11.42 143.93
Mar 8.90 9.76 10.64 11.75 11.75 12.78 13.00 143.96
Apr 8.45 9.53 10.17 - 11.53 11.78 - 143.90
May 8.71 9.67 10.48 11.83 11.51 12.11 12.48 145.65
Jun 8.88 9.86 10.55 11.42 11.58 11.93 11.89 145.28
Jul 8.80 9.69 10.48 11.04 11.62 - 12.07 145.41
Aug 9.03 9.94 10.73 - - - 11.76 145.60
Sep 8.55 9.39 10.11 - - 10.61 - 145.78
Oct 8.60 9.48 10.24 - - - - 146.87
Nov 8.60 9.55 10.10 - - - - 147.77
Dec 8.72 9.63 10.17 - - 11.94 - 148.88
2017
Jan 9.03 10.07 10.37 - - - 12.19 150.09
Feb 9.32 10.19 10.58 12.10 - - 12.89 150.82
Mar 9.63 10.62 10.98 - - - - 151.43
Apr 9.73 10.70 11.02 - - - - 151.76
May 9.61 10.35 10.71 11.07 - - 11.42 152.33
Jun* 9.60 10.29 10.47 - - - - 153.12Source : Department of Treasury Operations and Central Bank of Sri Lanka* As at 22nd June 2017
Welfare Expenditure
Total expenditure on welfare payments and subsidies increased by 4 percent to Rs. 38,879 million during the first four months of 2017 from Rs. 37,309 million compared to the same period of the last year. The following major welfare programmes contributed to this increase.
• Samurdhi relief • School Text Books and Uniforms • Elders allowance• Fertilizer subsidy• Food nutritional programme for
pregnant mothers (Poshanamalla) • Special grant for Kidney patients• Flood and drought relief
The welfare assistance programmes such as Samurdhi cash grant, payments to elderly, payments to parents of security personnel and flood and drought relief to affected families amounted to Rs. 17,264 million. Of this total welfare expenditure, the service compensation for the dead and differently-abled soldiers was Rs. 9,032 million during the first four months of 2017 compared to Rs. 8,622 million in the same period of 2016.
The Government implemented National Nutritional Intervention Programmes such as Poshanamalla, Thriposha program, morning meal and school nutrition programme incuring Rs. 2,959 million in the
Table 3.11 : Behavior of Yield Rates (%) on Government Securities and Exchange Rate : 2016-2017 June

31
first four months of 2017. The expenditure on Thriposha and Poshanamalla programmes amounted to Rs. 516 million and Rs. 1,258 million, respectively in the review period.
School children were benefitted by providing free text books, uniforms, season tickets, free Dhamma school text books and bursaries amounting to Rs. 2,472 million during the period.
The Government places priority in providing free medicine for patients with no disruption spending Rs. 11,318 million during the first four months of 2017.
The Government incurred Rs. 7,762 million to provide cash grants to obtain fertilizer for paddy farmers and other small crop holders under the fertilizer subsidy programme during the review period.
Table 3.12: Welfare Expenditure : January-April 2016
Item Jan- April 2016 Jan- April 2017
Mothers and Children
Thriposha Programme and Infant Milk Food Subsidy/Poshanamalla 1,753 1,913
Free text books & uniforms 2,570 2,041
School season tickets 1,263 245
School Nutritional foods 863 1,143
Agriculture
Fertilizer subsidy 7,360 7,762
Welfare payments
Samurdhi Relief 13,817 13,311
Assistance to differently able soldiers 8,622 9,032
Elder Allowance 3,008 3,010
Assistance for differently-able 354 356
Food assistance, flood and drought Relief 2 163
Public Investment Expenditure
(1). EducationThe total expenditure on education sector including general school education, higher education, tertiary and vocational education, science, technology and research amounted to Rs. 38,810 million in the first four months of 2017. This was an increase of 20 percent over the first four months of 2016.
General Education
The total expenditure of Rs. 23,043 million was incurred for general education for the first four months of 2017 of which Rs.
15,927 million of recurrent expenditure and Rs. 7,116 million of capital expenditure. The expenditure on welfare programmes declined by 6 percent to Rs. 3,237 million in the review period compared to the same period of 2016. This was mainly due to the settlement of more bills of printing of school text books for 2016 in the same year without carry forwarding the bills to next year.
The ‘Nearest School is the Best School’ (NSBS) programme which was commenced in 2016 continued in the review period. The total investment made for this NSBS programme was Rs. 5,464 million as at end April 2017.
Source: Department of National Budget

32
Higher Education
The Government has spent Rs. 12,646 million during the first four months of 2017 for the development of higher education, of which recurrent and capital expenditure were Rs. 9,798 million and Rs. 2,848 million, respectively.
Rs. 255 million was incurred for the construction of new building complexes for establishment of technological faculties in ten (10) universities at end April 2017. During the first four months of 2017, 3,379 university students has obtained loans to purchase laptops and also Rs. 40 million was paid to the People’s Bank and Bank of Ceylon to bear the interest cost of the loans provided from 2016. In order to provide easy access to technology, Pan Audio (Pvt) Ltd has been selected as a WiFi service provider for all state universities and the provision of WiFi facility has already been undertaken in four (04) state universities at end April 2017.
Total expenditure on skills development and vocational training sector was Rs. 2,085
million in the first four months of 2017, of which Rs. 360 million was the capital expenditure. Establishment of Colombo Vocational Training Center and Gampaha Technical College and Skills Sector Development Programme are the two main projects being implemented by the Ministry of Skills Development and Vocational Training. Total capital expenditure spent on these two projects for the first four months was Rs. 41.2 million and Rs. 205 million, respectively.
Total expenditure on science, technology and research area was Rs. 1,036 million for the first four months of 2017, of which capital expenditure was Rs. 473 million. (i) Nano Technology Programme, (ii) establishment of National Science Centre and (iii) assist research in diabetes, Dengue and CKDus and cancer are the three main projects being implemented during the period. Total capital expenditure on these three projects was Rs. 63.75 million, Rs. 100 million and Rs. 92.79 million, respectively during the first four months of 2017.
Table 3.13: Expenditure on Major Activities of Education Sector
Description Jan - April 2016
Jan - April 2017
Recurrent Expenditure
General Education
National
Personnel Emoluments for School Teachers and other support staff 10,115 10,843
Welfare Program 3,463 3,237
Evaluation of examinations 687 833
Provincial
Provincial Education 39,800 40,214
Higher Education
Personnel Emoluments of Universities & other Higher Educational Institutions 7,440 8,004
Mahapola and Bursary Payment 339 199
Tertiary & Vocational Training
Salaries for Vocational Training and other support staff 1,327 1,365
Stipend and season tickets provided for Technical Training students 3 6.5
Rs. Million

33
Science, Technology & Research
Personnel Emoluments for science, Technology & Research Institutes and other staff 407 424
Public Investment Expenditure
General Education
National
Primary school development 22 110
Secondary school development 1,304 588
Special Education development 14 17
Teacher development 132 405
General Education Development Projects 53 5,821
Provincial
Provincial Education 1,121 1,783
Higher Education
Development of Universities & Other Higher Educational Institutions 3,147 1,180
Construction of 84 Hostel Complexes 755 1,272
Establishment of Technology Faculty of the Universities - 255
Loan Interest for Laptops (University Students) - 40
Faculty of Fisheries & Marine Science, University of Ruhuna 56
Development Plan for South Eastern University Phase 1 “B” 98 45
Tertiary & Vocational Training
Vocational Training Institutes * 40 65
Skills Sector Development Program 196 206
Establishment of Colombo Vocational Training Center & Gampaha Technical College 128 402
Science, Technology & Research
Science, Technology & Research Institutes and other capital investments 95
473
Description Jan - April 2016
Jan - April 2017
Source: Department of State Accounts* Do not include the expenditure of Youth Services Council and National Youth Corps as the youth development component has been transferred to the Ministry of Policy Planning, Economic Affairs, Child, Youth and Cultural Affairs from 2015 onwards
Rs. Million

34
(2). Health
The total government expenditure on health consisting of Western and indigenous medicine sectors increased by 4.7 percent to Rs. 61,606 million during the first four
months of 2017 compared to the same period of 2016 covering both Provincial and Central Government health expenditure. Out of the total health expenditure, the recurrent expenditure was Rs. 52,993 million and the capital investment was Rs. 8,663 million.
Description 2016Jan-April
2017Jan-April
Total Recurrent Expenditure 53,270 52,993
service delivery expenditure 24,132 25,773
of which Salaries of medical personnel and support staff 20,372 21,209
Provision of Medicine 13,138 11,325
Provincial Health 16,000 15,895
Public Investment Expenditure 5,572 8,663
Development of District Hospital - Polonnaruwa 23 53
Epilepsy unit at National Hospital, Colombo 699 129
Development of DGH Hambantota and DGH Nuwaraeliya 1 3
Construction of the State of the Art Cancer Ward Complex at National Institute of Cancer, Maharagama (Razavi Project ) 15 -
Maternity Ward Complex at TH Kurunegala 21 95
Development of Estate Sector Hospitals 31 23
Accident Service and Ward Complex at TH Ragama 33 87
Helmut Khol Maternity Hospital Karapitiya, Galle (GOSL-Germany-kfw) 46 64
Provision of High Quality Radiotherapy for Cancer Patients in Sri Lanka with High Energy Radiation 471 -
Other capital investments 3,238 6,452
Provincial Health Investment 994 1,757
Source: Department of National Budget
Table 3.14: Expenditure on Major Activities of Health Sector
Rs. Million
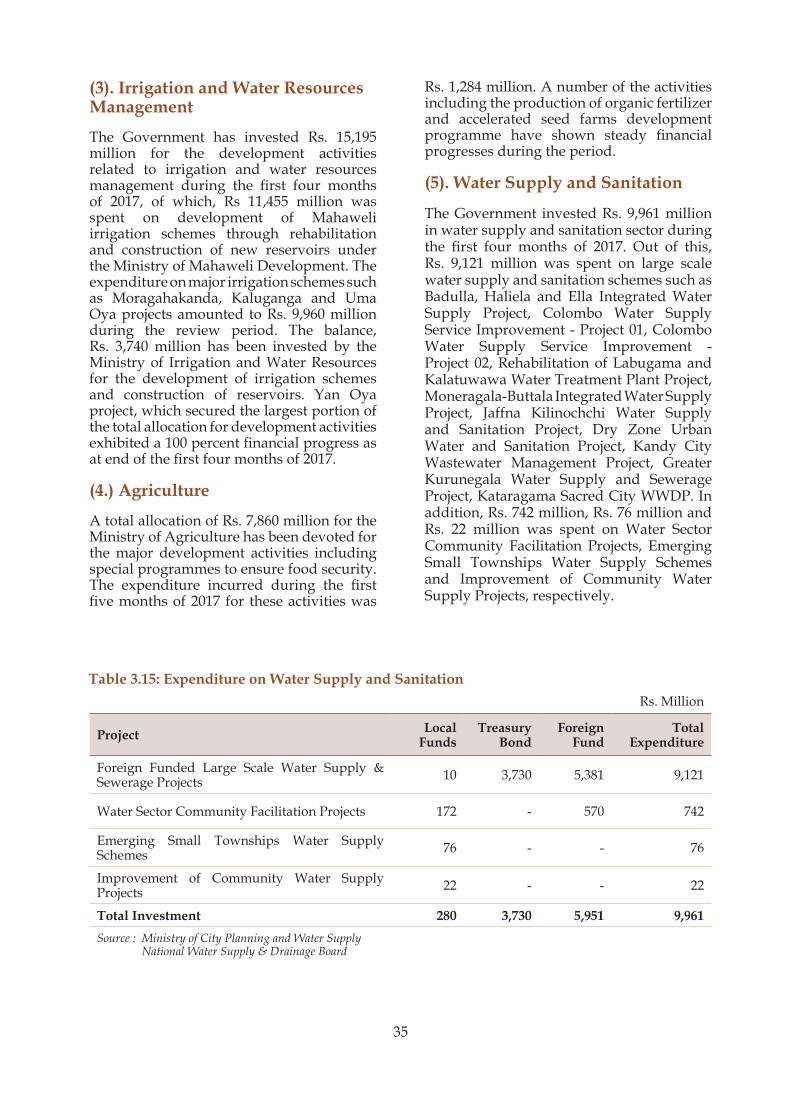
35
(3). Irrigation and Water Resources Management
The Government has invested Rs. 15,195 million for the development activities related to irrigation and water resources management during the first four months of 2017, of which, Rs 11,455 million was spent on development of Mahaweli irrigation schemes through rehabilitation and construction of new reservoirs under the Ministry of Mahaweli Development. The expenditure on major irrigation schemes such as Moragahakanda, Kaluganga and Uma Oya projects amounted to Rs. 9,960 million during the review period. The balance, Rs. 3,740 million has been invested by the Ministry of Irrigation and Water Resources for the development of irrigation schemes and construction of reservoirs. Yan Oya project, which secured the largest portion of the total allocation for development activities exhibited a 100 percent financial progress as at end of the first four months of 2017.
(4.) Agriculture
A total allocation of Rs. 7,860 million for the Ministry of Agriculture has been devoted for the major development activities including special programmes to ensure food security. The expenditure incurred during the first five months of 2017 for these activities was
Rs. 1,284 million. A number of the activities including the production of organic fertilizer and accelerated seed farms development programme have shown steady financial progresses during the period.
(5). Water Supply and Sanitation
The Government invested Rs. 9,961 million in water supply and sanitation sector during the first four months of 2017. Out of this, Rs. 9,121 million was spent on large scale water supply and sanitation schemes such as Badulla, Haliela and Ella Integrated Water Supply Project, Colombo Water Supply Service Improvement - Project 01, Colombo Water Supply Service Improvement - Project 02, Rehabilitation of Labugama and Kalatuwawa Water Treatment Plant Project, Moneragala-Buttala Integrated Water Supply Project, Jaffna Kilinochchi Water Supply and Sanitation Project, Dry Zone Urban Water and Sanitation Project, Kandy City Wastewater Management Project, Greater Kurunegala Water Supply and Sewerage Project, Kataragama Sacred City WWDP. In addition, Rs. 742 million, Rs. 76 million and Rs. 22 million was spent on Water Sector Community Facilitation Projects, Emerging Small Townships Water Supply Schemes and Improvement of Community Water Supply Projects, respectively.
Rs. Million
Project Local Funds
Treasury Bond
Foreign Fund
Total Expenditure
Foreign Funded Large Scale Water Supply & Sewerage Projects 10 3,730 5,381 9,121
Water Sector Community Facilitation Projects 172 - 570 742
Emerging Small Townships Water Supply Schemes 76 - - 76
Improvement of Community Water Supply Projects 22 - - 22
Total Investment 280 3,730 5,951 9,961Source : Ministry of City Planning and Water Supply National Water Supply & Drainage Board
Table 3.15: Expenditure on Water Supply and Sanitation

36
(6). Highways and Bridges
The Government has spent Rs. 36,226 million as capital expenditure for National roads and bridges development activities during the first four months of 2017, of which Rs. 9,400 million incurred on Expressway development while Rs. 5,532 million on Highways development. Meanwhile, the Government spent Rs. 4,939 million on widening and improvement of roads, Rs. 1,096 million on construction of bridges and flyovers and Rs. 238 million on Maga-Neguma, rural road development projects.
Several road constructions, rehabilitation and maintenance projects continued with the
financial support of foreign and local sources. Among them, the Central Expressway, Extension of Southern Expressway, Priority roads projects, i-road project, New Kelani Bridge project and 3 flyovers at Rajagiriya, Polgahawela and Ganemulla were also given national priority.
The Government incurred a considerable amount for interest and capital repayment of local bank funded road projects and Rs. 12,000 million was paid for the first six months period. In addition, Rs. 3,984 million incurred during the first four months of 2017 for the acquisition of lands to implement above projects.
Table 3.16: Expenditure on Water Supply and Sanitation
S/No. Project/Programme Expenditure as at 30th April 2016
Expenditure as at 30th April
2017 1 Expressways Development 1,578 9,458
Outer Circular Highway Project - Phase III 899 1,161 Central Expressway Project 65 742Extension of Southern Expressway 592 7,489 Others 23 66
2 Highways Development 1,842 5,532 Maintenance of Roads 497 2,195 Priority Road Projects- III 613 1,214Colombo District Road Development Project 589 243 Southern Road Connectivity Project 15 799 Integrated Road Investment Programme (iRoad) 23 807 Others 106 274
3 Widening and Improvement of Roads 2,216 4,939 4 Construction of Bridges and Flyovers 782 1,096
UK Steel Bridge Project 162 233 Reconstruction of Damaged/ Weak Bridges on National Highways 51 110
Reconstruction of 46 Bridges 304 109Major Bridge Construction project 14 62Construction of Rural Bridges using old bridge components 41 129
Second New Kelani Bridge Construction Project 109 302Others ( Including 3 Flyovers) 103 151
5 Natural Disaster Affected Road Rehabilitation 12 13
6 Maganeguma Rural Road Development Programme 293 238
7 Transfers to RDA 2,000 2,038 8 Lands & Land Improvements(Other projects
excluding priority projects) 823 912
9 Government Guaranteed Local banks Funded Project 7,808 12,000
10 Others 21 - Total 17,375 36,226
Source: Department of National Budget
Rs. Million

37
(7.) Transport
The investment in the transport sector during the period under review was Rs. 3,842 million and it was mainly incurred for infrastructure development and fleet expansion of public transport in order to have efficient and modern public transport system in the country. Out of the total expenditure, Rs. 889 million was incurred by the Sri Lanka Central Transport Board (SLCTB)
for the payment of leasing installment of the purchase of new buses and spare parts. The balance, Rs. 2,953 million was spent for the continuation of construction projects including Matara–Beliatta–Kataragama new rail line, Madu–Thalaimannar rail line, Pallai–Kankasanthurai rail line and Installation of New Railway Signaling and Telecommunication system from Anuradhapura/Thalaimannar/Kankasanthurai.
Rs. Million
Name of the Project Domestic Financing
Foreign Financing
Total Expenditure
Matara - Beliatta - Kataragama New Rail Line 44 - 44Madu - Thalaimannar Line 27 - 27
Installation of New Railway Signaling & Telecommunication System from ANP/TLM/KKS 14 409 423
Rehabilitation of Permanent way with New rails and Sleepers 818 - 818
Concrete Sleepers production Plant Unit 102 - 102Rehabilitation of Vehicles 854 - 854Total Investment 1,873 409 2,282Source : Department of National Budget
(8). Power and Energy
With a view of strengthening the financial position of the Ceylon Electricity Board (CEB) and facilitating operations through its self-generated earnings, the Government decided to convert the loans of CEB to equity capital since 2014. As a result, the contribution of the Government for the revenue making power projects was gradually decreased.
The Government investment in power and energy sector projects was Rs. 40.2 million during the first four months of 2017. This includes the expenditure incurred for Clean Energy and Network Efficiency Improvement Project, Improving Gender Inclusive Access to Clean Energy and Renewable Energy in Bhutan, Nepal and Sri Lanka Project, and Promoting Sustainable Biomass Energy Production and Modern Bio-Energy Technologies Project amounting to 23.67 million, Rs. 16.3 million and Rs. 0.5 million, respectively. Meanwhile, Polipto
Lanka (Pvt) Ltd has spent Rs. 8 million during the first four months of 2017 for the project of the conversion of plastic into fuel.
(9). Urban Development
The concept of Megapolis development is a new strategy of the Government for transforming Sri Lanka into a high-income developed country status. Accordingly, the Western Region Megapolis is envisioned and conceptualized to transform the city to a planned mega city to answer the issues of traffic congestion, garbage disposal issues, slums, environmental issues etc. In addition, it is expected to develop strategic cities such as Galle, Kandy, Jaffna, Anuradhapura and Trincomalee.
Rs. 14,914 million was spent for urban development during the first four months of 2017, of which Rs. 13,988 million was invested mainly for large scale urban development project.
Table 3.17: Railway Sector Expenditure : January - April 2017

38
(10) Housing Development
With the aim of providing decent houses and upgrading the existing houses for all, housing development programmes were strengthened and expedited in the first four months of 2017 under the theme of ‘shelter for all’. The total allocation for the Ministry of Housing and Construction for the housing development in 2017 is Rs. 6,707 million. This investment is expected to utilize under the different programmes such as model villages and scattered housing programme through providing concessionary loans or financial grants to beneficiaries based on their income and the requirements.
During the first four months of 2017, a sum of Rs. 1,343 million was spent in housing development activities by the Ministry of Housing and Construction compared to the expenditure of Rs. 671 million in first
four months of the previous year. With this investment, housing loans have been provided for 484 houses in the new model villages and 8,578 houses in scattered housing programme. Further, housing grant has been provided for 2,534 beneficiaries in the Northern and Eastern Provinces.
(11) Disaster Relief Activities
The Government incurred Rs. 1,396.5 million for th eprovision of the drough relief and other disaster-related activities during first four monhts of 2017. Out of the total above expenditure, Rs. 163 million, Rs. 500 million, Rs. 733.5 million devoted for the supply of drinking water, the payment of premium for the Natural National Disaster Insurance Scheme to the National Insurnace Trust Fund (NIFT) and the Payment of compensation and housing construction for the people who were affected Kegalle landslide, respectively.
Project Local FundsForeign
FundTotal
Expenditure
Metro Colombo Urban Development Project (GOSL-WB) 323.66 458.58 782.24
Greater Colombo Urban Transport Development Project – Phase I
128.74 - 128.74
Development Strategic Cities – Kandy & Galle (GOSL-WB) 186.76 629.77 816.53
Greater Colombo Flood protection and Environment Development Project
266.73 - 266.73
Relocation of Manning Market to Peliyagoda Project 102.62 - 102.62
Townships Development and Urban Solid Waste Management Project
2,391.50 - 2,391.50
Urban Regeneration Programme 8,500.00 - 8,500.00
Projects implemented by the Urban Development Authority
662.68 - 662.68
Projects implemented by the Sri Lanka Land Reclamation & Development Corporation
337.09 - 337.09
Total Investment 12,899.78 1,088.35 13,988.13Source : Ministry of Megapolis and Western Development
Table 3.18: Large Scale Urban Development Project Expenditure: January- April 2017Rs. Million

39
Table 3.19: Ministry wise Summary of Additional Allocations as of 30.04.2016Rs.
Head No.
Ministry / Department
Purpose Rucurrent Capital
1 - 22 Special Spending Units
- -
1 His Excellency the President
"Wasa Wisa Nethi Ratak" National Programme, “Siri Sara Pivisuma” Programme, Development of Religious Places, Budget proposal on addressing the regional level issues, Special Fund for the Assistance to Artists, Journalists and Writers, Settle the outstanding bills relevant to year 2014
375,741,710
10,393,360,000
2 Office of the Prime Minister
Awareness Programme for General Public, Establishing Japan-Sri Lanka Joint Comprehensive Partnership (JCP) Secretariat, Purchase equipments, Acquisition of a vehicle and ambulances, Settle the outstanding bills relevant to the CEB-2016
23,696,000
90,373,304
6 Public Service Commission
Acquisition of Capital Assets 300,000
10 Commission to Investigate Allegation of Bribery or Corruption
Strengthening the Commission as per the continuation of Budget Proposal 2016
20,000,000
13 Human Rights Commission of Sri Lanka
Provision for the Retirement Benefits
1,200,000
16 Parliament Refurbishment of Parliamentary Complex, Pay monthly allowances, Acquisition of a vehicle , Personal Emoluments, Infrastructure Development, Project on Strengthening the Parliamentary System
258,960,000
392,221,430
17 Office of the Leader of the House of Parliament
Foreign Travelling Expenses, Property Loan Interest to Public Servants.
1,548,250
18 Office of the Chief Government Whip of Parliament
Foreign Travelling Expenses, Pay salaries and allowances
11,476,000
19 Office of the Leader of the Opposition of Parliament
Acquisition of a vehicle, Rehabilitation of Capital Assets
58,973,540

40
20 Department of Elections
Conduting awareness training programs pertaining to the Student Parliament, Project on Election Complaints Tracking System and Disaster Recovery Centre
4,800,000
29,100,000
21 Auditor General
Lease Rental for Vehicle, Foriegn Travelling Expenses and Acquisition of Capital Assets.
92,250,000
7,800,000
22 Office of the Parliamentary Commissioner for Administration
Foreign Travelling Expenses 289,040
101 Ministry of
Buddha Sasana Celebrate the Official Vesak Day of the United Nations, Develop the Buddhist Temples and Construction of Canopy
250,000,000
20,796,800
201 Department of Buddhist Affairs
Printing of Dhamma School Text Books, Liabrary Book Allowance, Uniforms and Monthly Allowance for Dhamma School Teachers, Teacher's Training & Dham Sarasaviya Programme
824,075,000
5,000,000
102 Ministry of
FinanceEstablishment of Financial Asset Management Agency (FAMA) as per the Budget Proposal, Travelling Expenses, Acquisition of Vehicle, Personal Emoluments
33,700,000
10,130,000,000
238 Department of Fiscal Policy
Foreign Travelling Expenses 6,500,000
240 Department of National Budget
Lump sum payment for July Srikers.
100,000,000
241 Department of Public Enterprises
Account the Treasury Bonds issued in favour of National Water Supply and Drainage Board.
10,000,000,000
242 Department of Management Services
Personal Emoluments, Fuel, Transport & Postal Services, Rehabilitation and Improvement of Capital Assets
9,074,000
200,000
243 Department of Development Finance
Agro Livestock Development Loan Scheme, Interest Subsidy for the Loan Scheme of Media Personnel, Artists, Tea Factory Owners and Fixed deposits of senior citizens through Licensed Finance Companies, Granting price subsidy to domestic milk powder manufactures, SME Credit Guarantee Scheme, Provide interest subsidy loan scheme to implement the Budget Proposals, Advertising Expenses
14,223,066,050
500,000,000
Rs.Head No.
Ministry / Department
Purpose Rucurrent Capital

41
244 Department of Trade and Investment Policy
Meeting of the SAARC Development Fund Board of Directors and the Brainstorming Workshop
1,000,000
245 Department of Public Finance
Forth South Asia Regional Public Procurement Conference
3,000,000
246 Department of Inland Revenue
Implementation of New Inland Revenue Act & Revenue Administration Management Information System (RAMIS) project
209,100,000
247 Sri Lanka Customs
Implementation of Budget Proposal for purchasing of boats for sea patrolling, Construction of new Customs building
323,060,000
248 Department of Excise
Implement the Production Monitoring and Tax Automation System Project
17,000,000
28,600,000
249 Department of Treasury Operations
Foreign Travelling Expenses, Write off the sub loan amount of Badulla District Prajashakthi Sanvidanaya
8,020,000
103 Ministry of Defence
Implement the Budget Proposals of pension payments for differently abled soldiers and allowance for legal officers in the tri-forces, Procuring National Cyber Security System, Introduce New Domestic Airline on PPP basis , Procure defence vehicles
4,370,000,000
204,016,870
222 Sri Lanka Army
UN Peace Keeping Operation 4,338,000,000
223 Sri Lanka Navy Relocation of Vidura - Navy Recruits Training Center, Continuation of the construction work of Quay at Dockyard Trincomalee, Construction of Inshore Patrol Craft, Acquisition of furniture & office equipments, Settle the outstanding payment of 2016
576,606,000
Rs.Head No.
Ministry / Department
Purpose Rucurrent Capital

42
104 Ministry of National Policies and Economic Affairs
Implement the Budget Proposals on Vocational Training Programme, Interest Free Loan Scheme to finance the Small Business Ventures and Establish a Special Fund to Empower the Local Leaders, Developing of Selected Religious Centers, set up a Central Programme Management Unit, Drug prevention and rehabilitation of drug addicts, Development of Selected Religious Centers project, Poverty Alleviation Micro Finance Project, implement the "Commence Operation of EXIM Bank of Sri Lanka", Payment to Golden Key Depositors and Global Marketing Campaign, Taxes on importing a water bowser, implement the Central Programme Management Unit, Granting of Loans for Small and Medium Enterprise Sector Development and Employment Generation
27,056,130,000
252 Department of Census and Statistics
Implement the Research and Development Project on Stastistical Capacity Building.
12,000,000
106 Ministry of Disaster Management
Flood and Drought Relief, Purchase 25 flatbed boats and Fire Brigade Units, Establish Disaster Management Training Centre at Pelmadulla and increase the coverage of Natural Disaster and Emergency Relief Scheme, Purchasing water bowsers, Complete remaining activities of Programme for Flood and Landslide Disaster Response, Relief assistance granted to the victims of the boat accident in Kaluthara, Purchase 2,000 water tanks, Custom clearance of the rice which granted by Indonesian government, Transport Expenses, Construct 24 houses in Badulla District, Construction of 98 houses for the Victims of Meethotamulla and provide furniture, Transport and Rent Relief
329,471,500
1,260,000,000
108 Ministry of Posts, Postal Service and Muslim Religious Affairs
Improve the Postal Network in Jaffna District, Rehabilitation and Improvement of Capital Assets, Acquisition of a vehicle and computer accessories
75,903,180
Rs.Head No.
Ministry / Department
Purpose Rucurrent Capital
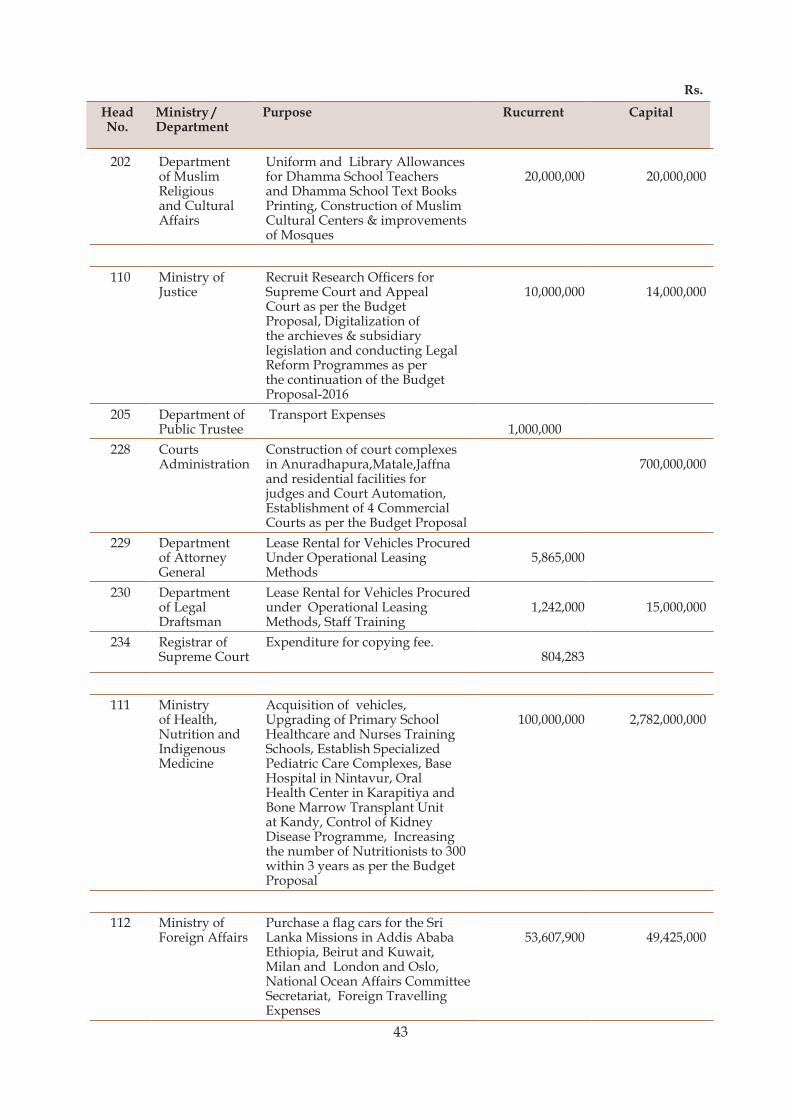
43
202 Department of Muslim Religious and Cultural Affairs
Uniform and Library Allowances for Dhamma School Teachers and Dhamma School Text Books Printing, Construction of Muslim Cultural Centers & improvements of Mosques
20,000,000
20,000,000
110 Ministry of
JusticeRecruit Research Officers for Supreme Court and Appeal Court as per the Budget Proposal, Digitalization of the archieves & subsidiary legislation and conducting Legal Reform Programmes as per the continuation of the Budget Proposal-2016
10,000,000
14,000,000
205 Department of Public Trustee
Transport Expenses 1,000,000
228 Courts Administration
Construction of court complexes in Anuradhapura,Matale,Jaffna and residential facilities for judges and Court Automation, Establishment of 4 Commercial Courts as per the Budget Proposal
700,000,000
229 Department of Attorney General
Lease Rental for Vehicles Procured Under Operational Leasing Methods
5,865,000
230 Department of Legal Draftsman
Lease Rental for Vehicles Procured under Operational Leasing Methods, Staff Training
1,242,000
15,000,000
234 Registrar of Supreme Court
Expenditure for copying fee. 804,283
111 Ministry
of Health, Nutrition and Indigenous Medicine
Acquisition of vehicles, Upgrading of Primary School Healthcare and Nurses Training Schools, Establish Specialized Pediatric Care Complexes, Base Hospital in Nintavur, Oral Health Center in Karapitiya and Bone Marrow Transplant Unit at Kandy, Control of Kidney Disease Programme, Increasing the number of Nutritionists to 300 within 3 years as per the Budget Proposal
100,000,000
2,782,000,000
112 Ministry of
Foreign AffairsPurchase a flag cars for the Sri Lanka Missions in Addis Ababa Ethiopia, Beirut and Kuwait, Milan and London and Oslo, National Ocean Affairs Committee Secretariat, Foreign Travelling Expenses
53,607,900
49,425,000
Rs.Head No.
Ministry / Department
Purpose Rucurrent Capital
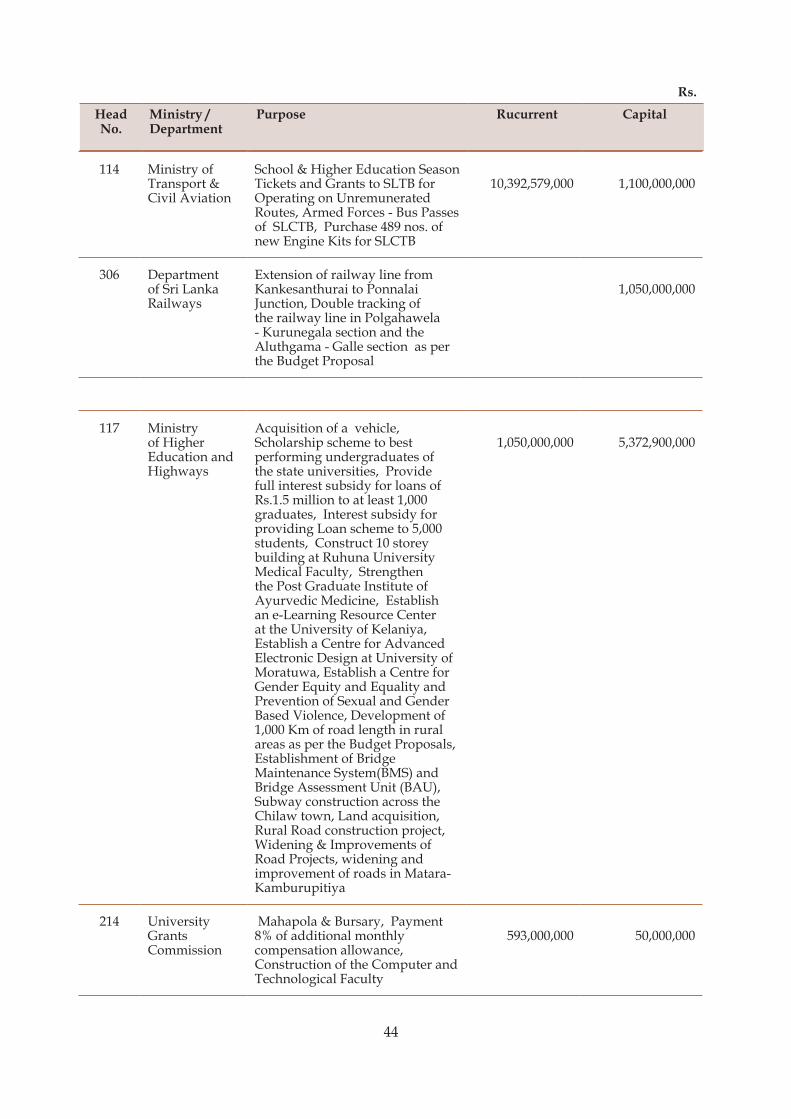
44
114 Ministry of Transport & Civil Aviation
School & Higher Education Season Tickets and Grants to SLTB for Operating on Unremunerated Routes, Armed Forces - Bus Passes of SLCTB, Purchase 489 nos. of new Engine Kits for SLCTB
10,392,579,000
1,100,000,000
306 Department of Sri Lanka Railways
Extension of railway line from Kankesanthurai to Ponnalai Junction, Double tracking of the railway line in Polgahawela - Kurunegala section and the Aluthgama - Galle section as per the Budget Proposal
1,050,000,000
117 Ministry of Higher Education and Highways
Acquisition of a vehicle, Scholarship scheme to best performing undergraduates of the state universities, Provide full interest subsidy for loans of Rs.1.5 million to at least 1,000 graduates, Interest subsidy for providing Loan scheme to 5,000 students, Construct 10 storey building at Ruhuna University Medical Faculty, Strengthen the Post Graduate Institute of Ayurvedic Medicine, Establish an e-Learning Resource Center at the University of Kelaniya, Establish a Centre for Advanced Electronic Design at University of Moratuwa, Establish a Centre for Gender Equity and Equality and Prevention of Sexual and Gender Based Violence, Development of 1,000 Km of road length in rural areas as per the Budget Proposals, Establishment of Bridge Maintenance System(BMS) and Bridge Assessment Unit (BAU), Subway construction across the Chilaw town, Land acquisition, Rural Road construction project, Widening & Improvements of Road Projects, widening and improvement of roads in Matara-Kamburupitiya
1,050,000,000
5,372,900,000
214 University Grants Commission
Mahapola & Bursary, Payment 8% of additional monthly compensation allowance, Construction of the Computer and Technological Faculty
593,000,000
50,000,000
Rs.Head No.
Ministry / Department
Purpose Rucurrent Capital

45
118 Ministry of Agriculture
Development Programme of Restoration, Rehabilitation and de-silting of 1,500 small tanks, Fertilizer Subsidies, Financial assistance to the farmers affected by drought, Partition and purchase furniture and office equipments, Big Onion Seed Production Programme, Establishing Four Rice Export Zones, Skill Sector Development Programme, Rehabilitation of Small Tanks and Canals, Production of High Quality Seeds through PPP modes, Foreign Travelling Expenses
39,067,400,100
4,396,905,286
285 Department of Agriculture
Post-harvest Management and Value Addition of Fruits Programme, Strengthening of Seed Certification Activities, Research on Infrastructure Development needs to Improve Rice Research and Development Institute(RRDI)
79,029,200
119 Ministry of Power and Renewable Energy
Interest subsidy to households with monthly electricity bill over Rs. 2,000 to convert in to solar energy and Convert public sector buildings to green energy as per the Budget Proposals, Additional cost incurred by CEB for the thermal power generation, Promoting Sustainable Biomass Energy Production and Modern Bio-energy Technologies
6,865,000,000
120 Ministry of Women and Child Affairs
Nutritional Food Packege for Expectant Mothers, Morning Meal for Pre-school Children and Lamadiriya Programme - Allowances for Pre-school Teachers, Acquisition of a vehicle , Ensuring Child Protection and Child Rights Project, Purchasing furniture and household equipment for the official residence
2,885,000,000
53,371,000
Rs.Head No.
Ministry / Department
Purpose Rucurrent Capital
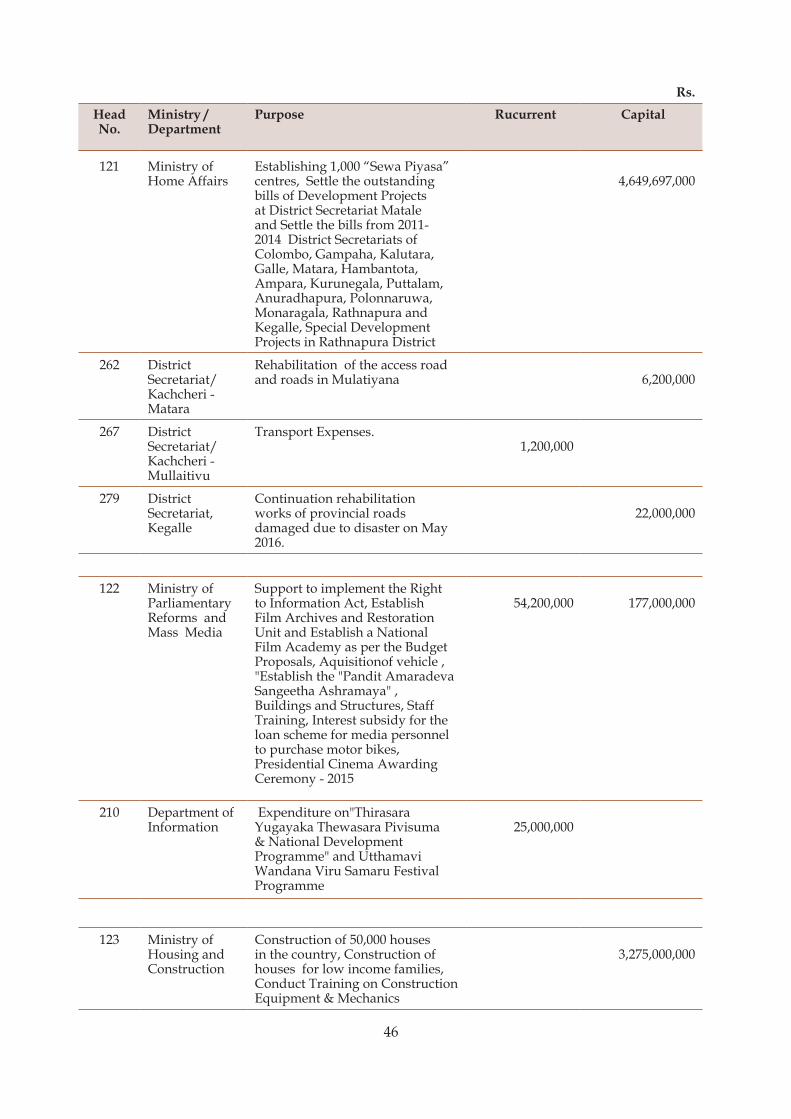
46
121 Ministry of Home Affairs
Establishing 1,000 “Sewa Piyasa” centres, Settle the outstanding bills of Development Projects at District Secretariat Matale and Settle the bills from 2011-2014 District Secretariats of Colombo, Gampaha, Kalutara, Galle, Matara, Hambantota, Ampara, Kurunegala, Puttalam, Anuradhapura, Polonnaruwa, Monaragala, Rathnapura and Kegalle, Special Development Projects in Rathnapura District
4,649,697,000
262 District Secretariat/ Kachcheri - Matara
Rehabilitation of the access road and roads in Mulatiyana
6,200,000
267 District Secretariat/ Kachcheri - Mullaitivu
Transport Expenses. 1,200,000
279 District Secretariat, Kegalle
Continuation rehabilitation works of provincial roads damaged due to disaster on May 2016.
22,000,000
122 Ministry of Parliamentary Reforms and Mass Media
Support to implement the Right to Information Act, Establish Film Archives and Restoration Unit and Establish a National Film Academy as per the Budget Proposals, Aquisitionof vehicle , "Establish the "Pandit Amaradeva Sangeetha Ashramaya" , Buildings and Structures, Staff Training, Interest subsidy for the loan scheme for media personnel to purchase motor bikes, Presidential Cinema Awarding Ceremony - 2015
54,200,000
177,000,000
210 Department of Information
Expenditure on"Thirasara Yugayaka Thewasara Pivisuma & National Development Programme" and Utthamavi Wandana Viru Samaru Festival Programme
25,000,000
123 Ministry of Housing and Construction
Construction of 50,000 houses in the country, Construction of houses for low income families, Conduct Training on Construction Equipment & Mechanics
3,275,000,000
Rs.Head No.
Ministry / Department
Purpose Rucurrent Capital

47
124 Ministry of Social Empowerment and Welfare
Support to Low Income Disable Persons, Financial Support to Elderly Over 70 years of Age and Financial Support to Kidney Patients, Acquisition of Capital Assets, Expenditure for Plant, Machinery and Equipment, Rehabilitation of Capital Assets
5,538,342,000
24,110,000
216 Department of Social Services
Increase the daily allowance to differently abled children, Lease rental for two vans procured under the operational leasing method
28,127,000
331 Department of Divineguma Development
Samurdhi Relief Assistance & Kerosene Oil
21,975,000,000
126 Ministry of
EducationSchool Nutritional Food, Shoes for Students in difficult and very difficult Schools, School Uniforms, Printing of Text Books and Glass of Milk for School Children and Scholarships-(Year 5), Lease rental of 6 vehicles procured under the NBD, Acquisition of a vehicles, Provide maximum of 50 computers per school on rental basis, Extend Agrahara Insurance Benefit Scheme, Property Loan and Distress Loan facility to semi government schools, Free tabs to A/L teachers and students, Improvement of special education for differently abled children, Augment the infrastructure of Pirivena and the capacity development of the Privena teachers, Basic facilities such as electricity, water and sanitation facilities to all schools, Upgrading 25 Plantation Schools and Facilitate the activities of Censor Board, "Subhaga" scholarship scheme, Health Insurance scheme for students, Bursary for Bhikkus studying at pirivena and Upgrading the National Library Colombo, "13 Year of Mandatory Schooling Policy" as per the Budget Proposals, Staff Training (UNICEF)
21,197,100,000
13,052,197,000
130 Ministry
of Public Administration and Management
Productivity improvement projects,Capacity Building of Service Excellence Programme-2017/2018
87,300,000
Rs.Head No.
Ministry / Department
Purpose Rucurrent Capital

48
135 Ministry of Plantation Industries
Establish a National Finite Element Simulation Center, Produce genetically superior high yielding coconut planting materials, Develop an Automated Commodity Exchange System as per the Budget Proposals, Welfare Programme on providing Fertilizer Subsidy, Compensation and Gratuity to the employees, Acquisition of a vehicles rehabilitation, improvement and acquisition of Capital Assets and Building and Structures.
1,869,258,000
136 Ministry of
SportsInfrastructure Development of Sports Schools,Capacity Development of Sports Trainers and Coaches, Construction of Kumar Anandan Swimming Pool and Human Performance Laboratory, Development of Cricket, Construction of Synthetic tracks, Sugathdasa National Sports Complex as per the Budget Proposals, Acquisition of a vehicle
1,063,200,000
219 Department of Sports Development
Implementation of the Development Activities of Sports Talent Identification and Represent Sri Lanka in International Sports Competition programme, Construction of the Provincial and District Sports Complexes
259,000,000
140 Ministry of
Hill Country New Villages, Infrastructure and Community Development
Construction of 50,000 houses in the country, Expenditure on Rents and Local Taxes.
600,000
1,000,000,000
145 Ministry
of Presion Reforms ,Rehabilitation, Resettlement and Hindu Religious Affairs
Resettlement of Protracted IDPs in Northern Province, Engage in drug prevention, Eradication and rehabilitation of those who addicted to drugs as per the Budget Proposal, Expenditure of duty and other taxes on materials imported for construction of Jaffna Cultural Centre, Compensation for the persons who are victimed at the incident of Welikada Prisons
42,500,000
1,983,000,000
Rs.Head No.
Ministry / Department
Purpose Rucurrent Capital
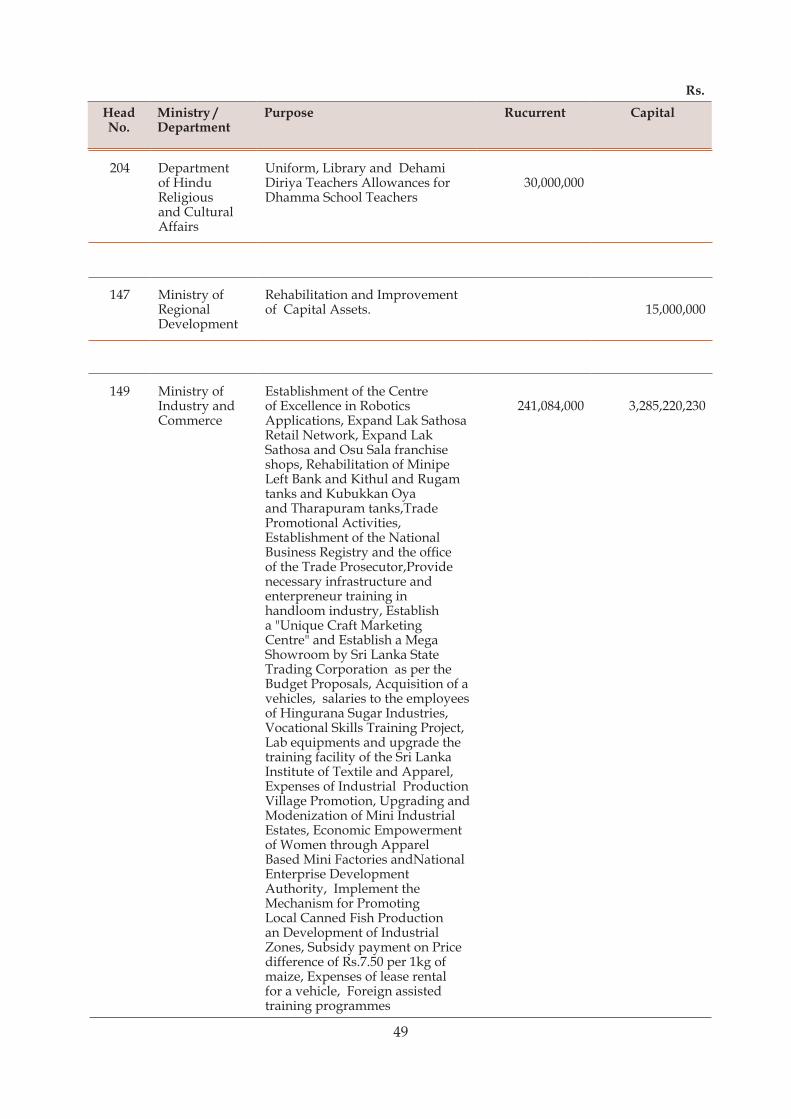
49
204 Department of Hindu Religious and Cultural Affairs
Uniform, Library and Dehami Diriya Teachers Allowances for Dhamma School Teachers
30,000,000
147 Ministry of Regional Development
Rehabilitation and Improvement of Capital Assets.
15,000,000
149 Ministry of Industry and Commerce
Establishment of the Centre of Excellence in Robotics Applications, Expand Lak Sathosa Retail Network, Expand Lak Sathosa and Osu Sala franchise shops, Rehabilitation of Minipe Left Bank and Kithul and Rugam tanks and Kubukkan Oya and Tharapuram tanks,Trade Promotional Activities, Establishment of the National Business Registry and the office of the Trade Prosecutor,Provide necessary infrastructure and enterpreneur training in handloom industry, Establish a "Unique Craft Marketing Centre" and Establish a Mega Showroom by Sri Lanka State Trading Corporation as per the Budget Proposals, Acquisition of a vehicles, salaries to the employees of Hingurana Sugar Industries, Vocational Skills Training Project, Lab equipments and upgrade the training facility of the Sri Lanka Institute of Textile and Apparel, Expenses of Industrial Production Village Promotion, Upgrading and Modenization of Mini Industrial Estates, Economic Empowerment of Women through Apparel Based Mini Factories andNational Enterprise Development Authority, Implement the Mechanism for Promoting Local Canned Fish Production an Development of Industrial Zones, Subsidy payment on Price difference of Rs.7.50 per 1kg of maize, Expenses of lease rental for a vehicle, Foreign assisted training programmes
241,084,000
3,285,220,230
Rs.Head No.
Ministry / Department
Purpose Rucurrent Capital
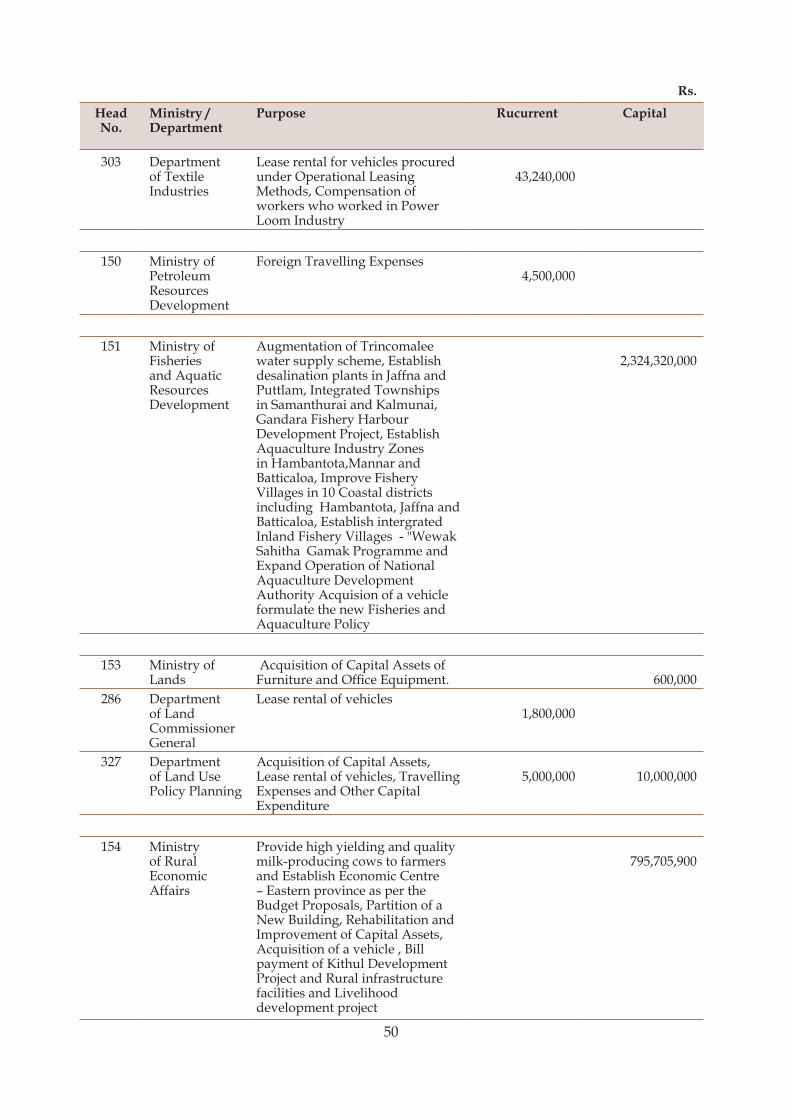
50
303 Department of Textile Industries
Lease rental for vehicles procured under Operational Leasing Methods, Compensation of workers who worked in Power Loom Industry
43,240,000
150 Ministry of
Petroleum Resources Development
Foreign Travelling Expenses 4,500,000
151 Ministry of
Fisheries and Aquatic Resources Development
Augmentation of Trincomalee water supply scheme, Establish desalination plants in Jaffna and Puttlam, Integrated Townships in Samanthurai and Kalmunai, Gandara Fishery Harbour Development Project, Establish Aquaculture Industry Zones in Hambantota,Mannar and Batticaloa, Improve Fishery Villages in 10 Coastal districts including Hambantota, Jaffna and Batticaloa, Establish intergrated Inland Fishery Villages - "Wewak Sahitha Gamak Programme and Expand Operation of National Aquaculture Development Authority Acquision of a vehicle formulate the new Fisheries and Aquaculture Policy
2,324,320,000
153 Ministry of
Lands Acquisition of Capital Assets of Furniture and Office Equipment.
600,000
286 Department of Land Commissioner General
Lease rental of vehicles 1,800,000
327 Department of Land Use Policy Planning
Acquisition of Capital Assets, Lease rental of vehicles, Travelling Expenses and Other Capital Expenditure
5,000,000
10,000,000
154 Ministry
of Rural Economic Affairs
Provide high yielding and quality milk-producing cows to farmers and Establish Economic Centre – Eastern province as per the Budget Proposals, Partition of a New Building, Rehabilitation and Improvement of Capital Assets, Acquisition of a vehicle , Bill payment of Kithul Development Project and Rural infrastructure facilities and Livelihood development project
795,705,900
Rs.Head No.
Ministry / Department
Purpose Rucurrent Capital
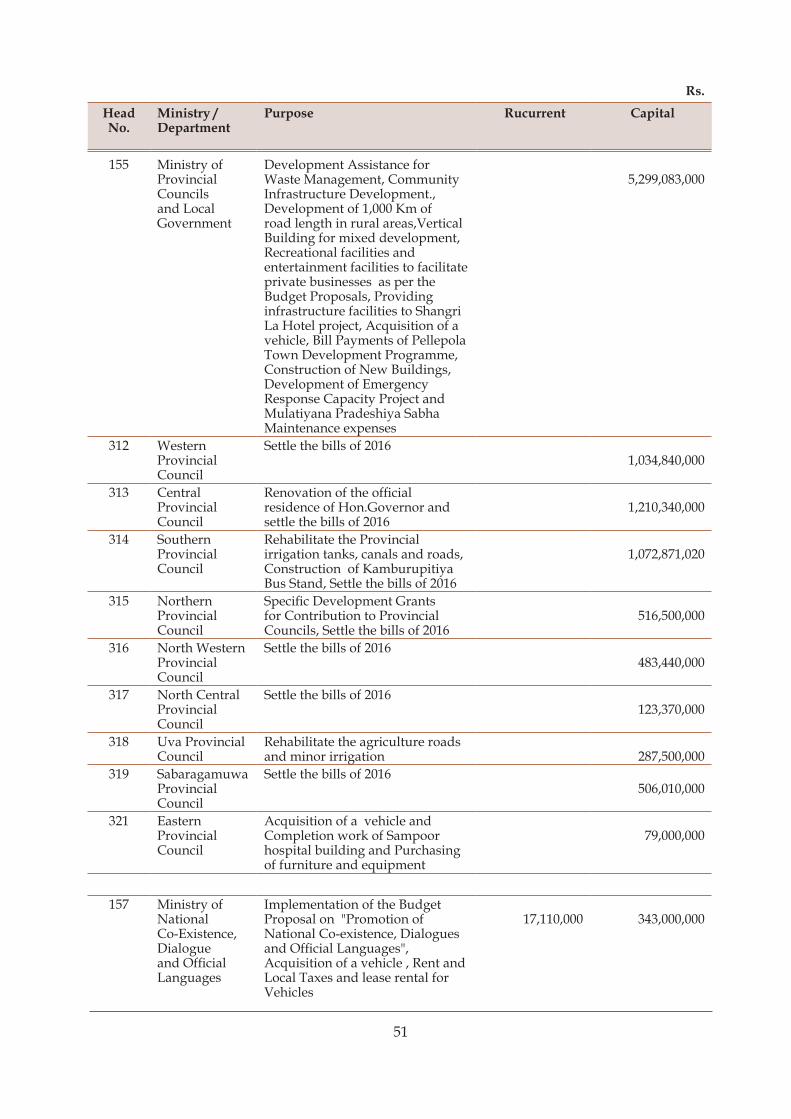
51
155 Ministry of Provincial Councils and Local Government
Development Assistance for Waste Management, Community Infrastructure Development., Development of 1,000 Km of road length in rural areas,Vertical Building for mixed development, Recreational facilities and entertainment facilities to facilitate private businesses as per the Budget Proposals, Providing infrastructure facilities to Shangri La Hotel project, Acquisition of a vehicle, Bill Payments of Pellepola Town Development Programme, Construction of New Buildings, Development of Emergency Response Capacity Project and Mulatiyana Pradeshiya Sabha Maintenance expenses
5,299,083,000
312 Western Provincial Council
Settle the bills of 2016 1,034,840,000
313 Central Provincial Council
Renovation of the official residence of Hon.Governor and settle the bills of 2016
1,210,340,000
314 Southern Provincial Council
Rehabilitate the Provincial irrigation tanks, canals and roads, Construction of Kamburupitiya Bus Stand, Settle the bills of 2016
1,072,871,020
315 Northern Provincial Council
Specific Development Grants for Contribution to Provincial Councils, Settle the bills of 2016
516,500,000
316 North Western Provincial Council
Settle the bills of 2016 483,440,000
317 North Central Provincial Council
Settle the bills of 2016 123,370,000
318 Uva Provincial Council
Rehabilitate the agriculture roads and minor irrigation
287,500,000
319 Sabaragamuwa Provincial Council
Settle the bills of 2016 506,010,000
321 Eastern Provincial Council
Acquisition of a vehicle and Completion work of Sampoor hospital building and Purchasing of furniture and equipment
79,000,000
157 Ministry of
National Co-Existence, Dialogue and Official Languages
Implementation of the Budget Proposal on "Promotion of National Co-existence, Dialogues and Official Languages", Acquisition of a vehicle , Rent and Local Taxes and lease rental for Vehicles
17,110,000
343,000,000
Rs.Head No.
Ministry / Department
Purpose Rucurrent Capital

52
158 Ministry of Public Enterprise Development
Acquisition of a vehicle, Personel Emoluments of JEDB, State Plantation Corp and Elkaduwa Plantation, Create Housing Bank as per the Budget Proposal, Rehabilitation and improvements
7,797,290,000
159 Ministry of Tourism Development and Christian Religious Affairs
Acquisition of a vehicle , Update printed and electronic brochures, Establish Training Center and an Integrated Information Center, Expand Tourist Police Units, Investment in jetties, Interest subsidy loan scheme, Construct a MICE Convention Centre as per the Budget Proposals
510,000,000
1,293,000,000
203 Department of Christian Religious Affairs
Rehabilitation of religious places as per the Budget Proposal, Uniform, Library & Dehami Diriya Teachers Allowances for Dhamma School Teachers
114,627,000
25,000,000
160 Ministry of Mahaweli Development and Environment
Project on National Implementation plan, International Training Workshop, Mainstreaming Agro Biodiversity Conservation, Effective Management of Invasive Alien Species, Project on Preparation of Sri Lanka's Third National Communication, "Mainstreaming Biodiversity Conservation and Sustainable use for Improved Human Nutrition and Wellbeing" and " Mechanism for Reducing Emissions from Deforestation and Degradation", Personal Emoluments and Other, Implementation of the Montreal Protocol
8,034,000
31,941,800
283 Department of Forests
Establishment and Management of Industrial Plantation
40,000,000
161 Ministry of
Sustainable Development and Wildlife
Acquisition of a vehicle 43,000,000
Rs.Head No.
Ministry / Department
Purpose Rucurrent Capital

53
162 Ministry of Megapolis and Western Development
Expenditure on Megapolis Development Projects, Greater Colombo Flood Protection and Environment Development, Relocation of Manning Market, Townships Development and Urban Solid Waste Management, Beira Lake Rehabilitation and Redevelopment Project, Urban Regeneration Programme, Matara Riverside Development and "Build iconic buildings by Urban Development Authority and Inland Revenue Department" as per the Budget Proposal, Metro Colombo Urban Development project, Compensation for the acquisition of lands, royalty fee for dredging sea sand, Development of Strategic Cities, Metro Colombo Flood Resilient Urban Environment Trust Fund, preparation of Master Plan for Trincomalee District, Settle the bills of 2016, Urubokka City Development Project
551,800,000
20,642,317,000
163 Ministry of Internal Affairs, Wayamba Development and Cultural Affairs
Establishing an Immigration Police, Contributory Pension Scheme for Artists, Infrastructure Development, Acquisition of furniture & office equipments
612,670,000
206 Department of Cultural Affairs
Renovation project of John De Silva Theatre and National Art Gallery
61,000,000
226 Department of Immigration and Emigration
Expenditure for Staff Trainining 2,500,000
165 Ministry of National Integration and Reconciliation
Facilitate the undertaking of programmes aimed at improving peace and harmony, Project on key mechanisms process, Hand Book and Workshop on Religious and Cultural Festival Celebrations, Donation of 400 Bicycles to Conflict Affected, Most Vulnerable Students in Jaffna, Reconciliation Focused Economic Empowerment
1,695,396,450
Rs.Head No.
Ministry / Department
Purpose Rucurrent Capital

54
166 Ministry of City Planning and Water Supply
Development of comprehensive plan to upgrade cities as per the Budget Proposal, Acquisition of a vehicle , Dry Zone Urban Water Supply Project., Water & Sanitation Development Programme, Water supply facilities for Resettlement Villages, Purchase three Gully Bowsers , Settle the bills of Emerging Small Townships Water Supply Schemes
4,389,887,500
167 Ministry of Special Assignments
Acquisition of a vehicle 42,600,000
176 Ministry of Ports and Shipping
Settle the commitment of Colombo Ports Expansion Project
32,255,000
182 Ministry of Foreign Employment
Acquisition of vehicle 43,000,000
192 Ministry of Law and Order and Southern Development
Adjustments of salaries of the Sri Lanka Police Service as per the Budget Proposal of 2016, Southern Development, Drug prevention and Rehabilitation of drug addicts, UN Peace Keeping Operations, Personal Emoluments
297,600,000
1,968,330,000
225 Department of Police
Adjustments of salaries of the Sri Lanka Police Service as per the Budget Proposal of 2016, Implement the Development Activities and engage in drug prevention, Eradication and rehabilitation of those who addicted to drugs, Purchase 5 Ambulances, Diets and Uniforms
2,932,000,000
5,097,700,000
193 Ministry of Labour and Trade Union Relations
Construction of Circuit Bungalow at Ampara and purchase essential furniture, Subscriptions and Contributions Fee
1,596,200
8,000,000
Rs.Head No.
Ministry / Department
Purpose Rucurrent Capital

55
194 Ministry of Tele- communication and Digital Infrastructure
Settle the operational Lease rental and CIF and Local Charges, Acquisition of a vehicle, Custom charges and VAT on acquisition of a vehicle, As per the Budget Proposal Digitalizing the Economy, National Digital Identity, National Payment Platform, Establish National Data Center, Toll charging system , Introduce Cryptography and Provide Video conferencing facilities, Foreign Travelling Expenses, Renovation of the official residence
5,670,590
15,082,781,250
195 Ministry of Development Strategies and International Trade
Infrastructre Development, Colombo Fair Exhibition, Foreign Travelling Expenses , Lease rentals for vehicle and Acquisition of a vehicle
66,000,000
1,036,000,000
296 Department of Import and Export Control
Expenditure on Capacity Building 700,000
196 Ministry of Science, Technology & Research
Acquisition of vehicles , Research Assist in Diabetes, Dengue, CKDu and Cancer, Establishment of Innovation Accelerator Fund and Technology Innovation Park, Implemental of Nanotechnology Programme, Establishment of Center for Excellence, Quality Assurance of Imported Products, Product Design Engineering Services Fund and Establishment of Incubators in Collaboration with Nenasala as per the Budget Proposals, expenses of COSTI , Foreign Travelling Expenses,
29,626,000
1,434,000,000
197 Ministry of Skills Development and Vocational Training
Expenditure on Official Residence, Scholarships for students, Stipend for youth to train in apparel, Health care, Hospitality and construction, Upliftment of Matara German Training Technical School and Hotel Training School as per the Budget Proposals, Acquisition of a vehicle rental expenses
640,600,000
229,283,600
Rs.Head No.
Ministry / Department
Purpose Rucurrent Capital

56
198 Ministry of Irrigation and Water Resources Management
Acquisition of the vehicles, Lower Malwathu Oya Irrigation Development Project, Efficiency Management Project, Rehabilitation of Minipe Left Bank and Kithul and Rugam tanks, Kubukkan Oya and Tharapuram tanks and Implement pilot projects to monitor ground water as per the Budget Proposals, Installment of sellers credit, Rehabilitation, Improvement & Acquisition of Capital Assets
7,242,669
1,266,272,422
282 Department of Irrigation
Implementation of Yan Oya Project as per the Budget Proposal
1,000,000,000
199 Ministry of Primary Industries
Lease rental of Vehicle procured under Operational Leasing method
6,411,900
Total 129,501,377,192 197,008,858,782
3.4 Treasury Operations
Performance of the Cash Flow of the General Treasury
Cash inflows from revenue and other receipts to the General Treasury were Rs. 578.5 billion while cash deficit after outflow for recurrent and capital payments amounted to Rs.222.1 billion during the first four months of 2017.This was an increase in net cash deficit by Rs.13.6 billion in the review period compared to the same period of 2016. This
increase in net cash deficit was mainly due to the increase in cash outflows to the capital expenditure by 58.8 percent which was more than that the increase in cash inflows to the General Treasury by 24.1 percent during the first four months of 2017 compared to the same period of 2016. The overall closing cash balance (deficit) as at the end of April 2017 was Rs.146 billion which was Rs.17 billion lower than the cash deficit which prevailed at the end of April 2016.
Source: Department of National Budget
Rs.Head No.
Ministry / Department
Purpose Rucurrent Capital
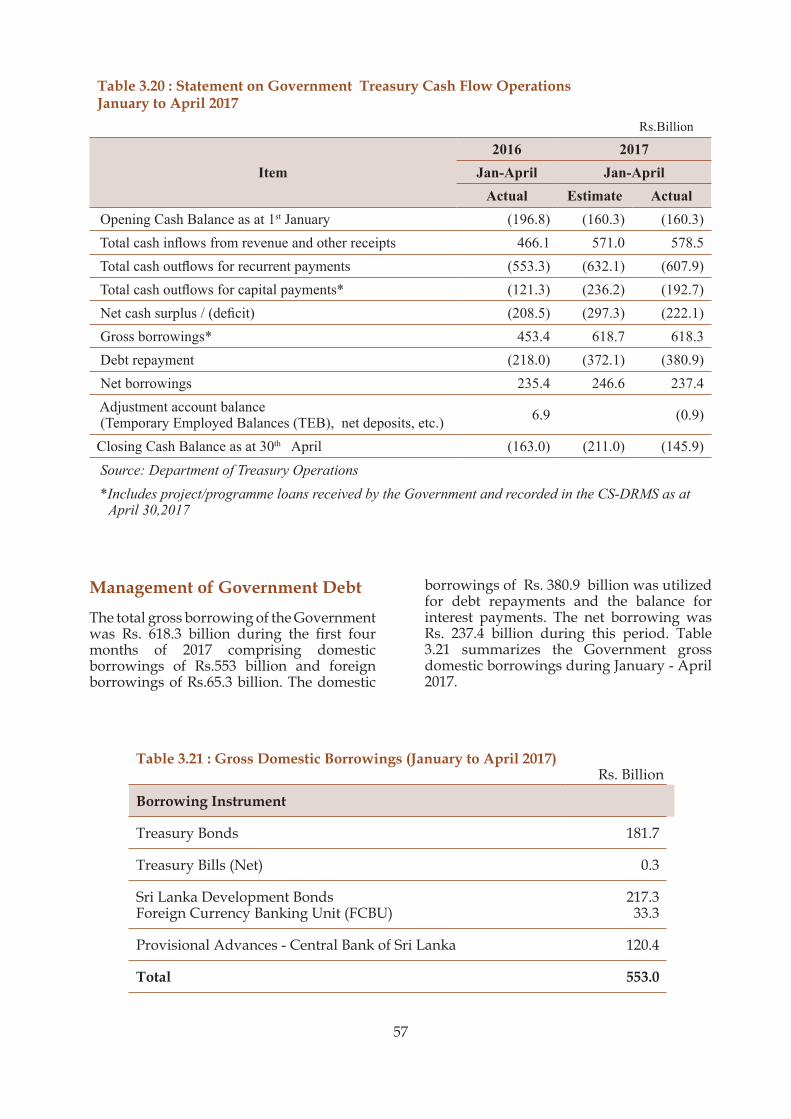
57
Table 3.20 : Statement on Government Treasury Cash Flow Operations January to April 2017
Rs.Billion
Item2016 2017
Jan-April Jan-AprilActual Estimate Actual
Opening Cash Balance as at 1st January (196.8) (160.3) (160.3) Total cash inflows from revenue and other receipts 466.1 571.0 578.5 Total cash outflows for recurrent payments (553.3) (632.1) (607.9) Total cash outflows for capital payments* (121.3) (236.2) (192.7) Net cash surplus / (deficit) (208.5) (297.3) (222.1) Gross borrowings* 453.4 618.7 618.3 Debt repayment (218.0) (372.1) (380.9) Net borrowings 235.4 246.6 237.4 Adjustment account balance (Temporary Employed Balances (TEB), net deposits, etc.) 6.9 (0.9)
Closing Cash Balance as at 30th April (163.0) (211.0) (145.9) Source: Department of Treasury Operations *Includes project/programme loans received by the Government and recorded in the CS-DRMS as at
April 30,2017
Management of Government Debt
The total gross borrowing of the Government was Rs. 618.3 billion during the first four months of 2017 comprising domestic borrowings of Rs.553 billion and foreign borrowings of Rs.65.3 billion. The domestic
borrowings of Rs. 380.9 billion was utilized for debt repayments and the balance for interest payments. The net borrowing was Rs. 237.4 billion during this period. Table 3.21 summarizes the Government gross domestic borrowings during January - April 2017.
Table 3.21 : Gross Domestic Borrowings (January to April 2017)
Borrowing Instrument
Treasury Bonds 181.7
Treasury Bills (Net) 0.3
Sri Lanka Development BondsForeign Currency Banking Unit (FCBU)
217.333.3
Provisional Advances - Central Bank of Sri Lanka 120.4
Total 553.0
Rs. Billion

58
Chart 3.3 Gross Domestic Borrowings (January to April 2017)
Disclosure of Contingent Liabilities on Treasury Guarantees
The value of Treasury Guarantees issued and remained valid as at April 30, 2017, was Rs.837.43 billion which were within the
S. No Name of the Bank or Institution
Name of Institution Amount
1 People's Bank Ceylon Electricity Board 16,813.89 Ceylon Petroleum Corporation 138,816.00 Ceylon Petroleum Storage Terminals Ltd. 6,215.87 Ceylon Shipping Corporation Ltd 12,339.20 Co-operative Whole Sale Establishment 157.10 Lanka Coal Company (Pvt) Ltd 6,000.00 Ministry of Defence and Urban Development
1,000.00
National Water Supply & Drainage Board 957.75 Paddy Marketing Board 2,247.23 People's Bank Pension Trust Fund 2,500.00 Road Development Authority 19,153.56
limit of 10 percent of GDP as per the Section 2 of the Fiscal Management (Responsibility) (Amendment) Act, No. 13 of 2016. The list of Treasury Guarantees issued by the General Treasury as at April 30, 2017, is given in Table 3.22.
Rs. MillionTable 3.22 : The List of Treasury Guarantees Issued by the General Treasury up to 30.04.2017
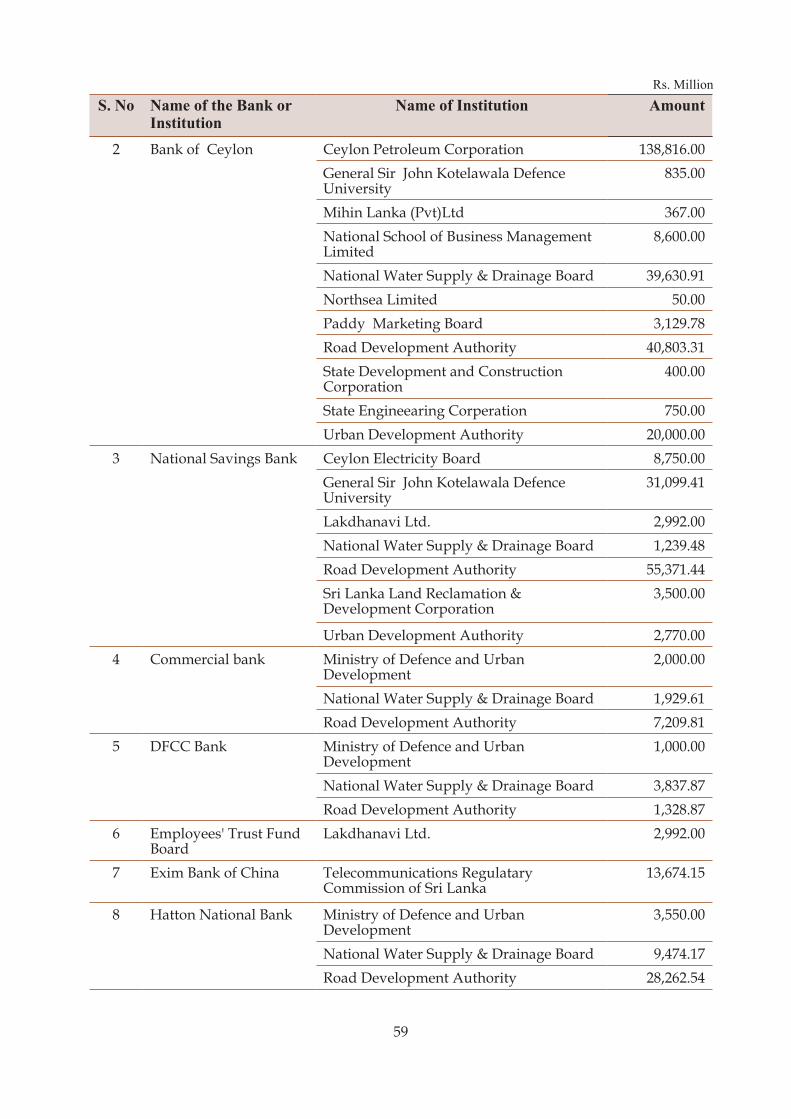
59
2 Bank of Ceylon Ceylon Petroleum Corporation 138,816.00 General Sir John Kotelawala Defence University
835.00
Mihin Lanka (Pvt)Ltd 367.00 National School of Business Management Limited
8,600.00
National Water Supply & Drainage Board 39,630.91 Northsea Limited 50.00 Paddy Marketing Board 3,129.78 Road Development Authority 40,803.31 State Development and Construction Corporation
400.00
State Engineearing Corperation 750.00 Urban Development Authority 20,000.00
3 National Savings Bank Ceylon Electricity Board 8,750.00 General Sir John Kotelawala Defence University
31,099.41
Lakdhanavi Ltd. 2,992.00 National Water Supply & Drainage Board 1,239.48 Road Development Authority 55,371.44 Sri Lanka Land Reclamation & Development Corporation
3,500.00
Urban Development Authority 2,770.00 4 Commercial bank Ministry of Defence and Urban
Development 2,000.00
National Water Supply & Drainage Board 1,929.61 Road Development Authority 7,209.81
5 DFCC Bank Ministry of Defence and Urban Development
1,000.00
National Water Supply & Drainage Board 3,837.87 Road Development Authority 1,328.87
6 Employees' Trust Fund Board
Lakdhanavi Ltd. 2,992.00
7 Exim Bank of China Telecommunications Regulatary Commission of Sri Lanka
13,674.15
8 Hatton National Bank Ministry of Defence and Urban Development
3,550.00
National Water Supply & Drainage Board 9,474.17 Road Development Authority 28,262.54
S. No Name of the Bank or Institution
Name of Institution Amount Rs. Million

60
9 Hongkong & Shanghai Banking Co.Ltd.
West Coast Power(Pvt)Ltd. 22,744.81
10 Industrial And Commercial Bank of China Limited
Ceylon Electricity Board 10,754.17
11 Japan International Coorporation Agency (JICA)
Airport & Aviation Services (Sri Lanka) Limited
104,029.33
12 National Development Bank
National Water Supply & Drainage Board 3,874.13 Road Development Authority 8,353.31
13 Exim Bank of India National Water Supply & Drainage Board 39,593.41 14 China Development
BankNational Water Supply & Drainage Board 7,522.08
Total 837,435.18
S. No Name of the Bank or Institution
Name of Institution Amount Rs. Million

61
4.1 OverviewThe total revenue of the 55 State Owned Business Enterprises (SOBE) to the GDP in 2016 was around 13.3 percent compared to the 12.3 percent recorded in 2015. In this background,of the government policy of strategic reorientation of SOBEs with a view to improving their financial position and service delivery meeting the demands of the rapidly growing economy resulted in the signing of Statements of Corporate Intent (SCI)1 with five (05) selected key SOBEs namely Ceylon Petroleum Corporation (CPC), Ceylon Electricity Board, National Water Supply and Drainage Board (NWS & DB), Airport and Aviation Services (Sri Lanka) Ltd (AASL) and Sri Lanka Ports Authority (SLPA).
The expected results of the SCIs are;
• to operate SOBEs as budgetary independent institutions in a commercially viable manner
• to improve the practices of Corporate Governance
• the use of efficient Financial Management practices
• strengthening the human resource management
• tochange the operational culture and reengineering the business process
• to ensure efficient and effective business operations and generate a reasonable Return on Investment.
The overall performance of SOBEs have been mixed during the first 4 months of 2017, with the performance CEB and CPC incurring losses during this period in comparison to the first 4 months of 2016, mainly due to the dry weather conditions which was carried over to 2017 from 2016. The performance was further effected with global oil prices
CHAPTER 4Performance of State Owned Business Enterprises
increasing by almost USD 10-15/barrel or 20-25percent, during the first 4 months of 2017 against the same period in 2016.
Based on the adverse shocks on the performance, the return of Investment from SOBEs during the first 4 months in 2017 has also declined to Rs. 4,371 million compared to Rs 7,891 million recorded last year in the same time period.
In the meantime, the outstanding debt to banks of 42 non-financial SOBEs increased by 17 percent to Rs. 889,132 million during the first four months of 2017 from Rs. 758,160 million recorded at the end of 2016.
4.2 Review of the ten major SOEs
Bank of Ceylon (BOC)
BOC has the largest asset base in the banking industry in Sri Lanka and has managed to maintain the asset base of above one trillion over the last four years.
BoC’s asset base recorded an increase of 8.2 percent to Rs.1,806 billion by the end of April 2017, from Rs.1,669 billion as at the end of the year 2016. The deposit base has increased by 3.9 percent to Rs.1,305 billion during the first four months of 2017 compared to Rs.1,256 billion as at the end of 2016.Non performing loan ratio of the bank has recorded an increase during the period of first four months of 2017 to 3.39 percent from 2.88 percent prevailed as at the end of 2016.BOC has recorded a profit before tax of Rs.10.2 billion for the first four months of 2017, compared to Rs.10.1 billion in the corresponding period of the previous year.
People’s Bank (PB)
People’s Bank has grown into the second largest commercial bank in Sri Lanka in terms of assets with an asset base over Rs. 1 trillion.
1 SCI is a tripartite agreement signed by relevant SOBE, Line Ministry and Ministry of finance and Mass Media. This focuses on improving the performances of SOEs within the agreed period in line with the government policy framework. Initially this was included the Financial and operational result oriented targets along with the KPIs.

62
PB’s asset base recorded an increase of 12.0 percent to Rs.1,458 billion as at the end of first four months of 2017, from Rs.1,302 billion as at the end of 2016. Deposit base of the bank increased by 6 percent to Rs.1,143 billion by the end of April 2017, from Rs.1,078 as at the end of 2016.Net loans and advances has recorded an increment of 11.8 percent during the period from January to April 2017 to Rs.995 billion. PB recorded a profit before tax of Rs.4.6 billion for the first four months of 2017 in comparison to Rs.5.6 billion for the corresponding period of 2016.
National Savings Bank (NSB)
National Savings Bank (NSB) is a government owned Licensed Specialized Bank. NSB retained the AAA (lka) national long term rating by Fitch Ratings Lanka for the fourteenth consecutive year up to 2016.
Bank’s asset base recorded an increase of 2.3 percent to Rs.933 billion as at the end of first four months of 2017, from Rs.912 billion as at the end of 2016. Deposit base of the bank increased by 2.1 percent to Rs.671 billion by the end of April 2017, from Rs.657 as at the end of previous year. Loans and advances has recorded an increment of 7.2 percent during the period from January to April 2017 to Rs.313 billion. NSB recorded a profit before tax of Rs.3.5 billion for the first four months of 2017 in comparison to Rs.4.4 billion for the corresponding period of 2016.
Sri Lanka Insurance Corporation (SLIC)
The Sri Lanka Insurance Corporation recorded a profit before tax of Rs.5,139 million during the first four months of 2017 and recorded a total revenue of Rs. 13.4 billion, which was a significant increase of 24 percent, compared to 10.8 billion during the corresponding period in 2016.
Ceylon Electricity Board (CEB)
CEB faced severe challenges due to dry weather condition prevailed in the country from the latter part of 2016. Hence, an operating loss of Rs. 16,590 million in the first four months of 2017 has been recorded
compared to the operating loss of Rs. 5,781 million recorded in the same period of 2016. Cost per unit without Tax has increased to Rs. 20.28 per kWh in the first quarter of 2017 over Rs. 17.54 per kWh recorded in 2016. Generation mix comprised with 527 GWh Hydro, 1,351 GWh Thermal (Fuel) and 1,603 GWh Thermal (Coal) during the reporting quarter, which has changed from 36:31:33 in 2016 to 15:39:46 in first three months of 2017 due to the decrease of hydro power generation as result of the dry weather conditions that prevailed.
Further, the total outstanding obligations to the banks of CEB in the first quarter stood at Rs.31,744 million compared to Rs. 39,055 million as at 30.04.2016.
The Treasury has provided Rs. 6,000 million through a supplementary allocation to CEB to compensate for the additional cost incurred in utilizing high cost thermal power generation in order to provide an uninterrupted supply of power to the country.
As per an initiative taken in 2016, Statement of Corporate Intent in between Government of Sri Lanka through its line Ministry of Power and Renewable Energy, and the Ministry of Finance and Ceylon Electricity Board has finalized and relevant parties have signed the agreement in March 2017. The main key performance targets in the SCI are to improve the quality of electricity to customers, to become a low- cost electricity supplier, Optimizing generation capacity and ensuring the financial stability of CEB.
Ceylon Petroleum Corporation (CPC)
The import cost of petroleum and petroleum related products for the first four months of CPC increased by 55 percent from US $ 470 Mn to 730 Mn US$ compared to the same period of the preceding year due to increasing in the international market oil prices in the beginning months of year 2017. The average price of a barrel of Brent crude oil during the first four month of year 2017 was US $ 53.96 while it stood at USD39.61 per barrel in first four months of 2016.

63
The increased cost of imports has had a negative impact on the financial performance of CPC, with entity incurring a loss of Rs.3.8 billion during the first 4 months of 2017 against the operational profit of Rs. 37.6 billion recorded during the same period in 2016. The depreciation of the Rupee against the USD has resulted in the CPC incurring an overall exchange loss Rs. 5.7 billion during the first 4 months of 2017. The increase in import cost and the depreciation of rupee against US dollar has expanded the bank exposure level by Rs. 73 billion at the end of April 2017, from Rs. 309 billion at the end of December 2016. The upward pressure on the bank exposure will have an adverse impact on the finance cost of CPC during the second half of 2017.
Government has issued Treasury guarantees worth of US $ 1600 million as collateral to the Bank of Ceylon and Peoples Bank against the borrowings of CPC.
Sri Lanka Ports Authority (SLPA)
SLPA’s revenue, during the first four months of the year 2017 was Rs.14.1 billion which is almost equal to the revenue in the same period in 2016. SLPA recorded a profit before tax of Rs. 4.3 billion prior to adjusting foreign exchange losses during the first four months of the year, against the exchange loss of Rs. 4.6 billion incurred during the same period of 2016. As such, SLPA has recorded a loss of Rs. 0.5 Billion during this period, post the adjustment of the Foreign Exchange loss incurred.
Total outstanding borrowings of SLPA by April 2017 has marginally increased by 1.7 percent to Rs. 237.6 billion. The annual interest cost represents approximately 28 percent of operational expenses of the Authority.
During the first quarter of the year, SLPA signed an agreement of Corporate Intent, which is an agreement to achieve defined targets link to KPI s within next 3 years of the organization, with the Ministry of Ports and Shipping and the Ministry of Finance.
National Water Supply and Drainage Board (NWS&DB)
One of the key objectives of the NWS&DB is to increase the total pipe borne water coverage to 60 percent by 2020 from the existing level of 52 percent. As such, the government has decided to support the operations of NWS&DB through budgetary support.
NWS&DB has already launched 337 water supply schemes and 42 projects are in the pipeline.
Non-Revenue Water (NRW), which was created mostly due to issues in linkages, metering problems and unauthorized consumption has a significant impact on the operations of NWS&DB. The current NRW is at comparatively high at around 27.8 percent and it is expected to reduce marginally to 26 percent by 2019.
Even though the revenue for the first four months in 2017 has increased by 7 percent to Rs. 7,405 million compared to same time period in 2016, total profitability of NWS&DB has declined by 50 percent to Rs. 140 million due to the increase in operating cost. However, as per the SCI, NWS&DB is expected to record a profit of Rs. 4,830 million in 2017.
Airport and Aviation Services (Sri Lanka) Ltd (AASL)
AASL initiatedresurfacing the runway at the runwayat the Bandaranayake International Airport (BIA) in early 2017 since it has not been repaired during the required time at a cost of Rs 7.2 billion. As such, the BIA was closed for commercial operations between 8.30 a.m. to 4.30 p.m continuously for three months and it was successfully completed on 06.04.2017 enabling BIA to handle wide bodied aircrafts. During the three months of restricted access to the BIA,the number of passengers handled by the BIA in the first four months of 2017 has declined by 3percent to 3.1 million compared to 3.2 million recorded during the same period in 2016.

64
Operational Statistic of Mattala
PeriodTotal
Passenger Handling
International Aircraft
Handling
First 4 months of 2016 (Draft)
1,395 320
First 4 months of 2017 (Provisional)
48,810 623
However, it is estimated that revenue has increased marginally to around Rs. 6,596million during the first 4 months of 2017 compared to the same period in 2016.
As per the government policy SCI was signed with the AASL as one strategically important SOBEs out of 5 identified SOBEs. The agreed profit and passenger movements under the signed SCIare 6,699 million and 10.5 million of passengers respectively in 2017.
Sri Lankan Airlines (SLA)
The Government of Sri Lanka (GOSL) is currently in the process of restructuring the SLA and expects to offer an equity stake and management control of the company with a view to turnaround the SLA as commercially viable entity. However, due to the delays in the selecting a suitable business partner, the Cabinet Committee on Economic Management has appointed a high level
committee to study all the options available for the restructuring of the SLA.
The total loss of the SLA has increased by 55 percent to Rs 9,522 million in first four month in 2017 compared to the loss of Rs. 6,125 million recorded in the same period in 2016. However, the accumulated losses and the negative net worth of the SLA as at 30.04.2017 has reached to 170 billion and Rs. 116 billion respectively.
Considering the weak financial liquidity position continuously experienced by the SLA and the Mihin Lanka (Pvt)Ltd. (MLL), Treasury has provided Guarantees and Letters of Comfort in order support the SLA to secure the loan facilities until the restructuring process is concluded. As such, the accumulated commitments up to April 2017 stood at Rs. 29,917 million and US$ 210 million.
The fleet operations and route networks of MLL were amalgamated to the SLA with effect from 30th October 2016 based on a decision made by the Cabinet Committee on Economic Management (CCEM). Further, the Cabinet of Ministers granted approval to offer VRS to the MLL employees. As such, 168 employees of the MLL resigned under the VRS scheme offered while 124 employees were absorbed to the SLA considering the needful.

65
Table 4.1: Outstanding Debt to Banks of Non-Financial State Owned Business Enterprises
EnterpriseDebt to Banks As at
30.04.2017 (Provisional)2015 2016 (Draft)
1 Ceylon Electricity Board 41,824 33,468 31,7442 Ceylon Petroleum Corporation 354,094 308,516 382,5523 Sri Lanka Ports Authority 233,148 233,189 237,656
4 National Water Supply and Drainage Board 9,413 35,728 42,267
5 Airport and Aviation Services (SL )Ltd 37,729 37,679 38,5246 Sri Lankan Airlines Ltd (a) 76,065 67,599 91,5877 Mihin Lanka (Pvt) Ltd 165 3,372 4,8178 Sri Lanka Transport Board 3,395 - -9 State Engineering Corporation 431 560 1,205
10 Central Engineering Consultancy Bureau - - -
11 State Development and Construction Corp. 650 650 700
12 Milco (Pvt) Ltd 668 688 46013 National Livestock Development Board 861 207 250
14 Sri Lanka State Plantations Corporation 83 154 4.1
15 Janatha Estates Development Board 41 - 13716 Kurunegala Plantations Ltd - - -17 Chilaw Plantations Ltd - - -18 Kalubovitiyana Tea Factory Ltd - - 44.619 Sri Lanka Cashew Corporation - - -20 Lanka Mineral Sands Ltd - 100 -21 Lanka Phosphate Ltd - 15 2522 Kahatagaha Graphite Lanka Ltd - - -23 Development Lotteries Board - - -24 National Lotteries Board - - -
25 State Pharmaceuticals and Manufacturing Corp. - - 434.6
26 SL Ayurvedic Drugs Corporation 49 52 5027 State Pharmaceuticals Corporation 56 39 49.628 Sri Jayawardenapura General hospital - - -29 Independent Television Network Ltd - - -30 SL Rupavahini Corporation 195 310 36231 Sri Lanka Broadcasting Corporation - - -32 Sri Lanka Handicraft Board 673 592 54433 State Timber Corporation - - -34 STC General Trading Company - - 136035 Lanka Sathosa Ltd - - 12,13336 State Printing Corporation - - 550.737 Ceylon Fisheries Corporation - - 6338 Ceylon Fishery Harbour Corporation 36 0.2 -39 Ceylon Fertilizer Company Ltd 31,310 27,481 28,295
40 Colombo Commercial Fertilizer Company Ltd 12,483 7,747 13,317
41 Hotel Developers Lanka PLC - - -42 Lanka Sugar Company Ltd 23 14 NA Total 803,392 758,160 889,132
Source: SOBEs and Department of public Enterprises (a) Financial year ended as at 31st March each year
Rs. Million
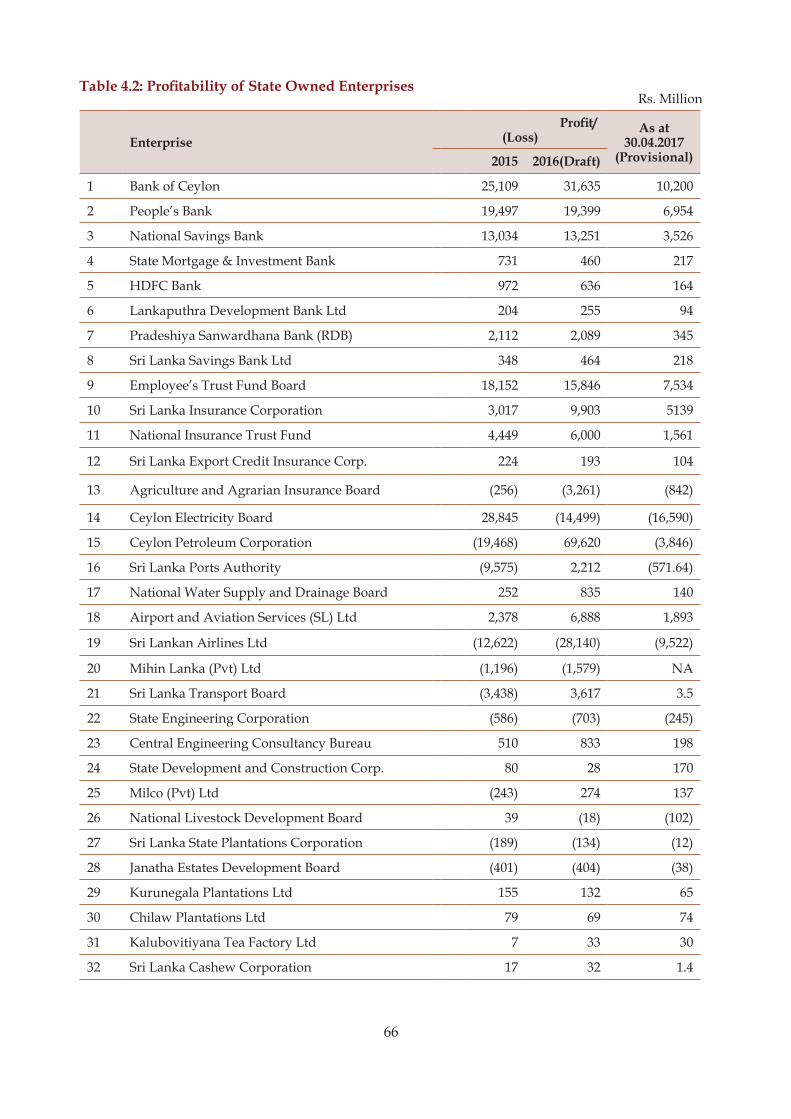
66
Table 4.2: Profitability of State Owned Enterprises
Enterprise Profit/
(Loss)As at
30.04.2017 (Provisional)2015 2016(Draft)
1 Bank of Ceylon 25,109 31,635 10,200
2 People’s Bank 19,497 19,399 6,954
3 National Savings Bank 13,034 13,251 3,526
4 State Mortgage & Investment Bank 731 460 217
5 HDFC Bank 972 636 164
6 Lankaputhra Development Bank Ltd 204 255 94
7 Pradeshiya Sanwardhana Bank (RDB) 2,112 2,089 345
8 Sri Lanka Savings Bank Ltd 348 464 218
9 Employee’s Trust Fund Board 18,152 15,846 7,534
10 Sri Lanka Insurance Corporation 3,017 9,903 5139
11 National Insurance Trust Fund 4,449 6,000 1,561
12 Sri Lanka Export Credit Insurance Corp. 224 193 104
13 Agriculture and Agrarian Insurance Board (256) (3,261) (842)
14 Ceylon Electricity Board 28,845 (14,499) (16,590)
15 Ceylon Petroleum Corporation (19,468) 69,620 (3,846)
16 Sri Lanka Ports Authority (9,575) 2,212 (571.64)
17 National Water Supply and Drainage Board 252 835 140
18 Airport and Aviation Services (SL) Ltd 2,378 6,888 1,893
19 Sri Lankan Airlines Ltd (12,622) (28,140) (9,522)
20 Mihin Lanka (Pvt) Ltd (1,196) (1,579) NA
21 Sri Lanka Transport Board (3,438) 3,617 3.5
22 State Engineering Corporation (586) (703) (245)
23 Central Engineering Consultancy Bureau 510 833 198
24 State Development and Construction Corp. 80 28 170
25 Milco (Pvt) Ltd (243) 274 137
26 National Livestock Development Board 39 (18) (102)
27 Sri Lanka State Plantations Corporation (189) (134) (12)
28 Janatha Estates Development Board (401) (404) (38)
29 Kurunegala Plantations Ltd 155 132 65
30 Chilaw Plantations Ltd 79 69 74
31 Kalubovitiyana Tea Factory Ltd 7 33 30
32 Sri Lanka Cashew Corporation 17 32 1.4
Rs. Million

67
Source: SOBEs and Department of public Enterprises
33 Lanka Mineral Sands Ltd 509 206 43
34 Lanka Phosphate Ltd 57 (34) (36)
35 Kahatagaha Graphite Lanka Ltd 13 14 1.7
36 Development Lotteries Board 1,669 2,833 621
37 National Lotteries Board 700 414 34
38 State Pharmaceuticals and Manufacturing Corp. 414 262 151.7
39 SL Ayurvedic Drugs Corporation 49 72 NA
40 State Pharmaceuticals Corporation 1,230 1,677 370
41 Sri Jayawardenapura General hospital (250) 418 (36.5)
42 Independent Television Network Ltd 327 (162) (120)
43 SL Rupavahini Corporation (375) (160) 8.8
44 Sri Lanka Broadcasting Corporation 62 84 20.3
45 Sri Lanka Handicraft Board (40) 4 8.6
46 State Timber Corporation 795 531 80.5
47 STC General Trading Company 19 26 15
48 Lanka Sathosa Ltd (3,647) (4,805) 742
49 State Printing Corporation 3 10 (145)
50 Ceylon Fisheries Corporation (190) (91) 8
51 Ceylon Fishery Harbour Corporation (60) (113) (22.28)
52 Ceylon Fertilizer Company Ltd 411 713 45
53 Colombo Commercial Fertilizer Company Ltd 436 147 12
54 Hotel Developers Lanka PLC 433 605 1.88
55 Lanka Sugar Company Ltd (981) 1,103 (653)
Total 73,821 139,720 8,149.96
Enterprise Profit/(Loss) As at
30.04.2017 (Provisional)2015 2016(Draft)
Rs. Million
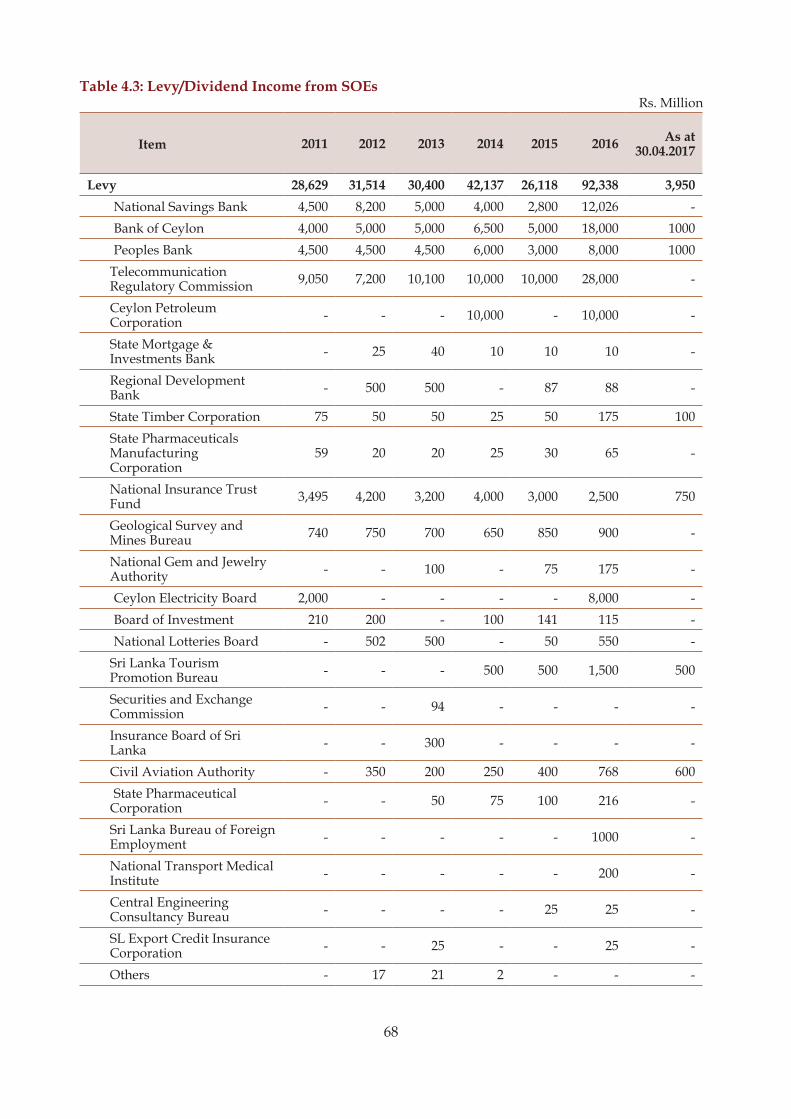
68
Table 4.3: Levy/Dividend Income from SOEs
Item 2011 2012 2013 2014 2015 2016 As at 30.04.2017
Levy 28,629 31,514 30,400 42,137 26,118 92,338 3,950National Savings Bank 4,500 8,200 5,000 4,000 2,800 12,026 -Bank of Ceylon 4,000 5,000 5,000 6,500 5,000 18,000 1000Peoples Bank 4,500 4,500 4,500 6,000 3,000 8,000 1000
Telecommunication Regulatory Commission 9,050 7,200 10,100 10,000 10,000 28,000 -
Ceylon Petroleum Corporation - - - 10,000 - 10,000 -
State Mortgage & Investments Bank - 25 40 10 10 10 -
Regional Development Bank - 500 500 - 87 88 -
State Timber Corporation 75 50 50 25 50 175 100State Pharmaceuticals Manufacturing Corporation
59 20 20 25 30 65 -
National Insurance Trust Fund 3,495 4,200 3,200 4,000 3,000 2,500 750
Geological Survey and Mines Bureau 740 750 700 650 850 900 -
National Gem and Jewelry Authority - - 100 - 75 175 -
Ceylon Electricity Board 2,000 - - - - 8,000 -Board of Investment 210 200 - 100 141 115 -National Lotteries Board - 502 500 - 50 550 -
Sri Lanka Tourism Promotion Bureau - - - 500 500 1,500 500
Securities and Exchange Commission - - 94 - - - -
Insurance Board of Sri Lanka - - 300 - - - -
Civil Aviation Authority - 350 200 250 400 768 600State Pharmaceutical
Corporation - - 50 75 100 216 -
Sri Lanka Bureau of Foreign Employment - - - - - 1000 -
National Transport Medical Institute - - - - - 200 -
Central Engineering Consultancy Bureau - - - - 25 25 -
SL Export Credit Insurance Corporation - - 25 - - 25 -
Others - 17 21 2 - - -
Rs. Million

69
Rs. Million
Dividends 5,722 4,548 4,770 4,664 3,678 15,821 421
Bank of Ceylon 20 346 346 346 346 346 173
People's Bank - 158 316 316 316 316 158
Sri Lanka Telecom PLC 536 759 760 759 795 795 -
De La Rue Lanka Ltd 68 42 44 49 61 62 -
Lanka Mineral Sands Ltd 500 1,700 - 43 14 - -
Lanka Industrial Estates Ltd 31 47 55 55 55 47 -
Airport and Aviation Services Ltd 2,406 - 500 500 497 1,500 -
Lanka Electricity Company Ltd - 75 75 25 87 152 -
Plantation Companies** 219 179 139 80 62 10 54
Sri Lanka Insurance Corporation Ltd 1,750 1,001 2,199 2,001 1,003 11,857 -
Lankaputhra Development Bank 6 18 36 36 36 36 -
National Savings Bank 60 60 60 60 60 60 30
National Development Bank 2 4 10 6 5 2 1
Lanka Phosphate Ltd 20 40 25 35 30 - 5
Independence Television Network Ltd 49 88 50 125 84 - -
Rakna Arakshaka Lanka Ltd - 10 17 68 93 - -
Ceylon Fertilizer Ltd 12 4 9 38 54 116 -
Colombo Commercial Fertilizer Ltd - 8 10 12 10 25 -
Lanka Leyland Ltd 35 5 97 11 54 34 -
Others 8 4 22 99 16 463 -
Total 34,351 36,062 35,170 46,801 29,796 108,159 4,371
Item 2011 2012 2013 2014 2015 2016 As at 30.04.2017
Source: SOBEs and Department of public Enterprises

70

71
5.1 Foreign Financing CommitmentsThe Government has entered into ten (10)financing commitment agreementswith foreign development partners and lending agencies from 1st January to 30th April 2017amounting to US$ 244.1 millionto support the Public Investment Program (PIP) in accordance with the macroeconomic targets envisaged in the Medium-term Fiscal Framework 2017-2020. Of the total commitments made during this period, US$ 174.3 million and US$ 69.8 million were made in the forms of loans and grantsrespectively. A complete list of commitments is shown in Table 5.1 along with financial terms of each loan.
CHAPTER 5Foreign Financing
Out of the commitments made for the development activities, the International Development Association (IDA) of the World Bank has made the highest commitment during January-April 2017amounting to US$ 119.4 million followed by theEuropean Investment Bank (US$ 53.4 million), European Community (US$ 44.8 million), Korea (US$ 13.0 million) and Japan (US$ 11.2 million).
From the sectoral perspective of the commitments, the highest amount has been committed for agriculture sector (US$ 153.8 million) followed by water supply and sanitation (US$53.4 million) sector during this period.
Chart 5.1: Sector-wise Commitment for Development Activitiesfrom 1st January to 30th April 2017 (US$ million)
153.8, 63%
53.4, 22%
13.0, 5%
12.8, 5%
11.2, 5%
Agriculture
Water Supply & Sanitation
Education & Training
Humanitarian Assistance
Other
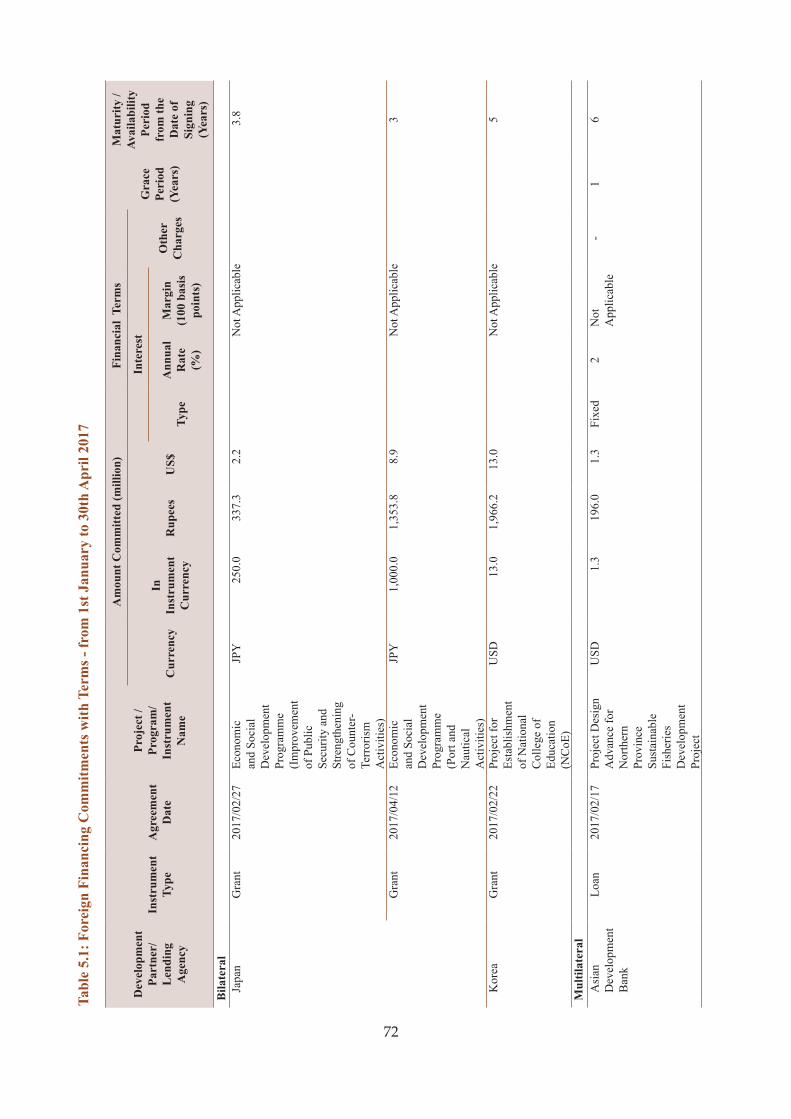
72
Tabl
e 5.
1: F
orei
gn F
inan
cing
Com
mitm
ents
with
Ter
ms -
from
1st
Jan
uary
to 3
0th
Apr
il 20
17
Dev
elop
men
t Pa
rtne
r/
Len
ding
A
genc
y
Inst
rum
ent
Type
Agr
eem
ent
Dat
e
Proj
ect /
Prog
ram
/ In
stru
men
t N
ame
A
mou
nt C
omm
itted
(mill
ion)
Fina
ncia
l Te
rms
Gra
ce
Peri
od
(Yea
rs)
Mat
urity
/Av
aila
bilit
y Pe
riod
fr
om th
e D
ate
of
Sign
ing
(Yea
rs)
Cur
renc
yIn
In
stru
men
t C
urre
ncy
Rup
ees
US$
Inte
rest
Oth
er
Cha
rges
Type
Ann
ual
Rat
e (%
)
Mar
gin
(100
bas
is
poin
ts)
Bila
tera
l
Japa
n
Gra
nt
2017
/02/
27Ec
onom
ic
and
Soci
al
Dev
elop
men
t Pr
ogra
mm
e (I
mpr
ovem
ent
of P
ublic
Se
curit
y an
d St
reng
then
ing
of C
ount
er-
Terr
oris
m
Act
iviti
es)
JPY
250.
033
7.3
2.2
Not
App
licab
le 3
.8
Gra
nt
2017
/04/
12Ec
onom
ic
and
Soci
al
Dev
elop
men
t Pr
ogra
mm
e (P
ort a
nd
Nau
tical
A
ctiv
ities
)
JPY
1,00
0.0
1,35
3.8
8.9
Not
App
licab
le3
K
orea
Gra
nt
2017
/02/
22Pr
ojec
t for
Es
tabl
ishm
ent
of N
atio
nal
Col
lege
of
Educ
atio
n (N
CoE
)
USD
13.0
1,96
6.2
13.0
Not
App
licab
le5
Mul
tilat
eral
A
sian
D
evel
opm
ent
Ban
k
Loan
2017
/02/
17Pr
ojec
t Des
ign
Adv
ance
for
Nor
ther
n Pr
ovin
ce
Sust
aina
ble
Fish
erie
s D
evel
opm
ent
Proj
ect
USD
1.3
196.
01.
3Fi
xed
2N
ot
App
licab
le-
16

73
Eu
rope
an
Com
mun
ity
Gra
nt
2017
/04/
06St
reng
then
ing
Rec
onci
liatio
n Pr
oces
ses i
n Sr
i La
nka
EUR
12.0
1,94
4.4
12.8
Not
App
licab
le 0
Gra
nt
2017
/04/
06Su
ppor
t to
the
Mod
erni
zatio
n of
Agr
icul
ture
Se
ctor
in S
ri La
nka
EUR
30.0
4,86
0.9
32.0
Not
App
licab
le 0
Eu
rope
an
Inve
stm
ent
Ban
k
Loan
2017
/01/
20Im
plem
enta
tion
of G
reat
er
Col
ombo
Wat
er
and
Was
tew
ater
M
anag
emen
t Im
prov
emen
t Pr
ogra
m-
Proj
ect 3
EUR
50.0
8,01
4.6
53.4
Varia
ble
LIB
OR
6
Mon
ths
for
US$
0-
111
Fo
od &
A
gric
ultu
re
Org
aniz
atio
n
Gra
nt
2017
/02/
15D
evel
opm
ent
of si
te sp
ecifi
c fe
rtiliz
er
man
agem
ent
syst
ems f
or
sust
aina
ble
crop
pro
duct
ion
USD
0.3
40.8
0.3
Not
App
licab
le 0
Gra
nt
2017
/03/
20Em
erge
ncy
Ass
ista
nce
to R
esto
re
Agr
icul
tura
l Li
velih
oods
of
Vul
nera
ble
Hou
seho
lds
Affe
cted
by
Dro
ught
USD
0.5
75.7
0.5
Not
App
licab
le 0
In
tern
atio
nal
Dev
elop
men
t A
ssoc
iatio
n
Loan
2017
/01/
17A
gric
ultu
re
Sect
or
Mod
erni
zatio
n Pr
ojec
t
SDR
89.2
17,9
63.2
119.
7Fi
xed
1.25
Not
A
pplic
able
Serv
ice
Fee
0.75
%
524
To
tal
36,7
52.9
244.
1
Dev
elop
men
t Pa
rtne
r/
Len
ding
A
genc
y
Inst
rum
ent
Type
Agr
eem
ent
Dat
e
Proj
ect /
Prog
ram
/ In
stru
men
t N
ame
A
mou
nt C
omm
itted
(mill
ion)
Fina
ncia
l Te
rms
Gra
ce
Peri
od
(Yea
rs)
Mat
urity
/Av
aila
bilit
y Pe
riod
fr
om th
e D
ate
of
Sign
ing
(Yea
rs)
Cur
renc
yIn
In
stru
men
t C
urre
ncy
Rup
ees
US$
Inte
rest
Oth
er
Cha
rges
Type
Ann
ual
Rat
e (%
)
Mar
gin
(100
bas
is
poin
ts)
Sour
ce: D
epar
tmen
t of E
xter
nal R
esou
rces
Not
e:
1. L
IBO
R =
Lon
don
Inte
rban
k O
ffer R
ate
2.
For
eign
loan
s com
mitm
ents
mad
e fo
r Sta
te O
wne
d En
terp
rise
s (SO
Es) a
re n
ot in
clud
ed
3. T
he e
xcha
nge
rate
s pre
vaili
ng to
eac
h ag
reem
ent d
ate
have
bee
n us
ed fo
r the
con
vers
ion
of a
mou
nts s
igne
d by
diff
eren
ce c
urre
ncie
s int
o U
S$ a
nd R
upee
s

74
5.2 Foreign Financing Disbursements
Total foreign disbursements made through development projects and programmesfrom 1st January to 30thApril 2017 was US$ 440.6 million (or Rs.66,514.0 million) of which, US$ 8.7 million was made as grants and US$
431.9 million was made as loans. Themajority of the total disbursements were made by China, which is almost 40 percent, followed by World Bank (17 percent) and Asian Development Bank (16 percent) as shown in Chart 5.2.
Development Partner / Lending Agency
Disbursed Amount (million)*
Loan Grant Total
Rupees US$ Rupees US$ Rupees US$
Bilateral 42,813.3 283.8 283.2 1.8 43,096.5 285.6
China 25,650.1 170.1 - - 25,650.1 170.1
Japan 3,990.5 26.4 216.4 1.4 4,206.9 27.8
France 1,630.1 10.8 - - 1,630.1 10.8
Deutsche Bank AG (United Kingdom) 1,602.1 10.6 - - 1,602.1 10.6
India 1,576.0 10.5 - - 1,576.0 10.5
Spain 1,563.4 10.4 - - 1,563.4 10.4
Saudi Arab 1,329.2 8.8 - - 1,329.2 8.8
HSBC (With Guarantee of EKF Denmark) 1,043.2 6.9 - - 1,043.2 6.9
Hungary 810.8 5.4 - - 810.8 5.4
HSBC Bank PLC (UK) 569.5 3.8 - - 569.5 3.8
Export Import Bank of United States 526.5 3.5 - - 526.5 3.5
Germany 397.2 2.7 66.8 0.4 464.0 3.1
Kuwait 447.4 3.0 - - 447.4 3.0
Export Finance & Insurance Corporation (Australia) 432.0 2.9 - - 432.0 2.9
Banco Bilbao VizcayaArgentaria S.A. (Spain) 397.0 2.6 - - 397.0 2.6
KBC Bank of Belgium 319.9 2.1 - - 319.9 2.1
UniCredit Bank Austria AG (Austria) 207.0 1.4 - - 207.0 1.4
Co-op CentraleRaiffeisen-Boerenleenbank (Netherlands) 140.1 0.9 - - 140.1 0.9
Korea 139.1 0.9 - - 139.1 0.9
RaiffeisenZentral Bank (Austria) 42.0 0.3 - - 42.0 0.3
Multilateral 22,383.4 148.1 1,034.2 6.9 23,417.6 155.0
Asian Development Bank 10,899.1 72.1 - - 10,899.1 72.1
International Development Association 8,379.1 55.5 902.5 6.0 9,281.6 61.5
International Bank for Reconstruction & Development 1,727.2 11.4 55.8 0.4 1,783.0 11.8
OPEC Fund for International Development 727.1 4.8 - - 727.1 4.8
International Fund for Agricultural Development 650.8 4.3 75.9 0.5 726.7 4.8
Total 65,196.6 431.9 1,317.4 8.7 66,514.0 440.6
Table 5.2: Disbursements Made by Each Development Partner from 1st January to 30th April 2017
Source: Department of External ResourcesNote: For conversion of disbursements made in various currencies into US$ and Rupees, the exchange rates prevailing to 30th
April 2017 have been used * Provisional
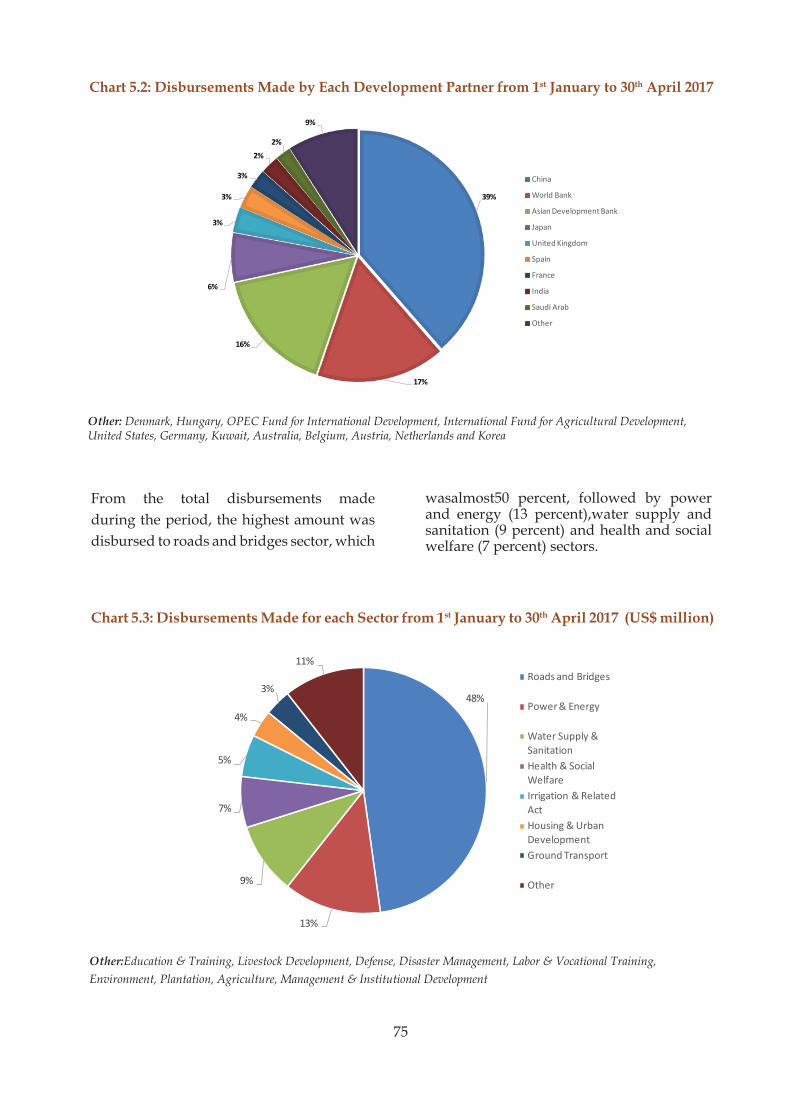
75
Chart 5.2: Disbursements Made by Each Development Partner from 1st January to 30th April 2017
Other: Denmark, Hungary, OPEC Fund for International Development, International Fund for Agricultural Development, United States, Germany, Kuwait, Australia, Belgium, Austria, Netherlands and Korea
From the total disbursements made during the period, the highest amount was disbursed to roads and bridges sector, which
Other:Education & Training, Livestock Development, Defense, Disaster Management, Labor & Vocational Training, Environment, Plantation, Agriculture, Management & Institutional Development
39%
17%
16%
6%
3%
3%
3%
2%
2%
9%
China
World Bank
Asian Development Bank
Japan
United Kingdom
Spain
France
India
Saudi Arab
Other
Chart 5.3: Disbursements Made for each Sector from 1st January to 30th April 2017 (US$ million)
wasalmost50 percent, followed by power and energy (13 percent),water supply and sanitation (9 percent) and health and social welfare (7 percent) sectors.
48%
13%
9%
7%
5%
4%
3%
11%Roads and Bridges
Power & Energy
Water Supply & SanitationHealth & Social WelfareIrrigation & Related ActHousing & Urban DevelopmentGround Transport
Other
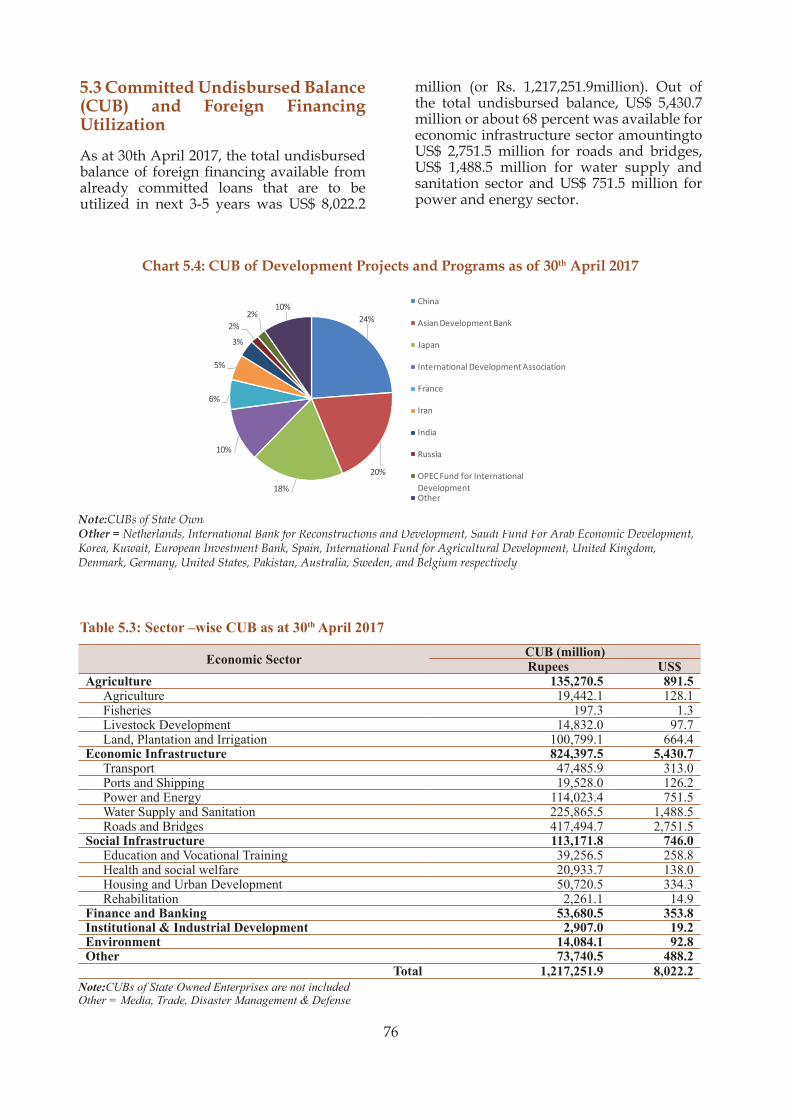
76
5.3 Committed Undisbursed Balance (CUB) and Foreign Financing Utilization
As at 30th April 2017, the total undisbursed balance of foreign financing available from already committed loans that are to be utilized in next 3-5 years was US$ 8,022.2
million (or Rs. 1,217,251.9million). Out of the total undisbursed balance, US$ 5,430.7 million or about 68 percent was available for economic infrastructure sector amountingto US$ 2,751.5 million for roads and bridges, US$ 1,488.5 million for water supply and sanitation sector and US$ 751.5 million for power and energy sector.
Chart 5.4: CUB of Development Projects and Programs as of 30th April 2017
Note:CUBs of State Owned Enterprisesare not includedOther = Netherlands, International Bank for Reconstructions and Development, Saudi Fund For Arab Economic Development, Korea, Kuwait, European Investment Bank, Spain, International Fund for Agricultural Development, United Kingdom, Denmark, Germany, United States, Pakistan, Australia, Sweden, and Belgium respectively
Economic Sector CUB (million) Rupees US$
Agriculture 135,270.5 891.5 Agriculture 19,442.1 128.1 Fisheries 197.3 1.3 Livestock Development 14,832.0 97.7 Land, Plantation and Irrigation 100,799.1 664.4Economic Infrastructure 824,397.5 5,430.7 Transport 47,485.9 313.0 Ports and Shipping 19,528.0 126.2 Power and Energy 114,023.4 751.5 Water Supply and Sanitation 225,865.5 1,488.5 Roads and Bridges 417,494.7 2,751.5Social Infrastructure 113,171.8 746.0 Education and Vocational Training 39,256.5 258.8 Health and social welfare 20,933.7 138.0 Housing and Urban Development 50,720.5 334.3 Rehabilitation 2,261.1 14.9Finance and Banking 53,680.5 353.8Institutional & Industrial Development 2,907.0 19.2Environment 14,084.1 92.8Other 73,740.5 488.2
Total 1,217,251.9 8,022.2
Table 5.3: Sector –wise CUB as at 30th April 2017
Note:CUBs of State Owned Enterprises are not included Other = Media, Trade, Disaster Management & Defense
24%
20%
18%
10%
6%
5%
3%
2%2%
10%China
Asian Development Bank
Japan
International Development Association
France
Iran
India
Russia
OPEC Fund for International DevelopmentOther

77
5.4 External Debt Stock and External Debt Service Payments
Chart 5.4: Debt Service Payments during January – April 2017 and Forecast1 for the Remaining Period of 2017 (US$ million)
1 Non-residential holdings of Treasury Bills/Bonds and outstanding debt of State Owned Enterprises (SOEs) are not included.2 Debt Service = Principal Payments + Interest Payments, Debt Service Payment of SOEs are not included
US$ estimations are based on the exchange rates as at 30th April 2017, Forecast was made based on existing portfolio only, i.e. debt stock to be accumulated due to new commitments were not included
Total estimated debt service payment for 2017 is US$ 2,183.0 million, of which, 30 percent has already been made by 30thApril 2017. Monthly breakdown of debt service payments for 2017 is shown in Chart 5.5.
0
50
100
150
200
250
Principal Repayments Interest Payments
By the end of April 2017, the total outstanding external debt of the Government was US$ 25.61 billion (or Rs. 3,886.5 billion). Total debt service2 payments from 1st January to 30th April 2017 amounted to US$ 713.4 million of which, US$ 332.9 million ws paid for principal repayments and the balance US$ 313.3 million was paid for interest payment.