microwave and millimeter-wave radiometric and radiosonde...
TRANSCRIPT
Microwave and Millimeter-Wave Radiometric and Radiosonde Observations in anArctic Environment
V. MATTIOLI
Dipartimento di Ingegneria Elettronica e dell’Informazione, Università di Perugia, Perugia, Italy
E. R. WESTWATER
Center for Environmental Technology, Department of Electrical and Computer Engineering, University of Colorado,Boulder, Colorado
D. CIMINI
CETEMPS, University of L’Aquila, L’Aquila, Italy
A. J. GASIEWSKI, M. KLEIN, AND V. Y. LEUSKI
Center for Environmental Technology, Department of Electrical and Computer Engineering, University of Colorado,Boulder, Colorado
(Manuscript received 5 October 2007, in final form 7 March 2008)
ABSTRACT
In a recent paper by Mattioli et al., a significant difference was observed between upper-tropospheric andlower-stratospheric water vapor profiles as observed by two radiosonde systems operating in the Arctic. Thefirst was the Vaisala RS90 system as operated by the U.S. Department of Energy’s Atmospheric RadiationMeasurement Program; the second was the operational radiosondes launched by the U.S. National WeatherService that used the Sippican VIZ-B2 type. Observations of precipitable water vapor by ground-basedmicrowave radiometers and GPS did not reveal these differences. However, both the microwave radiometerprofiler (MWRP) and the ground-based scanning radiometer (GSR) contain channels that receive a sig-nificant response from the upper-tropospheric region. In this paper, it is shown that brightness temperature(Tb) observations from these instruments are in consistent agreement with calculations based on the RS90data but differ by several degrees with calculations based on the VIZ radiosondes. It is also shown thatcalculations of Tb can serve as a gross quality control of upper-tropospheric soundings.
1. Introduction
In a recent paper (Mattioli et al. 2007), comparisonsbetween remote and in situ measurements of watervapor during the 2004 North Slope of Alaska ArcticWinter Radiometric Experiment (NSA2004) were pre-sented. The experiment was conducted for a 1-monthperiod at the U.S. Department of Energy’s Atmo-spheric Radiation Measurement (ARM) Program(Ackerman and Stokes 2003) field site near Barrow,Alaska. A complete description of the instruments used
is given by Mattioli et al. (2007, and references therein).Most of the emphasis of the work was on troposphericwater vapor and the comparison of various measure-ment systems, both in situ and remote. However, therewere some significant differences between the in situsystems in the upper troposphere and lower strato-sphere, and these differences would be difficult to re-solve by the two standard remote sounding systems ofprecipitable water vapor (PWV), namely the dual-frequency microwave radiometer (MWR) and the glob-al positioning system (GPS). Two other sounders thatwere operated during NSA2004, the 12-channel micro-wave radiometer profiler (MWRP) and the 27-channelground-based scanning radiometer (GSR) (Cimini etal. 2007a) can also measure PWV.
Corresponding author address: Vinia Mattioli, DIEI, Universitàdi Perugia, via G. Duranti 93, 06125 Perugia, Italy.E-mail: [email protected]
1768 J O U R N A L O F A T M O S P H E R I C A N D O C E A N I C T E C H N O L O G Y VOLUME 25
DOI: 10.1175/2008JTECHA1078.1
© 2008 American Meteorological Society
JTECHA1078

Moreover, the MWRP contains a channel at 22.235GHz that is sensitive to upper-level water vapor (Deu-ber et al. 2004) and hence might give an independentconfirmation of the differences between the various ra-diosonde systems. In addition, the GSR contains chan-nels that are also sensitive to stratospheric water vapor(Cimini et al. 2007a,b). In this paper, before introducingour data, we give a short summary of the Mattioli et al.(2007) paper. We then present a weighting functionanalysis of various water vapor channels, explain a fewdetails of our calculations, and, finally, discuss our mainresults.
2. Summary of radiometer–radiosondecomparisons from NSA2004
One of the major goals of NSA2004 was to evaluatethe performance of radiosondes and operational re-mote sensing systems during cold (0° to – 40°C) and dry(PWV � 0.5 cm) conditions. This was motivated be-cause of the necessity to develop accurate forwardmodels of both infrared and millimeter-wavelength ra-diometers during these conditions. Previously, experi-ence at the ARM Southern Great Plains Central Facil-ity in Oklahoma (Revercomb et al. 2003) and also in thetropics (Westwater et al. 2003), has shown that MWRscan be used to check the quality of radiosondes and toscale radiosonde humidity profiles to be consistent withPWV derived from the MWR. However, for the Arcticwinter conditions, with PWV frequently less than 0.3cm and surface temperatures less than �35°C, it hasbeen questioned whether MWRs have the requiredsensitivity to perform the necessary scaling and/or qual-ity checks.
During NSA2004, radiosondes were released fromthree sites within 5 km of each other. The radiosondetypes included a Vaisala RS90-A (http://www.vaisala.com), operated at the ARM Duplex (DPLX) and at theGreat White (GW) site; a Sippican VIZ-B2 type (http://www.sippican.com), operated by the National WeatherService (NWS); and a “Snow White” chilled-mirrordewpoint hygrometer, manufactured by MeteolaborAG, Switzerland (http://www.meteolabor.ch). Therewere also measurements of PWV by three independentremote sensors: (i) the dual-frequency MWR, operatedby ARM and manufactured by Radiometrics (http://www.radiometrics.com); (ii) the MWRP, also operatedby ARM and manufactured by Radiometrics; and (iii) aSuomiNet (http://www.suominet.ucar.edu) GPS re-ceiver (SG27). The main conclusions of Mattioli et al.(2007) can be summarized as follows:
1) Relative humidity measurements from the Sippicancarbon hygristor, both of the VIZ-B2 of NWS
(NWS-VIZ) and the Sippican GPS Mark II (MK2-CH) operated at the DPLX, showed an apparentbias with respect to the other instruments (VIZ be-ing higher) above the troposphere, with an averagebias of the order of 16%–20%. In terms of PWV, theVIZ differed from RS90-A radiosondes by about20% relative to an average PWV of 0.3 cm. Similarconclusions have been made by Wang et al. (2003)and by Ferrare et al. (2004) for upper-troposphericand lower-stratospheric measurements at midlati-tudes.
2) In using the MWRP, the use of all five channels inthe water vapor band provided very good agreementwith the MWR, with 0.033 cm rms (11% relative tothe mean PVW). The PWV retrieved from theMWRP by using two channels (22.235 and 30 GHz)provided PWV values with a slightly larger disper-sion (0.042 cm rms), due to a less frequent samplingof each channel of the MWRP (5 min) with respectto the MWR (30 s).
3) Over sample sizes that ranged from about 1000 to7000 data points, the average bias values of the GPS,MWR, and MWRP (five channel) PWV retrievalswere close, with differences generally better than9% of the mean PWV, and the slopes of regressionlines were close to unity (0.98). The bias differencesin PWV between the remote sensors and radio-sondes were larger, ranging from 10% to 30% of themean PWV. Slope differences ranged from 0.91 to1.11.
4) Diurnal differences in PWV were found when com-paring RS90 radiosonde data with three indepen-dent measurements: MWR, MWRP, and NWS-VIZ.These diurnal differences were, respectively, 0.025,0.016, and 0.027 cm. Such differences, although in adifferent climatic regime, were also found by Milo-shevich et al. (2006) and were attributed to heatingof the RS90 humidity elements.
3. Weighting function analysis
A standard way of showing the response of a radi-ometer to profile variations in temperature, water va-por, and cloud liquid is through weighting functions(Westwater 1993). Thus, in terms of variations inbrightness temperature (Tb) from an initial backgroundor initial guess profile as a function of height h, we have
�Tb � �0
�
dh�WT�T � W�V��V � W�C
��C�, �1�
where �T, ��V, and ��C represent profile variations intemperature, water vapor density, and cloud liquid, re-
OCTOBER 2008 M A T T I O L I E T A L . 1769

spectively. Explicit formulas for calculating the weight-ing functions are given by Westwater (1993). Weightingfunction analyses for arctic atmospheres have been pre-sented by Racette et al. (2005) and Cimini et al.(2007b).
a. MWRP weighting functions
The MWRP contains five K-band channels for sens-ing vapor and cloud liquid (22.235, 23.035, 23.835,26.235, and 30.0 GHz). The weighting functions for thefive K-band channels are shown in Fig. 1. Not shownare the two corresponding channels for the MWR. Fig-ure 1a shows the tropospheric response to vapor. Wenote the nearly flat response of the 23.835-GHz chan-nel, a good PWV channel, and the continued increasewith height of the 22.235-GHz channel. This is ampli-fied in Fig. 1b, where the response up to 40 km isshown. Note that the weighting functions for higher-frequency channels are not visible in this figure as theyremain of the order of 1 K (km g m�3)�1. In interpret-ing these weighting functions, it must be rememberedthat the contribution functions must be multiplied bythe water vapor density to estimate the increment in Tb,and the water vapor roughly decreases exponentiallywith height. In addition, our calculations, using Eq. (1),have shown that the contributions to Tb from a changein temperature, for a fixed water vapor density, arenegligible.
b. Ground-based scanning radiometer weightingfunctions
In addition to the ARM MWR and MWRP, duringthe experiment we also operated the 27-channel GSR,
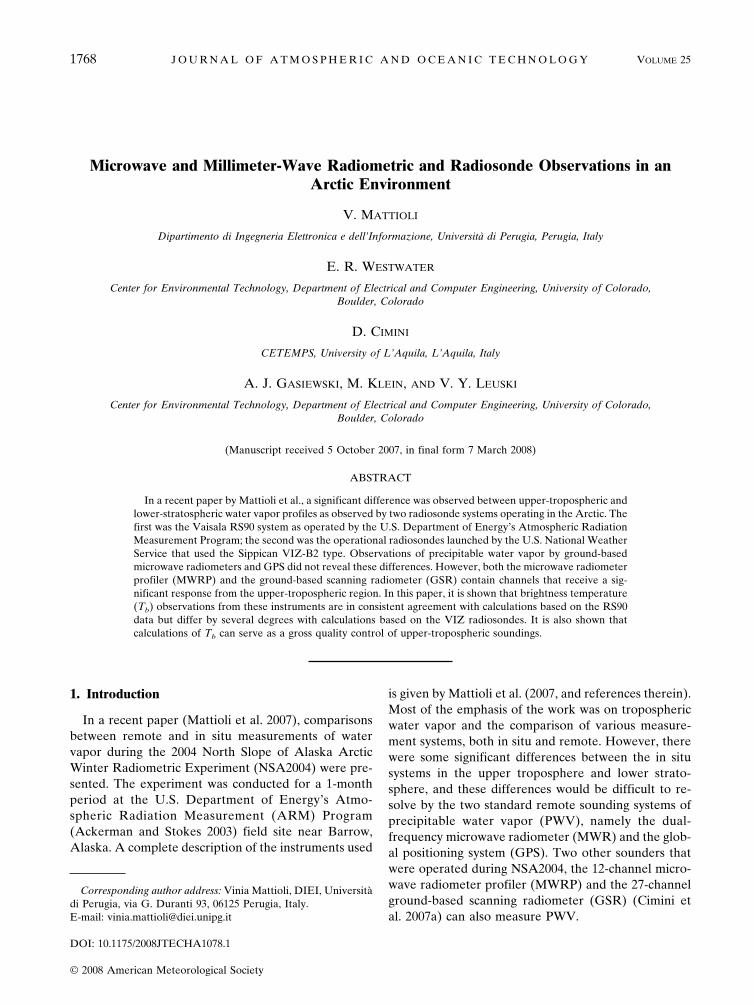
which measures Tb from 50 to 400 GHz (Cimini et al.2007a). At low concentrations of water vapor, whenstratospheric emission is not attenuated by the tropo-sphere, channels near the line center are sensitive towater vapor in the stratosphere. In Fig. 2 we showweighting functions for three of the GSR channelsdistributed near the water vapor absorption line at183.31 GHz. We note that the 183.31 0.55, 1.0, and3.05 GHz channels give a response to the water vaporat higher levels. Conversely, weighting functions forchannels with frequency farther from line center (notshown) decay roughly exponentially with height.
4. Results
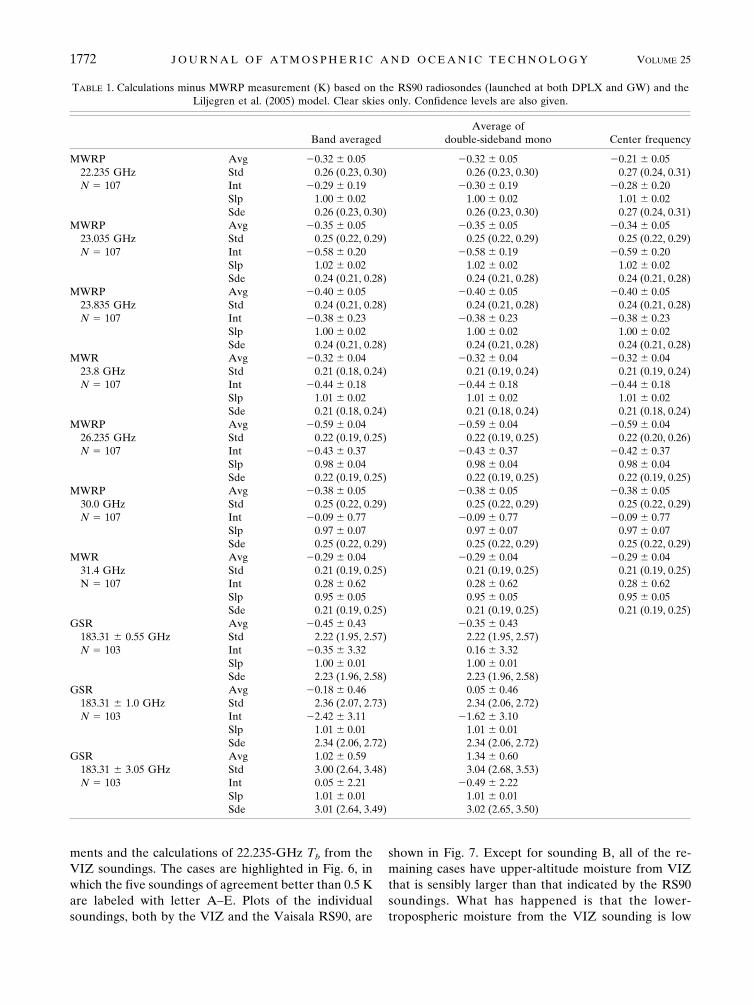
The MWRP and the MWR receivers are superhet-erodyne types with intermediate frequencies located50–190 MHz on either side of the local oscillator fre-quencies. Since the bandpass (BP) filter characteristicsare not available from the manufacturer, we calculatedbrightness temperatures with a couple of simple BPmodels: (i) average of lower and upper sidebands,assuming a rectangular BP; (ii) average of mono-chromatic centers of upper and lower sidebands; and(iii) the monochromatic center frequency. For theGSR, Tb calculations were performed using (i) the av-erage of the BP as provided from the manufacturer and(ii) the average of monochromatic centers of upper andlower sidebands, while case (iii) is not applicable be-cause of double-side BP filters. The results are shown inTable 1 for the RS90 radiosondes, in terms of averagedifference (avg), standard deviation (std), slope, inter-cept (int), and standard error (sde) of a linear fit. Con-fidence levels are also given. It can be noted that usu-ally the calculations (i—iii) are within 0.01 K of each
FIG. 1. Zenith water vapor density weighting functions calculated for the five channels of the MWRP for anaverage Arctic winter profile and a PWV of 1 mm. (a) Troposphere only. (b) Troposphere and stratosphere;note that the weighting functions for higher-frequency channels are not visible, as they remain on the order of 1K (km g m�3)�1.
1770 J O U R N A L O F A T M O S P H E R I C A N D O C E A N I C T E C H N O L O G Y VOLUME 25
other, while the agreement is of the order of 0.1–0.2 Kfor calculations at the 22.235- and 183-GHz channels.Our subsequent calculations are based on the calcula-tions as in (i), that is, BP average. The results for theNWS-VIZ radiosondes are shown in Table 2, andclearly, except for channels at 22.235 and 183.31 GHz,the results are of similar quality to those shown in Table1. The exception at the 22.235-GHz channel is due tothe stratospheric response of the calculations at thecenter frequency. Differences between band-averagedand monochromatic calculations occur because of the100-MHz gap around the centerline in the band aver-aging, which reduces the sensitivity to stratospheric oreven mesospheric water vapor.
In Fig. 3, we show comparisons of time series of mea-sured and calculated Tb for five of the MWRP channelsand the two MWR channels, as well as for three chan-nels of the GSR. For our calculations, we used the ab-sorption model of Liljegren et al. (2005), which differsonly slightly from the model of Clough et al. (2005). Wenotice the good agreement between the calculationsand the measurements at all channels when the RS90measurements are used, but, at times, substantial dif-ferences are evident when the NWS-VIZ radiosondesare used in the 22.235-GHz and the three GSR calcu-lations.
In Fig. 4, we show the statistical results for theMWRP channel at which the departures are the mostevident—the 22.235-GHz one that has a stratosphericresponse (Fig. 4a)—and the 23.835-GHz channel thatonly responds to tropospheric vapor (Fig. 4b). Figure4b shows that Tb calculations at 23.835 GHz based onboth RS90 and VIZ sondes are in good agreement withmeasurements, with bias and std values being less than0.4 K. From Fig. 4b, we calculate that the rms’s of VIZand RS90 are 0.36 and 0.47 K, respectively. Similarly, in
Fig. 4a, the comparisons between measurements andcalculations for the RS90 show excellent agreementover a 16-K range in Tb with an rms difference of 0.4 K,a slope of 1.0, and an intercept of �0.29 K. Conversely,the comparison for the VIZ shows an rms difference of2.6 K, a slope of 1.0, and an intercept of 1.91 K. Exceptfor a few isolated points, there is a significant differencebetween MWRP measurements and calculations at22.235 GHz based on VIZ soundings.
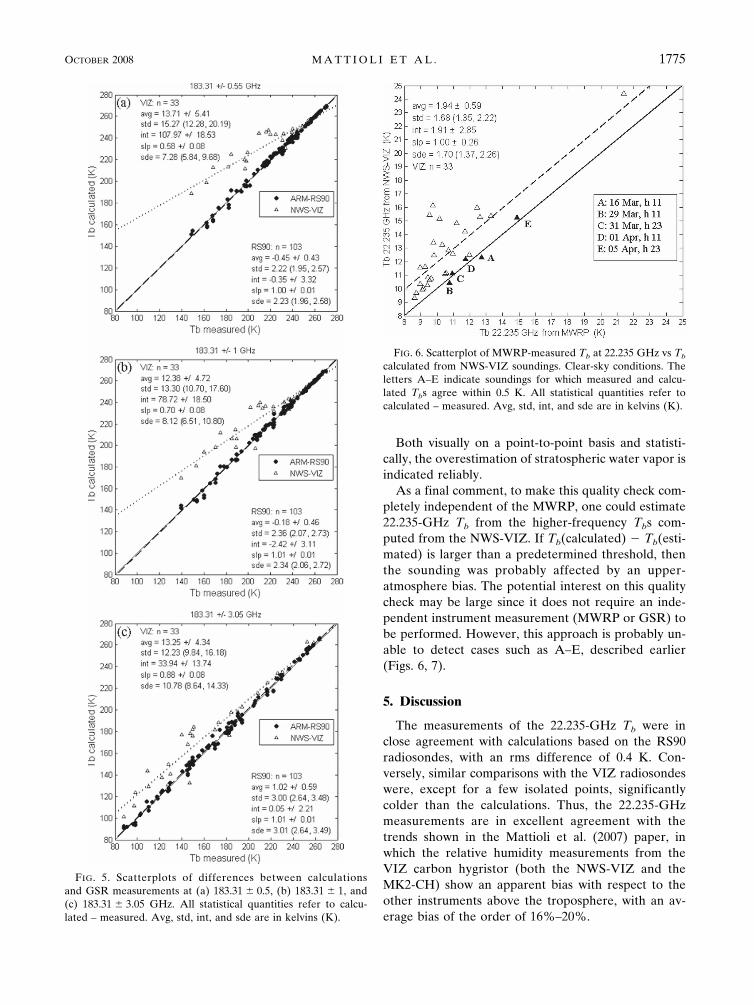
As shown in the papers by Cimini et al. (2007b) andCadeddu et al. (2007), the response of the 183-GHzchannels to water vapor is highly nonlinear, and chan-nels near the line center will saturate for even modestamounts of water vapor. Nevertheless, at low amountsof PWV, say �2 mm, the channels at 183.31 0.55,1.0, and 3.05 GHz can exhibit a stratospheric re-sponse. This response can be seen in Fig. 5, which showsscatterplots of the measured versus calculated Tbs forthree GSR channels. The Tb measurements from theGSR were completely independent from the MWR andthe MWRP, but again calculations from RS90 agreeclosely with Tb measurements, while calculations fromVIZ radiosondes differed substantially. We note thatthe departures are consistent with the weighting func-tions shown in Fig. 2, that is, larger as the channel getscloser to the line center. In addition, the measure-ments tend to agree with calculations from the VIZ athigher Tbs, when saturation is becoming important, andthe upper-atmospheric response is being attenuated.Differences of about 10 K in Tb calculations at 183.3 1 GHz were found by Wang et al. (1995) when com-paring AIR rawinsondes with the six-channel airbornemillimeter-wave imaging radiometer (MIR; Racette etal. 1996).
We also investigated five cases in which there wasapparent agreement between the MWRP Tb measure-
FIG. 2. Zenith water vapor density weighting functions for three water vapor channels of the GSR for anaverage Arctic winter profile and a PWV of 1 mm. (a) Troposphere only. (b) Troposphere and stratosphere.
OCTOBER 2008 M A T T I O L I E T A L . 1771
ments and the calculations of 22.235-GHz Tb from theVIZ soundings. The cases are highlighted in Fig. 6, inwhich the five soundings of agreement better than 0.5 Kare labeled with letter A–E. Plots of the individualsoundings, both by the VIZ and the Vaisala RS90, are
shown in Fig. 7. Except for sounding B, all of the re-maining cases have upper-altitude moisture from VIZthat is sensibly larger than that indicated by the RS90soundings. What has happened is that the lower-tropospheric moisture from the VIZ sounding is low
TABLE 1. Calculations minus MWRP measurement (K) based on the RS90 radiosondes (launched at both DPLX and GW) and theLiljegren et al. (2005) model. Clear skies only. Confidence levels are also given.
Band averagedAverage of
double-sideband mono Center frequency
MWRP22.235 GHzN � 107
Avg �0.32 0.05 �0.32 0.05 �0.21 0.05Std 0.26 (0.23, 0.30) 0.26 (0.23, 0.30) 0.27 (0.24, 0.31)Int �0.29 0.19 �0.30 0.19 �0.28 0.20Slp 1.00 0.02 1.00 0.02 1.01 0.02Sde 0.26 (0.23, 0.30) 0.26 (0.23, 0.30) 0.27 (0.24, 0.31)
MWRP23.035 GHzN � 107
Avg �0.35 0.05 �0.35 0.05 �0.34 0.05Std 0.25 (0.22, 0.29) 0.25 (0.22, 0.29) 0.25 (0.22, 0.29)Int �0.58 0.20 �0.58 0.19 �0.59 0.20Slp 1.02 0.02 1.02 0.02 1.02 0.02Sde 0.24 (0.21, 0.28) 0.24 (0.21, 0.28) 0.24 (0.21, 0.28)
MWRP23.835 GHzN � 107
Avg �0.40 0.05 �0.40 0.05 �0.40 0.05Std 0.24 (0.21, 0.28) 0.24 (0.21, 0.28) 0.24 (0.21, 0.28)Int �0.38 0.23 �0.38 0.23 �0.38 0.23Slp 1.00 0.02 1.00 0.02 1.00 0.02Sde 0.24 (0.21, 0.28) 0.24 (0.21, 0.28) 0.24 (0.21, 0.28)
MWR23.8 GHzN � 107
Avg �0.32 0.04 �0.32 0.04 �0.32 0.04Std 0.21 (0.18, 0.24) 0.21 (0.19, 0.24) 0.21 (0.19, 0.24)Int �0.44 0.18 �0.44 0.18 �0.44 0.18Slp 1.01 0.02 1.01 0.02 1.01 0.02Sde 0.21 (0.18, 0.24) 0.21 (0.18, 0.24) 0.21 (0.18, 0.24)
MWRP26.235 GHzN � 107
Avg �0.59 0.04 �0.59 0.04 �0.59 0.04Std 0.22 (0.19, 0.25) 0.22 (0.19, 0.25) 0.22 (0.20, 0.26)Int �0.43 0.37 �0.43 0.37 �0.42 0.37Slp 0.98 0.04 0.98 0.04 0.98 0.04Sde 0.22 (0.19, 0.25) 0.22 (0.19, 0.25) 0.22 (0.19, 0.25)
MWRP30.0 GHzN � 107
Avg �0.38 0.05 �0.38 0.05 �0.38 0.05Std 0.25 (0.22, 0.29) 0.25 (0.22, 0.29) 0.25 (0.22, 0.29)Int �0.09 0.77 �0.09 0.77 �0.09 0.77Slp 0.97 0.07 0.97 0.07 0.97 0.07Sde 0.25 (0.22, 0.29) 0.25 (0.22, 0.29) 0.25 (0.22, 0.29)
MWR31.4 GHzN � 107
Avg �0.29 0.04 �0.29 0.04 �0.29 0.04Std 0.21 (0.19, 0.25) 0.21 (0.19, 0.25) 0.21 (0.19, 0.25)Int 0.28 0.62 0.28 0.62 0.28 0.62Slp 0.95 0.05 0.95 0.05 0.95 0.05Sde 0.21 (0.19, 0.25) 0.21 (0.19, 0.25) 0.21 (0.19, 0.25)
GSR183.31 0.55 GHzN � 103
Avg �0.45 0.43 �0.35 0.43Std 2.22 (1.95, 2.57) 2.22 (1.95, 2.57)Int �0.35 3.32 0.16 3.32Slp 1.00 0.01 1.00 0.01Sde 2.23 (1.96, 2.58) 2.23 (1.96, 2.58)
GSR183.31 1.0 GHzN � 103
Avg �0.18 0.46 0.05 0.46Std 2.36 (2.07, 2.73) 2.34 (2.06, 2.72)Int �2.42 3.11 �1.62 3.10Slp 1.01 0.01 1.01 0.01Sde 2.34 (2.06, 2.72) 2.34 (2.06, 2.72)
GSR183.31 3.05 GHzN � 103
Avg 1.02 0.59 1.34 0.60Std 3.00 (2.64, 3.48) 3.04 (2.68, 3.53)Int 0.05 2.21 �0.49 2.22Slp 1.01 0.01 1.01 0.01Sde 3.01 (2.64, 3.49) 3.02 (2.65, 3.50)
1772 J O U R N A L O F A T M O S P H E R I C A N D O C E A N I C T E C H N O L O G Y VOLUME 25

with respect to the RS90 and largely compensates forthe upper-atmospheric excess. Thus, by itself, the22.235-GHz channel does not give unambiguous proofof an incorrect sounding. However, the other fourchannels of the MWRP are mostly sensitive to lower-
tropospheric vapor (see Fig. 1). We therefore devel-oped a regression-based method to supplement the ra-diosonde quality check based on the single-frequencyTb measurements only. First we developed a trainingset of RS90 soundings that were taken since 2002 at the
TABLE 2. Calculations minus MWRP measurement (K) based on the NWS-VIZ radiosondes and the Liljegren et al. (2005) model.Clear skies only.
Band averagedAverage of
double-sideband mono Center frequency
MWRP22.235 GHzN � 33
Avg 1.94 0.59 1.75 0.53 6.77 2.23Std 1.68 (1.35, 2.22) 1.50 (1.20, 1.98) 6.28 (5.05, 8.31)Int 1.91 2.85 1.83 2.54 3.37 10.59Slp 1.00 0.20 0.99 0.23 1.31 0.95Sde 1.70 (1.37, 2.26) 1.52 (1.22, 2.02) 6.34 (5.08, 8.42)
MWRP23.035 GHzN � 33
Avg 0.20 0.17 0.20 0.17 0.20 0.17Std 0.49 (0.40, 0.65) 0.49 (0.40, 0.65) 0.49 (0.40, 0.65)Int �0.09 0.91 �0.10 0.90 �0.12 0.90Slp 1.03 0.08 1.03 0.08 1.03 0.08Sde 0.50 (0.40, 0.66) 0.50 (0.40, 0.66) 0.50 (0.40, 0.66)
MWR23.8 GHzN � 32
Avg 0.11 0.13 0.11 0.13 0.10 0.13Std 0.36 (0.29, 0.48) 0.36 (0.29, 0.48) 0.36 (0.29, 0.48)Int 0.21 0.58 0.21 0.58 0.21 0.58Slp 0.99 0.05 0.99 0.05 0.99 0.05Sde 0.37 (0.29, 0.49) 0.37 (0.29, 0.49) 0.37 (0.29, 0.49)
MWRP23.835 GHzN � 33
Avg 0.02 0.13 0.02 0.13 0.02 0.13Std 0.36 (0.29, 0.48) 0.36 (0.29, 0.48) 0.36 (0.29, 0.48)Int �0.16 0.78 �0.16 0.78 �0.16 0.78Slp 1.02 0.07 1.02 0.07 1.02 0.07Sde 0.37 (0.30, 0.49) 0.37 (0.30, 0.49) 0.37 (0.30, 0.49)
MWRP26.235 GHzN � 33
Avg �0.38 0.10 �0.38 0.10 �0.38 0.10Std 0.27 (0.22, 0.36) 0.27 (0.22, 0.36) 0.27 (0.22, 0.35)Int �0.41 1.12 �0.41 1.12 �0.41 1.12Slp 1.00 0.11 1.00 0.11 1.00 0.11Sde 0.28 (0.22, 0.37) 0.28 (0.22, 0.37) 0.28 (0.22, 0.37)
MWRP30.0 GHzN � 33
Avg �0.31 0.09 �0.31 0.09 �0.31 0.09Std 0.25 (0.20, 0.33) 0.25 (0.20, 0.33) 0.25 (0.20, 0.33)Int 0.73 1.70 0.73 1.70 0.73 1.70Slp 0.91 0.15 0.91 0.15 0.91 0.15Sde 0.25 (0.20, 0.33) 0.25 (0.20, 0.33) 0.25 (0.20, 0.33)
MWR31.4 GHzN � 32
Avg �0.12 0.07 �0.12 0.07 �0.12 0.07Std 0.20 (0.16, 0.27) 0.20 (0.16, 0.27) 0.20 (0.16, 0.27)Int 0.71 1.06 0.71 1.06 0.71 1.06Slp 0.93 0.09 0.93 0.09 0.93 0.09Sde 0.20 (0.16, 0.27) 0.20 (0.16, 0.27) 0.20 (0.16, 0.27)
GSR183.31 0.55 GHzN � 33
Avg 13.71 5.41 13.77 5.42Std 15.27 (12.28, 20.19) 15.29 (12.29, 20.22)Int 107.97 18.53 108.16 18.5Slp 0.58 0.08 0.58 0.08Sde 7.28 (5.84, 9.68) 7.29 (5.84, 9.69)
GSR183.31 1.0 GHzN � 33
Avg 12.38 4.72 12.56 4.73Std 13.30 (10.70, 17.60) 13.34 (10.73, 17.65)Int 78.72 18.50 79.19 18.50Slp 0.70 0.08 0.70 0.08Sde 8.12 (6.51, 10.80) 8.13 (6.52, 10.80)
GSR183.31 3.05 GHzN � 33
Avg 13.25 4.34 13.56 4.32Std 12.23 (9.84, 16.18) 12.17 (9.79, 16.10)Int 33.94 13.74 33.54 13.80Slp 0.88 0.08 0.88 0.08Sde 10.78 (8.64, 14.33) 10.83 (8.68, 14.39)
OCTOBER 2008 M A T T I O L I E T A L . 1773

ARM Barrow site. Since many of these data had a va-riety of errors embedded within them, several of theoriginal soundings were discarded after application ofquality checks. Then, from the training set, we calcu-lated band-averaged Tbs, as described in section 4,added Gaussian noise of 0.3-K rms to all of the Tbs, andthen developed regression coefficients to estimate Tb at22.235 GHz from a linear combination of the remaining
four Tbs (23.035–30.0 GHz). We then applied these co-efficients to the band-averaged Tbs calculated fromNWS-VIZ at the MWRP four upper channels and com-pared them with the MWRP measurements at 22.235GHz. Results are shown in Fig. 8. Here the originalcalculated versus measured pairs (as in Fig. 6) and theregression-estimated versus measured pairs are shownin black open and solid triangles, respectively.
FIG. 3. Time series of data taken on 19 Mar 2004, showing Tbs at (1)–(5) five of the MWRP channels, (3), (5)(black lines) the two MWR channels, and (6)–(8) three of the GSR channels. The MWRP and MWR calculationsused the absorption model of Liljegren et al. (2005) and band-averaged Tb calculations (based on the average oflower and upper sidebands, assuming a rectangular bandpass) for both RS90 and NWS-VIZ radiosondes. The GSRcalculations were based on the bandpass functions of the manufacturer. Black triangles: Tb calculations usingNWS-VIZ radiosondes. Black circles: Tb calculations using Vaisala RS90 radiosondes.
FIG. 4. Scatterplots of differences between calculations and MWRP measurements at (a) 22.235 and (b) 23.835GHz. All statistical quantities refer to calculated � measured. Avg, std, int, and sde are in kelvins (K).
1774 J O U R N A L O F A T M O S P H E R I C A N D O C E A N I C T E C H N O L O G Y VOLUME 25
Both visually on a point-to-point basis and statisti-cally, the overestimation of stratospheric water vapor isindicated reliably.
As a final comment, to make this quality check com-pletely independent of the MWRP, one could estimate22.235-GHz Tb from the higher-frequency Tbs com-puted from the NWS-VIZ. If Tb(calculated) � Tb(esti-mated) is larger than a predetermined threshold, thenthe sounding was probably affected by an upper-atmosphere bias. The potential interest on this qualitycheck may be large since it does not require an inde-pendent instrument measurement (MWRP or GSR) tobe performed. However, this approach is probably un-able to detect cases such as A–E, described earlier(Figs. 6, 7).
5. Discussion
The measurements of the 22.235-GHz Tb were inclose agreement with calculations based on the RS90radiosondes, with an rms difference of 0.4 K. Con-versely, similar comparisons with the VIZ radiosondeswere, except for a few isolated points, significantlycolder than the calculations. Thus, the 22.235-GHzmeasurements are in excellent agreement with thetrends shown in the Mattioli et al. (2007) paper, inwhich the relative humidity measurements from theVIZ carbon hygristor (both the NWS-VIZ and theMK2-CH) show an apparent bias with respect to theother instruments above the troposphere, with an av-erage bias of the order of 16%–20%.
FIG. 5. Scatterplots of differences between calculationsand GSR measurements at (a) 183.31 0.5, (b) 183.31 1, and(c) 183.31 3.05 GHz. All statistical quantities refer to calcu-lated – measured. Avg, std, int, and sde are in kelvins (K).
FIG. 6. Scatterplot of MWRP-measured Tb at 22.235 GHz vs Tb
calculated from NWS-VIZ soundings. Clear-sky conditions. Theletters A–E indicate soundings for which measured and calcu-lated Tbs agree within 0.5 K. All statistical quantities refer tocalculated – measured. Avg, std, int, and sde are in kelvins (K).
OCTOBER 2008 M A T T I O L I E T A L . 1775

Occasionally, there were cases when Tb calculationsat 22.235 GHz agreed with the MWRP measurements,although inspection of the associated soundings indi-cated there still was a problem with the upper-atmospheric VIZ sounding. This occurred in the caseswhen the NWS-VIZ sounding underestimated the tro-pospheric water vapor. To identify these cases, we de-veloped a regression-based method, based on the fourremaining channels, to identify mistaken cases. Everyone of the cases showed a measured Tb that was larger,sometimes by as much as 6 K, than the estimated ones.
The independent measurements from the GSRsupport these findings. In fact, the GSR measure-ments showed substantial differences, as much as30–40 K, from calculations based on the VIZ duringlow humidity. In the cold Arctic winter cases, say forPWV � 2 mm, GSR millimeter-wave observations rep-resent another powerful method to identify spurioussoundings.
It is intriguing to speculate on possible uses of the22.235-GHz Tb and 183.31-GHz measurements to cor-rect radiosonde soundings in the stratosphere. If a suit-able training set of simultaneous RS90, NWS-VIZ,GSR, and MWRP observations were available, perhaps
a correction could be derived and applied to both pastand present soundings. At the ARM Barrow site, theMWRP has been operating since February 2004, andradiometers near 183.31 GHz are now operating on acontinuous basis. Unfortunately, the ARM soundings,now using the Vaisala RS92 package, are launched atdifferent times than the synoptic NWS soundings. Asuitable set of simultaneous launches could potentiallylead to a correction of the 10 yr NWS radiosondeclimate record in Barrow, which may be important forthe Arctic climate study.
The method presented here was based on forwardmodel considerations only and for clear skies. Althoughwe have not shown it here, the method could be ex-tended to cover the cloudy-sky cases by derivingequivalent clear-sky Tb from the set of cloud-contaminated Tbs.
The MWRP and GSR instruments are only availablefor a few locations and dates, but the method of com-paring calculations of near-resonant Tbs (e.g., 22.235 or183.31 GHz), with those estimated from calculated Tbsthat are only sensitive to lower-tropospheric vapor,could provide an independent quality check on strato-spheric humidity sounding.
FIG. 7. NWS-VIZ (dark graydash–dotted line) and RS90 sound-ings (black solid line for RS90launched at DPLX, and light graysolid line for RS90 launched at GW)of RH for the cases shown in Fig. 6.
1776 J O U R N A L O F A T M O S P H E R I C A N D O C E A N I C T E C H N O L O G Y VOLUME 25

Acknowledgments. The work presented in this paperwas sponsored by the Environmental Sciences Divisionof the Department of Energy under the AtmosphericRadiation Measurement Program.
REFERENCES
Ackerman, T. P., and G. M. Stokes, 2003: The Atmospheric Ra-diation Measurement Program. Phys. Today, 56, 38–45.
Cadeddu, M. P., J. C. Liljegren, and A. L. Pazmany, 2007: Mea-surements and retrievals from a new 183-GHz water-vaporradiometer in the Arctic. IEEE Trans. Geosci. Remote Sens.,45, 2207–2215.
Cimini, D., E. R. Westwater, A. J. Gasiewski, M. Klein, V. Leuski,and S. Dowlatshahi, 2007a: The Ground-Based ScanningRadiometer (GSR): A powerful tool for the study of theArctic atmosphere. IEEE Trans. Geosci. Remote Sens., 45,2759–2777.
——, ——, ——, ——, ——, and J. C. Liljegren, 2007b: Ground-based millimeter- and submillimeter-wave observations oflow vapor and liquid water contents. IEEE Trans. Geosci.Remote Sens., 45, 2169–2180.
Clough, S. A., M. W. Shepard, E. J. Mlawer, J. S. Delamere, M. J.Iacono, K. Cady-Pereira, S.-A. Boukabara, and P. D. Brown,
2005: Atmospheric radiative transfer modeling: A summaryof the AER codes. J. Quant. Spectrosc. Radiat. Transfer, 91,233–244.
Deuber, B., N. Kämpfer, and D. G. Feist, 2004: A new 22-GHzradiometer for middle atmosphere water vapor profile mea-surements. IEEE Trans. Geosci. Remote Sens., 42, 974–984.
Ferrare, R. A., and Coauthors, 2004: Characterization of upper-troposphere water vapor measurements during AFWEX us-ing LASE. J. Atmos. Oceanic Technol., 21, 1790–1808.
Liljegren, J. C., S.-A. Boukabara, K. Cady-Pereira, and S. A.Clough, 2005: The effect of the half-width of the 22-GHzwater vapor line on retrievals of temperature and water va-por profiles with a twelve-channel microwave radiometer.IEEE Trans. Geosci. Remote Sens., 43, 1102–1108.
Mattioli, V., E. R. Westwater, D. Cimini, J. S. Liljegren, B. M.Lesht, S. I. Gutman, and F. J. Schmidlin, 2007: Analysis ofradiosonde and ground-based remotely sensed PWV datafrom the 2004 north slope of Alaska Arctic Winter Radio-metric Experiment. J. Atmos. Oceanic Technol., 24, 415–431.
Miloshevich, L. M., H. Vömel, D. N. Whiteman, B. M. Lesht, F. J.Schmidlin, and F. Russo, 2006: Absolute accuracy of watervapor measurements from six operational radiosondetypes launched during AWEX-G and implications for AIRSvalidation. J. Geophys. Res., 111, D09S10, doi:10.1029/2005JD006083.
Racette, P. E., R. F. Adler, A. J. Gasiewski, D. M. Jackson, J. R.Wang, and D. S. Zacharias, 1996: An airborne millimeter-wave imaging radiometer for cloud, precipitation, and watervapor studies. J. Atmos. Oceanic. Technol., 13, 610–619.
——, and Coauthors, 2005: Measurement of low amounts of pre-cipitable water vapor using ground-based millimeterwave ra-diometry. J. Atmos. Oceanic Technol., 22, 317–337.
Revercomb, H. E., and Coauthors, 2003: The ARM program’swater vapor intensive observation periods: Overview, initialaccomplishments, and future challenges. Bull. Amer. Meteor.Soc., 84, 217–236.
Wang, J., D. J. Carlson, D. B. Parsons, T. F. Hock, D. Lauritsen,H. L. Cole, K. Beierle, and E. Chamberlain, 2003: Perfor-mance of operational radiosonde humidity sensors in directcomparison with a chilled mirror dew-point hygrometer andits climate implication. Geophys. Res. Lett., 30, 1860,doi:10.1029/2003GL016985.
Wang, J. R., S. H. Melfi, P. E. Racette, D. N. Whitemen, L. A.Chang, R. A. Ferrare, K. D. Evans, and F. J. Schmidlin, 1995:Simultaneous measurements of atmospheric water vaporwith MIR, Raman lidar, and rawinsondes. J. Appl. Meteor.,34, 1595–1607.
Westwater, E. R., 1993: Ground-based microwave remote sensingof meteorological variables. Atmospheric Remote Sensing byMicrowave Radiometry, M. A. Janssen, Ed., John Wiley &Sons, 145–213.
——, B. Stankov, D. Cimini, Y. Han, J. A. Shaw, B. M. Lescht,and C. N. Long, 2003: Radiosonde humidity soundings andmicrowave radiometers during Naura99. J. Atmos. OceanicTechnol., 20, 953–971.
FIG. 8. Scatterplot of calculated and estimated Tbs at 22.235GHz from the VIZ soundings (y axis) vs Tbs at 22.235 GHz mea-sured by the MWRP. The comparison of the MWRP-measuredTbs at 22.235 GHz with the original Tb calculations from the VIZsondes as in Fig. 6 are shown with white triangles. The comparisonof the MWRP-measured Tbs at 22.235 GHz with the Tbs at 22.235GHz estimated from the NWS- VIZ simulations at the upper-fourchannels of the MWRP are shown with black triangles. All sta-tistical quantities refer to calculated – measured. Avg, std, int, andsde are in kelvins (K).
OCTOBER 2008 M A T T I O L I E T A L . 1777