microstructure of magnetic reconnection in earth's … · journal of geophysical research,...
TRANSCRIPT

JOURNAL OF GEOPHYSICAL RESEARCH, VOL. 89, NO. A8, PAGES 6705-6716, AUGUST 1, 1984
Microstructure of Magnetic Reconnection in Earth's Magnetotail
J. W. BIEBER 1 AND E. C. STONE
California Institute of Technology, Pasadena
E. W. HONES, JR., D. N. BAKER, AND S. J. BAME
Los Alamos National Laboratory, New Mexico
R. P. LEPPING
Laboratory for Extraterrestrial Physics, NASA Goddard Space Flight Center Greenbelt, Maryland
A recent study of magnetic reconnectiori in the earth's magnetotail identified five events in which a pulse of heated electrons appeared near the end of an interval of fast tailward plasma flow. Further investigation of these events has revealed the following information on their microstructure' (1) Measure- ments of the electron Velocity distribution show that the temperature rise can be characterized as a true heating process, in that the gross evolution of the distribution is from a narrower to a. broader Maxwel- lian. (2) During the heating pulse a bump is often apparent in the tail of the electron distributiøn function at an energy of 2-5 keV. This bump could be the remnant of a beam produced by a 2- to 5-kV parallel potential drop. Thus a possible mechanism for the heating of electrons is the beam plasma instability. (3) The magnetic field during these events is highly variable in all three components. Part of this variability may result from magnetic turbulence generated by the tearing mode instability, but minimum variance analysis suggests that some of the more rapid variations (up to 20 nT/s) are caused by rotational or tangential discontinuities. (4) Both the Y and Z components of the magnetic field are quite large (10-20 nT) at times. The strongest southward fields are usually observed near the beginning of the heating pulse, while the strongest Y components generally occur during the pre-heating interval of tailward plasma flow. Transient large-scale changes in the normal magnetotail current system are indicated by these observations.
1. INTRODUCTION
It has been proposed, in part to explain the transient nature of substorms, that reconnection in the magnetotail is not a steady process but rather Occurs impulsively when a magnetic X-line forms in the plasma sheet some 15 or 20 R e tailward of the earth [Russell and McPherron, 1973; Hones, 1977]. Ac- cording to this model the reconnection process converts mag- netic en6rgy stored in the magnetotail into particle kinetic energy, and this provides the energy source for a variety of substorm-related phenomena, including intensification of the auroral electrojet. Although controversy persists, particularly with regard to reconnection as the energy source of substorms [e.g., Akasofu, 1981], there now exists a large body of evidence in favor of the basic validity of this phenomenological model [e.g., Russell and McPherron, 1973; Hones et al., 1976; Hones, 1977, •979; Baker et al., 1979, 1981; Hones and Schindler, 1979; Bieber and Stone, 1980; Nishida et al., 1981; Bieber et al., 1982].
Most of the evidence cited above in favor of substorm-
associated magnetic reconnection consists Of reported associ- ations between substorms, as evidenced in ground-based mag- netic and/Or auroral records, and characteristic signatures of
,,
• Now at Bartol Research Foundation of The Franklin Institute, University of Delaware, Newark.
Copyright 1984 by the American Geophysical Union.
Paper number 4A0486. 0148-0227/84/004A-0486505.00
reconnection observed in the magnetotail. For a spacecraft located near the neutral sheet tailward of l•he reconnecfion region, these reconnection signatures are (1) tailward plasma flow accompanied by (2) southward magnetic fields. If recon- nection proceeds till the last closed field line reconnects, the tailward portion of the plasma sheet (the plasmoid) will be ejected into the solar wind, and the spacecraft will subsequent- lY observe (3) a dropout of the plasma density and (4) stream- ing energetic electrons as the plasmoid sweeps past and the spacecraft moves onto the open field lines of the magnetotail lobe (see Hones [1977] for details).
One recent statistical study used streaming energetic elec- trons as a marker of possible reconnection events and demon- strated that these streaming events occurred in association with the other reconnection signatures mentioned above and were also associated with substorms as evidenced by the AE index [Bieber and Stone, 1980, hereafter referred to as paper 1; Bieber et al., 1982, hereafter referred to as•paper 2]. A further result of this study was that in 5 of 16 events considered in paper 2, a brief surge in the temperature of plasma electrons occurred shortly before the onset of energetic electron stream- ing. These heated-electron events were invariably observed near the neutral sheet in association with very fast tailward plasma flows (500-1000 km/s) and strong southward magnetic fields (Bz '-, -- 5 to -- 20 nT).
The present paper presents further information on heated- electron reconnection events. Although macroscopic reconnec- tion signatures will be covered in some detail initially, the emphasis here will be on the microstructure of these events as
6705

6706 BIEBER ET AL..' MICROSTRUCTURE OF MAGNETIC RECONNECTION
revealed in high time resolution measurements of the magnetic field and the plasma electron distribution function.
It is possible that heated-electron events constitute a dis- tinct type of reconnection event, since the heating was ob- served in only ,,- 30% of events studied (paper 2). However, an alternate explanation would be that the heating occurs in most reconnection events but is temporally and/or spatially localized, so that the heated electrons are not always observed. In the case of the magnetic field the behavior described here is characteristically observed during heated-electron events, but it is not unique to these events. Most of the reconnection events studied in paper 2 exhibit similar magnetic field behav- ior, regardless of whether or not heated electrons were ob- served.
Following a brief description of the available data in the next section, an overview of the heated-electron events is pre- sented in section 3. Sections 4 and 5 consider in detail the
behavior of the plasma electrons and the magnetic field and present some possible interpretations of the data. The sum- mary appears in section 6.
2. THE DATA SET
All magnetotail data for this analysis were obtained by IMP 8 at XaSM coordinates between -32 and -34 R•. Heating events were observed within 1.2 R• of the nominal [Fairfield, 1980] neutral sheet in the YaSM range -- 1 to + 8 R•.
Magnetic field vectors at 0.32-s intervals were obtained by the Goddard Space Flight Center magnetometer. This tempo- ral resolution represents a 48-fold increase over the 15.36-s vectors utilized in papers 1 and 2.
Plasma data were obtained by the Los Alamos National Laboratory plasma analyzer. Protons are measured at 16 energy levels between 84 eV and 15 keV, and electrons at 16 levels between 5.7 eV and 14 keV. The spacecraft spins with 2.6-s period about an axis nearly perpendicular to the ecliptic plane. Over the course of five spins, each energy level is mea- sured at 16 values of azimuth separated by 22.5 ø . The wide detector fan (-56 ø to + 56 ø in elevation angle) effectively inte- grates over the elevation dependence of incoming plasma par- ticles. A full 16 x 16 energy-azimuth array requires about 13 s to measure, and successive measurements of a given species are centered 26 s apart, as the analyzer alternates between proton and electron measurements.
As will be shown later, the time scale for variation of the magnetic field and electron distribution function is sometimes shorter than the 13 s required to measure a complete 16 x 16 energy-azimuth array. Fortunately, the count level for elec- trons is frequently high enough that the distribution function in a specific azimuthal range may be determined from a single energy scan, which requires only ,-,0.5 s. Usually, significant counts appear at only ,-,8 of the 16 energy levels, so the effective accumulation time is actually ,-,0.25 s. During this time the look direction of the detector changes by only ,-, 35 ø. Since magnetic field vectors are obtained at 0.32-s intervals, these single-scan distribution functions can be accurately re- lated to the instantaneous magnetic field direction.
The magnetic field and plasma data described above are of primary interest here, but two additional data sets also play a role. Measurements of > 200-keV electrons were obtained by the Caltech electron/isotope spectrometer. Streaming energetic electrons provided the original event markers (see paper 1), and for completeness these observations are presented here. Each energetic particle sample requires 18 s to accumulate, and successive samples are centered 82 s apart.
Finally, ground-based magnetograms are available from a variety of auroral zone stations. These are used to demon- strate the close association of heated-electron reconnection
events with substorms.
3. OVERVIEW OF HEATED-ELECTRON EVENTS
It is the purpose of this section to present fairly detailed information on the macroscopic behavior of plasma, magnetic fields, and energetic particles during heated-electron events. The goal is to demonstrate that these events are indeed recon- nection related, and to show, using ground-based mag- netograms, that the events are closely associated with sub- storms. The magnetotail data are presented in Figure 1, and the relevant magnetogram traces appear in Figure 2. Event 4 (Figure ld) has been previously studied by Frank et al. [1976•, Gurnett et al. [1976•, and Hones [1977•.
3.1. Detailed Behavior of Plasma and Ma•lnetic Field
The top panel of Figures la-le shows the plasma density, as calculated from the electron data. Owing to their greater speed, electrons have a higher count rate than protons, and thus a more accurate calculation of the density is possible.
The next panel shows the plasma flow velocity, as calcu- lated from both the ion data (arrow-tipped vectors) and the electron data (untipped vectors). Each event exhibits an inter- val of strong tailward flow lasting 5 rain or more, an observa- tion consistent with the spacecraft being located tailward of a reconnection line at these times.
The ion flow velocities appearing in Figure 1 were calcu- lated under the assumption that the positive ions are prot6ns. In view of the recent finding that the plasma sheet ion compo- sition is at times dominated by singly charged oxygen [Peter- son et al., 1981], it is necessary to consider whether this as- sumption is justifiable. One means of checking this is to com- pare the flow speeds calculated from the ion data under the assumption of protonic composition with the flow speeds cal- culated from the electron data. In Figure 1 the electron and proton flow velocities appear to be generally consistent with one another. As an additional test of this apparent agreement, time-averaged values of both the electron and the proton flow velocities were calculated for an interval beginning with the onset of strong tailward flow and ending with the onset of electron heating. In all cases the two velocities agreed to within 20%, which is within the margin of error associated with the average values. This indicates that the flow vectors shown in Figure 1 are not seriously affected by a possible O + contribution at these times.
The third panel in Figures la-le shows the electron temper- ature. Note that the vertical scale is not the same in all figures. This quantity was calculated by taking 2/3 of the mean elec- tron energy, as would be appropriate for an isotropic Maxwel- lian. Since a bulk flow velocity of 1000 km/s contributes only ,-, 3 eV to the energy of an electron, the plotted quantities do represent primarily thermal motions.
A pulse of heated electrons is evident in each of the events shown in Figure 1. It occurs near the end of the tailward flow interval, shortly before onset of energetic electron streaming (see bottom panel). In most cases there is a smooth rise to a peak, requiring 1-2 rain, which is terminated by a dropout of the plasma (e.g., events 1, 2, and 5) and/or by a smooth fall from the peak (e.g., events 4 and 5). Event 3 is somewhat anomalous in that two samples at elevated temperatures are separated by a sample at the pre-heating temperature level. In

BIEBER ET AL.: MICROSTRUCTURE OF MAGNETIC RECONNECTION 6707
(a) Event I
ß ßßß n
(cm_•)
2000.
ß -'1 Sunward 1 • (km/s) .............
/ .... I'' I .... I
1ø0i' ß kTe 0.5 ' (keY) ß
eeee eee ee eeeeeeeeeeeeeeeee eeeß ß
0 I .... I .... I
, .
> aO0 keV Electrons Sunwerd
15:•0 15:30 15:40
Universel Time
FiB. la. Plasma and masn•tic fidd parameters for a h•ated- electron event obscrvcd on Novcmbcr 14, 1973. From top to bottom ar• shown d•nsity n, bulk flow vdocity v•ctor •, •l•ctron tcmp•ratur• k• (k is Boltzmann's constant), cl•vation of magnetic fidd • (GSM coordinates), and angular distributions of > 2•-k•V electrons. Den- sity m•asur•m•nts ar• 13-S• averages c•nt•r•d 26 s apart. Points lying on th• lower horizontal axis indicat• d•nsiti•s of 0.01 •-3 or l•ss.
Bulk flow vdociti•s, shown for both proton (arrow-tipped v•ctors) and •l•ctron (untipp•d v•ctors) m•asur•m•nts, are 13-s averages •n- t•r•d 13 s apart. Flow v•ctors are plotted provided the rdative error is l•ss than 1•% or th• absolut• •rror is l•ss than 2• km/s. Electron t•mp•ratur• m•asur•m•nts ar• 13-s averages c•nt•r•d 26 s apart. Magnetic fidd •l•vation is d•v•d from 0.32-s v•ctor samples. Th• > 2•-k•V electron data ar• 18-s av•ras•s c•nt•red 82 s apa•. An•u- lar distributions of > 2•-k•V d•ctrons ar• normalized accordin• to p•ak s•ctor, and th• error bar du• to counting statistics is indicated on th• peak sector of each distribution. (Th•s• dist•butions wer• chosen to illustrat• th• transition to int•ns• tailward streaming. For most events, •n•rgetic d•ctrons Wcr• also present b•fore the first angular distribution shown but w•r• not significantly streaming.)
(b) Event 2
n 1'0 1 (cm-3) o.I .......... " eeeeeeeeeee ee e eeeeeee eeeeee 0.01 , ' ' I .... I ' •"• ' I ':'
2000_• v -1 •.nwordl' .... (kin/s) 0 -'- .- - r' 'I•' ,,•r I1'1 /
,,
.... I .... I ' ' ' I ' ' '
:3.0'
(keV) I. . ...................... .. . .......... I ' ' ' I .... I ' '
øi , , i', ! , , , , I ........
>,oo,e ,ec,on, Sunword
' ' ' ' I ' ' ] ........ 17:55 18;05 18:15
Universel Time
Fig. lb. Plasma and magnetic field parameters for a heated- electron c•ent observed on November 14, 1973. Scc legend of Figure
for explanation of to,at.
(c) Event 3 1.0
n 1 (cm-3) O.I "" ......... ß ......... ' ........ .'.'..-. ....
2000
V t Sunwørd t (km/s) 0 "\'1•1"'"- "/ "•,,'/e ,,• •[ / .... I ' ' ' ' I .... I ....
2.0
(keV) I. ß eeeeeeeeeeeeeeeeeeeeeeeeeeeeeeee ß eeeee ß ß
+ 9 o o lJ 0_. øø,l• - -•'l,'-- -
>200 key t Electrons Sunword
' ' ' ' I ' ' ' ' ...... I 19:50 20:00 20:10
Universol Time
Fig. 1½. Plasma and magnetic field parameters for a heated- electron event observed on November 14, 197.3. See legend of Figure la for explanation of format.
each of the events a decrease in the plasma density (prior to the final dropout, if one occurs) is associated with the heating pulse.
Except for event 1, proton flow vectors do not appear during the actual heating pulse. This is because the density decrease just mentioned reduces the accuracy of the flow ve- locity calculation below the threshold required for plotting in the figures. However, owing to the higher count rate of elec- trons, it was possible to calculate flow vectors from the elec- tron data during the heating pulse. These data indicate that the average flow velocity during the pulse lies in the range 900-1600 km/s, which represents an increase over the pre- heating flow velocity by a factor of 2-3. In the case of event 1
(d) Event 4 1.0
•ee eeeeeeeeeeeeeeeeee eeeee n 0.1 øß (cm-•
2000
V -:l ' Sunword t ß .,•['.,,,If,,_ ..... /
2.0
(ke.v) •. . eee eeeeeeeeeeeeeeeeeee ß eeeeeeeee ß
+90ø• •• .... •i• -90ø1 .... I .... I .... I ....
>200key •,•• ,• Electrons 1' ,S,un,wo, rd,,,' '•1- '•' l' I•' ' ' '
10:35 10:45 10:55
Universel Time
Fig. ld. Plasma and magnetic field parameters for a heated- electron event observed on April 18, 1974. See legend of Figure la for explanation of format.

6708 BIEBER ET AL.' MICROSTRUCTURE OF MAGNETIC RECONNECT!ON
(e) Event 5 1.0
(crff3) 0.• ''" '"'"" .........
2000.
v -:] Sun•o•d t
3.0
kTe t ' (kV) .. ........ , , ;,, .... +90ø_j . :
' ! [ I '! i ,
> 200 key I Elegtrønsl' ,Su!w,or•, , ,•1•, ' I ' '
16:30 16:40 16:50
Universol Time
Fig. le. Plasma and magnetic field parameters for a heated- electron event observed on April 30, 1974. See legend of Figure l a for explanation of format.
this increase is supported by the ion data, which indicate a tailward flow velocity of ~ 800 km/s during the heating pulse, as compared with an average value of 360 km/s during the pre-heating interval. Thus although a definitive conclusion would require accurate ion flow measurements during the .heating pulse, the available data suggest that concurrent with electron heating, the plasma bulk flow velocity increases sub- stantially.
It would bc of interest to know whether the proton temper- ature increases at the same time the electron temperature does. Unfortunately, the present data set is inconclusive as regards this question, because the bulk motion of the plasma shifts the center of the proton distribution function into an energy range where the energy resolution of the plasma ana- lyzer is too coarse to determine 13-s temperature values.
The fourth panel in Figures la-le shows the elevation angle of the magnetic field (GSM coordinates). Detailed information on all components of the field will be presented later. Al- though the magnetic field behavior seems rather chaotic during these events, there is a predominance of southward field. Note that the greatest incidence of steep southward fields usually occurs near the end of the tailward plasma flow inter- val. This observation is consistent with the plasmoid model, which predicts that the steepest southward fields occur in the trailing edge of the tailward retreating p!asmoid [Hones, 1977].
The fifth panel in Figures la-le shows polar plots of the angular distribution of > 200-kcV electrons at selected times. (For event 5, only three distributions appear because counting statistics did not permit accurate determination of the angular distribution for intervening samples.) The transition from trapped distributions to streaming distributions is evident in each case. As mentioned earlier, the five events under con- sideration here were part of the superposed epoch analysis of energetic electron streaming events performed in papers 1 and 2. For events 1, 2, 3, and 5 the earliest pronounced streaming distribution appearing in Figure 1 defined the zero epoch time
for that event. In the case of event 4 the distribution at
1049:17 UT is evidently streaming, but the value of anisotropy calculated for it did not quite meet the stringent criterion imposed in paper 1. However, a later distribution (not shown) at 1102:56 UT did meet the criterion. Thus event 4 was in-
cluded in the analysis of papers 1 and 2 with a zero epoch time of 1102:56 UT. The present paper focuses on the slightly earlier interval owing to the presence of heated electrons at this time.
The transition from trapped to streaming angular distri- butions is indicative of a transition from closed magnetic field lines--i.e., field lines which either are connected to the earth at both ends or which form a looplike structure in the plasmoid--to open magnetic field lines--i.e., field lines for which one or both ends connect to the solar wind [see Baker and Stone, 1976; Hones, 1977]. In three cases (events 1, 2, and 5) this transition is closely associated with the plasma drop- out, suggesting that the spacecraft entered the magnetotail lobe. In the remaining cases a p!asma dropout was not im- mediately observed. This may indicate that the spacecraft was in a thin, residual plasma sheet which persists on open field
(o)
14 16 18 20 22
Universal T•me
b) ! ii
IO 12
Universal T •me
(c) i iii i
16 18
Universal Time
Fig. 2. (a) Cape Chc!yuskin (top) and Dixon (bottom) mag- netograms for an 8-hour interval on November 14, 1973, which in- cludes events 1, 2, and 3. (b) College magnetogram for a 3-hour inter- val on April 18, 1974, which includes event 4. (c) Tixic Bay (top) and Cape Chclyuskin (bottom) magnetograms for a 3-hour interval on April 30, 1974, which includes event 5. The magnetogram traces arc the H component of the magnetic field. The arrow to the right of each trace indicates the magnitude and direction of a 200-nT negative perturbation. Shading in the bar above each graph indicates time periods when tailward plasma flow in excess of 400 kra/s (as deter- mined from proton measurements) was observed at IMP 8. Arrows above the bar indicate the times of the electron heating pulses.

BIEBER ET AL.'. MICROSTRUCTURE OF MAGNETIC RECONNECTION 6709
lines after ejection of the plasmoid, as suggested by Hones [1977].
3.2. Auroral Zone Magnetograms
Figure 2 shows the H component of selected auroral zone magnetograms for the time periods under consideration here. The time of the heating pulse and intervals when strong tail- ward plasma flow was observed at IMP 8 are indicated. It is clear that each heating event occurred in close association with a substorm onset or intensification, although the details of this association are difficult to see on the fairly coarse time scale of Figure 2. Careful examination of the original, large- scale magnetograms indicates that the earliest onset evident on earth definitely occurs before the heating pulse and seems to be more closely associated with onset of fast tailward plasma flow at IMP 8. (However, specification of the onset time of fast tailward flow is ambiguous for some events. See below.) If a substorm is initiated by processes occurring in the plasma sheet -,-15 R• tailward of earth, then it might be ex- pected that substorm-related disturbances would arrive about the same time at earth and at IMP 8, located 30 R• tailward.
3.3. Time-Averaged Behavior of Plasma and Magnetic Field
The time-averaged behavior of plasma and magnetic field during the pre-heating phase of the five reconnection events is summarized in Table 1. The start time of the averaging inter- val was chosen to coincide with the onset of fast tailward
plasma flow. Specification of this onset time is somewhat am- biguous for events 3 and 5, because two intervals of fast flow, separated by periods of relative quiescence, occurred in suc- cession. (The quiescent intervals are evident in the magnetic field panels of Figures lc and le as well as in the flow velocity panels.) In such cases it was not clear whether these intervals should be treated separately, with separate onsets, or whether only the earliest onset of the succession should be used. For the purposes of this paper, onset of fast tailward flow was taken to correspond to the beginning of the last interval prior to the heating pulse, such that the fast flow continued uninter- rupted up to the time of electron heating. It was also required that the fast flow be evident in both the proton and the elec- tron data. In each event the end time of the averaging interval was fixed 13 s before the first observation of enhanced electron
temperature. Start and end times thus determined are listed in Table 1, along with the spacecraft position XGSM, YGSM, and dZ, where dZ is distance from the nominal [Fairfield, 1980] neutral sheet.
Plasma parameters shown in Table 1 include average den- sity (n), average components of bulk flow (Vx) and (GSE coordinates) as determined from the ion data, average electron temperature (kTe), and average proton temperature (kT•). The latter quantity is somewhat uncertain owing to the possible contribution of heavy ions to the plasma sheet com- position. As mentioned previously, the bulk flow velocities calculated from the electron data (not shown) agree fairly well with the bulk flow velocities calculated from the ion data.
Thus the uncertainties of the flow averages are -,-20% of the total speed.
Magnetic field parameters shown in Table 1 are averages of the three components (Bx), (Br), and (Bz) (GSM coordi- nates), root-mean-square field magnitude Brms, and total stan- dard deviation of the field as. The total standard deviation, defined by
= (B -
TABLE 1. Pre-Heating Plasma and Magnetic Field Averages
Event
1 2 3 4 5
Year 1973 1973 1973 1974 1974
Date Nov. 14 Nov. 14 Nov. 14 April 18 April 30 Time, UT
Start 1530:12 1800:31 2000:39 1041:10 1642:13 End 1534:41 1805:26 2004:13 1046:53 1646:09
X•SM, R e -- 32.3 -- 33.0 -- 33.5 -- 34.0 -- 32.1 YGSM, Re + 4.0 + 2.8 + 2.0 --0.6 + 7.9 dZ, R e -0.7 - 1.1 - 1.2 0.0 -0.5
(n), ½m -3 0.51 0.17 0.15 0.53 0.21 (Vx), km/s -360 -430 -390 -510 -540 (Vr), km/s + 100 +8 +64 + 140 +290 (k T•), keV 0.21 0.83 0.73 0.57 0.52 (kTv), keV 2.4 4.1 3.0 3.6 3.5 (Bx), nT -3.1 -5.8 -7.1 +7.0 -5.2 (Br), nT +4.1 + 5.1 +0.6 - 15.3 + 3.7 (Bz), nT -0.9 -0.6 -2.1 - 1.8 -2.0 B .... nT 7.4 10.2 8.7 19.3 9.8 o•, nT 5.2 6.7 4.4 9.3 7.2
VA, km/s 230 540 490 580 470 Mach number 1.6 0.8 0.8 0.9 1.1
was shared approximately equally among the three compo- nents. (The most pronounced imbalance occurred in event 4, where the standard deviation of Br was 7.5 nT, as compared with 3.8 nT for Bx and 3.9 nT for Bz.) Further discussion of magnetic field behavior is deferred to section 5 of this paper.
Finally, at the bottom of Table 1 are shown the Alfv6n velocity VA (as calculated from (n) and Brms) and the absolute value of the ratio of (Vx) to VA (Alfv6n Mach number of tailward flow). The Alfv6n velocity was calculated under the assumption that the plasma sheet ions are protons. Since even a small contribution of O + would substantially increase the mass density of the plasma sheet, the calculated Va must be regarded with some caution.
Assuming that the calculated Va is not grossly in error, the bottom line of Table 1 shows that the time-averaged tailward flows are generally quite close to the local Alfv6n velocity. MHD reconnection theory predicts that the plasma ejected tailward from the neutral line will flow at the Alfv6n velocity as measured in the plasma flowing into the reconnection region from above and below [Vasyliunas, 1975]. Unfortu- nately, this prediction cannot be tested here, since measure- ments in the inflow region are lacking. Nevertheless, the obser- vation that time-averaged plasma flows during the pre-heating interval are close to the local Alfv6n velocity is interesting in itself and provides an observational constraint that realistic models of reconnection in the earth's magnetotail must satisfy.
To summarize this overview section, plasma, magnetic field, and energetic particle data have been presented for five events to show that in close association with substorm magnetic ac- tivity in ground-based magnetograms, the following sequence of events is observed in the magnetotail: There is an onset of strong tailward plasma flow accompanied by a progressively greater incidence of steep southward magnetic field. After -,, 5 mina pulse of heated plasma electrons is observed, and this is closely followed by the observation of tailward streaming en- ergetic electrons and, in three of five cases, a dropout of plasma density. Except for the electron heating, this is the same sequence of events that was demonstrated statistically in papers 1 and 2 for a larger set of events, and it is exactly the

6710 BIEBER ET AL.' MICROSTRUCTURE OF MAGNETIC RECONNECTION
sequence predicted by the phenomenological substorm model of Russell and McPherron [1973] as elaborated by Hones [1977].
The remainder of this paper is devoted to an examination of the microstructure of heated-electron events. In the course of this examination a number of phenomena will become appar- ent which are not encompassed by existing models of substorm-associated magnetic reconnection. In view of this it is important to remember that in this section the basic success of present reconnection models at explaining the mac- rostructure of these events has been demonstrated.
4. EVOLUTION OF ELECTRON DISTRIBUTION FUNCTION
This section examines the characteristics and evolution of
the electron distribution function during heating events. It will be shown that, to first order, the heating reflects primarily a transition from a narrower to a broader Maxwellian. Thus the
term "heating," as applied to these events, is used in its more restrictive sense; i.e., it implies not merely an energization of the plasma electrons but an energization that affects the main body of plasma electrons and that begins and ends with a near-Maxwellian. This has not yet been demonstrated, as the temperatures plotted in Figure 1 were calculated from the
TABLE 2. Plasma Parameters for Figure 3
n, ½m -3 kTe, keV nkTe, keV cm -3
Event 1
Pre-heating 0.51 0.20 0.10 Peak heating 0.11 0.87 0.10
Event 2
Pre-heating 0.11 0.74 0.08 Peak heating 0.06 2.02 0.13
Event 3
Pre-heating 0.14 0.67 0.09 Peak heating 0.05 1.27 0.07
Event 4
Pre-heating 0.28 0.69 0.19 Peak heating 0.10 1.66 0.16
Event 5
Pre-heating 0.19 0.58 0.11 Peak heating 0.06 2.03 0.13
mean electron energy and do not provide detailed information on the shape of the distribution. At high time resolution the distribution function does, however, exhibit some interesting non-Maxwellian features. These will be examined after it is
demonstrated that the gross evolution of the distribution func- tion can be characterized as a true heating process.
J
10-•6•.
iO-m-
io-aO_
E (keY) 12 5 I0 15
._ i I , ,I,,,,I,,,ll
Event I
I I
E (keY) 12 5 I0 15
I
, I I ,, I .... ll•,l
• 10_16• Event 3 J (,o iO_l 8 'E
1 _ ,
i i I I I I ! i
J I I ,, I,•!•,,•1
Event
20 40 60
V (10:5 km/s) 8O
u:) 10-•8• 'E --., o Before Heoting
10-201 • I• ' Pe(•k of He(•ting I I I I
0 20 40 60 80
V (10 3 km/s) Fi•. 3. The electron velocity dist•bution observed immediately
pMor to heating (open circles) is compared with the electron vclo•ty distribution observed at the peak of heating (closed circles). These distributions have been averaged over azimuth and over 13 s of time. Error bars due to counting statistics are generally less than the size of the points. The curves are fitted Maxwcllians. Temperature and den- sity corresponding to these fits appear in Table 2.
4.1. Electron Heating
Figure 3 compares, for each of the five events, the electron velocity distribution obtained for the sample immediately before heating with the distribution obtained at the peak of the heating pulse. These distributions were derived from the full 13-s energy-azimuth arrays by averaging counts over azi- muth. Any effects due to temperature anisotropy or to tempo- ral variation with time scales of < 13 s are thus suppressed in this representation. To each distribution a Maxwellian has been fitted by the method of least squares. The density, tem- perature, and pressure corresponding to the fitted Maxwel- lians are listed in Table 2.
It is evident that the distributions in Figure 3 are fairly well fitted by Maxwellians, although statistically significant devi- ations do occur. The important point is that the energization process does affect the full distribution function. Data points are lowered at the low-energy end of the distribution and raised at the high-energy end, as is characteristic of a true heating process. This would remain true even if the two distri- butions in each plot were normalized to the same density.
During the heating pulse the electron temperature increases by a factor of ~ 2-4, resulting in a net change of 0.6-1.4 keV, as shown in Table 2. At the same time the density decreases by a similar factor, resulting in roughly equal electron pressure nkT e before and after heating. The net pressure change was generally ~25% or less. (Event 2 is an exception, with 50% pressure change.) It thus appears that the heating results in expulsion of plasma particles from the heating region in order to maintain approximate pressure balance.
Although Figure 3 demonstrates that the gross (averaged over azimuth and over 13 s of time) evolution of the distri- bution function can be described as a heating process, hints of the non-Maxwellian features alluded to above can also be
seen. The peak-heating distributions for events 2 and 5 show a flattening around 2 keV, suggestive of a bump in the tail of the distribution. These non-Maxwellian features become much
more apparent in the single-energy-scan distributions de- scribed previously, and these will now be examined.
BIEBER ET AL..' MICROSTRUCTURE OF MAGNETIC RECONNECTION 6711
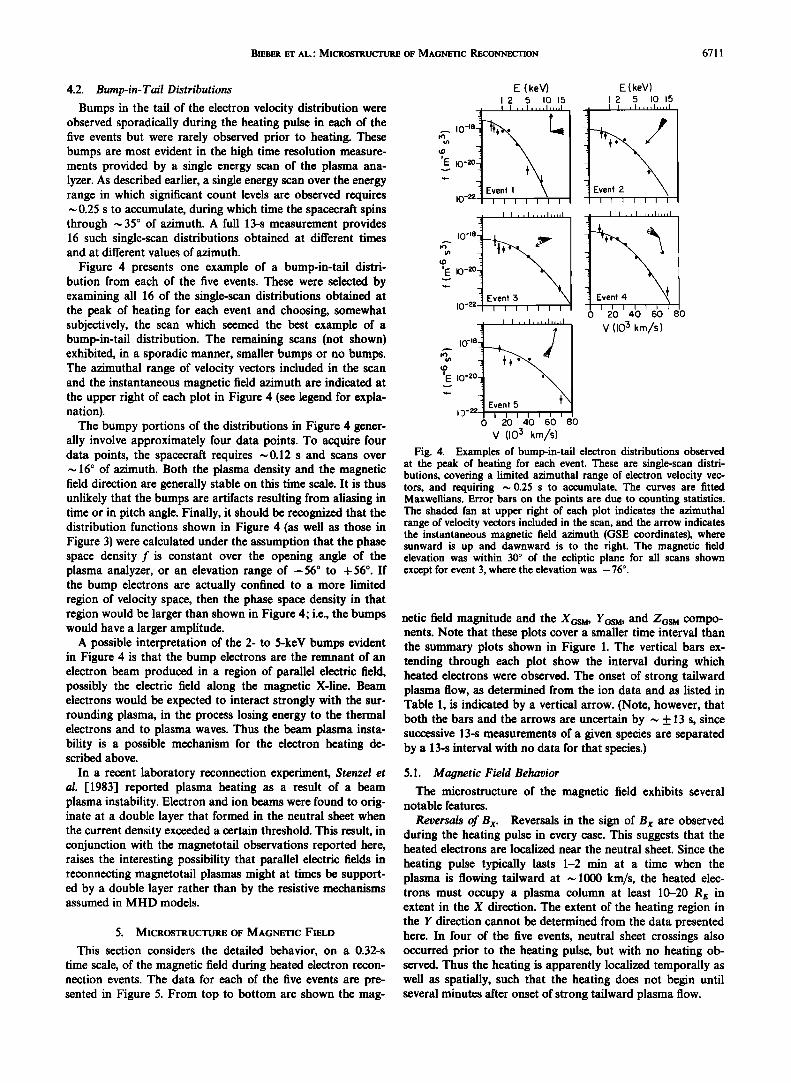
4.2. Bump-in- Tail Distributions
Bumps in the tail of the electron velocity distribution were observed sporadically during the heating pulse in each of the five events but were rarely observed prior to heating. These bumps are most evident in the high time resolution measure- ments provided by a single energy scan of the plasma ana- lyzer. As described earlier, a single energy scan over the energy range in which significant count levels are observed requires ~0.25 s to accumulate, during which time the spacecraft spins through ~35 ø of azimuth. A full 13-s measurement provides 16 such single-scan distributions obtained at different times and at different values of azimuth.
Figure 4 presents one example of a bump-in-tail distri- bution from each of the five events. These were selected by examining all 16 of the single-scan distributions obtained at the peak of heating for each event and choosing, somewhat subjectively, the scan which seemed the best example of a bump-in-tail distribution. The remaining scans (not shown) exhibited, in a sporadic manner, smaller bumps or no bumps. The azimuthal range of velocity vectors included in the scan and the instantaneous magnetic field azimuth are indicated at the upper right of each plot in Figure 4 (see legend for expla- nation).
The bumpy portions of the distributions in Figure 4 gener- ally involve approximately four data points. To acquire four data points, the spacecraft requires ~0.12 s and scans over ~ 16 ø of azimuth. Both the plasma density and the magnetic field direction are generally stable on this time scale. It is thus unlikely that the bumps are artifacts resulting from aliasing in time or in pitch angle. Finally, it should be recognized that the distribution functions shown in Figure 4 (as well as those in Figure 3) were calculated under the assumption that the phase space density f is constant over the opening angle of the plasma analyzer, or an elevation range of -56 ø to + 56 ø. If the bump electrons are actually confined to a more limited region of velocity space, then the phase space density in that region would be larger than shown in Figure 4; i.e., the bumps would have a larger amplitude.
A possible interpretation of the 2- to 5-keV bumps evident in Figure 4 is that the bump electrons are the remnant of an electron beam produced in a region of parallel electric field, possibly the electric field along the magnetic X-line. Beam electrons would be expected to interact strongly with the sur- rounding plasma, in the process losing energy to the thermal electrons and to plasma waves. Thus the beam plasma insta- bility is a possible mechanism for the electron heating de- scribed above.
In a recent laboratory reconnection experiment, Stenzel et al. [1983] reported plasma heating as a result of a beam plasma instability. Electron and ion beams were found to orig- inate at a double layer that formed in the neutral sheet when the current density exceeded a certain threshold. This result, in conjunction with the magnetotail observations reported here, raises the interesting possibility that parallel electric fields in reconnecting magnetotail plasmas might at times be support- ed by a double layer rather than by the resistive mechanisms assumed in MHD models.
5. MICROSTRUCTURE OF MAGNETIC FIELD
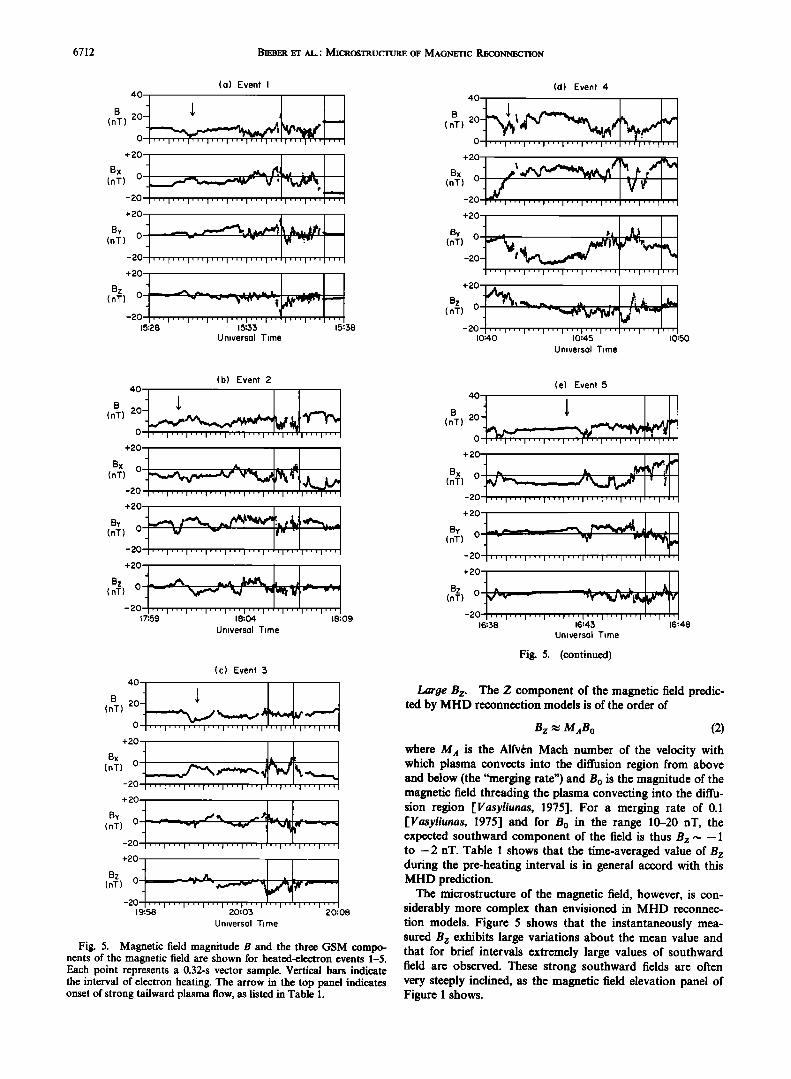
This section considers the detailed behavior, on a 0.32-s time scale, of the magnetic field during heated electron recon- neetion events. The data for each of the five events are pre- sented in Figure 5. From top to bottom are shown the mag-
E (keV) E (keV)
I I , ,I ,,,,I .... I
----IO-le- ß
E 10-20-
10-22 I I I I I I I
I I ,jl,,,,I .... I , I I • ,I,,,:•i.•,•, I io_•e - 03 -
E I0 -2ø-
10-22 I I I I • I I I 0 20 40 60 80
I I j,l•,,,I .... I
-• [ I V (103 km/s) • Io-'%
• ,o-2o•
I }-22 I I I I I I I I 0 20 40 60 80
V (103 km/s) Fig. 4. Examples of bump-in-tail electron distributions observed
at the peak of heating for each event. These are single-scan distri- butions, covering a limited azimuthal range of electron velocity vec- tors, and requiring • 0.25 s to accumulate. The curves are fitted Maxwellians. Error bars on the points are due to counting statistics. The shaded fan at upper right of each plot indicates the azimuthal range of velocity vectors included in the scan, and the arrow indicates the instantaneous magnetic field azimuth (GSE coordinates), where sunward is up and dawnward is to the right. The magnetic field elevation was within 30 ø of the ecliptic plane for all scans shown except for event 3, where the elevation was - 76 ø.
netic field magnitude and the XGSM, YGSM, and ZOSM compo- nents. Note that these plots cover a smaller time interval than the summary plots shown in Figure 1. The vertical bars ex- tending through each plot show the interval during which heated electrons were observed. The onset of strong tailward plasma flow, as determined from the ion data and as listed in Table 1, is indicated by a vertical arrow. (Note, however, that both the bars and the arrows are uncertain by ~ _+ 13 s, since successive 13-s measurements of a given species are separated by a 13-s interval with no data for that species.)
5.1. Magnetic Field Behavior
The microstructure of the magnetic field exhibits several notable features.
Reversals of Bx. Reversals in the sign of Bx are observed during the heating pulse in every case. This suggests that the heated electrons are localized near the neutral sheet. Since the
heating pulse typically lasts 1-2 min at a time when the plasma is flowing tailward at ~ 1000 km/s, the heated elec- trons must occupy a plasma column at least 10-20 R• in extent in the X direction. The extent of the heating region in the Y direction cannot be determined from the data presented here. In four of the five events, neutral sheet crossings also occurred prior to the heating pulse, but with no heating ob- served. Thus the heating is apparently localized temporally as well as spatially, such that the heating does not begin until several minutes after onset of strong tailward plasma flow.
6712 BIEBER ET AL.' MICROSTRUCTURE OF MAGNETIC RECONNECTION
(a) Event I 40
- $ , B
(nT)
0
+20
'''1'''1'''1'''1'''1'''1'' I'''I'''
Bx (nT) 0
-20
+20
By (nT) 0
-20
+20
(nT) 0 -- -'• • '¾•TY'"'"{' ½¾'•.•'• • -20 '''1'''1'''1'''1'''1'''1'' I'''1 ......
15:28 15:33 15:38
Universal T•me
(d) Event 4
(nT) 20 I o I'" •'" •'",'"•",•,,,,,,,I,,,=',,, •',,, I
+20
Bx (nT) 0
-20
+2•
'''1'''1'''1'''1'''1'''1 ...... I'''1'''
By 0 (nT)
-20-
+20
.
-20 '''1'''1'''1'''1'''1'''1 .... ''1'''1''' 10:40 10;45 10:50
Universel T•me
(b) Event 2 40
(nT) 20 .•••1•%• +20
Bx 0 (nT)
-20
+2O
By (nT) 0
-20
+2O
Bz _ •./%_ • •1• (nT) 0 --- • - • •I!•W¾ ¾, ..•..--•,,-,
-20 '''l'''l'''I'''I'''I'''f' '1'''1'''1''' 17:59 18:04 18:09
Universal T•me
(c) Event 3 4O
(nT) 20
+2O
Bx (nT) 0
-20
+20
'''1'''1'''1'''1'''1'''1'''1'''1'''1'''
By (nT) 0
-20
+20
(nT) 0 19:58 20:03 20:08
Universal T•me
Fig. 5. Magnetic field magnitude B and the three GSM compo- nents of the magnetic field are shown for heated-electron events 1-5. Each point represents a 0.32-s vector sample. Vertical bars indicate the interval of electron heating. The arrow in the top panel indicates onset of strong tailward plasma flow, as listed in Table 1.
(e) Event 5 4O
B (nT) 20
+20
'''1'''1'''1'''1'''1'''1'''1'''1 ''1' '
Bx 0 (nT)
-20
+20
By 0 (nT)
-20
+20
Bz ---., ,, ß (nT) 0 •,-• -n¾-;.ll•-•t/w•V -20
16:38 16•43 16•48 Universel Time
Fig. 5. (continued)
Large Bz. The Z component of the magnetic field predic- ted by MHD reconnection models is of the order of
Bz • M,•Bo (2)
where M A is the Alfv6n Mach number of the velocity with which plasma convects into the diffusion region from above and below (the "merging rate") and Bo is the magnitude of the magnetic field threading the plasma convecting into the diffu- sion region [Vasyliunas, 1975]. For a merging rate of 0.1 [Vasyliunas, 1975] and for Bo in the range 10-20 nT, the expected southward component of the field is thus Bz '• -1 to -2 nT. Table 1 shows that the time-averaged value of B z during the pre-heating interval is in general accord with this MHD prediction.
The microstructure of the magnetic field, however, is con- siderably more complex than envisioned in MHD reconnec- tion models. Figure 5 shows that the instantaneously mea- sured B z exhibits large variations about the mean value and that for brief intervals extremely large values of southward field are observed. These strong southward fields are often very steeply inclined, as the magnetic field elevation panel of Figure 1 shows.
BIEBER ET AL.' MICROSTRUCTURE OF MAGNETIC RECONNECTION 6713
The largest southward field tends to occur at the beginning of the heating pulse, with Bz < - 10 nT observed at this time in four of the five events. In event 1 the southward component of the field momentarily reached -18 nT, which was larger than the lobe field magnitude of 16 nT observed 2 min later. If the validity of (2) is accepted, then extreme variability of Bz impties that the merging rate M,• is extremely variable, i.e., reconnection is unsteady and impulsive.
Laroe Br. Figure 5 shows that the Y component of the magnetic field exhibits a complex behavior and is often quite large during these reconnection events. In most events, Y components of -,• 10 nT were observed at some time, and for event 4, Br ~ -20 nT was observed for a 3-min interval near the beginning of strong tailward plasma flow. There is a tend- ency for the largest Br to occur prior to the heating pulse and, in some cases, after heating as well, with lesser values of Br observed during-the pulse. In fact, (Br) is often comparable to (Bx) and substantially larger than (Bz) during the pre- heating interval, as Table 1 shows. These observations demon- •trate the importance of constructing fully three dimensional reconnection models.
Hones et al. [1982] have studied occurrences of significant Br during reconnection events and have interpreted their ob- servations in terms of a draping of magnetic field lines toward the center of the plasmoid. This draping results'in a pattern of Br such that on the duskward side of the plasmoid, Br has the opposite sign of Bx, whereas on the dawnward side Br and Bx have the same sign.
The observations presented here are qualitatively consistent with the pattern of Br predicted for the duskward side of the plasmoM; i.e., Br usually has the opposite sign of Bx. This anticorrelation can be seen in some detail in Figure 5 and is also evident in the time-averaged values of Bx and B r listed in Table 1. Curiously, none of the five events were found to exhibit the pattern predicted for the dawnward side of the plasmoid. Hones et al. [1982] also found more events fitting the duskward pattern than the dawnward pattern. This may indicate that the internal structure of the plasmoid is asym- metric in the dawn-dusk direction.
The observations of very large Br and Bz described above indicate that large-scale changes in the nørmal magnetotail current system occur during substorms. In event 4, for exam- ple, the 3-min duration of the episode of large Br would indi- cate that the perturbation extends over a plasma column -,• 15 Re long in the X direction, assuming that the magnetic field is frozen ,into the tailward flowing plasma. The pulses of very large Bz typically last only ~ 30 s, but this would still imply that the perturbation extends over several earth radii in the X direction. Note that the current perturbation must be quite large in magnitude as well as in spatial extent, since the per- turbed magnetic fields are often comparable in strength to the normal lobe field.
The idea that substorms are related to changes in the mag- netotail current system was previously proposed by Clauer and McPherron [1974] and Bostr•im [1974]. They suggested that during substorms some porti9n of the normal cross-tail current is short-Circuited through the auroral ionosphere, giving rise to the characteristic substorm magnetic field per- turbations observed on the ground. A possible relationship between current disruptions and magnetic reconnection in laboratory plasmas was recently reported by $tenzel et al. [1983]. They observed spontaneous disruptions of the neutral sheet current when the local current density exceeded a critical value. The disruptions occurred for X-line, but not for O-line,
magnetic field topologies and were found to be related to the formation of a double layer in the neutral sheet.
Rapid variations. An interval of enhanced magnetic field variability begins in fairly close association with the onset of fast tailward plasma flow, as can be seen in Figure 1 as well as in Figure 5. The standard deviation of the magnetic field aB is usually -,• 50% or more of the total field Brms- (Table 1 shows this for the pre-heating interval, but it is also true during the heating pulse.) At times the vector difference between suc- cessive 0.32-s magnetic field samples is as large as -,• 7 nT, corresponding to a rate of change -,• 20 nT/s. Typically, how- ever, the rate of change is -,• 5 nT/s or less.
Various factors could cause such rapid variations. Magnetic turbulence resulting from the tearing mode instability is one possibility, as suggested by ½oroniti et al. [1977]. Large- amplitude waves, or pulsations, also seem to contribute 4 at times. A fairly clear example of such pulsations can be seen in the Br component between about 1046 and 1048 UT during event 4. '
Magnetic field discontinuities represent a third possible cause of rapid variation. At times the field varies by an amount comparable to its magnitude in just a few seconds. If these temporal variations represent spatial variations convec- ted past the spacecraft, then the width of the spatial structure is -,• 1000-2000 km, assuming a convection speed of 500 km/s. Since this width is not much larger than a proton gyroradius (-,• 1000 km), such spatial structures might be characterized as magnetic field discontinuities. This possibility will' now be examined in detail.
5.2. Magnetic Field Discontinuities
In order to determine whether some of the rapid magnetic field variations evident in Figure 5 might be categor•ized as MHD discontinuities--either as shocks, rotational dis- continuities, or tangential discontinuities--various intervals of data were subjected to a minimum variance analysis [Son- nerup and Cahitl, 1967]. The analysis concentrated on vari- ations involving a large and rapid change in Bz. Such vari- ations frequently occur near the beginning of the heating pulse and usually involve substantial changes in Bx and Br as well as in Bz.
The results of the analysis were mixed. Although a number of possible discontinuities were found, many of the hodograms did not show a clean pattern which could be simply interpre- ted as an MHD discontinuity. A possible reason 'for this is that the almost continual variation of the magnetic field during reconnection events may result from various causes. For example, variations due to neutral sheet motion and waves may be superposed upon variations due to an MHD discontinuity. Thus any discontinuity present would appear not as a sharp transition separating regions of steady field but rather as a brief interval of rapid variation separating regions of lesser, but still substantial, variation. As a result, the bound- aries of possible discontinuities are somewhat ill defined, and it is often difficult to decide exactly where to begin and end the analysis interval. Adding to these complications is the possibility that the discontinuity surface itself could be curved or wavy, resulting in a local normal direction thai changes as the discontinuity sweeps past the spacecraft.
The clearest case of a discontinuity discovered by this analysis occurred near 1805:39 UT, very close to the onset of electron heating', during event 2 (see also Figure 5b). Figure 6 shows an expanded view of the magnetic field behavior

6714 BIEBER ET AL.' MICROSTRUCTURE OF MAGNETIC RECONNECTION
4o_•,
+20
Bx 0 (nT)
-20 +20
By 0 (nT)
-20 +•0
e 2
Bz - } (nt) 0 ':""•""'•' '"'"""•'"" I : ' _
18:05:25 18'05' 55
Universol Time
5nT B
Fig. 6. A possible magnetic field discontinuity observed during event 2. To the left are shown magnetic field magnitude and the three GSM components for a 30-s interval in which the possible disconti- nuity, indicated by vertical bars, was observed. To the right are shown hodograms of the magnetic field in minimum variance coordi- nates, where B x, Be, and B 3 are the magnetic field components along the maximum variance, median variance, and minimum variance di- rections, respectively. For this case the three eigenvalues are 51, 5.8, and 0.02 nT 2. The minimum variance eigenvector has GSM compo- nents (X, Y, Z) - (0.68, 0.03, 0.73).
around this time, along with hodograms of the suspected dis- continuity in minimum variance coordinates. The interval subjected to minimum variance analysis is indicated by verti- cal bars in the plots to the left. The error in the normal direc- tion, as calculated from the method of Lepping and Behannon [1980], is <2 ø for this transition. (The smallness of the error results in large part from the fact that the minimum eigen- value is much smaller than the median or maximum eigen- values.)
Conclusive identification of the nature of this transition
would require detailed plasma data around this time, so that it could be determined whether the plasma properties change in a way characteristic of one of the MHD discontinuities [Landau and Lifshitz, 1960]. Unfortunately, the time resolu- tion of the available plasma data does not permit this analysis to be performed here. However, the appearance of the upper
B
(nT)
4O
o +20
Bx 0 (nT)
-20 +20
By 0 (nT)
B Z (nT)
-20 +20
16:45:20 16:45:50 Universel Time
Bi
t i I I
5nT
I lB 3
Fig. 7. A possible magnetic field discontinuity observed during event 5. See legend of Figure 6 for explanation of format. For this case the three eigenvalues are 20, 1.4, and 0.32 nT 2. The minimum variance eigenvector has GSM components (X, Y, Z)= (-0.86, -0.17, 0.48).
hodogram, along with the finite normal value of •4 nT indi- cated by the lower hodogram, suggests that this transition is a rotational discontinuity. During the transition the magnetic field magnitude changes from 13 to 8 nT. Hudson [1970] has shown that the magnetic field can change magnitude through a rotational discontinuity if the plasma is anisotropic.
Note that if only B x and B z are considered, the transition shown in Figure 6 resembles, at least superficially, a shock as predicted in the Petschek reconnection model [Petschek, 1964]. There is a transition from predominant Bx to predomi- nant Bz, accompanied by a sharp decrease in field magnitude. However, during this transition, Br varies more than either Bx or Bz. When the behavior of all three components is con- sidered there is no possibility that this could be a shock. The angle between the pretransition and posttransition magnetic field vectors is 128 ø, whereas for a shock this angle could not be greater than 90 ø . This demonstrates once again the impor- tance of including the dynamics of Br in reconnection models.
Figure 7 presents a second example, taken from event 5, of a possible discontinuity occurring in conjunction with a sharp decrease of Bz. (See also Figure 5e near 1645:38 UT.) The lower hodogram indicates that the normal component (B3) is zero, as would be characteristic of a tangential discontinuity. The error in the normal direction is • 2 ø. Again, it is unlikely that the transition is a shock. The angle between the pretransi- tion and posttransition magnetic fields is 63 ø. For a shock that causes a directional change of this degree, the pretransition and posttransition field magnitudes should differ by a factor of 2.2 or more [Colburn and Sonett, 1966, equation (18)], but the observed change is only a factor of 1.3.
A final possible discontinuity, taken from event 3, is shown in Figure 8. (See also Figure 5c near 2005:45 UT.) As in the other two examples, there is a sharp southward turning of Bz, accompanied by rapid variation of Bv. However, unlike the other two examples, Bx reverses sign during this transition. This would normally identify the transition as a neutral sheet crossing, but in this case, where the field magnitude changes little during the transition, the appellation "neutral sheet" seems inappropriate.
The transition illustrated in Figure 8 appears most consis- tent with a rotational discontinuity. The error in the normal direction is <2 ø. The calculated normal magnetic field com-
4O
(nT)
0 +20
Bx 0 (nT)
-20 +20
By 0 (nT)
B Z (nT)
-20 +20
20 '05:30 20' 06 '00
Universel Time
5nT Bi
B 3
Fig. 8. A possible magnetic field discontinuity observed during event 3. See legend of Figure 6 for explanation of format. For this case the three eigenvalues are 36, 4.2, and 0.08 nT 2. The minimum variance eigenvector has GSM components (X, Y, Z)= (-0.76, -0.22, 0.61).

BIEBER ET AL. '. MICROSTRUCTURE OF MAGNETIC RECONNECTION 6715
ponent(~ 2 nT) is finite, though small. The upper hodogram shows the magnetic field vector rotating about the origin, though the trace is not as smooth as in the first example shown (Figure 6). The angle between the pretransition and posttransition magnetic fields is 99 ø. This fact once again rules out the possibility that this could be a shock.
To summarize this subsection, several magnetic field transi- tions involving a sharp southward turning of Bz were ana- lyzed and were found to be consistent with rotational or tangential discontinuities. Each of the examples shown oc- curred near the time of electron heating, but a clear associ- ation of these magnetic field features with a large-scale plasma structure, such as the edge of the plasmoid, is not evident. Numerous other intervals, not shown here, were also subjected to minimum variance analysis. Some of these could also be interpreted as rotational or tangential discontinuities, though many did not show a clean pattern characteristic of any MHD discontinuity. No clear example of a shock was found. Though the presence of shocks in these observations cannot be defi- nitely ruled out, it does appear that shocks play less of a role in magnetotail reconnection events than do rotational and/or tangential discontinuities. '
6. SUMMARY
The reconnection events studied here can be divided into
two phases, each associated with a distinctive behavior of plasma and magnetic field:
Pre-heatin•t phase. This phase, which typically lasts ~ 5 min, begins with the onset of strong tailward plasma flow, and ends with the onset of electron heating. In auroral zone mag- netograms a substorm onset or intensification is evident near the beginning of this phase. The prominent characteristics of plasma and magnetic field behavior, as observed on IMP 8 approximately 30 Re tailward of earth, are as follows:
1. Tailward plasma flow is observed throughout this phase. The flow speed is fairly steady at ~ 500 km/s, roughly equal to the local Alfv6n velocity.
2. The magnetic field is highly variable, with a standard deviation (as calculated from 0.32-s vector samples) of ~ 50% or more of the average field magnitude.
3. The Z component of the magnetic field participates in the general variability, but the time-averaged value is south- ward in every case, with (Bz) in the range -0.6 to -2.1 nT.
4. Large Br, up to ~ 20 nT, is often observed. Heating phase. This phase, which typically lasts ~ 1-2
min, begins with the onset of electron heating and ends with plasma sheet dropout and/or with the decay of the electron temperature to its pre-heating level. The prominent character- istics of plasma and magnetic field behavior, as observed on IMP 8, are as follows:
17 The electron temperature increases by a factor of 2-4 over its pre-heating value, resulting in a net rise of 0.6-1.4 keV. Measurements of the electron velocity distribution show that this increase can be characterized as a true heating pro- cess, in that the gross evolution of the distribution function is from a narrower to a broader Maxwellian.
2. Concurrently with th fe temperature rise, the plasma den- sity decreases by a comparable factor, so that electron pres- sure remains roughly constant. '•
3. In high time resolution data, bump-in-tail distributions are observed sporadically during each heating pulse.
4. The electron data suggest that the bulk flow velocity is 2-3 times faster during this phase than during the pre-heating phase.
5. As in the pre-heating phase, the magnetic field is highly variable. The standard deviation of the field is typically ~ 70% of the average field magnitude.
6. Very strong southward magnetic fields (Bz ~-5 to -20 nT) are observed near the beginning of the heating pulse. Often these represent the strongest southward fields observed during either phase of the entire reconnection event.
7. In general, B r tends to be smaller during the heating pulse than during the preheating interval.
8. Reversals of Bx are always observed during the heating pulse.
Throughout both phases of these reconnection events, > 200-keV electrons exhibit trapped or isotropic angula r dis- tributionSl This would suggest that all of the phenomena listed above occur on closed magnetic field lines. A transition to tailward streaming energetic electrons, indicative of open mag- netic field lines, was observed in each eventmindeed, the events were originally identified by means of this streaming transition--but this did not occur till Shortly after the end of the heating phase.
It was found that transitions to strong southward magnetic field occurring in either phase are frequently very abrupt and may indicate the passage of a discontinuity past the spacecraft. However, analysis suggests that the discontinuity is not the slow shock predicted by two-dimensional MHD reconnection models. Rather it is a rotational or tangential discontinuity, in which the Y component of the magnetic field plays an impor- tant role.
Use of the term "phases" to designate the two types of plasma and magnetic field behavior should not be taken to imply that the heated-electron pulse is exclusively temporal in nature, since temporal variations observed by a single space- craft are often caused in part by spatial variations moving past the spacecraft. In fact, the reversals of Bx observed during each heating pulse would indicate that the heating is spatially localized near a current sheet, as well as temporally localized near the end of the tailward flow interval.
In summary, the observations presented here show that magnetic reconnection in the earth's magnetotail is a very complex and highly dynamic process. Much of the macro- scopic behavior of the substorm plasma sheet can be under- stood on the basis of phenomenological and MHD models [Russell and McPherron, 1973; Hones, 1977], but many of the microstructural features reported here lie outside the scope of such models. In many respects, these novel magnetotail obser- vations are similar to the laboratory observations of Stenzel et al. [1983], which show that complicated interrelationships exist among magnetic reconnection, double layers, current dis- ruptions, large inductive el$ctric fields, electron beams, and plasma waves. Further research will be required to determine whether these similarities are only superficial or whether they reflect common underlying physical causes.
Acknowledgments. Work at Caltech was supported in part by the National Aeronautics and Space Administration under contracts NAS5-11066 and NAS5-25789 and grant NGR 05-002-160. Work at Los Alamos was done under the auspices of the United States De- partment of Energy.
The Editor thanks the two referees for their assistance in evaluating this paper.
REFERENCES
Akasofu, S.-I., Magnetospheric substorms: A newly emerging model, Planet. Space Sci., 29, 1069-1078, 1981.
Baker, D. N., and E. C. Stone, Energetic electron anisotropies in the

6716 BIEBER ET AL.' MICROSTRUCTURE OF MAGNETIC RECONNECTION
magnetotail: Identification of open and closed field lines, Geophys. Res. Lett., 3, 557-560, 1976.
Baker, D. N., R. D. Belian, P. R. Higbie, and E. W. Hones, Jr., High-energy magnetospheric protons and their dependence on geo- magnetic and interplanetary conditions, ,1. Geophys. Res., 84, 7138- 7154, 1979.
Baker, D. N., E. W. Hones, Jr., P. R. Higbie, R. D. B½lian, and P. Stauning, Global properties of the magnetosphere during a sub- storm growth phase: A case study, ,1. Geophys. Res., 86, 89•tl-8956, 1981.
Bieber, J. W., and E. C. Stone, Streaming energetic electrons in earth's magnetotail: Evidence for substorm-associated magnetic reconnec- tiOn, Geophys. Res. Lett., 7, 945-948, 1980.
Bieber, J. W., E. C. Stone, E. W. Hones, Jr., D. N. Baker, and S. J. Bame, Plasma beh•tvior during energetic electron streaming events: Further evidence for substorm-associated magnetic reconnection, Geophys. Res. Lett., 9, 664-667, 1982.
Bostr/Sm, R., Ionosphere-magnetosphere coupling, . in Magnetospheric Physics, edited by B. M. McCormac, pp. 45-49, D. Rei,del, Hing- ham, Massachusetts, 1974.
Clauer, C. R., and R. L. McPherron, Mapping the local time- universal time development of magnetospheric substorms using mid-latitude magnetic observations, ,1. Geophys. Res., 79, 2811- 2820, 1974.
Colburn, D.C., and C. P. Sonett, Discontinuities in the solar wind, Space Sci. Rev., 5, 439, 1966.
Coroniti, F. V., F. L. Scarf, L. A. Frank, and R. P. Lepping, Micro- structure of a magnetotail fireball, Geophys. Res. Lett., 4, 219-222, 1977.
Fairfield, D. H., A statistical determination of the shape and position of the geomagnetic neutral sheet, J. Geophys. Res., 85, 775-780, 1980.
Frank, L. A., K. L. Ackerson, and R. P. Lepping, On hot tenuous plasmas, fireballs, and boundary layers in the earth's magnetotail, ,1. Geophys. Res., 81, 5859-5881, 1976.
Gurnett, D. A., L. A. Frank, and R. P. Lepping, Plasma waves in the distant .magnetotail, d. Geophys. Res., 81, 6059-6071, 1976.
Hones, E. W., Jr., Substorm processes in the magnetotail: Comments on 'On hot tenuous plasmas, fireballs, and boundary layers in the earth's magnetotail' by L. A. Frank, K. L. Ackerson, and R. P. Lepping, ,1. Geophys. Res., 82, 5633-5640, 1977.
Hones, E. W., Jr., Transient phenomena in the magnetotail and their relation to substorms, Space Sci. Rev., 23, 393-410, 1979.
Hones, E. W., Jr., and K. Schindler, Magnetotail plasma flow during substorms: A survey with IMP 6 and IMP 8 satellites, J. Oeophys. Res., 84, 7155-7169, 1979.
Hones, E. W., Jr., S. J. Bame, and J. R. Asbridge, Proton flow measurements in the magnetotail plasma sheet made with IMP 6, J. Geophys. Res., 81, 227, 1976.
Hones, E. W., Jr., J. Birn, S. J. Bame, G. Paschmann, and C. T. Russell, On the three-dimensional magnetic structure of the plas- moid created in the magnetotail at substorm o•set, Geophys. Res. Lett., 9, 203-206, 1982.
Hudson, P. D., Discontinuities in an anisotropic plasma and their identification in the solar wind, Planet. Space Sci., 18, ! 61 !, 1970.
Landau, L. D., and E. M.. Lifshitz, Electrodynamics of Continuous Media, pp. 224-233, Pergamon, New York, 19601
Lepping, R. P., and K. W. BehannOn, Magnetic field directional dis- continuities, 1, Minimum variance errors, J. Geophys. Res., 85, 4695-4703, 1980. •
Nishida, A,, H. Hayakawa, and E. W. Hones, Jr., Observed signatures of ieconnection .in the magnetotail, J. Geophys. Res., 86, 142.2-'1436, 1981.
Peterson, W. K., R. D. Sharp, E.G. Shelley, and R. G. Johnson, Energetic ion composition of the plasma sheet, J. Geophys. Res., 86, 761-767, 1981.
petschek, H. E., Magnetic field annihilation, AAS-NASA Symposium on the Physics of Solar Flares, NASA Sped. Publ., SP-50, 425-439, 1964.
Russell, C. T., and R. L. McPherron, The magnetotail and substorms, Space Sci. Rev., 15, 205, 1973.
Sonnerup, B. U. 0., and L. J. Cahill, Jr., Magnetopause structure and attitude from Explorer 12 observations, J. Geophys. Res., 72, 171- 183, 1967:
Stenzel, R. L., W. Gek½lman, and N. Wild, Magnetic field line recon- n•ctio•n experiments, 5, Current disruptions and double layers, J, Geophys. Res., 88, 4793-4804, 1983.
Vasyliunas, V. M., Theoretical models of magnetic field line merging, 1, Rev. Geophys. Space Phys., 13, 303-336, 1975.
D. N. Baker, S. J. Bame, and E. W. Hones, Jr., Los Alamos Nation- al Laboratory, Los Alamos, NM 87545.
J. W. Biebcr, Bartol Research Foundation of The Franklin Insti- tute, University of De!aware, Newark, DE 19716.
R. Lepping, Laboratory for Extraterrestrial Physics, NASA God- dard Space Flight Center, Greenbelt, MD 20771.
E. C. Stone, California Institute of Technology, Pasadena, CA 91125.
(Received November 29, 1982; revised March 22, 1984;
accepted March 26, 1984.)