microstructure effects on microcracking and brittle
TRANSCRIPT

ELSEVIER Tectonophysics 281 (1997) 141-16l
TECTONOPHYSICS I
Microstructure effects on microcracking and brittle failure of dolomites
a* Yosse f . H. H a t z o r ' , A l o n Z u r a, Y a a k o v M i m r a n h
" Department of Geological and Environmental Sciences, The Deichmann Rock Mechanics Laboratory of the Negev, Ben-Gurion UniversiO' of the Negev, Beer-Sheva 84105, Israel
h Geological Survey oflsrael, Jerusalem, Israel
Received 5 August 1996; accepted 9 April 1997
Abstract
In this paper the influence of microstructure on crack initiation stress and ultimate strength is investigated using results and analysis of 32 triaxial compression tests performed on cylindrical cores of dolomite samples which exhibit a wide range of grain sizes and mosaic textures. All tests were performed at a constant strain rate, under confining pressures between 0 to 40 MPa. The predictive capability of conventional criteria for ultimate strength which are based on empirical fitting parameters such as cohesion and internal friction angle, or mechanical properties such as unconfined compressive strength, is shown to be quite poor, due to the influence of microstructure. Microstructure controls ultimate strength to such a degree that an assumed mechanical property such as unconfined compressive strength may vary by more than a factor of two, where two different microstructure patterns are present.
The validity of published analytical expressions which predict fracture initiation stress assuming the sliding crack model is tested using both mean and maximum grain size, and inserting the measured fracture initiation stress as the remote stress. It is shown that these approximate models fail to describe true behaviour because they ignore boundary conditions which exist at the tip of the leading crack at different mosaic textures.
Early attempts to discuss the influence of microstructure on rock strength have shown that ultimate strength is inversely related to mean grain size. This study demonstrates that grain size alone can not be used in correlation with ultimate strength. Rather, the combination of both grain size and porosity dominate the mechanical response of the rock. Fracture initiation stress is found to be more sensitive to the influence of grain size than ultimate strength, possibly because the length of initial cracks controls the level of stress concentration at the tip of leading cracks. However, fracture initiation stress is shown to be inversely related to both porosity and mean grain size, thus the importance of porosity in the initiation process must be recognized. Ultimate strength is influenced primarily by porosity and mosaic texture, and is less sensitive to mean grain size, possibly because once fracture propagation is initiated, grain arrangement controls fracture interaction processes which lead to macroscopic failure.
Kevwords: micromechanics; brittle failure; dolomites; porosity; grain size
* Corresponding author. Tel.: +972 (7) 647-2621; fax: +972 (2) 647-2997; e-mail: [email protected]
0040-1951/97/$17.00 © 1997 Elsevier Science B.V. All rights reserved. PII S0040-195 ! (97 )00073-5

142 Y. H. Hatzor et al./Tectonophysics 281 (1997) 141-161
1. Introduction
Early workers in rock mechanics have studied the mechanical behaviour of sedimentary rocks under confining pressure, either to determine their ultimate strength (e.g. Handin and Hager, 1957) or to char- acterize the dominant deformation mechanism (e.g. Handin and Fairbairn, 1955; Weiss and Turner, 1972). Much effort has been dedicated to the prediction of ultimate strength either for engineering applications or for tectonophysical model development.
Ultimate strength prediction was pioneered by Griffith (1921) who has developed a theoretical model for instantaneous fracture of brittle solids under tension, and a modified criterion for failure under compression (Griffith, 1924). Griffith's crite- rion suffers from several fundamental flaws, one of which is the assumption that crack initiation and ultimate strength are achieved at the same stress level. It is now a well documented experimental fact that crack initiation precedes dilation and unstable crack propagation, each of which are attained at about 40% and 80% of the ultimate stress, respec- tively (see for example Martin and Chandler, 1994 who tested granitic rocks). Empirical failure criteria were first discussed by Coulomb (1776), the math- ematical expression of which is given by the well known Coulomb-Mohr relationship. This criterion postulates that shear strength is comprised of two components, an inherent 'cohesion' which is inde- pendent of normal stress, and a frictional component. Both the cohesion and the 'internal friction' angle are purely empirical parameters, the physical nature of which is still somewhat vague. In the engineering literature two well known empirical criteria for the failure of rock under compression were proposed by Bieniawski (1974) and Hoek and Brown (1980). Both criteria incorporate fitting parameters which are lithology-dependent. These more recent criteria are used extensively in engineering analysis and de- sign, but they suffer from a lack of theoretical basis. Furthermore, these criteria are scaled by the uncon- fined compressive strength of the rock type, which is considered a material property. This, however, is unique to each rock type, and in a single limestone or sandstone formation the value of the unconfined compressive strength may vary according to local textural variations.
A few workers have investigated the influence of the variability in grain size and texture on the me- chanical response. Olsson (1974) studied the yield stress of marble and showed that it increases linearly with the inverse square root of the mean grain size. His results are consistent with the Petch (1953) dis- location pileup model. Petch's relationship has been successfully validated for metals. In rocks, however, the predicted linear relationship is seldom found. Hugman and Friedman (1979) found that weighted mean grain size (in carbonates) and micrite content (in limestones) have the highest linear correlation coefficients with ultimate strength. The more com- prehensive data analysis of Olsson (1974) suggest that the relationship established by Hugman and Friedman (1979) should be a negative exponential, as can be seen also in the uniaxial test results of Wong et al. (1995); only the correlation with the inverse square root of the mean grain size yields a linear fit, as has been found by Fredrich et al. (1990). The studies mentioned above have used the mean weighted grain size in the interpretation and analysis of data. The physical meaning of the latter term, however, is dubious because in carbonate rocks in general, and particularly in dolomites, the mean grain size is a single value in a relatively broad grain size distribution of the rock matrix.
Analytical expressions for fracture initiation stress were developed by Horii and Nemat-Nasser (1985) and by Ashby and Hallam (1986). These ap- proximate models assume an infinite plate containing a single flaw which slides when a critical shear stress level is attained. These models are attractive because they incorporate a physical flaw in the specimen, which can be a function of grain size, or grain boundary length, thus creating a link with petrogra- phy. The weakness of the analytical expressions is the assumption of a continuous plate containing a single flaw only rather than a multitude of grains, and the neglect of intergranular arrangement.
In this paper the influence of grain size, porosity, and mosaic texture on the stresses at which crack initiation ensues and ultimate strength is attained are investigated using 32 cylindrical cores of dolomites which were tested under confining pressures between 0 and 40 MPa. The predictive capability of available failure (ultimate strength) criteria are tested and the discrepancies with observations are discussed. The

Y H. Hatzor et al./Tectonophysics 281 (1997) 141-161 143
grain size effect is reviewed here with respect to dolomites of diverse grain size distributions. It is concluded that grain size alone yields poor correla- tion with ultimate strength, and a slightly better cor- relation with crack initiation stress. The predictions of available fracture mechanics models are tested, and the relationship between the required critical flaw length (2a) for fracture initiation under a given remote stress, and the measured mean and maximum grain size, is discussed. It is argued that both initial ftaw size, e.g. a grain boundary and porosity must be considered in crack initiation stress prediction. The petrography of the starting material is described and the control of microstructure on fracture propa- gation modes is treated descriptively. The influence of porosity on mechanical parameters such as elastic modulus and ultimate stress is described. Finally, the combined influence of mean grain size, porosity and mosaic texture on crack initiation stress and ultimate strength is discussed.
2. Theoretical background
The mechanism of fracture initiation and propa- gation which lead to ultimate failure of rock under compression has been the subject for numerous pub- lications. Early brittle fracture propagation studies were conducted by Brace and Bombalakis (1963) and by Hoek and Bieniawski (1965), who were able to observe the growth of cracks under compression in photoelastic material and glass. Brace and Bom- balakis (1963) showed that in compression the most severely stressed crack is inclined at about 30 de- grees to the axis of compression, and that it grows along a curved path which becomes parallel with the direction of compression. Hoek and Bieniawski showed that Griffith's theory for brittle fracture in a biaxial compressive stress field could only predict fracture initiation stress, and that the macroscopic failure of the rock occurs at higher stresses. Brace et al. (1966) explored the concept of rock dilation under confining pressures (up to 8 kbar) and showed that its onset can be identified with the point where the volumetric strain vs. axial stress curve deviates from the trend of elastic volume decrease, typically at about 50% of the peak stress for a wide variety of rocks. Bieniawski (1967) has postulated that stable fracture propagation starts at a lower stress level,
about 35% of the peak stress, indicated by a change in linearity of the stress-strain curve. The onset of dilation point as defined by Brace et al. (1966) was interpreted by Bieniawski (1967) as an indication of the onset of unstable fracture propagation, typically at 80% of the peak stress.
The early studies have measured total volumet- ric strain from data of strain gages attached in parallel with the principal strain directions. These measurements include both the elastic component of volumetric strain and volumetric strain due to the formation of new crack volume. Martin and Chan- dler (1994) removed the elastic (linear) volumetric strain component from the total volumetric strain measured, and showed that the inelastic volume in- crease due to crack growth precedes Brace's onset of dilation point, and occurs at about 40% of the peak stress in Lac du Bonnet Granite. They have termed the point of initiation of new crack volume as crack initiation stress at which stable crack growth ensues.
There are several micromechanical models for fracture initiation in compression. These include: cylindrical pore, sliding crack, elastic mismatch, dis- location pile up, and Herztian crack models (Kemeny and Cook, 1991). In all models extensile cracking under compression seems to develop, as has been inferred by Zheng (1989) and Myer et al. (1992) us- ing a petrographical study of thin sections containing injected Wood's metals. Although extensile crack- ing has been observed, the applicability of these models for the fracture of rock has not been vali- dated experimentally. The most popular model for rocks of low porosity has been the 'sliding crack' model, perhaps because it has been observed in various compression tests on photoelastic materials (Brace and Bombalakis, 1963), glass (Hoek and Bi- eniawski, 1965), Columbia resin (Nemat-Nasser and Horii, 1982; Horii and Nemat-Nasser, 1985) and on PMMA (Ashby and Hallam, 1986). In all cases pre-cut flaws were introduced on the plate before loading. The stress intensity factor for crack ini- tiation in an infinite plate using the sliding crack model has been approximated by Ashby and Hallam (1986). The mode I stress intensity factor, KI, is found by seeking the plane 0 on which the tensile stress is a maximum; and the most critical flaw is then identified by maximizing again, this time with respect to the flaw angle, y, giving the maximum KI
144 Y H. Hatzor et al./Tectonophysics 281 (1997) 141-161
as:
in the plane 0 = 70.5 ° for the crack of angle -- 0.5tan-l(1/#), where )~ = al/a3 (the ratio
of principal stresses) and/~ is the coefficient of fric- tion. The condition for crack initiation is given by setting K1 equal to Klc (the fracture toughness of the material), giving the initiation condition:
- ( 2 )
Kic [ ( 1 - 3 . ) ~ ] - ( 1 + )~)#
This solution is identical with Nemat-Nasser and Horii (1982) and similar in form to the solution of McClintock and Walsh (1962). The equation is strictly valid when the remote stress ~xx is com- pressive because in tension the frictional component disappears. This fracture initiation criterion has been developed analytically assuming that the infinite plate is homogeneous and contains a single crack.
A good review of fracture initiation models is provided by Kemeny and Cook (1991) who also calculate the stress intensity factor associated with each mechanism. In the present study we test the applicability of the sliding crack model. The rock matrix is composed of rombohedral dolomite crys- tals where face to face and face to edge contacts are common, thus initial flaws are provided by faces of existing rombohedrons. The dolomite rombohedrons are oriented randomly in the rock matrix and it is assumed that there should be a crystal face oriented in the weakest direction at which the developed shear stress will exceed the shear strength of the rombo- hedron face. Stress concentration is proportional to the square root of the initial flaw size and is higher for longer crystal faces. Crack initiation is expected to start therefore from the edge of the largest crys- tal face which is also oriented most favourably. The crystal face which meets these conditions is assumed to be the critical flaw in the sample. Attainment of crack initiation stress should mark the initiation of sliding along that critical flaw.
The final stage of brittle rock deformation is macroscopic failure, defined here as the strain at which the maximum stress is achieved and referred to as ultimate strength. Beyond that point, post peak deformation is governed by specimen-machine in-
teraction (Hudson et al., 1972) and is not analyzed here in detail. The point of peak stress represents the peak strength of the rock and therefore attempts have been made to predict it, empirically (Bieniawski, 1974; Coulomb, 1776; Hoek and Brown, 1980) and theoretically (Griffith, 1924). A good review of these criteria is given by Brady and Brown (1993).
3. Experimental procedures
3.1. The starting material
The rock samples used in the present study were taken from cores drilled through the Cenomanian Aminadav Formation in central Israel. The Amina- dav Formation belongs to a sequence of Cretaceous platform dolomites, the composition of which is be- lieved to be original (Sass and Katz, 1982). The man- ifestation of diagenetic processes is therefore limited to vugs which were formed by late dissolution, and recrystallization of secondary calcite, primarily in veins.
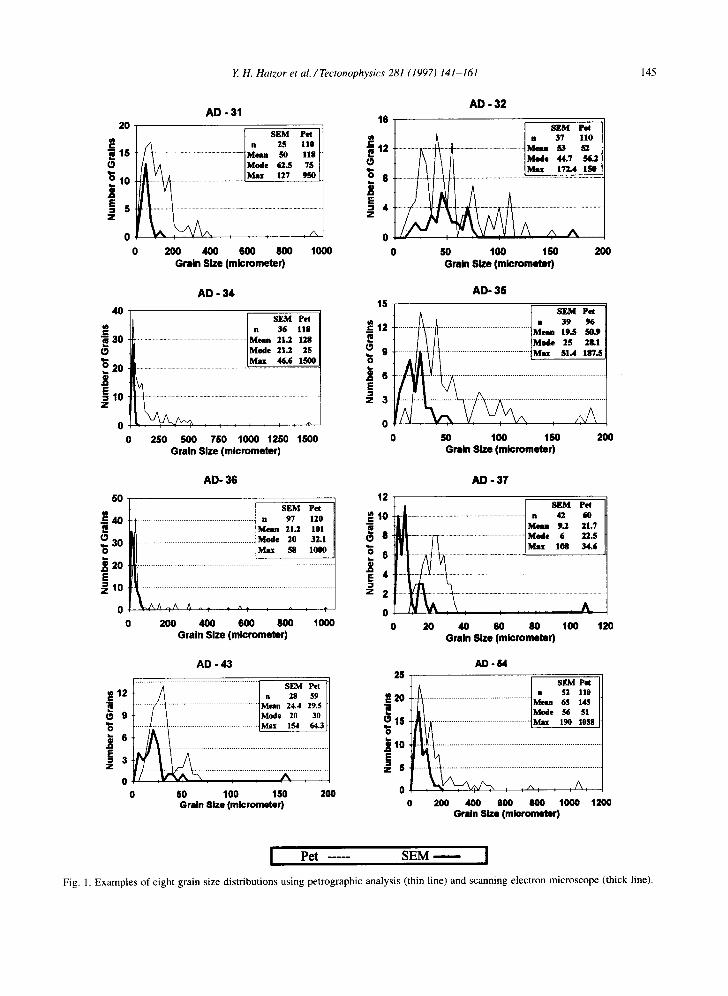
The formation consists of dolomite to slightly cal- citic dolomite forming 1-2 m thick banks. Fresh fractured surfaces exhibit either dense, medium- to coarse-grained grey dolomite, or finely grained dolomite. The grain size exhibits a negative ex- ponential distribution (Fig. 1), and the dominating texture is mosaic with three typical arrangements (Fig. 2). A detailed description of grain size dis- tribution and mosaic texture is provided in Sec- tions 4.1 and 4.2. The dolomites exhibit average bulk porosity of 7.984-4.4%. The porosity originates mainly from fabric-selective intercrystalline microp- ores, as well as vugs and microfractures which are not fabric-selective, according to the classification of Choquette and Lloyd (1970). The size of the in- tercrystalline micropores is in the order of several micrometres (Fig. 2). The vugs are typically circular with average diameter of 4274-191 /_tm (Fig. 3a-c). The microfractures are elongated and are typically filled with calcite forming calcite veins; only in some cases do they remain open or reduced to vugs due to partial recrystallization (Fig. 3d). The length of the microfractures is in the order of one to several ram. Secondary recrystallization of calcite is found primarily in the veins (Fig. 3d), while the vugs retain their original open shape.
Y. H. Hatzor et al./Tectonophysics 281 (1997) 141-161 145
AD - 31 2O
C 15
(3
~ ~o
0 0
- - - - S E M P e t
A I " zs . o .... / l ............................................... IM . - so . s / l XA [Mode ~ .S 7S
200 400 600 800 1000 Grain Size (micrometer)
16
_= .m 12 {9
~ s i E " 4
A D - 32
iA l n 37 110
. . . . . . . . . . . . . . . . . . . . . . . . . . . . . . . . . . . . . . . . . . . . . . . . . . . t . . - . * "
IX I / I I |Muh ~ :
SO 100 150 200 Grain Size (micrometer)
40
30 {9
~ 2o /t E lO
0
0
AD - 34
SEM Pet n 36 118
.......................................................... Mean 21.2 128 Mode 21.2 2S
............................................................ !.MH..._.~6_...'~.
IHI -
250 500 750 1000 1250 1500 Grain Size (micrometer)
15
c ~ 12
{9 9
i e E
= 3
AD- 35
[ SEM Pet ~ n 39 96
. . . . . . . . . . . . . . . . . . . . . . . . . . . . . . . . . . . . . . . . . . . . , °
,SO 100 100 200 Grain Size (micrometer)
AD- 36
50 I SEM Pet
. . . . . . . . . . . . . . . . . . . . . . . . . . . . . . . . . . . . . . . . . . . . . . . . . . . . . ,2o ~ 4 0 1o1
~ 3 0 . . . . . . . . . . . . . . . . . . . . . . . . Mode 20 32.1 ............ Max ~B 1000
. 1 ~ 2 0 . . . . . . . . . . . . . . . . . . . . . . . . . . . . . . . . . . . . . . . . . . . . . . . . . . . . . . . . . . . . . . . . . . . . . . . . . .
E
0 , , ' , • ,
0 200 400 600 800 1000 Grain Size (micrometer)
12
r: 1o .m {9 8
= 2
A D - 37
1 [ SEN[ Pet "~J-| ...................................................................... t n 42 60 lll l l |Menu ~a 21.7 W I - ............ ~ ............................................... 1 M ~ , • 22.s
~ ................................... ~ A 0 20 40 60 80 100 120
Grain Size (micrometer)
AD - 43
~:12 P O 9
i e E = 3 Z
0 0
. . . . . . . . . . - '~ . . . . . . . . . . . . . . . . . . . . . . . . . . . . . . . . . . . . . . . . . . ] S E M P e t
/ X / " 2s s9 . . . . . . . . y ' " ' ~ . . . . . . . . . . . . . . . . . . . . . . . . . . . . . . . . . . . . . . . . ] M e t a l 24 .4 29 .5
/ I /Mod~ 20 30
~ i i I ......................... txw,,: :s4 ~.3
S0 100 150 200 Grain Size (micrometer)
AD.S4 25
r:20
15 ~5 t t o E ~ s
0 o
[" S E M P a
J n 52 l l O ~IA- ................................................ I M" ~ ~'~ . / / ............................................... I M°d" ~ s:
200 400 600 800 1000 1200 Grain Size (micrometer)
] P e t . . . . . S E M I
Fig. 1. Examples o f e ight gra in size dis t r ibut ions us ing pe t rograph ic analys is (thin line) and scann ing e lect ron mic roscope ( thick line).
146 Y. H. Hatzor et al. / Tectonophysics 281 (1997) 141-161
3.2. Textural analysis
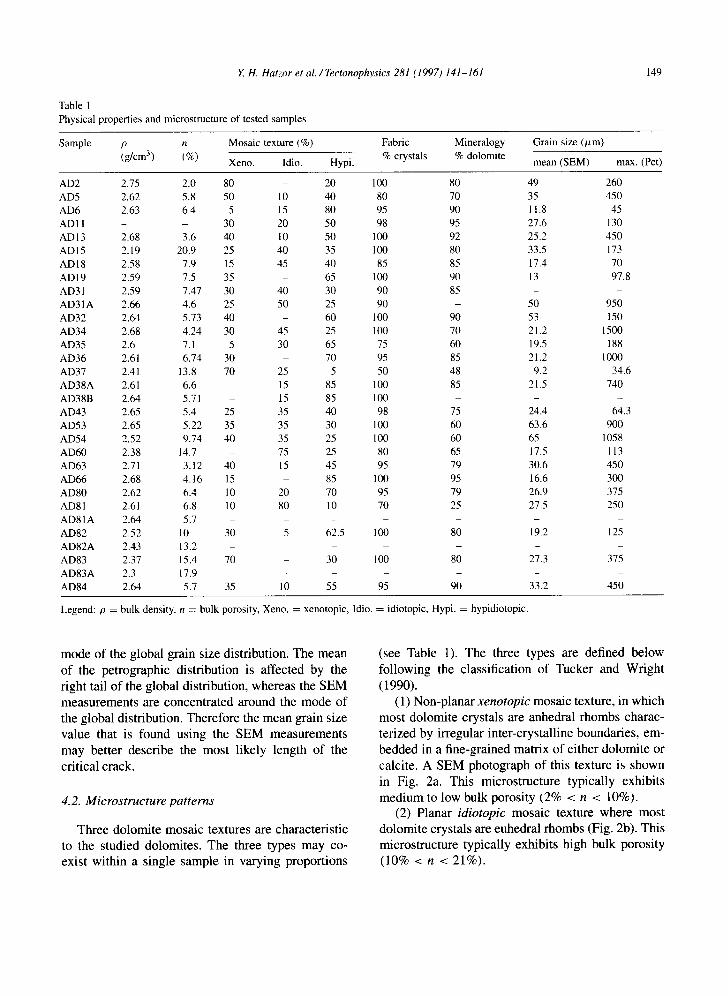
Petrographic analysis was performed using a pet- rographic microscope and a scanning electron micro- scope (SEM). The microstructure was studied before and after loading, in both methods. Grain size was measured using a calibrated reticule with crossline micrometer in a Zeiss petrographic microscope, and by direct measurements on scaled SEM micrographs. The size of vugs was measured on scaled optical micrographs. The results of these measurements en- abled statistical analysis of grain size distribution in order to find mean grain size, modal grain size, and maximum grain size. The grain boundaries and pack- ing were described and the proportions between the three prevailing mosaic textures were noted using both observation methods. Porosity was calculated using measured values of specific weight of solids (Gs), and measured dry density of the tested rock cylinders. Eight samples were ground for XRD anal- ysis in order to detect the presence of minerals other than dolomite and calcite. The proportion between dolomite and calcite in the material were estimated using petrographic thin sections which were par- tially stained by Alizarin red, following procedures discussed by Tucker (1988). Table 1 shows the re- suits of all the petrographic analyses, as well as the physical property data.
3.3. Rock testing
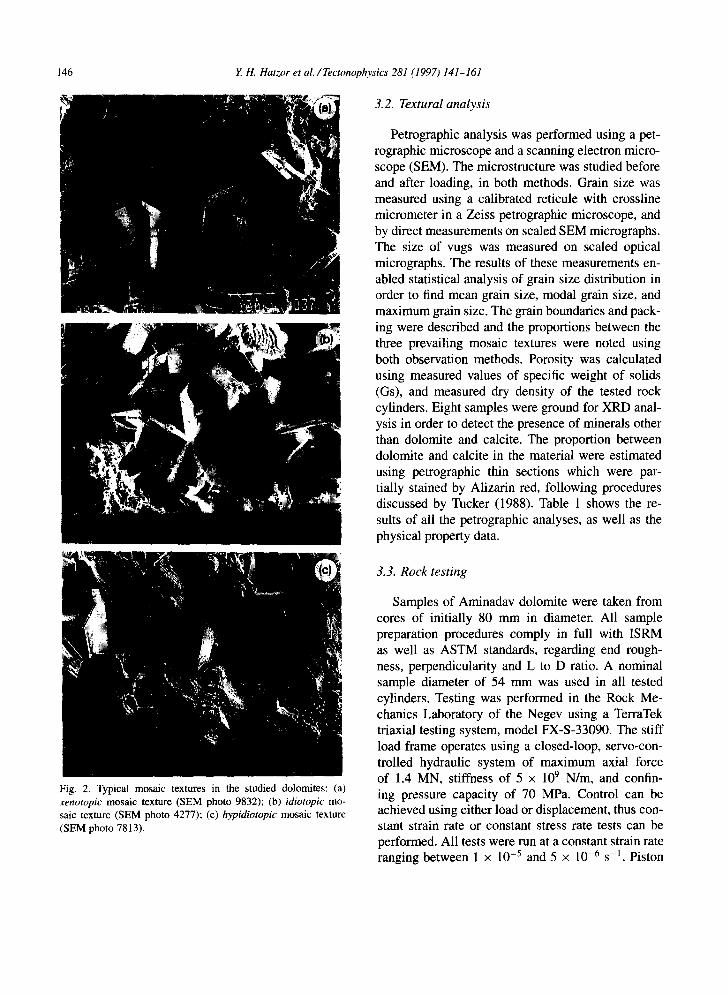
Fig. 2. Typical mosaic textures in the studied dolomites: (a) xenotopic mosaic texture (SEM photo 9832); (b) idiotopic mo- saic texture (SEM photo 4277); (c) hypidiotopic mosaic texture (SEM photo 7813).
Samples of Aminadav dolomite were taken from cores of initially 80 mm in diameter. All sample preparation procedures comply in full with ISRM as well as ASTM standards, regarding end rough- ness, perpendicularity and L to D ratio. A nominal sample diameter of 54 mm was used in all tested cylinders. Testing was performed in the Rock Me- chanics Laboratory of the Negev using a TerraTek triaxial testing system, model FX-S-33090. The stiff load frame operates using a closed-loop, servo-con- trolled hydraulic system of maximum axial force of 1.4 MN, stiffness of 5 x 10⁹ N/m, and confin- ing pressure capacity of 70 MPa. Control can be achieved using either load or displacement, thus con- stant strain rate or constant stress rate tests can be performed. All tests were run at a constant strain rate ranging between 1 x 10 -5 and 5 × 10 -6 s -l . Piston

Y. H. Hatzor et al./Tectonophysics 281 (1997) 141-161 147
.=-
¢"q
O
.=. ~-
• -6 ~ II
148 Y. H. Hatzor et al. / Tectonophysics 281 (1997) 141-161
displacement was monitored using a high-sensitivity LVDT located outside the vessel near the piston. Load was measured by a sensitive load cell located in series with the sample stack having a maximum capacity of 1000 kN and linearity of 0.5% full scale. Sample axial and radial strains were recorded using four-arm axial and transverse strain cantilever sets, where ann deflection was calibrated to displacement (calibration was performed prior to testing). The ax- ial cantilever set has a 10% strain range and the radial strain cantilevers have a strain range limit of 7%, with 1% linearity full scale for both sets. Sev- eral tests were performed without the internal axial and transverse strain cantilever systems, and axial displacement in these tests was inferred from the monitored stroke. These tests were only used for peak strength studies, as no information concerning true axial and transverse strain was acquired. Prior to testing, each sample was jacketed in a shrink tube to isolate the rock material from the pressure vessel oil. The complete stress-strain curves retrieved from testing all 32 samples were analyzed and the follow- ing mechanical parameters were defined: the elastic modulus (E), Poisson's ratio (v), stress difference at crack initiation (tri), total volumetric strain at crack initiation (ei), stress difference at onset of unsta- ble crack growth (trd), and stress difference at peak stress (trp). No reference has been made in this study to the post peak slope of the stress-strain curve.
3.4. Experimental repeatability
Axial and radial transducers were calibrated be- fore and after the testing program using high accu- racy dial gages which provided displacement read- ings for each cantilever arm independently. The re- peatability of load and displacement readings in specimen scale was frequently verified between tests using two standard aluminum billets of different lengths, for which Young's modulus and Poisson's ratio were calculated in the elastic range, and com- pared with standard values reported by the manu- facturer. In order to check actual repeatability of rock strength measurements two identical samples were tested in similar conditions: samples AD38A and AD38B under 20 MPa confining pressure. The physical properties of the two samples are listed in Table 1; the grain size data are common to both
samples as they were studied from a thin section and a SEM specimen which represent both cylin- ders. Initial geometry and test conditions are listed in Table 2 together with strength results. The peak strength results differ by less than 2%, a difference which can be explained by different initial geometry. We are therefore certain that stress and strain results which are reported here, although noisy, reflect true material behaviour and not testing artifacts.
4. Results
4.1. Grain size distribution and critical crack length
Typical grain size distributions measured for eight different specimens are shown in Fig. 1. Generally the curves show a negative exponential trend, the fre- quency of which is relatively high for smaller grain sizes, and decreases exponentially with increasing grain sizes. Two observation techniques were em- ployed, thin section analysis with the petrographic microscope and analysis of SEM photomicrographs. Eight representative examples are shown in Fig. 1. It can be seen that the global distribution is captured by thin section petrography, possibly because a larger area of the specimen was studied. The SEM obser- vations give a more accurate picture of the grain population close to the mode of the global distri- bution. It can be seen that grain size distribution is quite wide. The size of grains within a single specimen may vary by two orders of magnitude in many cases. The frequency of the right tail of the distribution however is very low.
Using the available data it is necessary to deter- mine which value should represent the most likely critical flaw size in terms of mechanistic analysis? Traditionally, workers have selected the mean grain size as the significant value in their interpretation of experimental results. Fracture mechanics considera- tions, however, predict highest stress concentrations at the tip of the longest flaw, which is oriented such that it mobilizes maximum shear stresses so that maximum tensile stresses develop at its tip. In the case of the studied dolomites, however, the longest flaws are the least expected. Furthermore, it can be shown that the probability that the longest grain is also critically oriented is extremely low. It is more likely that critically oriented cracks exist within the
Y. H. Hatzor et al./Tectonophysics 281 (1997) 141-161
Table 1
Physical properties and microstructure of tested samples
149
Sample p n Mosaic texture (%) Fabric Mineralogy
(g/cm3) (%) Xeno. Idio. Hypi. % crystals % dolomite
Grain size ( # m )
mean (SEM) max. (Pet)
A D 2 2.75 2.0 80 - 20 100 80 49 260
A D 5 2.62 5.8 50 10 40 80 70 35 450
A D 6 2.63 6.4 5 15 80 95 90 11.8 45
ADI 1 - - 30 20 50 98 95 27.6 130
A D 13 2.68 3.6 4 0 10 50 100 92 25.2 450
A D 15 2.19 20.9 25 40 35 100 80 33.5 173
A D 18 2.58 7.9 15 45 40 85 85 17.4 70
A D 19 2.59 7.5 35 - 65 100 90 13 97.8
AD31 2.59 7.47 30 40 30 90 85 - -
A D 3 1 A 2.66 4 .6 25 50 25 90 - 50 950
A D 3 2 2.64 5.73 40 - 60 100 90 53 150
A D 3 4 2.68 4 .24 30 45 25 100 70 21.2 1500
A D 3 5 2.6 7.1 5 30 65 75 60 19.5 188
A D 3 6 2.61 6.74 30 - 70 95 85 21.2 1000
A D 3 7 2.41 13.8 70 25 5 50 48 9.2 34.6
A D 3 8 A 2.61 6.6 - 15 85 100 85 21.5 740
A D 3 8 B 2.64 5.71 - 15 85 100 - - -
A D 4 3 2.65 5.4 25 35 40 98 75 24.4 64.3
A D 5 3 2.65 5 .22 35 35 30 100 60 63.6 900
A D 5 4 2.52 9 .74 40 35 25 100 60 65 1058
A D 6 0 2.38 14.7 - 75 25 80 65 17.5 113
A D 6 3 2.71 3.12 40 15 45 95 79 30.6 4 5 0
A D 6 6 2.68 4 .16 15 - 85 100 95 16.6 300
A D 8 0 2.62 6.4 10 20 70 95 79 26.9 375
AD81 2.61 6.8 10 80 10 70 25 27.5 250
A D 8 1 A 2.64 5.7 . . . . . . .
A D 8 2 2.52 10 30 5 62.5 100 80 19.2 125
A D 8 2 A 2.43 13.2 . . . . . .
A D 8 3 2.37 15.4 70 - 30 100 80 27.3 375
A D 8 3 A 2.3 17.9 . . . . . . . A D 8 4 2.64 5.7 35 10 55 95 90 33.2 450
Legend: O = bulk density, n = bulk porosity, Xeno. = xenotopic, Idio. = idiotopic, Hypi. = hypidiotopic.
mode of the global grain size distribution. The mean of the petrographic distribution is affected by the right tail of the global distribution, whereas the SEM measurements are concentrated around the mode of the global distribution. Therefore the mean grain size value that is found using the SEM measurements may better describe the most likely length of the critical crack.
4.2. Microstructure patterns
Three dolomite mosaic textures are characteristic to the studied dolomites. The three types may co- exist within a single sample in varying proportions
(see Table 1). The three types are defined below following the classification of Tucker and Wright (1990).
(1) Non-planar xenotopic mosaic texture, in which most dolomite crystals are anhedral rhombs charac- terized by irregular inter-crystalline boundaries, em- bedded in a fine-grained matrix of either dolomite or calcite. A SEM photograph of this texture is shown in Fig. 2a. This microstructure typically exhibits medium to low bulk porosity (2% < n < 10%).
(2) Planar idiotopic mosaic texture where most dolomite crystals are euhedral rhombs (Fig. 2b). This microstructure typically exhibits high bulk porosity (10% < n < 21%).
150 Y. H. Hatzor et al./Tectonophysics 281 (1997) 141-161
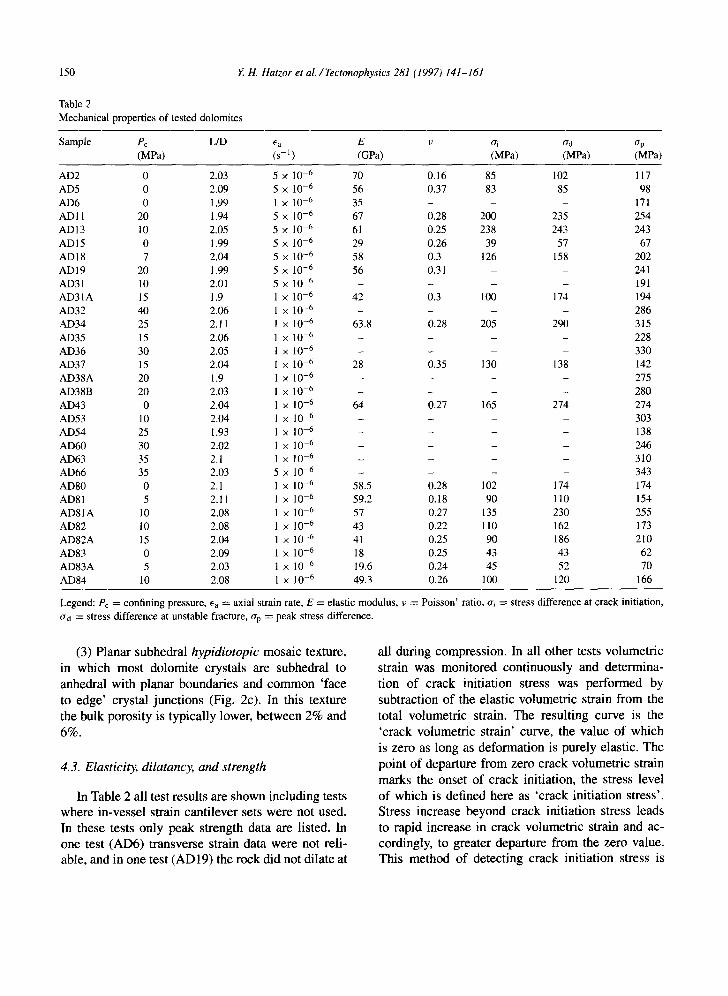
Table 2 Mechanical properties of tested dolomites
Sample Pc L/D Ea E v tr i era ap (MPa) (s-1 ) (GPa) (MPa) (MPa) (MPa)
AD2 0 2.03 5 × 10 -6 70 0.16 85 102 117 AD5 0 2.09 5 x 10 -6 56 0.37 83 85 98 AD6 0 1.99 1 × 10 -6 35 - - - 171 ADI I 20 1.94 5 x 10 -6 67 0.28 200 235 254 AD13 10 2.05 5 x 10 -6 61 0.25 238 243 243 ADI5 0 1.99 5 × 10 -6 29 0.26 39 57 67 ADI8 7 2.04 5 x 10 -6 58 0.3 126 158 202 ADI9 20 1.99 5 x 10 -6 56 0.31 - - 241 AD31 10 2.01 5 x 10 -6 . . . . 191 AD31A 15 1.9 1 × 10 -6 42 0.3 100 174 194 AD32 40 2.06 1 × 10 -6 . . . . 286 AD34 25 2.11 1 x 10 -6 63.8 0.28 205 290 315 AD35 15 2.06 1 x 10 -6 . . . . 228 AD36 30 2.05 1 x 10 -6 . . . . 330 AD37 15 2.04 1 x l0 -6 28 0.35 130 138 142 AD38A 20 1.9 1 x l0 -6 . . . . 275 AD38B 20 2.03 1 x 10 -6 . . . . 280 AD43 0 2.04 l × 10 -6 64 0.27 165 274 274 AD53 l0 2.04 1 x l0 -6 . . . . 303 AD54 25 1.93 l x l0 -6 . . . . 138 AD60 30 2.02 1 x 10 -6 . . . . 246 AD63 35 2.1 1 × 10 -6 . . . . 310 AD66 35 2.03 5 × 10 -6 . . . . 343 AD80 0 2.1 l x 10 -6 58.5 0.28 102 174 174 AD81 5 2.11 1 x 10 -6 59.2 0.18 90 110 154 AD81A 10 2.08 1 x 10 -6 57 0.27 135 230 255 AD82 10 2.08 1 × 10 -6 43 0.22 110 162 173 AD82A 15 2.04 1 × 10 -6 41 0.25 90 186 210 AD83 0 2.09 1 × 10 -6 18 0.25 43 43 62 AD83A 5 2.03 1 × 10 6 19.6 0.24 45 52 70 AD84 10 2.08 1 × 10 -6 49.3 0.26 100 120 166
Legend: Pc = confining pressure, ea = axial strain rate, E = elastic modulus, v = Poisson' ratio, cq ----- stress difference at crack initiation, trd = stress difference at unstable fracture, trp = peak stress difference.
(3) P l a n a r s u b h e d r a l hypidiotopic m o s a i c t e x t u r e ,
in w h i c h m o s t d o l o m i t e c r y s t a l s a r e s u b h e d r a l to
a n h e d r a l w i t h p l a n a r b o u n d a r i e s a n d c o m m o n ' f a c e
to e d g e ' c r y s t a l j u n c t i o n s (F ig . 2c) . I n t h i s t e x t u r e
t h e b u l k p o r o s i t y i s t y p i c a l l y l o w e r , b e t w e e n 2 % a n d
6 % .
4.3. Elasticity, dilatancy, and strength
I n T a b l e 2 a l l t e s t r e s u l t s a r e s h o w n i n c l u d i n g t e s t s
w h e r e i n - v e s s e l s t r a i n c a n t i l e v e r s e t s w e r e n o t u s e d .
I n t h e s e t e s t s o n l y p e a k s t r e n g t h d a t a a r e l i s t ed . I n
o n e t e s t ( A D 6 ) t r a n s v e r s e s t r a i n d a t a w e r e n o t r e l i -
a b l e , a n d in o n e t e s t ( A D 1 9 ) t h e r o c k d i d n o t d i l a t e at
a l l d u r i n g c o m p r e s s i o n . I n a l l o t h e r t e s t s v o l u m e t r i c
s t r a i n w a s m o n i t o r e d c o n t i n u o u s l y a n d d e t e r m i n a -
t i o n o f c r a c k i n i t i a t i o n s t r e s s w a s p e r f o r m e d b y
s u b t r a c t i o n o f t h e e l a s t i c v o l u m e t r i c s t r a i n f r o m t h e
t o t a l v o l u m e t r i c s t r a i n . T h e r e s u l t i n g c u r v e is t h e
' c r a c k v o l u m e t r i c s t r a i n ' c u r v e , t h e v a l u e o f w h i c h
is z e r o as l o n g a s d e f o r m a t i o n is p u r e l y e l a s t i c . T h e
p o i n t o f d e p a r t u r e f r o m z e r o c r a c k v o l u m e t r i c s t r a i n
m a r k s t h e o n s e t o f c r a c k i n i t i a t i o n , t h e s t r e s s l eve l
o f w h i c h is d e f i n e d h e r e a s ' c r a c k i n i t i a t i o n s t r e s s ' .
S t r e s s i n c r e a s e b e y o n d c r a c k i n i t i a t i o n s t r e s s l e a d s
to r a p i d i n c r e a s e i n c r a c k v o l u m e t r i c s t r a i n a n d a c -
c o r d i n g l y , to g r e a t e r d e p a r t u r e f r o m t h e z e r o v a l u e .
T h i s m e t h o d o f d e t e c t i n g c r a c k i n i t i a t i o n s t r e s s is

Y H. Hatzor et al./Tectonophysics 281 (1997) 141-161 151
reviewed in greater detail for example by Martin and Chandler (1994).
The elastic constants required for the calculation of the elastic volumetric strain were determined for each sample using linear regression performed on the linear segment of the stress-strain curve. The in- fluence of confining pressure on the elastic constants was ignored here. The values of the elastic modulus were measured in the range between 18 GPa<70 GPa with an average modulus value of 49 + 15 GPa. Poisson ratio values have a range of 0.16 < v < 0.35 with an average value of 0.27 + 0.05. Crack initiation stress is found a t o - i / u p = 0.66 + 0.14. These val- ues are significantly higher than the values reported by Martin and Chandler (1994) for granite (0.4~rp). Unstable cracking was found at ~rd/Op = 0.87 ± 0.1, close to the value reported by Martin and Chandler (1994) for granite (0.8Op). Note that in some cases unstable crack growth and peak stress were attained coincidentally (Table 2). Unconfined compressive strength values have a range of 62 MPa<cr~<274 MPa with an average value of cr~ = 143 ± 75 MPa. The great scatter is due to the influence of mi- crostructure. Two representative stress-strain curves of triaxial tests under equal confining pressure (10 MPa) for two samples of similar mean grain size but different bulk porosity are shown in Fig. 4. The influence of bulk porosity on strength is evident from inspection of these two curves, since all other parameters are equal.
In the next two sections the applicability of em- pirical and analytical criteria for failure, and the in- fluence of microstructure on strength, are discussed.
250
~ 2 0 0 g
E 150
~ 100
0 (a)
200
g 15o
100 e~
50
e L
0 (b)
~ . l l l l
.: 'v,:'2:2 , . .
0 0.2 0.4 0.6 0.8 1 1.2 1.4 1.6 Axial Strain (%)
= 1 ~, 1 [ i
o 2 0 4 e ~ o s o i a o 12o 14o
i I 4 i i I b I 4 I i i ~ I ~ I
0.2 0.4 0.6 0.8 1 1.2 1.4 1.6 Axial Strain (%)
Fig. 4. Stress-strain curves for two samples of Aminadav dolomite, both of which are characterized by predominantly hypidiotopic mosaic texture: (a) sample AD13 of low porosity (n = 3.6%) and high mean grain size (dm : 67.5/Zm); (b) sam- ple AD82 of medium porosity (n = 10%) and low mean grain size (rim = 25 .4#m) .
5. Applicability of failure criteria
5.1. Applicability of ultimate strength criteria
The most popular ultimate strength criterion for rock is the empirical Coulomb-Mohr failure crite- rion in which shear stress is given by two material properties: cohesion, and a poorly defined 'internal' friction angle. This failure criterion can be presented graphically using either shear and normal stresses, or principal stresses. More modem empirical failure criteria for rock, including Hoek and Brown (1980) and Bieniawski (1974) criteria, are scaled by the value of the unconfined compressive strength, which
is assumed to be a material property, and require the use of one or two empirical constants, respectively. The analytical criterion of Griffith (1924) for failure in compression requires the unconfined compressive strength as the only necessary material property. Since the scatter of unconfined compressive strength values is found to be quite high in this study (Table 2) it is difficult to test the predictive capabilities of these criteria, since a single representative uncon- fined compressive strength value must be defined. In order to find 'representative' values, a regression for a Coulomb-Mohr criterion was performed using all test results and the following material properties were determined (Fig. 5): cohesion c = 30 MPa;
152 Y H. Hatzor et al./Tectonophysics 281 (1997) 141-161
400 • Coulomb - Mohr
_ j Hoek& Brown 3SO
• • Bieniawski
Gri~th
200 ~ ~ 160 l:i!
0
O
F - I I I I I I [
5 10 15 20 25 30 35 40
Confining Pressure (MPa)
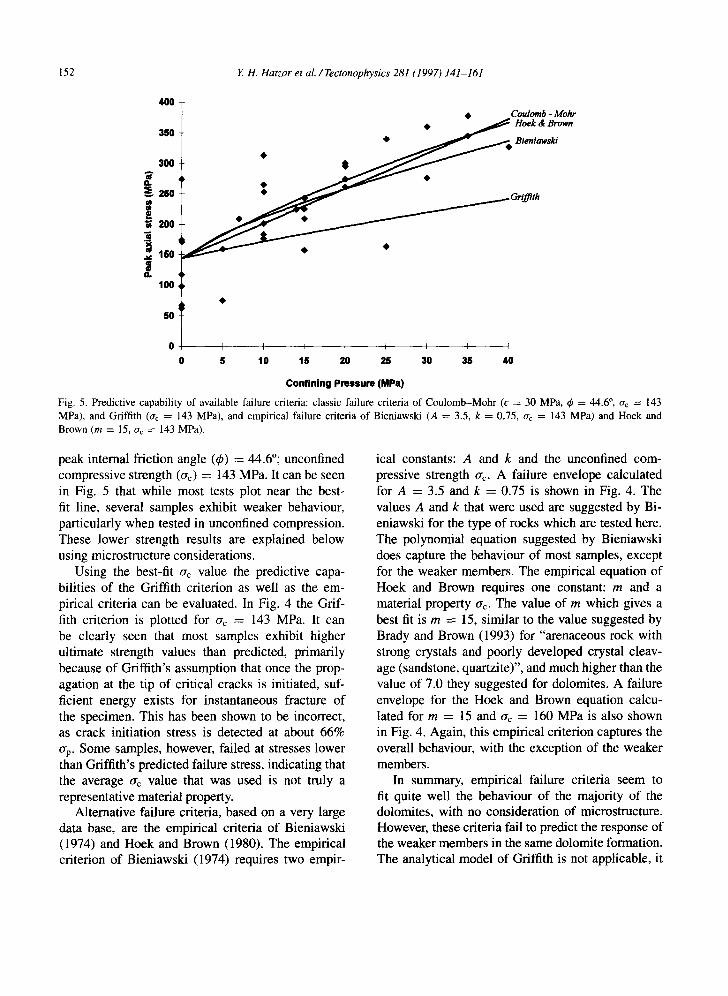
Fig. 5. Predictive capabil i ty of available failure criteria: classic failure criteria of C o u l o m b - M o h r (c = 30 MPa, ~b = 44.6 °, trc = 143
MPa), and Griffith (ac = 143 MPa), and empirical failure criteria of Bieniawski (A = 3.5, k = 0.75, cr c -- 143 MPa) and Hoek and
Brown (m = 15, ~rc ----- 143 MPa).
peak internal friction angle (40 = 44.6°; unconfined compressive strength (~rc) = 143 MPa. It can be seen in Fig. 5 that while most tests plot near the best- fit line, several samples exhibit weaker behaviour, particularly when tested in unconfined compression. These lower strength results are explained below using microstructure considerations.
Using the best-fit Crc value the predictive capa- bilities of the Griffith criterion as well as the em- pirical criteria can be evaluated. In Fig. 4 the Grif- fith criterion is plotted for ~rc = 143 MPa. It can be clearly seen that most samples exhibit higher ultimate strength values than predicted, primarily because of Griffith's assumption that once the prop- agation at the tip of critical cracks is initiated, suf- ficient energy exists for instantaneous fracture of the specimen. This has been shown to be incorrect, as crack initiation stress is detected at about 66% Crp. Some samples, however, failed at stresses lower than Griffith's predicted failure stress, indicating that the average trc value that was used is not truly a representative material property.
Alternative failure criteria, based on a very large data base, are the empirical criteria of Bieniawski (1974) and Hoek and Brown (1980). The empirical criterion of Bieniawski (1974) requires two empir-
ical constants: A and k and the unconfined com- pressive strength trc. A failure envelope calculated for A = 3.5 and k = 0.75 is shown in Fig. 4. The values A and k that were used are suggested by Bi- eniawski for the type of rocks which are tested here. The polynomial equation suggested by Bieniawski does capture the behaviour of most samples, except for the weaker members. The empirical equation of Hoek and Brown requires one constant: m and a material property ac. The value of m which gives a best fit is m --- 15, similar to the value suggested by Brady and Brown (1993) for "arenaceous rock with strong crystals and poorly developed crystal cleav- age (sandstone, quartzite)", and much higher than the value of 7.0 they suggested for dolomites. A failure envelope for the Hoek and Brown equation calcu- lated for m = 15 and trc = 160 MPa is also shown in Fig. 4. Again, this empirical criterion captures the overall behaviour, with the exception of the weaker members.
In summary, empirical failure criteria seem to fit quite well the behaviour of the majority of the dolomites, with no consideration of microstructure. However, these criteria fail to predict the response of the weaker members in the same dolomite formation. The analytical model of Griffith is not applicable, it
Y H. Hatzor et al./Tectonophysics 281 (1997) 141-161 153
underestimates the strength of the majority of the samples, yet it over estimates the strength of the weaker members.
5.2. Applicability of fracture initiation criteria
An analytical fracture initiation criterion for rock under compression was proposed by Ashby and Hal- lam (1986) (Eq. 2 above) for a critically oriented crack using fracture mechanics and assuming the sliding crack model and a mode I stress intensity fac- tor (Kit). If we assume that a grain boundary func- tions as a potential Griffith flaw, then a correlation would be expected between the calculated flaw size (2a) at crack initiation stress (ai) by the analytical model, and the critical grain size in a given sample. We have argued above that the most likely grain size is represented by the mean of the grain size distribution measured using SEM, whereas stress concentrations are highest at the tip of the largest flaw in a given sample, provided it is appropriately oriented. It is difficult, however, to predict whether crack propagation will ensue from the tip of the most likely or the longest crack.
A comparison between model prediction of crit- ical flaw length, and actual measurement of most likely and longest crack, is performed here for all tests for which a crack initiation stress was in- ferred (19 tests, Table 2). A stress intensity factor of 1.8 MPa m °5 was assumed using experimental data for dolomite published by Atkinson and Meredith (1987), and a friction coefficient of 0.98 was used, assuming the mean friction angle value found in this study (Fig. 5). The results of the comparison between the calculated flaw size at crack initiation stress and the observed mean and maximum grain size are shown in Fig. 6a and b, respectively. Clearly there is no correlation between calculated and mea- sured values. The measured mean grain size values (using SEM) range between 10 and 50 #m, and the measured maximum grain size values (using petro- graphic microscope) range between 35 and 1,500 /zm. The range of required flaw size for initiation, under the measured crack initiation stress and the as- sumed Klc value, is between 780 and 95,000/zm, as- suming the Ashby and Hallam model. Although the analytical model attempts to give a rough estimate under simplifying assumptions, the discrepancies are
too severe, and amount to a difference between pre- dicted and measured values of up to three orders of magnitude.
According to the analytical model prediction frac- ture should ensue at much higher stresses than ob- served. That would have been the case had fracture been controlled by stress concentrations at the tip of critically oriented grain boundaries only. In fact, the rock is much weaker, and fracture propagation and growth ensues at much lower stress levels than predicted. It is suggested therefore that other pro- cesses control fracture initiation and propagation, the mechanisms of which are influenced to a large extent by micro-crystalline arrangement. The influence of microstructure on mechanical behaviour is examined in the next section.
6. The influence of microstructure on mechanical strength
6.1. The influence of grain size
Several investigators have shown that for a variety of sedimentary rocks a correlation between mean grain size and ultimate strength exists, either a linear correlation with the inverse square root of the mean grain size (Olsson, 1974; Fredrich et al., 1990), or negative exponential with the mean value (e.g. Hugman and Friedman, 1979; Wong et al., 1995).
In Fig. 7 maximum (petrographic microscope) and mean (SEM) grain size values are plotted against stress difference at crack initiation (~ri) and at ulti- mate strength (ap). It can be seen that peak and crack initiation stresses are independent of the maxi- mum grain size in the specimen (Fig. 7a). This result supports our assumption that the likelihood that low frequency sizes are also properly oriented is quite low.
A weak dependence of crack initiation and peak stresses on mean grain size value is indicated by the results of this study (Fig. 7b). The existing, albeit weak, correlation supports our assumption that mean grain size values captured by SEM observations are more likely to function as critical cracks in the samples. This result is in general agreement with the earlier studies mentioned above. However, the weak correlation suggests that additional geometric factors must be considered. The most obvious in the case

154 E H. Hatzor et al./Tectonophysics 281 (1997) 141-161
i o
,=., w g m
o )
0 g:
l
60
45
4O
35 •
3O
2S
2 0 •
1 5
1 0
5
0 - -
0
I g lc : l.S MPa m 1/2 I
I I I I I I t
t0000 20000 30000 40000 60000 60000 70000
C a l c u l a t e d Initial Flaw Length ( m i c r o m e t e r )
t I 80000 90000
(a) J
10000O
S 1400 qp
E 2 .~ 1200
1- 1000
C~
e 800
w c 600
o E 4OO
E "~ 200
gtc = 1.8 MPa m ~'~ ]
1OOOO
I I I I t - - I I
20000 30000 40000 50000 60000 70000 80000
C a l c u l a t e d Initial Flaw Length ( m i c r o m e t e r )
(b)
I I
Fig. 6. Comparison between critical flaw size at crack initiation stress using the initiation criterion of Ashby and Hallam (1986), and the observed grain size in this study: (a) comparison with mean grain size (SEM observations); (b) comparison with maximum grain size (petrographic thin sections).
of the studied dolomites are porosity and mosaic texture, the influence of which are explored below.
It should be noted that better correlation exists between mean grain size and crack initiation stress (R 2 = 0.09, power law) than between mean grain size and ultimate stress (R 2 = 0.02, power law). This result is to be expected. The theoretical basis for the correlation between strength and grain size is
Griffith's fracture criteria which can be generalized in the following form (Atkinson, 1987):
K = r ~ (3)
where K is a general stress intensity factor, tr is the remote applied stress, Y is a numerical modification factor which accounts for crack geometry, loading conditions and edge effects, and c is half crack

Y. H. Hatzor et al./Tectonophysics 281 (1997) 141-161 155
350
300
260 G.
." 2oo c
150
w
1 0 0
60
[] []
D []
[] O
[] [] O0 0
[] 0
[]
O
I
0 200
g
[] []
O el 4,
B 0
[]
[] []
[ ]
0.
I [ I [ I I
400 600 800 1000 1200 1400
M a x i m u m G r a i n S i z e ( m i c r o m e t e r )
(a) I
1 6 0 0
350
300
260 o.
200 r- E
150 tn
rn 100
60
i:o:, o [] []
[] []
~ [ ] 0 0 []
• .
(b) I I I I I I I
0 10 20 30 40 50 60 7 0
M e a n G r a i n S i z e ( m i c r o m e t e r )
Fig. 7. Correlation between stress difference and grain size: (a) maximum grain size measured using petrographic microscope, (b) mean grain size measured using SEM. Legend: <> = stress difference at crack initiation (cri); [] = peak stress difference (crp).
length. In this criterion stress intensity is directly proportional to the square root of the initial flaw size, and hence the expected correlation between strength and grain size. This criterion, however, is formulated for initiation, a process that has been shown here to take place at about 66% of the maximum stress level. The value of the remote stress at failure, the ultimate stress level, must be influenced by fracture
growth and interaction processes which are ignored in Eq. 3.
6.2. The influence of porosity
The influence of bulk porosity on strength in sand- stone was discussed by Dunn et al. (1973) and Scott and Nielsen (1991), and the prediction of porosity

156 Y H. Hatzor et aL /Tectonophysics 281 (1997) 141-161
using seismic velocities was discussed by Vernik and Nur (1992), among others. Vemik et al. (1993) have developed empirical criteria for shear strength of siliciclastic rocks using results of unconfined and tri- axial compression tests with porosity data from sedi- mentary basin rock lithologies. The inverse relation- ship between bulk porosity and ultimate strength has been noted by all studies mentioned above, which were focused on reservoir source rocks: siliciclastics and pure sandstones.
In this research the influence of porosity on crys- talline dolomites with varying microstructures is studied. The three microstructures (Fig. 2) typically appear together in a given sample at varying propor- tions (Table 1). The fabric-dependent intergranular porosity can be used as a scaling parameter for this proportion. In idiotopic mosaic texture, where indi- vidual grains are embedded in a matrix, or fill voids (Fig. 2b), the intergranular porosity is expected to be at the high extreme. In hypidiotopic mosaic, where compromise boundaries between adjacent grains are common (Fig. 2c), the intergranular porosity is ex- pected to be at the lower end. Therefore, as in- tergranular porosity values decrease, the specimen is expected to exhibit greater proportions of hypid- iotopic texture. It could be argued (see Section 7) that fracture propagation requires higher stresses with increasing proportion of hypidiotopic texture, due to common edge to face junctions. If this as- sumption is correct, than strength and intergranular porosity should be inversely related. The micropores which are not fabric-dependent, the vugs (Fig. 3), may function as stress concentrators, and ultimate stress at fracture should be inversely related to their diameter (see for example the analytical solution of Sammis and Ashby, 1986).
In this research the bulk porosity is measured and no quantitative distinction is made here between fab- ric-dependent and fabric-independent porosity. Such a distinction however is not essential because both types of porosity, the sum of which is represented by the value of the bulk porosity, have similar effects on rock strength.
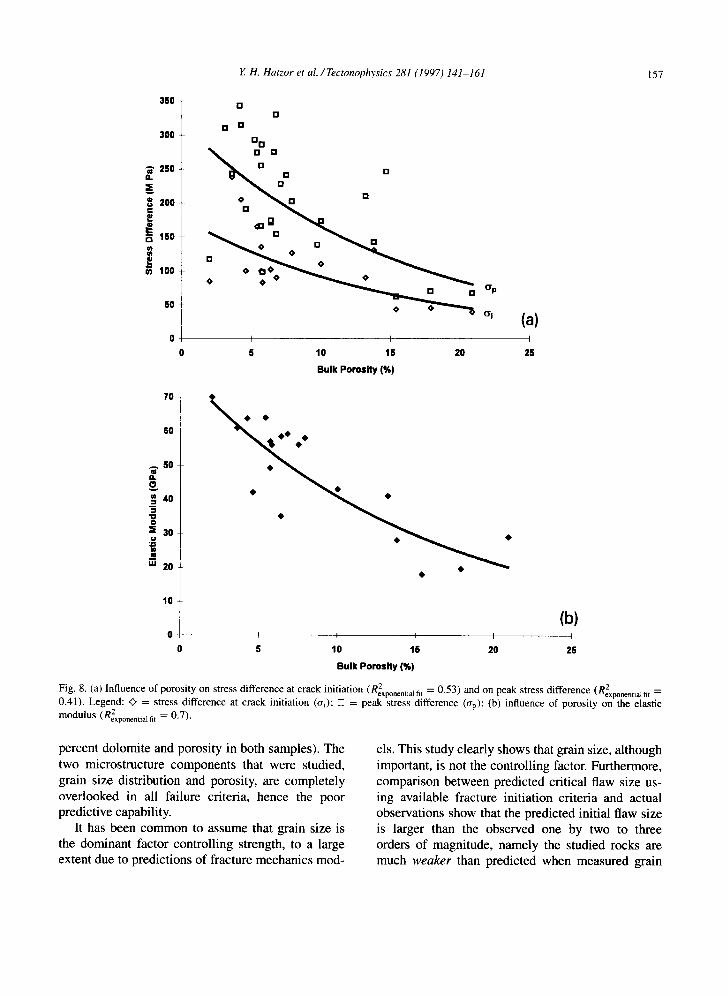
In Fig. 8a the relationship between stress differ- ence and porosity is shown at crack initiation and ultimate stress. The expected inverse relationship between strength and porosity is confirmed by the results, and as in the case of grain size, the data
set for crack initiation stress yields a higher cor- relation coefficient for exponential fit (R2 = 0.53; R 2 = 0.41). O'p
The bulk porosity has a pronounced effect on the elastic response of the rock. In Fig. 8b porosity values are plotted against the elastic modulus for all tests where axial displacement was monitored directly on the sample (19 tests). The inverse rela- tionship between Young's modulus and porosity is quite clear 2 (Rexp.fit = 0.7). This relationship proba- bly reflects the proportional increase in compressible cement with respect to incompressible crystals, as porosity is increased.
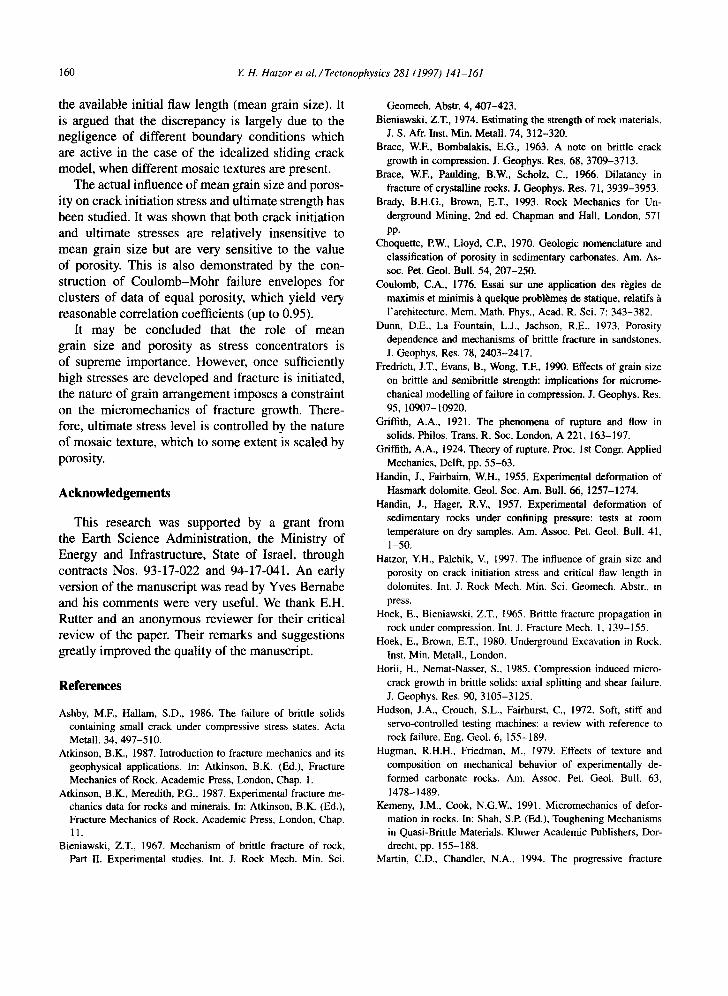
Finally, bulk porosity can be used to re-exam- ine the ultimate strength results which were ob- tained in this study and discussed above. In Fig. 9 peak axial stress is plotted against confining pres- sure in a typical ~rl, or3 space. The data are clus- tered into four groups of similar porosity values and two linear regression lines are plotted, for medium porosity (6.6% < n < 9.7%) and high porosity (9.7% < n < 21%). The linear regression for these two groups yields reasonable correlation coefficients,
2 Rl2wporosity = 0.95 and Rhighporosity = 0.74, respec- tively. The relatively high correlation coefficients calculated for correlation with bulk porosity, in com- parison to correlation with mean grain size, indicate that failure of polycrystalline dolomites is more in- fluenced by variations in bulk porosity than in mean grain size.
7. Discussion
In the previous sections it has been shown that grain size and porosity influence the mechanical behaviour of a polycrystalline aggregate such as dolomite. It has been shown that ultimate strength in such rocks is not a simple function of classical material properties such as cohesion and internal friction angle, as suggested by the linear Mohr- Coulomb failure criterion (Fig. 4). Neither can ul- timate strength be predicted using a representative unconfined compressive strength value (crc) as sug- gested by the Griffith criterion and the investigated empirical criteria (Fig. 4), because ~rc is not a true material property; within the same dolomite forma- tion ac values were shown to vary by a factor of 2.8 (compare AD5 and AD43 in Table 2 with similar
Y. H. Hatzor et al./Tectonophysics 281 (1997) 141-161 157
350
300
250
i 200 []
[]
SO ° ° ~ oi
0 ~ I I I 0 5 10 15 20
Bulk Porosity (%)
(a) I
25
70
60
A SO
_~ 40
"o o :S 30
" ' 20
10
t
I I I I
(b) i
0 S 10 15 20 25
Bulk Porosity (%)
Fig. 8. (a) Influence of porosity on stress difference at crack init iat ion (Re2x nentialfit = 0.53) and on peak stress difference (Reex nentialfit po po • = 0.41). Legend: ~ = stress difference at crack initiation (oi); [] = peak stress difference (Crp): (b) influence of porosity on the elastic
2 modulus (Rexponentia I fit = 0.7).
percent dolomite and porosity in both samples). The two microstructure components that were studied, grain size distribution and porosity, are completely overlooked in all failure criteria, hence the poor predictive capability.
It has been common to assume that grain size is the dominant factor controlling strength, to a large extent due to predictions of fracture mechanics mod-
els. This study clearly shows that grain size, although important, is not the controlling factor. Furthermore, comparison between predicted critical flaw size us- ing available fracture initiation criteria and actual observations show that the predicted initial flaw size is larger than the observed one by two to three orders of magnitude, namely the studied rocks are much weaker than predicted when measured grain

158 Y H. Hatzor et al./Tectonophysics 281 (1997) 141-161 450
4O0
350
~ 300
250
200
160
lOO
50
0
• L°w porosity I I ~ • •
~ Highporosity
X
J I I I I I I I
5 10 15 20 25 30 35 40
Confining Pressure, MPa
• n>2% • n >5% • n>6.6% X n > l O % - - L i n m r ( n > l O % ) ...... Llrtear (n > 6.6 %)
Fig. 9. Coulomh-Mohr failure envelopes for dolomites of varying porosity: low porosity (n < 6.6%), medium porosity (6.6% < n < 10%), high porosity (n > 10%). Linear regression coefficients: R 2 = 0.95; 2 (n<6.6%) R(n>10% ) = 0.74.
size is used as the initial flaw size. This discrepancy indicates the importance of other geometric factors which comprise rock fabric. It has been shown that porosity has a greater effect on the elastic response, fracture initiation, and ultimate stresses, than the value of the mean grain size.
The discrepancies between conventional fracture initiation and failure criteria and actual observations can be explained if we consider two alternative frac- ture propagation mechanisms, which depend upon mosaic texture, and are qualitatively discussed be- low:
(1) Inter-crystalline fracture propagation, in which fractures propagate between crystal bound- aries, is expected to be dominant in idiotopic and xenotopic mosaic textures (Fig. 2a and b). In this mechanism a grain boundary which is properly aligned with respect to the major principal stress direction is the initial flaw, as in the case of the sliding crack model. When the developed shear stresses across the inclined plane are greater than its shear strength, the fracture propagates between grain boundaries, a process which requires relatively low mechanical energy. An example of such a frac- ture is shown in Fig. 10a, which was photographed
from the vicinity of the failure zone in a sample which experienced failure under a confining pressure of 10 MPa (sample AD13).
(2) lntra-crystalline propagation, in which crack propagation is enabled only by splitting fracture through neighbouring crystals, is expected to be dominant in hypidiotopic textures (Fig. 2c). In this mechanism the initial flaw is an inclined plane of a crystal boundary which is embedded in an adjoining crystal mass. When the developed shear stresses across this plane are greater than its shear strength, propagation is induced. However, in order for the crack to propagate through the surrounding mass, the stress concentration at its tip must overcome the fracture toughness of the intact dolomite crystal, a process which requires relatively high mechanical energy. An example of an intracrystalline fracture is shown in Fig. 10b, a SEM photograph from the vicinity of the failure zone of sample AD53 which was tested under a confining pressure of 10 MPa.
We have seen that at least three microstructure pa- rameters control the failure of dolomites. The mean grain size length and the mean pore diameter con- trol the magnitude of stress concentrations at the tip of the leading cracks. The mosaic texture controls

Y. H. Hatzor et al./Tectonophysics 281 (1997) 141-161 159
proportional to porosity and mean grain size, and that only in the extreme case of low porosity-low grain size does the initial flaw length coincides with the mean grain size of the rock.
While empirical models for fracture initiation stress as a function of both porosity and grain size can be developed, predicting ultimate strength is much more difficult. The difficulty stems from the fact that ultimate stress is attained after complex fracture propagation processes, which highly depend upon mosaic texture, take place. Yet as has been shown (see Table 1), the mosaic texture is not con- stant in a given rock and could vary from place to place in a given specimen. However, it has been shown here that using bulk porosity values (Fig. 9) the value of ultimate stress can be estimated reason- ably well.
Fig. 10. Two fracture propagation mechanisms in crystalline dolomites: (a) inter-crystalline fracture propagation, typically observed in xenotopic mosaic texture; (b) intra-crystalline frac- ture propagation mechanism, typically detected in hypidiotopic mosaic texture.
the required fracture initiation stress and the fracture propagation mechanism. Hatzor and Palchik (1997) developed an empirical model for fracture initiation stress as composite function of both porosity and mean grain size, using an assumption that porosity scales mosaic texture. They have shown empirically that fracture initiation stress is inversely related to both mean grain size and porosity. They have found that the influence of grain size on crack initiation stress is more pronounced in low-porosity than in high-porosity rocks, and that the influence of poros- ity on crack initiation stress is more pronounced in rocks of low grain size. Furthermore, they have shown analytically that the initial flaw length is also
8. Summary and conclusions
The influence of microstructure on the mechanical behaviour of dolomites has been studied, particularly the effect of grain size and porosity on crack ini- tiation stress and ultimate strength. The same type of grain size distribution was calculated from pet- rographic analysis and SEM observations, and is typically of the form of a negative exponential. It is argued that the initial length of the critical flaw in the sample is most likely represented by the mean rather than the maximum of the distribution, and therefore mean grain size is used to scale initial flaw length. Three mosaic textures are identified, xenotopic, id- iotopic, and hypidiotopic, all of which may co-exist in a single specimen at varying proportions.
The predictive capability of empirical failure cri- teria is shown to be quite weak, and it is argued that this is because fabric constraints are ignored. Similarly the modified Griffith criterion for failure is not applicable because it uses unconfined compres- sive strength as a constant material property, which is shown here to be highly dependent upon fabric.
Analytical model predictions for crack initiation stress are used inversely to find the critical flaw length in the sample, when crack initiation stress is used as the remote stress input. It is found that the predicted critical flaw length is larger by one to two orders of magnitude than the observed, namely, the rocks fail at lower remote stresses than required by
160 Y H. Hatzor et al./Tectonophysics 281 (1997) 141-161
the available initial flaw length (mean grain size). It is argued that the discrepancy is largely due to the negligence of different boundary conditions which are active in the case of the idealized sliding crack model, when different mosaic textures are present.
The actual influence of mean grain size and poros- ity on crack initiation stress and ultimate strength has been studied. It was shown that both crack initiation and ultimate stresses are relatively insensitive to mean grain size but are very sensitive to the value of porosity. This is also demonstrated by the con- struction of Coulomb-Mohr failure envelopes for clusters of data of equal porosity, which yield very reasonable correlation coefficients (up to 0.95).
It may be concluded that the role of mean grain size and porosity as stress concentrators is of supreme importance. However, once sufficiently high stresses are developed and fracture is initiated, the nature of grain arrangement imposes a constraint on the micromechanics of fracture growth. There- fore, ultimate stress level is controlled by the nature of mosaic texture, which to some extent is scaled by porosity.
Acknowledgements
This research was supported by a grant from the Earth Science Administration, the Ministry of Energy and Infrastructure, State of Israel, through contracts Nos. 93-17-022 and 94-17-041. An early version of the manuscript was read by Yves Bemabe and his comments were very useful. We thank E.H. Rutter and an anonymous reviewer for their critical review of the paper. Their remarks and suggestions greatly improved the quality of the manuscript.
References
Ashby, M.E, Hailam, S.D., 1986. The failure of brittle solids containing small crack under compressive stress states. Acta Metall. 34, 497-510.
Atkinson, B.K., 1987. Introduction to fracture mechanics and its geophysical applications. In: Atkinson, B.K. (Ed.), Fracture Mechanics of Rock. Academic Press, London, Chap. 1.
Atkinson, B.K., Meredith, P.G., 1987. Experimental fracture me- chanics data for rocks and minerals. In: Atkinson, B.K. (Ed.), Fracture Mechanics of Rock. Academic Press, London, Chap. 11.
Bieniawski, Z.T., 1967. Mechanism of brittle fracture of rock, Part II. Experimental studies. Int. J. Rock Mech. Min. Sci.
Geomech. Abstr. 4, 407-423. Bieniawski, Z.T., 1974. Estimating the strength of rock materials.
J. S. Afr. Inst. Min. Metall. 74, 312-320. Brace, W.E, Bombalakis, E.G., 1963. A note on brittle crack
growth in compression. J. Geophys. Res. 68, 3709-3713. Brace, W.E, Paulding, B.W., Scholz, C., 1966. Dilatancy in
fracture of crystalline rocks. J. Geophys. Res. 71, 3939-3953. Brady, B.H.G., Brown, E.T., 1993. Rock Mechanics for Un-
derground Mining, 2nd ed. Chapman and Hall, London, 571
PP. Choquette, P.W., Lloyd, C.P., 1970. Geologic nomenclature and
classification of porosity in sedimentary carbonates. Am. As- soc. Pet. Geol. Bull. 54, 207-250.
Coulomb, C.A., 1776. Essai stir une application des r~gles de maximis et minimis ~t quelque probl~mes de statique, relatifs l'architecture. Mem. Math. Phys., Acad. R. Sci. 7: 343-382.
Dunn, D.E., La Fountain, L.J., Jachson, R.E., 1973. Porosity dependence and mechanisms of brittle fracture in sandstones. J. Geophys. Res. 78, 2403-2417.
Fredrich, J.T., Evans, B., Wong, T.E, 1990. Effects of grain size on brittle and semibrittle strength: implications for microme- chanical modelling of failure in compression. J. Geophys. Res. 95, 10907-10920.
Griffith, A.A., 1921. The phenomena of rupture and flow in solids. Philos. Trans. R. Soc. London, A 221, 163-197.
Griffith, A.A., 1924. Theory of rupture. Proc. 1st Congr. Applied Mechanics, Delft, pp. 55-63.
Handin, J., Fairbairn, W.H., 1955. Experimental deformation of Hasmark dolomite. Geol. Soc. Am. Bull. 66, 1257-1274.
Handin, J., Hager, R.V., 1957. Experimental deformation of sedimentary rocks under confining pressure: tests at room temperature on dry samples. Am. Assoc. Pet. Geol. Bull. 41, 1-50,
Hatzor, Y.H., Palchik, V., 1997. The influence of grain size and porosity on crack initiation stress and critical flaw length in dolomites. Int. J. Rock Mech. Min. Sci. Geomech. Abstr., in press.
Hoek, E., Bieniawski, Z.T., 1965. Brittle fracture propagation in rock under compression. Int. J. Fracture Mech. 1, 139-155.
Hoek, E., Brown, E.T., 1980. Underground Excavation in Rock. Inst. Min. Metall., London.
Horii, H., Nemat-Nasser, S., 1985. Compression induced micro- crack growth in brittle solids: axial splitting and shear failure. J. Geophys. Res. 90, 3105-3125.
Hudson, J.A., Crouch, S.L., Fairhurst, C., 1972. Soft, stiff and servo-controlled testing machines: a review with reference to rock failure. Eng. Geol. 6, 155-189.
Hugman, R.H.H., Friedman, M., 1979. Effects of texture and composition on mechanical behavior of experimentally de- formed carbonate rocks. Am. Assoc. Pet. Geol. Bull. 63, 1478-1489.
Kemeny, J.M., Cook, N.G.W., 1991. Micromechanics of defor- mation in rocks. In: Shah, S.P. (Ed.), Toughening Mechanisms in Quasi-Brittle Materials. Kluwer Academic Publishers, Dor- drecht, pp. 155-188.
Martin, C.D., Chandler, N.A., 1994. The progressive fracture

Y. 1t. Hatzor et al./Tectonophysics 281 (1997) 141-161 161
of Lac du Bonnet Granite. Int. J. Rock Mech. Min. Sci. Geomech. Abstr. 31,643-659.
McClintock, EA., Walsh, J.B., 1962. Friction of Griffith cracks in rocks under pressure. In: Proceedings of the U.S. National Congress on Applied Mechanics, 4th Vol. II. American Society of Mechanical Engineers, New York, pp. 1015-1021.
Myer, L.R., Kemeny, J., Cook, N.G.W., Suarez, R., Zheng, Z., 1992. Extensile cracking in porous rock under differential compressive stress. Applied Mech. Rev. 45 (8), 263-280.
Nemat-Nasser, S., Horii, H., 1982. Compression-induced nonpla- nar crack extension with application to splitting, exfoliation and rockburst. J. Geophys. Res. 87, 6805-6821.
Olsson, W.A., 1974. Grain size dependence of yield stress in marble. J. Geophys. Res. 79, 4859-4862.
Petch, N.J., 1953. The cleavage strength of polycrystals. J. Iron Steel Inst. 174, 25-28.
Sammis, C.G., Ashby, M.E, 1986. The failure of brittle porous solids under compressive stress state. Acta Metall. 34, 511- 526.
Sass, E., Katz, A., 1982. The origin of platform dolomites: new evidence. Am. J. Sci. 282, 1184-1213.
Scott, T.E., Nielsen, K.C., 1991. The effects of porosity on the brittle-ductile transition in sandstones. J. Geophys. Res. 96,
405-414. Tucker, M.E., 1988. Techniques in Sedimentology. Blackwell
Scientific Publications, Oxford, 394 pp. Tucker, M.E., Wright, V.P., 1990. Carbonate Sedimentology.
Blackwell Scientific Publications, Oxford, 482 pp. Vernik, L., Nur, A., 1992. Petrophysical classification of sili-
ciclastics for lithology and porosity prediction from seismic velocity. Am. Assoc. Pet. Geol. Bull. 9, 1295-1309.
Vernik, L., Buno, M., Bovberg, C., 1993. Empirical relations be- tween compressive strength and porosity of siliciclastic rocks. Int. J. Rock Mech. Sci. Geomech. Abstr. 30 (7), 677-680.
Weiss, L.E., Turner, EJ , 1972. Some observations of trans- lation gliding and kinking in experimentally deformed cal- cite and dolomite. In: Heard, H.C., Borg, I.Y., Carter, N.L., Raleigh, C.B. (Eds.), Flow and Fracture of Rocks. Am. Geo- phys. Union, Geophys. Monogr. 16, 95-108.
Wong, H.C., Chau, K.T., Wang, P. 1995. Microcracking in coarse and fine grain marbles. In: Daemmen, J.J.K., Schultz, R.A (Eds.), Rock Mechanics. Balkema, Rotterdam, pp. 477-482.
Zheng, Z., 1989. Compressive Stress-Induced Microcracks in Rocks and Applications to Seismic Anisotropy and Borehole Stability. Ph.D. Thesis, University of California, Berkeley.