microsoft word viewer - paper for pulse v1.0 final - ibm
TRANSCRIPT

i
IBM® Tivoli® Software
SmartCloud Monitoring - Capacity Planning ROI Case Study
Document version 1.0
Venkata Somisetty, Anindya Neogi (Ph.D.), Chris Nero

2
© Copyright International Business Machines Corporation 2012. US Government Users Restricted Rights – Use, duplication or disclosure restricted by GSA ADP Schedule Contract with IBM Corp.
SmartCloud Monitoring - Capacity Planning ROI Case Study
3
CONTENTS
List of Figures..................................................................................................................4
List of Tables...................................................................................................................5
Revision History ..............................................................................................................6
1 Optimization of an IBM Internal Development and Test Cloud using IBM SmartCloud Monitoring (SCM).........................................................................................7
2 Highlights.............................................................................................................7
3 Importance and Complexity of Capacity Planning ................................................7
4 The Cloud Environment .......................................................................................9
5 Aggregated Utilization Patterns..........................................................................10
6 Detailed Utilization Patterns ...............................................................................11
7 Capacity Planner Optimized Environment Plan Using Daily Average Utilization.12
8 Factors Leading to Memory Over Commit..........................................................13
9 What-if Analysis with Combinations of Headroom and Memory Over Commit....15
10 Cost Parameters Used For This Study...............................................................16
11 ROI Estimation Methods Used and ROI.............................................................18
12 Results and Conclusion .....................................................................................20
LIST OF FIGURES
Figure 1 Physical Server Summary ................................................................................................... 9
Figure 2 Virtual Machine Summary ................................................................................................... 9
Figure 3 CPU Utilization................................................................................................................... 10
Figure 4 Memory Utilization ............................................................................................................. 10
Figure 5 CPU and Memory Utilization ............................................................................................. 11
Figure 6 Capacity Planner Showing Daily Utilization....................................................................... 12
Figure 7 Factors Leading to Over commit Memory ......................................................................... 13
Figure 8 VMs Powered Off............................................................................................................... 14
Figure 9 Optimization Scenario #1 .................................................................................................. 15
Figure 10 Optimization Scenario #2 ................................................................................................ 16
Figure 11 Optimization Scenario #3 ................................................................................................ 16
Figure 12 ROI Method #1 ................................................................................................................ 18
Figure 13 ROI Method #2 ................................................................................................................ 19
Figure 14 ROI Method #1 ................................................................................................................ 20
Figure 15 ROI Method #2 ................................................................................................................ 21

SmartCloud Monitoring - Capacity Planning ROI Case Study
5
LIST OF TABLES
Table 1 Cost Parameters Used For The Study ............................................................................... 17

REVISION HISTORY
Date Version Revised By Comments
[date] [version] [initials] [comments]
3/1/2012 1.0 CN Released to SMC

7
1 Optimization of an IBM Internal Development and Test Cloud using IBM SmartCloud Monitoring (SCM)
In order to realize true cost savings to the business from a virtualization or cloud investment, administrators need to be able to run virtual machines densely yet be assured that performance is at least equal to what it was before virtualization while allowing capacity for VM growth. Optimizing workloads across clusters in datacenters and running the cloud environment at optimal efficiency while showing cost savings is a complex task. Cloud capacity planners need an interactive capacity analysis tool. This paper describes such a tool and the process.
2 Highlights
Goal: Study a virtual environment to further optimize and show ROI using a Capacity
Planner tool.
Solution: Use IBM SmartCloud Monitoring to analyze the current cloud environment and
do what-if analysis.
Results: The more optimized environment uses fewer servers, which results in savings in
hardware, administration/support, energy (green), datacenter floor space and licensing
costs resulting in an additional ROI of 14.2% over a year or the ability to accommodate an
additional 113 virtual machines.
3 Importance and Complexity of Capacity Planning
"Virtualization without good management is more dangerous than not using virtualization in the first place."
- Gartner Group
If it's not managed well, cloud infrastructure may not deliver its full value potential. In fact, it may even result in a negative investment.
Use of interactive capacity analysis tools to do what-if analysis helps to determine whether to over commit or under commit resources and to make recommendations

to optimize the environment. Recommendations on optimized workload placement may decrease energy and server costs while still meeting business and technical policies and demands.
Effective capacity planning can reduce hardware, administrative, energy, datacenter floor space, and software license costs by improving utilization and deferring purchases, while providing workload placement guidance. Customers spend 22% of their IT dollars on how to improve server density to reduce hardware and licensing costs. 5% of their IT dollars to reduce energy costs (fewer servers). Capacity Planning tools can help reduce these costs.
IBM SmartCloud Monitoring manages physical and virtual components of a private cloud infrastructure. It features Broad Hypervisor support, capacity planning analysis and reports, integrated Web 2.0 dashboards, support for physical server, storage and network elements and predictive thresholds. Built-in analytics and user-configurable policies to guide virtual machine placement allows cloud administrators to optimize hardware cost savings and model existing virtual workloads. SCM protects cloud investment by ensuring maximum efficiency in virtualization density while maintaining peak performance of virtualized workloads, benefitting total cost of ownership.

9
4 The Cloud Environment
This case study was done in an IBM internal development and test cloud. This analysis is limited to one single datacenter with one cluster consisting of 18 Servers and 1802 Virtual machines.
Figure 1 Physical Server Summary
Figure 2 Virtual Machine Summary
The physical server inventory report shows we have selected 18 physical servers in the current capacity planning session. The report contains a summary table of the servers and overall organizational graphical representations organized by hypervisor name/version.
The virtual machine inventory report shows we have 1802 VMs in the current capacity planning session. The report contains a summary table of the inventory and overall organizational graphical representations organized by datacenter/cluster, operating system name/version and middleware name/version.

5 Aggregated Utilization Patterns
The complex task of optimization requires insight into utilization patterns of workloads such as on which days of a week the workloads are being used and/or during which hours of a day. We analyzed the last three months data and looked at aggregated utilization of the top 20 VMs. We found CPU and Memory utilization were generally flat throughout the week with CPU utilization spiking on some VMs on some weekdays. To us, this suggests all days need to be considered while right sizing the VMs.
Figure 3 CPU Utilization
The utilization aggregated time series report presents aggregated time series data for the selected virtual machines and based on selected filtering criteria. This report helps to visualize peaks and valleys in the historical utilization as well as trending patterns. This information can be used to define utilization based constraints and generate a better utilization plan.
Figure 4 Memory Utilization

11
6 Detailed Utilization Patterns
We analyzed the last three months of detailed CPU and memory utilization data of ~100 VMs on a typical server in the cluster. The detailed utilization graphs show memory requirements are much higher than CPU.
The utilization detail time series report presents time series data for the selected virtual machines and on selected filtering criteria. The report helps capacity planners understand correlation between different virtual machines which can be used to define rules to place the correlated VMs on the same physical server or different physical server. This report also helps to identify any data gaps in the utilization data collected for the virtual machines
Figure 5 CPU and Memory Utilization

7 Capacity Planner Optimized Environment Plan Using Daily Average Utilization
After looking at the aggregated utilization patterns and detailed utilization data, we decided to generate an optimization plan, taking in to consideration the workloads are utilized throughout the day and on all days in a week (Note: The tool itself provides flexibility to generate plans based on maximum, average, minimum and 90th percentile of different levels of summarized data and selecting sustained peaks) and using default values of CPU and memory headroom of 10%.
The optimization plan report compares current resources utilized in the environment with optimized resources. Current and recommended values are displayed for total capacity, reservation, and spare CPU (GHZ) and memory (GB). Expected utilization is displayed before and after optimization.
The Capacity Efficiency Index (the numbers with the yellow background below) explain how efficiently we are using resources at the containers, such as hosts, clusters, and data centers, and overall across data centers. The measure is based on spare resources available at these multiple levels and the indices are provided at all levels.
The recommended optimization plan can be used for implementing changes, comparison with different plans to evaluate different optimization strategies. Later we will discuss the “What-If” analysis with different combinations of headroom and memory over commit.
In our case the recommendation shows that, based on historical usage data, we still need 18 servers in the recommended environment with 10% of CPU and Memory headroom. Monitoring agent reports showed 1426 out of 1802 VMs are active. The rest of them are powered off or do not have any utilization data.
Figure 6 Capacity Planner Showing Daily Utilization

13
8 Factors Leading to Memory Over Commit
Figure 7 Factors Leading to Over commit Memory
The optimization plan shows that on most of the servers memory is exhausted but there is still remaining CPU capacity. Since CPU utilization is low compared to memory utilization memory is the primary constraint.

ESX Servers use multiple memory optimization techniques such as:
• “de-duplication” (memory shared is blocks of memory which are identical between guest VMs on a host, and are de-duplicated),
• a “ballooning technique” which reclaims the pages considered least valuable by the operating system running in a virtual machine,
• an “idle memory tax” achieves efficient memory utilization while maintaining performance isolation guarantees,
• “content-based page sharing” and “hot I/O page remapping” exploit transparent page remapping to eliminate redundancy and reduce copying overheads.
These techniques are combined to efficiently support virtual machine workloads that over commit memory.
Figure 8 VMs Powered Off
The monitoring agent workspace shows quite a few VMs are powered off for longer periods suggesting they can be reclaimed or possibly converted to a template.
As >10% of VMs are powered off for longer periods and ESX Servers use multiple memory optimization techniques, we decided to run what-if analysis by over committing memory.

SmartCloud Monitoring - Capacity Planning ROI Case Study
15
9 What-if Analysis with Combinations of Headroom and Memory Over Commit
Scenario #1 – As shown above in Section 7 the optimization plan using default values for CPU and Memory leaving headroom of 10% for each. Monitoring agent reports showed 1435 out of 1802 VMs are active and the rest of them are powered off or do not have any utilization data. In the recommendation column we see only 1426 out of the 1435 active VMs are placed. The tool is unable to place nine of the active virtual machines.
Figure 9 Optimization Scenario #1
Scenario #2 - optimization plan based on daily average utilization, 10% CPU headroom and no memory headroom. Recommended environment uses 17 out of 18 Servers, accommodates all VMs with utilization, and yields a better Capacity Efficiency Index.

Figure 10 Optimization Scenario #2
Scenario #3 - optimization plan with daily average utilization, 10% CPU headroom and 10% memory over commit. Recommended environment uses 16 out of 18 Servers, accommodates all VMs with utilization, and yields a better Capacity Efficiency Index.
Figure 11 Optimization Scenario #3
10 Cost Parameters Used For This Study
Cost Category Cost / Year (USD)
Server 12,900.00
Average VM Cost 1,500.00
Administration Cost / Server 20,000.00
Administration Cost / VM 228.00
Energy Cost / Server 730.00

SmartCloud Monitoring - Capacity Planning ROI Case Study
17
Energy Cost / VM 9.00
Floor Space 125.00
Virtualization License 4740.00
Storage and Management Systems 500,000.00
Table 1 Cost Parameters Used For The Study
11 ROI Estimation Methods Used and ROI
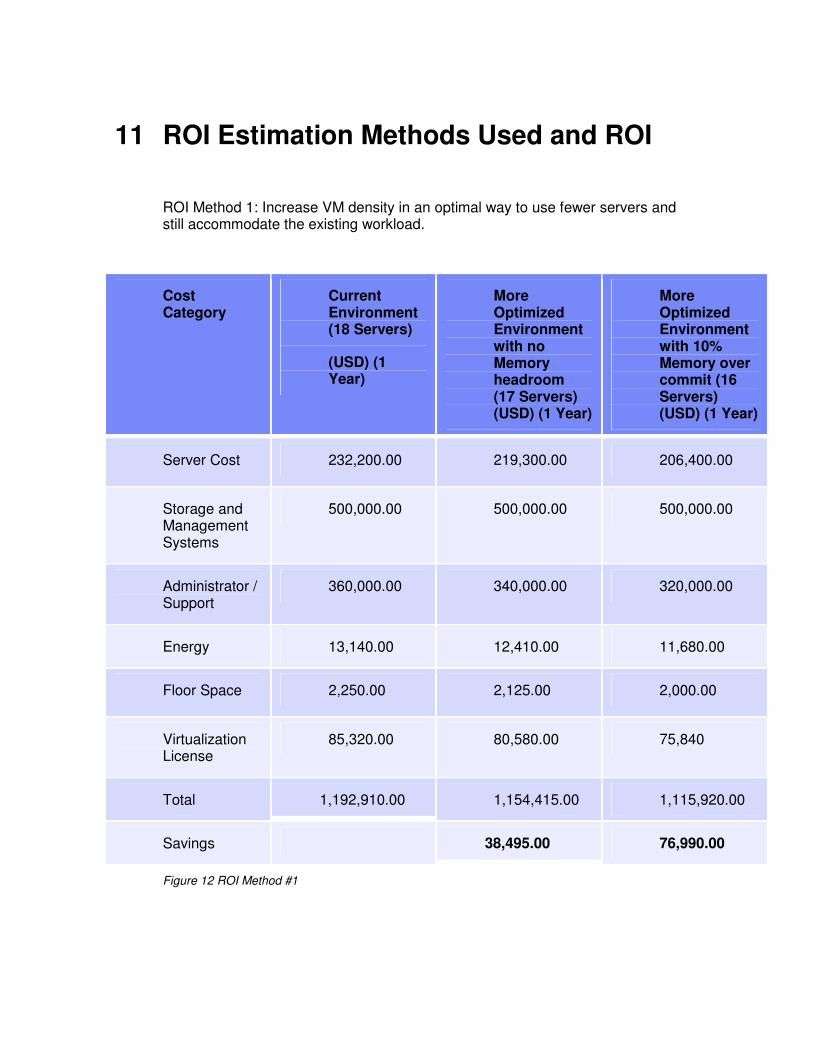
ROI Method 1: Increase VM density in an optimal way to use fewer servers and still accommodate the existing workload.
Cost Category
Current Environment (18 Servers)
(USD) (1 Year)
More Optimized Environment with no Memory headroom (17 Servers) (USD) (1 Year)
More Optimized Environment with 10% Memory over commit (16 Servers) (USD) (1 Year)
Server Cost 232,200.00 219,300.00 206,400.00
Storage and Management Systems
500,000.00 500,000.00 500,000.00
Administrator / Support
360,000.00 340,000.00 320,000.00
Energy 13,140.00 12,410.00 11,680.00
Floor Space 2,250.00 2,125.00 2,000.00
Virtualization License
85,320.00 80,580.00 75,840
Total 1,192,910.00 1,154,415.00 1,115,920.00
Savings 38,495.00 76,990.00
Figure 12 ROI Method #1
SmartCloud Monitoring - Capacity Planning ROI Case Study
19
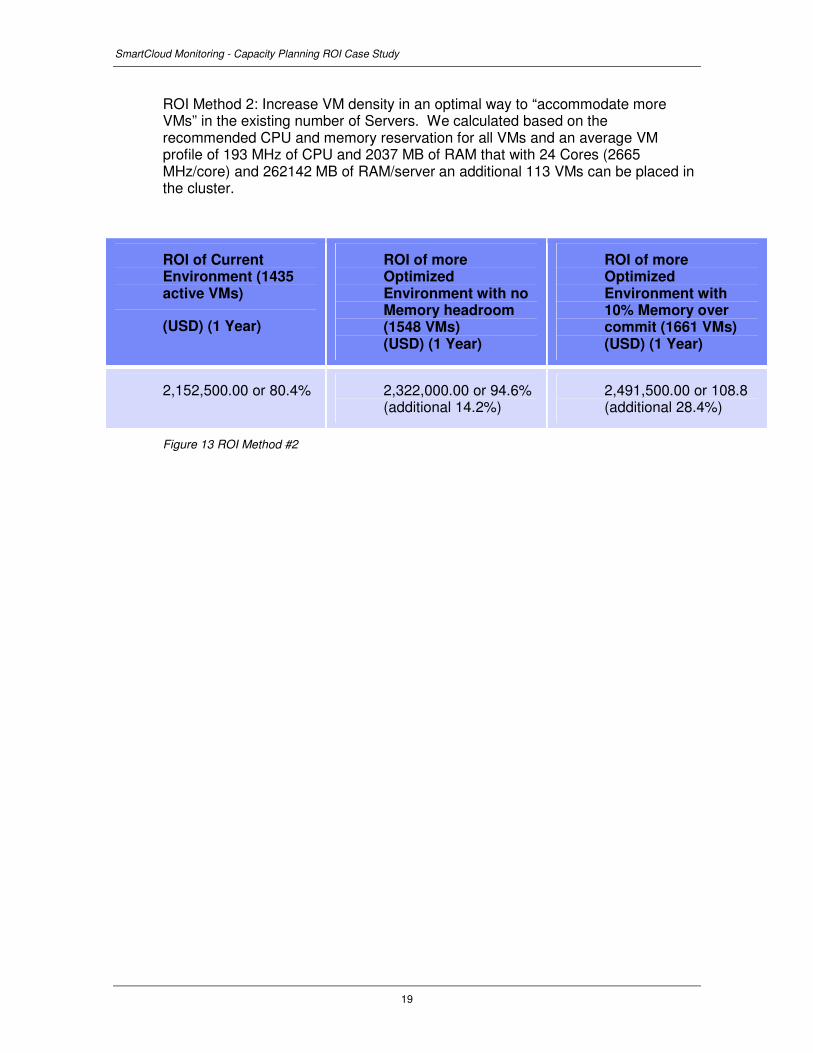
ROI Method 2: Increase VM density in an optimal way to “accommodate more VMs” in the existing number of Servers. We calculated based on the recommended CPU and memory reservation for all VMs and an average VM profile of 193 MHz of CPU and 2037 MB of RAM that with 24 Cores (2665 MHz/core) and 262142 MB of RAM/server an additional 113 VMs can be placed in the cluster.
ROI of Current Environment (1435 active VMs)
(USD) (1 Year)
ROI of more Optimized Environment with no Memory headroom (1548 VMs) (USD) (1 Year)
ROI of more Optimized Environment with 10% Memory over commit (1661 VMs) (USD) (1 Year)
2,152,500.00 or 80.4% 2,322,000.00 or 94.6% (additional 14.2%)
2,491,500.00 or 108.8 (additional 28.4%)
Figure 13 ROI Method #2

12 Results and Conclusion
Based on the results given by the tool we were unable to accommodate all active VMs leaving 10% CPU and 10% memory headroom. However, by simulating different “what-if” analyses we were able to realize significant savings as follows.
ROI Method 1: Increase VM density in an optimal way to use “Less number of Servers” and still accommodate existing workload. Able to free up one server using daily average utilization data, 10% CPU headroom and no memory headroom and two servers with 10% CPU headroom and 10% memory over commit.
• With 10% CPU headroom and no Memory headroom resulted in savings of $38,495 over 1 year.
• With 10% CPU headroom and 10% Memory over commit resulted in savings of $76,990 over 1 year.
Figure 14 ROI Method #1
ROI Method 2: Increase VM density in an optimal way to accommodate more VMs in the existing number of servers. This method results in an additional 113 VMs with an average VM profile of 193 MHz of CPU and 2037 MB of RAM.

SmartCloud Monitoring - Capacity Planning ROI Case Study
21
• With 10% CPU headroom and no memory headroom resulted in ROI of $ 2,322,000 or additional ROI of 14.2% over 1 year.
• With 10% CPU headroom and 10% memory over commit resulted in ROI of $ 2,491,500 or additional ROI of 28.4% over 1 year.
Figure 15 ROI Method #2
In conclusion we found that by using the Capacity Planner tool we could either:
1. reduce the number of servers in the cluster by one if we allowed 10% CPU headroom and no memory headroom saving $38,495 over one year and two servers if we allowed 10% CPU headroom and 10 % memory over commit saving $76,990 over 1 year.
Or,
2. add an additional 113 VMs with an average VM profile of 193 MHz of CPU and 2037 MB of RAM. Allowing 10% CPU headroom and no memory headroom resulted in an additional ROI of 14.2% over 1 year. Allowing 10% CPU headroom and 10% memory over commit yielded an additional ROI of 28.4% over 1 year.
®
© Copyright IBM Corporation 2012 IBM United States of America Produced in the United States of America US Government Users Restricted Rights - Use, duplication or disclosure restricted by GSA ADP Schedule Contract with IBM Corp. IBM may not offer the products, services, or features discussed in this document in other countries. Consult your local IBM representative for information on the products and services currently available in your area. Any reference to an IBM product, program, or service is not intended to state or imply that only that IBM product, program, or service may be used. Any functionally equivalent product, program, or service that does not infringe any IBM intellectual property right may be used instead. However, it is the user's responsibility to evaluate and verify the operation of any non-IBM product, program, or service.
IBM may have patents or pending patent applications covering subject matter described in this document. The furnishing of this document does not grant you any license to these patents. You can send license inquiries, in writing, to:
IBM Director of Licensing IBM Corporation North Castle Drive Armonk, NY 10504-1785 U.S.A.
The following paragraph does not apply to the United Kingdom or any other country where such provisions are inconsistent with local law: INTERNATIONAL BUSINESS MACHINES CORPORATION PROVIDES THIS PAPER “AS IS” WITHOUT WARRANTY OF ANY KIND, EITHER EXPRESS OR IMPLIED, INCLUDING, BUT NOT LIMITED TO, THE IMPLIED WARRANTIES OF NON-INFRINGEMENT, MERCHANTABILITY OR FITNESS FOR A PARTICULAR PURPOSE. Some states do not allow disclaimer of express or implied warranties in certain transactions, therefore, this statement may not apply to you. This information could include technical inaccuracies or typographical errors. Changes may be made periodically to the information herein; these changes may be incorporated in subsequent versions of the paper. IBM may make improvements and/or changes in the product(s) and/or the program(s) described in this paper at any time without notice. Any references in this document to non-IBM Web sites are provided for convenience only and do not in any manner serve as an endorsement of those Web sites. The materials at those Web sites are not part of the materials for this IBM product and use of those Web sites is at your own risk.
IBM may have patents or pending patent applications covering subject matter described in this document. The furnishing of this document does not give you any license to these patents. You can send license inquiries, in writing, to: IBM Director of Licensing IBM Corporation 4205 South Miami Boulevard Research Triangle Park, NC 27709 U.S.A. All statements regarding IBM's future direction or intent are subject to change or withdrawal without notice, and represent goals and objectives only. This information is for planning purposes only. The information herein is subject to change before the products described become available. If you are viewing this information softcopy, the photographs and color illustrations may not appear.

SmartCloud Monitoring - Capacity Planning ROI Case Study
23
Trademarks
IBM, the IBM logo, and ibm.com are trademarks or registered trademarks of International Business Machines Corporation in the United States, other countries, or both. If these and other IBM trademarked terms are marked on their first occurrence in this information with a trademark symbol (® or ™), these symbols indicate U.S. registered or common law trademarks owned by IBM at the time this information was published. Such trademarks may also be registered or common law trademarks in other countries. A current list of IBM trademarks is available on the web at "Copyright and trademark information" at http://www.ibm.com/legal/copytrade.shtml.