microsoft word - t2_lecture-04.doc · web viewdark fibres are a much more serious problem and the...
TRANSCRIPT

2. Clip Preparation Research
Ken Whiteley
Lecture 1: Traditional classing and the impact of pre-sale testing
Learning objectivesOn completion of this topic you should be able to explain:
The structure of classed clips and the reasons for the lines made The relationships between objective measurement and subjective appraisal The results of objective measurement of classed lines prepared by subjective appraisal Indirect selection for fineness based on quality number Components of variation of fibre diameter and their impact on clip preparation
Key terms and concepts Clip preparation, fleece classing, quality number, objective measurement, components of variation, indirect selection.
Introduction to lecture 1The procedures involved in classing methods are described and their efficacy in terms of preparing fleeces lines for marketing and subsequent processing are examined.
2.1 Traditional clip preparation and the impactof pre-sale testing
Historical overview A major research effort in clip preparation began in the 1960s and proceeded vigorously for the next decade. This research established the components of variation for the major processing characteristics of fibre diameter and fibre length and demonstrated that the major source of variation was at the fibre level so that separation of fleeces could have little influence on the level of variation within classed lines.
The catalyst for this research was the availability of new measurement technology. The microscope method for measurement of fibre diameter was too slow for extensive studies. The advent of the airflow technique provided a rapid and accurate measure of average fibre diameter until it was replaced by the very high-speed techniques of the 90s.
Early research suggested that fibre diameter should replace crimp as an indicator of “fineness” (Duerden 1929; Lang 1947) and new results revealed the significant discrepancies between subjective appraisal of “fineness” (or quality number, quality count, spinning count) and measured average fibre diameter and measured and appraised yield (Whiteley & Charlton 1973) for individual sale lots.
WOOL422/522 Wool Marketing and Clip Preparation 2 - 1 ©2009 The Australian Wool Education Trust licensee for educational activities University of New England

Before the 60s’ there was no measurement in the Australian greasy-wool market place of any wool characteristic but since 1938 the USA Customs had applied the measurement of fibre diameter of greasy wool to support import duties. In addition, since 1945, there had been clear research evidence that worsted spinning performance was determined primarily by average fibre diameter (Martindale 1945). In the 60s, the measurement of consignments (post-sale testing), firstly for yield and then fibre diameter, became increasingly popular as a basis for deliveries rather than the traditional method of guarantee, based on mill performance and wool type. Some details showing the rapid growth of post-sale testing and the replacement of the microscope method by the air-flow technique are demonstrated in Table 2.1 (David, Mackay & Charlton 1973).
Table 2.1 Growth of Testing for Yield and Fibre Diameter (thousand bales). Source: David, McKay and Charlton (1973).
Year
Yield Fibre Diameter
Certificate Report* AirflowCertificate Report PM**
66-67 490 90
67-68 671 152 42 6068-69 953 128 440 66 10668-70 1,387 108 1,051 75 11070-71 1,632 105 1,371 58 10571-72 1,737 86 1,566 72
* Report test used for guidance purposes ** Projection Microscope method
The advent of pre-sale testing in the 70s was the justification for the introduction of Objective Clip Preparation whereby classing for yield was virtually eliminated and only those fleeces that exhibited the broadest quality number, short staple length or obvious faults were kept separate from the main fleece line.
Even with the introduction of presale testing there were no objective tools to assist with clip preparation in the shed. The facilities for the laboratory testing of individual fleeces for selection purposes were not appropriate for in-shed testing.
There was, however, clear recognition that the curvilinear nature of the price-diameter curve opened the possibility that the separation of the fine fleeces from the broad, (in a mob) could be financially beneficial. This was only feasible if the average fibre diameter of the mob lay near the inflexion point of the curve (Charlton & David 1987).
The development in the mid 90s of the portable systems, Fleece Scan (Hansford 1997; Humphries et al. 2001) and optical fibre diameter analyser 2000 (Baxter 2001) for the rapid low-cost measurement of fibre diameter in real time during shearing, immediately stimulated further research and development to determine: which properties could be measured and what, if any, were the benefits of such developments.
Substantial numbers of growers are now using in-shed testing for fibre diameter whilst research continues on its profitability and the development of rapid measurement techniques for other characteristics.
Here we will focus on the “mob” unit, i.e. sheep of the same type that have been run together throughout the growing period. Normally a mob would be composed of adult ewes, wethers, hoggets or even subdivisions of these groups. The term “clip preparation” is now used rather than “classing”. This reflects the changing emphasis placed on the various responsibilities of the classer with increased attention to the removal of faults and less on classing the skirted fleeces into visually uniform lines.
2 - 2 – WOOL422/522 Wool Marketing and Clip Preparation©2009 The Australian Wool Education Trust licensee for educational activities University of New England

2.2 Traditional “wool classing" The initial steps in wool classing, prior to the classing of fleeces, are the separation from the fleece of the belly, the skirting of the fleece to remove the “inferior” edges, and the separation of locks and stains. The key features of traditional “wool classing” were:
1. The preparation of visually uniform lines of skirted fleeces that were free from faults that would influence processing performance or the quality of the resultant top, yarn or fabric. Faults include stains, pigmented fibres, heavy vegetable fault, skin pieces, cotted wool and non-wool contaminants such as twine, bale material and other foreign objects.
2. The primary value of the process was to assist valuation. Through experience, processors and their agents were able to associate particular types of wool with their subsequent performance. Mill performance was the final arbiter of the success of the appraisal in the case of yield, whereas wool type, covering quality number, length, strength and fault content, had to be agreed between the processor and his agent. In some cases samples were submitted for prior approval of a consignment.
3. Buyers sought to buy wool of the required type from different properties and districts and to avoid buying lines that were too large. These precautions were taken in recognition of the fact that unexpected results were sometimes obtained from individual lots or districts.
4. The concept of uniformity was emphasised to such a degree that it became generally accepted that the reasons for the classing of fleeces lay in their impact on processing. At that time there were no facilities for processing trials to prove the point and it was also claimed that small quantities of wool could not be processed to represent larger consignments.
5. Prior to presale testing, the clean price of wool was largely determined by quality number (crimp) and style with smaller contributions from vegetable fault and length (McKinnon, Constantine & Whiteley 1973). Classers were instructed that a mixture of the fine and broad fleece lines from the same clip would reduce uniformity and cause serious problems in processing.
6. Consequently, skirted fleeces from the same mob were classed into a number of lines based on quality number, condition (related to yield) and length. A major line was made of the finer fleeces and called “AAA”, fleeces of the same quality number but heavier in condition and/or shorter would be placed in an “AA” line and very short fleeces into an “A” line.
7. The coarse fleeces would be handled in a parallel fashion with the names AAACOM, AACOM and ACOM (the A line was often mixed with the ACOM line). There were many variations of the above including additional lines for exceptionally stylish wool (Super AAA, etc) and inferior wool (e.g. tender, doggy , cotted, “dermo” etc). Professional wool classers produced lines that were very uniform in appearance and expended the greater part of their efforts in the shed in classing the skirted fleeces. These efforts were often not reflected in the prices paid as buyers were forced to mix many classed lines together in order to build mill consignments. This limited their ability to “pick and choose” on the sale floor.
8. The skirting operation, by comparison, was considered to be of secondary importance. The usual procedure was to skirt heavily to remove the worst of the vegetable matter and then to sort the skirtings into several lines starting with broken fleece (that should not have been removed in the first place), 1st pieces, 2nd pieces, locks, stains etc.
9. The traditional classing system had remained unchanged for over 100 years (Lunney 1983) and the valuation system employed by the buyers was generally considered to be one of remarkable precision.
In Table 2.2 the typical composition of the wool from a mob is illustrated. It can be seen that in heavily skirted clips about two-thirds of the fleece may end up in the fleece-wool lines and more than a fifth of the fleece in the pieces.
WOOL422/522 Wool Marketing and Clip Preparation 2 - 3 ©2009 The Australian Wool Education Trust licensee for educational activities University of New England
Table 2.2 Percent composition of components of fleece in 18 clips classed in a mob structure. Source: Charlton (1983).
Average % Range %Skirted Fleeces 73 66 – 82Pieces 15 5 – 22Bellies 7 6 - 8Locks 3 1 – 6Stains 2 0 - 11
2.3 Objective measurement Theoretical and applied studies on fibre characteristics of importance in processing, and especially worsted spinning performance, revealed some quite remarkable results (Bastawisy, Onions & Townend 1961). Fibre diameter was clearly of greatest importance followed by length and strength. Crimp, still the major factor determining price, was of little importance and, if anything, it had a negative effect on spinning performance. Just as surprising, the blending together of wools of differing fibre diameters or lengths had no observable effect, and high levels of uniformity could actually have a negative effect on processing. It was clearly time to re-asses wool valuation and clip preparation procedures in terms of their relativity to processing requirements. This work would not begin to have an impact for more than a decade.
2.4 Objective measurement and subjective appraisal Measurement of wools of the same quality number showed that their average fibre diameters
ranged over 5µm for medium merino wools; somewhat lesser for finer wools but greater for broader wools (Whiteley & Charlton 1973; Hopkins & Whiteley 1973). For yield estimates, the appraised yield lay within ±6% of the measured value. Vegetable fault, which is difficult to appraise and to measure, showed the poorest results. For example, Free or Nearly Free wools (FNF) supposedly containing fault from 0% -1% gave measured results ranging from 0.1% - 3.0% but with an average level of 0.65% (Whiteley & Charlton 1973; Whiteley & Hopkins 1973). Measurement also demonstrated that wools discounted for unscourable colour or strength showed large overlaps with corresponding non-discounted wools (Whiteley & Welsman 1977).
Despite this, the average results of buyers’ appraisals were consistent and in good agreement with measured results for yield and vegetable fault, giving rise to the perception of precision.
Clearly it was the law of averages that produced such consistent results. This outcome was reasonably satisfactory for the buyer and his client. However it meant inequitable returns, both high and low, to individual growers and failed to identify wools having unique sets of characteristics.
2.5 Measurement of classed lines from the same clip The first reported analysis of a fine wool clip (Skinner 1964) showed that classed lines of fleeces from adult sheep ranged in quality number from 74/80s to 64/70s but varied in fibre diameter within a range of only 0.4m (from 18.9m to 19.3m). Moreover, the hogget wools from this same clip were classified as 64/70s – 70s and brought the lowest price but were 2m finer than the adult wool. Young wools had a reputation for poor processing, no doubt in part due to their low staple strength (“hogget ill-thrift”). However, even if such fine wools were sound they could not be expected to perform like an adult 64/70s with a diameter of, say, 21m, especially during early stage processing. The problem clearly lay in the shortcomings of the appraisal system based on quality number and style. (For a more detailed explanation of quality number, refer to Topic 7.)
2 - 4 – WOOL422/522 Wool Marketing and Clip Preparation©2009 The Australian Wool Education Trust licensee for educational activities University of New England

This work was greatly expanded in further studies that confirmed the poor negative correlation between crimp and diameter within mobs (Whiteley & McKinnon 1973) and in experimental flocks representing the major merino strains (Dunlop & McMahon 1973). It was most significant that the finer the wool the poorer the relationship between quality number and mean fibre diameter and in some cases the correlation became positive. This meant that in superfine clips the “finest” fleeces in terms of quality number were often the broadest fleeces in terms of fibre diameter yet would bring the highest prices. The fibre diameter/crimp relationship for such a flock is shown in Figure 2.1.
Figure 2.1 Relationship between fibre diameter and crimps/inch among fleeces from the same mob. Source: Whiteley (1974).
2.6 Indirect selection If it were possible to measure individual fleeces directly, and without error, then the differences in fibre diameter achieved by separating the fine from the broad fleeces would be determined by the variation among the fleeces within the mob. Assuming the average fibre diameter of individual fleeces was normally distributed about the mean of the mob, the difference in fibre diameter of a selected group, d, and the parent population, D, is given by Equation 1:
d - D = (z/α)σ …………………..Eqn. 1 Where z = the ordinate of the standardised normal frequency function beyond which the selected fraction α lies and σ = the standard deviation of diameter among fleeces, see Figure 2.2. If the selection for fibre diameter is indirect and based on crimp frequency then the RHS of equation 1 is multiplied by the value of the correlation between fibre diameter and crimp among fleeces from the mob:
d – D = ρ(z/α)σ………………………. Eqn 2 Where ρ = the correlation between fibre diameter and crimp frequency. Some values for this correlation plotted against variation among fleeces within mobs, are given in Figure 2.3. Among finer mobs, where the variation in diameter among fleeces is lower, the correlation between crimp and diameter is also low and sometimes positive, explaining the curious results found among fine wool clips.
WOOL422/522 Wool Marketing and Clip Preparation 2 - 5 ©2009 The Australian Wool Education Trust licensee for educational activities University of New England

Figure 2.2 Selection of a portion, α(mean diameter d) from a population (mean diameter D). Source: Whiteley and Wilkins (1973).
Figure 2.3 Relationship between correlation of crimp with diameter and the variation in diameter among fleeces within a mob. Source: Whiteley and Wilkins (1973).
Expected differences between fine and coarse lines from the same clip are calculated for a range of correlations and among-sheep variances in Tables 2.3 and 2.4. In Table 2.3, the fleeces from a mob are divided into two equal fine and coarse lines and in Table 2.4, the differences in fibre diameter are calculated for coarse and fine “tails” of a mob, each comprising 20% of the fleeces in the mob.
2 - 6 – WOOL422/522 Wool Marketing and Clip Preparation©2009 The Australian Wool Education Trust licensee for educational activities University of New England

Table 2.3 Expected Differences Between the Mean Diameters of the Fine and Coarse Fleeces in Merino Flocks (50% Tail Regions). Source: Whiteley and Wilkins (1973).
Strong -0.7 1.1 1.6 1.9 2.2 2.5 2.7
-0.6 1.0 1.4 1.7 1.9 2.2 2.4
Correlation CoefficientBetween Crimp and Diameter
-0.5 0.8 1.1 1.4 1.6 1.8 2.0
-0.4 0.6 0.9 1.1 1.3 1.4 1.6
-0.3 0.5 0.7 0.8 1.0 1.1 1.1
-0.2 0.3 0.5 0.6 0.6 0.7 0.8
-0.1 0.2 0.2 0.3 0.3 0.4 0.4
0.0 0.0 0.0 0.0 0.0 0.0 0.0
+0.1 -0.2 -0.2 -0.3 -0.3 -0.4 -0.4
Weak +0.2 -0.3 -0.5 -0.6 -0.6 -0.7 -0.8
1 2 3 4 5 6
Variance (µm2)
Table 2.4 Expected Difference in Diameter Between the Mean Diameter Fine and Coarse Fleeces in Merino Flocks (20% Tail Regions). Source: Whiteley and Wilkins (1973).
Strong -0.7 2.0 2.8 3.4 3.9 4.4 4.8
Correlation CoefficientBetween Crimp and Diameter
-0.6 1.7 2.4 2.9 3.4 3.8 4.1
-0.5 1.4 2.0 2.4 2.8 3.1 3.4
-0.4 1.1 1.6 1.9 2.2 2.5 2.7
-0.3 0.8 1.2 1.5 1.7 1.9 2.1
-0.2 0.6 0.8 1.0 1.1 1.3 1.4
-0.1 0.3 0.4 0.5 0.6 0.6 0.7
0.0 0.0 0.0 0.0 0.0 0.0 0.0
+0.1 0.3 0.4 0.5 0.6 0.6 0.7
Weak +0.2 0.6 0.8 1.0 1.1 1.3 1.4
1 2 3 4 5 6
Variance (µm2)
The differences suggest that the presence of test results pre-sale for fibre diameter would obviate the necessity to class fleeces for fineness unless there was a very substantial premium for fibre diameter that would more than offset costs. Of course the differences between the main fleece lines and the “condition” lines (AA and AACOM) were no longer of significance with the availability of yield results. This was the basis of Objective Clip Preparation (OCP), introduced to coincide with the introduction of pre-sale testing for yield and mean fibre diameter.
WOOL422/522 Wool Marketing and Clip Preparation 2 - 7 ©2009 The Australian Wool Education Trust licensee for educational activities University of New England

At this time there was constant complaint about the small size of sale lots and the burden this imposed on the selling system, especially the task of valuation. It was expected that the combination of major fleece lines would help to alleviate this problem. The use of presale test results to reduce the substantial variation in fibre diameter between lots of the same quality number from different clips would more than offset the small differences between classed lines within clips. Consequently OCP combined with pre-sale testing made it possible to increase lot size whilst, simultaneously, reducing the total variation in a mill consignment.
In practice, it proved difficult to exploit these findings and although some growers changed their clip preparation procedures, the impact on average sale lot size was not as great as had been anticipated. For many years after the introduction of OCP, clips could be classed by either Traditional (pre-sale testing optional) or Objective Clip Preparation (pre-sale testing compulsory) procedures, and, due to the conservatism of wool producers, classers and buyers, the acceptance and adoption of OCP was slow. Pre-sale testing, however, grew rapidly.
Whilst it could be said that presale testing had simply been added on to the existing system, the associated sale-by-sample revolutionised in-store wool handling. Further, the availability of pre-sale test results provided a common language to link all stages of production, marketing and processing.
2 - 8 – WOOL422/522 Wool Marketing and Clip Preparation©2009 The Australian Wool Education Trust licensee for educational activities University of New England

Lecture 2: Influence of clip preparation methods
Learning objectives
This lecture should provide:
Understanding of the components of variation of fibre diameter and their significance in clip preparation and formation of mill consignments
Familiarity with the outcomes of processing trials comparing Objective Clip Preparation with traditional procedures
Understanding of the components of fibre/staple length variation and their significance in clip preparation and formation of mill consignments
Familiarity with the outcome of processing trials to determine the value of classing skirted fleeces from the same mob for staple length
Key terms and concepts Objective Clip Preparation, pre-sale testing, staple length/ fibre length/ top length relationships, components of variation of staple/fibre length, worsted topmaking and spinning performance of sale lots prepared by different fleece-classing methods.
Introduction to lecture 2The sorting of skirted fleeces from the same mob on the basis of quality number is not effective in achieving worthwhile differences in fibre diameter, or in improving the variability of fibre diameter. Traditional procedures did improve the visual uniformity of classed lines for valuation purposes but the availability of presale test information reduced this requirement. Provided pre-sale test information was available, it was now permissible to place most of the skirted fleeces from a mob in a single line increasing lot size and reducing costs.
2.7 Objective clip preparation The introduction of pre-sale testing for yield, vegetable matter content (VM) and mean fibre diameter set the scene for the replacement of Traditional Clip Preparation (TCP) with Objective Clip Preparation (OCP) by eliminating the need to class out lines that were visually uniform for yield and quality number/crimp frequency. The recommended OCP procedures, applied to the fleeces from a mob, required the majority of fleeces to be classed into the AAA fleece line with fleeces of very broad quality number, compared with the majority, being allocated into the BBB line. Fleeces considered to be significantly shorter in staple length were to be classed into an AA line, generally irrespective of their quality number. The ‘traditional cast lines’ for tender, cotted, and discoloured fleeces (defined as unscourable colour) were also required under OCP.
At the same time, the skirting requirements of fleeces changed as a result of research that concluded that there was no economic benefit to wool producers from the accepted ‘traditional’ practice of heavily skirting fleeces, primarily to remove vegetable matter from the fleece, and then ‘picking’ the pieces to separate what was effectively ‘fleece’ wool (usually containing a higher VM than the skirted fleece) from the short staple, discoloured/cotted, fleece edges. Picking pieces required extra labour in the shearing shed and the research results demonstrated that this cost was not compensated for by a higher overall price for the skirting lines (Whan 1971). The recommended skirting practice was to skirt as lightly as possible so as to only remove the short staple, discoloured/cotted fleece edges, although the practice of skirting off the higher VM parts of the fleece was common, even though the requirements were only to remove ‘burr on burr’.
WOOL422/522 Wool Marketing and Clip Preparation 2 - 9 ©2009 The Australian Wool Education Trust licensee for educational activities University of New England

2.8 Variation in fibre characteristics The acceptance and hence uptake of Objective Clip Preparation (OCP) was initially slow due to the entrenched concept of uniformity. There is no doubt that the major OCP line (AAA + AA + AAACOM + AACOM) exhibited variation in quality number and condition that was confusing to the classer whose training had focused on visual uniformity and the supposed processing consequences associated with a loss of uniformity. It was equally difficult for the brokers, buyers, and wool mill to accept what appeared to be a mixed line. It was therefore necessary to demonstrate that these “mixed lines” were in fact as uniform as those established under traditional classing. There was no doubt, however, that the availability of pre-sale test certification meant that buyers could reduce the large variation in fibre diameter that occurred among sale lots of the same quality number or fineness. Mill consignments could now be produced that were more uniform than those produced using traditional appraisal procedures.
The establishment of the characteristics of importance in worsted processing, led by fibre diameter, length and strength, drew attention to the sources of variation in those parameters and how classing influences them.
2.9 Fibre diameter With the introduction of pre-sale testing, there are two aspects of fibre diameter variation that could be identified, namely, variation among classed lines from the same clip and variation among clips. Objective measurement showed that the differences in fibre diameter among classed lines from the same clip were small, usually lying within a range of 1um and equivalent to a variance of approximately 0.1 – 0.2µm2 (Whiteley & McKinnon 1973). By comparison, the differences among sale lots of the same quality number from different farms (Whiteley & Charlton 1973) were commonly 5µm corresponding to a variance of 1.6µm2 .
Presale testing results suggested that the small, and sometimes contradictory, differences among lines from the same clip could be ignored in order to increase lot size whilst reducing the large variation that existed among sale lots of the same quality number from different clips. With presale testing, buyers could now match lots on the basis of fibre diameter so that consignments were more uniform, in addition to ensuring that the mean fibre diameter for the consignment had high precision as it represented the combination of many individual presale test certificates.
Nevertheless there remained considerable concern that the virtual removal of fleece classing for fineness, proposed under OCP, would increase the variability of fibre diameter and reduce the spinning performance of the main line. To overcome this it is necessary:
to have an understanding of the various components that contribute to the total variance in measured parameters and
to demonstrate the processing performance of lines prepared by the OCP method.
In Table 2.5 the components to fibre diameter variation are presented.
The among-fibres within-staple component results from the complex nature of the initiation and growth of the follicle and fibre population in the pre- and postnatal life of the lamb. Along-the-fibre variations can also be very large as they reflect changes in follicle productivity, primarily as a result of seasonal conditions and reproduction. These effects can cause follicle production to cease altogether producing a “break” or “window” in the staple.
Together these two components indicate that the major source of variation in any assembly of wool fibres is attributable to variation within the staple. Any separation of wools above this level cannot have a major effect on uniformity.
2 - 10 – WOOL422/522 Wool Marketing and Clip Preparation©2009 The Australian Wool Education Trust licensee for educational activities University of New England

The dorso-ventral and anterior-posterior gradients of fibre diameter over the fleece are well-known and indeed clip preparation methods have been proposed suggesting that the preparation of two lines, by breaking every fleece into front and rear portions, would produce the same result as classing for quality number. This is correct but still produces small differences, so the same arguments apply as for traditional classing.
The variation among fleeces is the component the classer works on to achieve differences in fineness using appraisal of quality number. For example, separation on the basis of quality number can only reduce the among fleeces component (4µm2) by less than 0.5µm2 (Whiteley 1974).
Table 2.5 Components of Variation of Fibre Diameter. Source: Whiteley (1974).
Source of Variation Variance (µm2)
Among fibres within a staple 16
Along fibres within a staple Sound wool 4Tender wool 16Among staples within the fleece 1
Among fleeces within a mob 4
Among fleeces within a classed line 3.9 – 3.6
Among classed lines within a mob 0.1 – 0.4
TOTAL 25
In summary, at least 70 - 80% of the variation in fibre diameter in a mob of sheep lies within the staple and beyond the reach of the classer. The effect of separating fleeces on the basis of quality number has very little effect, the total variance being reduced by approx 0.5%.
Presale testing of average fibre diameter does permit the buyer to reduce the substantial variation among sale lots in a mill consignment. This more than offsets the slight increase in variation within sale lots resulting from no fineness classing. The availability of yield tests also relaxed the requirement to produce the AA and AACOM lines that were described as heavier in condition and/or shorter. As will be shown later, the AAA & AA lines differed only by 1 – 2 mm in staple length (Whiteley 1983).
This was the basis of Objective Clip Preparation in that it removed the requirement for classing fleeces on the basis of either quality number or “condition” resulting in one major fleece line.
2.10 Topmaking trials Despite the measurement results it was considered necessary to carry out substantial processing trials (Andrews et al. 1979; Japan Wool Spinners Assoc. 1980) to compare clips prepared by the Objective Clip Preparation (OCP) procedure with those prepared by Traditional Clip Preparation (TCP) procedures.
From a single mob of sheep, fleeces were allocated to fine (T1) and coarse (T2) lines (equivalent to the traditional AAA and AAACOM lines) and an OCP line. In addition, fleeces of heavier condition that would not be acceptable in T1 and T2 lines (i.e. AA and AACOM) were also included in the OCP line. Typical results are presented in Tables 2.6 and 2.7.
WOOL422/522 Wool Marketing and Clip Preparation 2 - 11 ©2009 The Australian Wool Education Trust licensee for educational activities University of New England

The mean diameter of the clips examined ranged from 30um to 21 um and the differences achieved by classing (i.e. between the T1 and T2 lines) ranged from 2um to 0.1um. This confirmed earlier predictions on the relationship between average fibre diameter of the clip and the differences achieved by traditional classing methods (Dunlop & McMahon 1973; Quinell, Whiteley & Roberts 1973; Whiteley & McKinnon 1973, Whiteley & Wilkins 1973).
Table 2.6 The Influence of Objective Clip Preparation on Fibre Diameter and its Variability. Source: Andrews et al. (1979).
Line Mean Fibre Diameter (µm)
CV of Diameter (%)
Crimp Frequency (no./cm)
Greasy Top TopT1 20.7 20.9 19 4.6OCP 21.1 21.0 21 4.3T2 21.4 21.3 22 4.0
Table 2.7 Staple Length and Top Length. Source: Andrews et al. (1979).
Line Staple Length Top LengthMean (mm) CV (%) Mean (mm) CV (%)
T1 86 16 62 47
OCP 91 14 69 52
T2 96 15 71 50
The main results concerning the greasy wool are:
1. The fibre diameter results for OCP fall intermediate between T1 and T2. 2. Staple length of the OCP line also lies in an intermediate position suggesting that the AA and
AACOM lines are mainly heavier in condition rather than shorter. 3. The differences in crimp frequency demonstrate most clearly that they underline the basis for
quality number appraisal.
The wools were then processed to tops in three separate research centres each using their own machinery settings. Studies were also carried out in Japan under the auspices of the Japanese Wool Spinners Association. The results were remarkably consistent:
1. The mean fibre diameters of the tops were very similar to those of the greasy wool with the OCP line intermediate between T1 and T2
2. The CVd of the OCP top was also intermediate between T1 and T2 3. The fibre length in the top was related to staple length results with T1 being the shortest, T2 the
longest and OCP intermediate 4. The OCP line had a slightly higher CV fibre length for the mob whose results are quoted in
Table 2.7. This result was not considered to be of significance and was not observed among the other clips studied
5. Note that the CV of fibre length for tops is approximately 3 times the CV of staple length. This result should be compared with mean fibre diameter and CV of diameter that remain very constant throughout processing
6. Other important characteristics of combing such as card wastes and noils again showed that OCP provided intermediate results between T1 & T2.
2 - 12 – WOOL422/522 Wool Marketing and Clip Preparation©2009 The Australian Wool Education Trust licensee for educational activities University of New England

2.11 Spinning trials Having confirmed the topmaking performance of OCP wools, the next step was worsted spinning. Today, with the existence of predictive techniques such as TEAM, one could safely conclude that the spinning results would again place OCP in an intermediate position. It should be recalled that at the time of this research, the OCP line might have a mixture of 3 quality numbers (with one quality number dominating) and fleeces exhibiting varying, but scourable, greasy colour. In practice, it would also be a very much larger line. It was therefore natural for a conservative industry to question how such a line would spin.
At a given yarn count it is to be expected that fine lines would spin with fewer end breaks and produce more even yarns. The results in Table 2.8 show that:
1. In terms of end breaks per 100 spindle hours, the differences for all lines are small with the T2 line (AAACOM) giving the poorest result. At finer yarn counts the values for T2 would increase sharply.
2. The OCP line has intermediate values for breaking load and breaking extension as expected. 3. There are no significant differences in yarn evenness.
Table 2.8 Spinning Performance and Yarn Characteristics. Source: Andrews et. al. (1979).
LineEnd Breaks
(no./100 spindle hrs)
Breaking Load (cN)
Breaking Extension
(%)Yarn Evenness (U
%)T1 6 102 12.9 17.7OCP 4 106 13.8 18.2T2 12 113 13.0 18.1
The authors of this major trial concluded that the variability of fibre diameter in an OCP line is the same as that of traditional lines as are the losses during processing (card waste and combing noil), spinning performance and yarn quality.
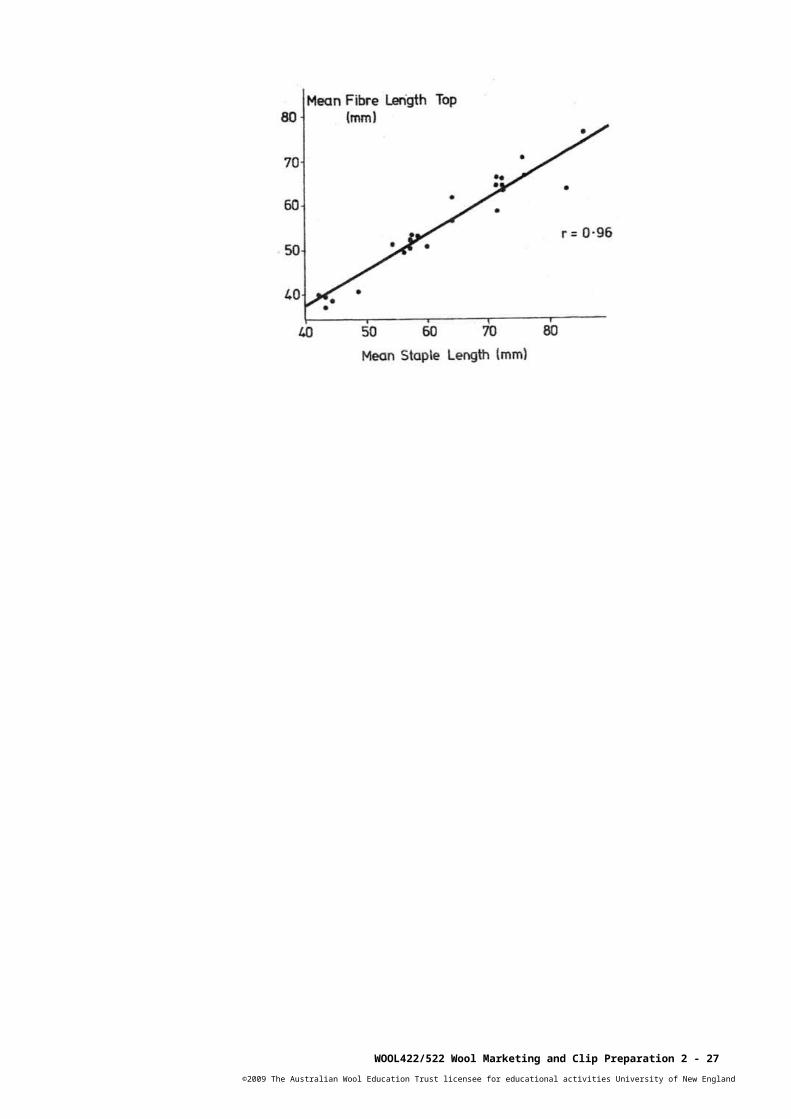
2.12 Staple and fibre length Because staple length can readily be seen it tends to be taken for granted compared with staple strength. This is a misconception as there is a strong linear relationship between staple length and fibre length in greasy wool and between staple length and fibre length in the top (Figures 2.4 and 2.5) (Bow 1979). Staple length is the major determinant of fibre length in the top although staple strength can and does cause significant deviations from the above relationship. Due to its overwhelming importance attention has been focused on fibre diameter and the major argument for reform has centred not on the importance of fibre diameter and its variability but rather upon the fact that traditional classing has little effect on either of them. This conclusion derives from an understanding of the components of variation and, in particular, those components that can be influenced by the classer and the wool buyer.
WOOL422/522 Wool Marketing and Clip Preparation 2 - 13 ©2009 The Australian Wool Education Trust licensee for educational activities University of New England

Figure 2.4 The relationship between mean fibre and staple length in greasy wool. Source: Bow (1979).
A similar situation exists regarding the effect of classing on length (Whan 1973) and again interest lies in those components of variation that can be affected by the classer and/or the buyer. The principal components of length variation are:
1. among fibres in a staple 2. among staples within a region of the fleece 3. among regions of the fleece and 4. among fleeces in a mob.
Unlike the case for fibre diameter, the level of variation is increased markedly during processing due to fibre breakage.
The various components of variation of fibre and staple length are illustrated in Figure 2.6 and quantified in Table 2.9 (Andrews & Rottenbury 1975; Rottenbury & Andrews 1975).
Figure 2.5 The linear relationship between fibre length in the top and mean staple length of the greasy wool. Source: Bow (1979).
2 - 14 – WOOL422/522 Wool Marketing and Clip Preparation©2009 The Australian Wool Education Trust licensee for educational activities University of New England
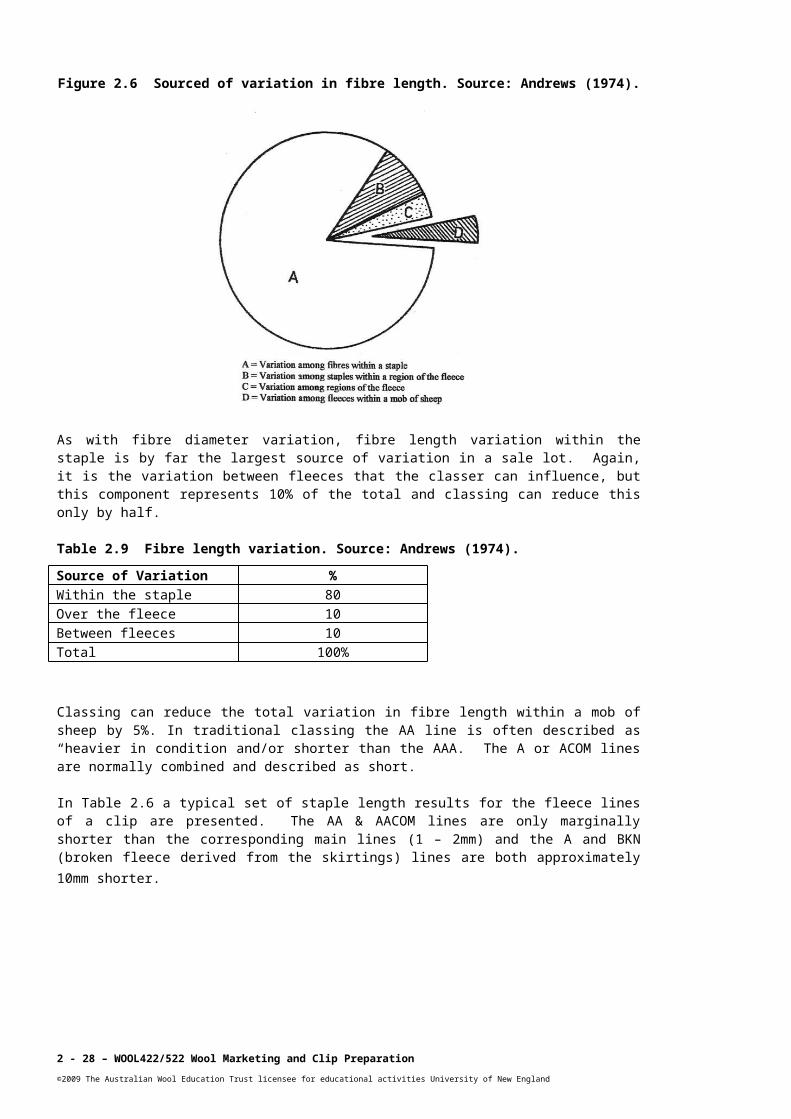
Figure 2.6 Sourced of variation in fibre length. Source: Andrews (1974).
As with fibre diameter variation, fibre length variation within the staple is by far the largest source of variation in a sale lot. Again, it is the variation between fleeces that the classer can influence, but this component represents 10% of the total and classing can reduce this only by half.
Table 2.9 Fibre length variation. Source: Andrews (1974).
Classing can reduce the total variation in fibre length within a mob of sheep by 5%. In traditional classing the AA line is often described as “heavier in condition and/or shorter than the AAA. The A or ACOM lines are normally combined and described as short.
In Table 2.6 a typical set of staple length results for the fleece lines of a clip are presented. The AA & AACOM lines are only marginally shorter than the corresponding main lines (1 – 2mm) and the A and BKN (broken fleece derived from the skirtings) lines are both approximately 10mm shorter.
WOOL422/522 Wool Marketing and Clip Preparation 2 - 15 ©2009 The Australian Wool Education Trust licensee for educational activities University of New England
Source of Variation %Within the staple 80Over the fleece 10Between fleeces 10Total 100%

Table 2.10 Staple length in classed lines. Source: Whiteley (1983).
Line Staple Length
Mean (mm) CV (%)
AAAM 90 13
AAM 87 13
AM 80 15
AAACOM 93 12
AACOM 92 13
Unclassed 88.4 13
BKN 82 18
The A line has the highest CV staple length but this is a reflection of its shorter mean length, in terms of variance they are all very similar. If all the fleece lines, excluding BKN, were combined the average length of the lot would be 88.4mm with a CV of 13.4%.
To estimate the processing significance of the effects of classing for length to improve uniformity, skirted fleeces from mobs of sheep were sorted into long, medium and short groups of equal size, achieving a difference of 20mm between the long and the short. This represents an even stricter sorting for length than traditional classing and there is a great deal of overlap of the distribution of staple length among the three lines (Figures 2.7 and 2.8)
Figure 2.7 Variation in staple length among fleeces within a mob of sheep. Source: Andrews (1974).
2 - 16 – WOOL422/522 Wool Marketing and Clip Preparation©2009 The Australian Wool Education Trust licensee for educational activities University of New England

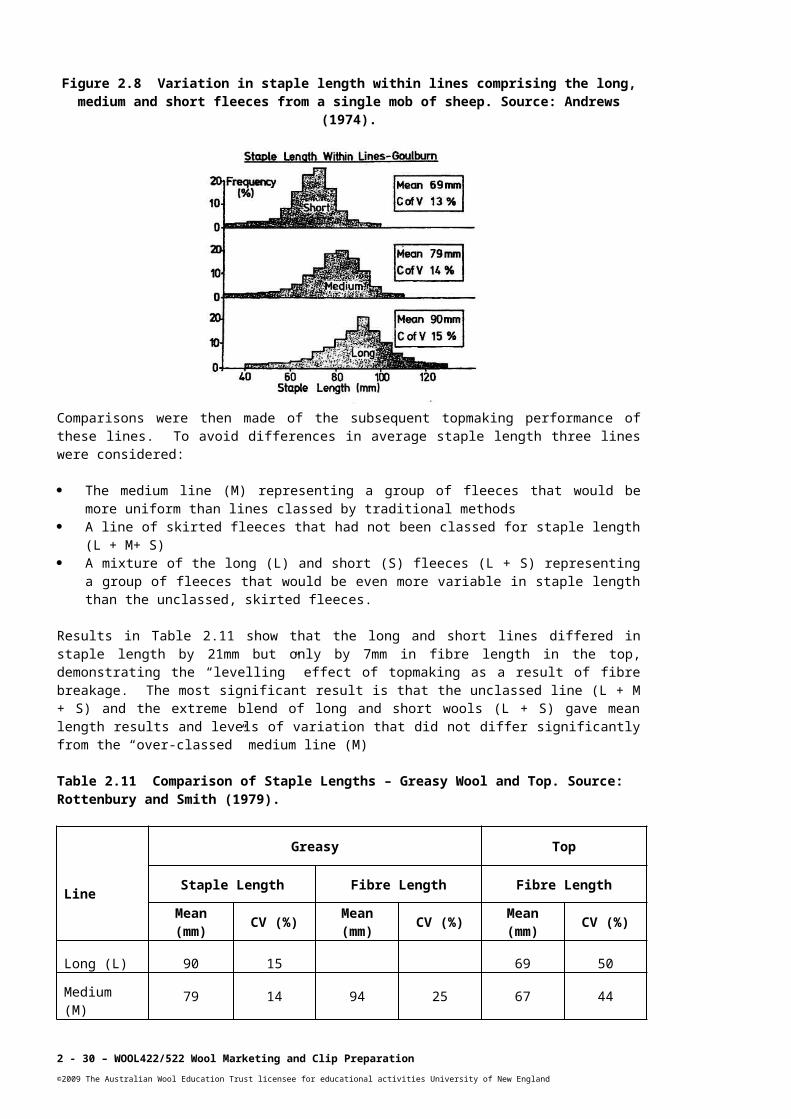
Figure 2.8 Variation in staple length within lines comprising the long, medium and short fleeces from a single mob of sheep. Source: Andrews (1974).
Comparisons were then made of the subsequent topmaking performance of these lines. To avoid differences in average staple length three lines were considered:
The medium line (M) representing a group of fleeces that would be more uniform than lines classed by traditional methods
A line of skirted fleeces that had not been classed for staple length (L + M+ S) A mixture of the long (L) and short (S) fleeces (L + S) representing a group of fleeces that
would be even more variable in staple length than the unclassed, skirted fleeces.
Results in Table 2.11 show that the long and short lines differed in staple length by 21mm but only by 7mm in fibre length in the top, demonstrating the “levelling” effect of topmaking as a result of fibre breakage. The most significant result is that the unclassed line (L + M + S) and the extreme blend of long and short wools (L + S) gave mean length results and levels of variation that did not differ significantly from the “over-classed” medium line (M)
Table 2.11 Comparison of Staple Lengths – Greasy Wool and Top. Source: Rottenbury and Smith (1979).
Line
Greasy Top
Staple Length Fibre Length Fibre Length
Mean (mm) CV (%) Mean
(mm) CV (%) Mean (mm) CV (%)
Long (L) 90 15 69 50
Medium (M)79 14 94 25 67 44
Short (S) 69 13 62 43
L + M + S 79 15 95 26 66 44
L + S 78 18 94 27 65 45
WOOL422/522 Wool Marketing and Clip Preparation 2 - 17 ©2009 The Australian Wool Education Trust licensee for educational activities University of New England

In support of this result, card losses and noilage are reported in Table 2.12. The results demonstrate that classing has no detectable effect on conversion efficiency or the quality of the resultant top.
Table 2.12 Comparison of Staple lengths – Processing Losses. Source: Rottenbury and Smith (1979).
In the absence of pre-sale test results the appearance of some short-staple fleeces in the show bales at sale time
would leave the appraisers guessing at the average staple length so the regulations directed that short or over-long fleeces should be removed. In the presence of certificate test results these doubts no longer exist in terms of both average staple length and its distribution. The same argument applies to all the other parameters that have to be considered by the buyer once test results become available.
The results show conclusively that the sorting of fleeces from the same mob on the basis of subjective appraisal of yield, quality number and staple length has little influence on the uniformity of the resulting classed lines or their processing performance. On the other hand, there is much to be gained by producing only one major fleece line in terms of cost savings, wool handling and testing. In addition, there is the uniformity of this major line in other characteristics such as the type and amount of vegetable fault, tip configuration and damage, dust content and dust penetration.
2 - 18 – WOOL422/522 Wool Marketing and Clip Preparation©2009 The Australian Wool Education Trust licensee for educational activities University of New England
Line Card Loss (%) Combing Noil (%)
Medium (M) 5.0 5.0
L + M + S 5.0 5.0L + S 5.1 4.9

Lecture 3: Staple strength and general preparation procedures
Learning objectives
This lecture should provide an understanding of:
The components of variation of staple strength The relative significance of these components in clip preparation The differences in staple strength achieved by sorting fleeces on the basis of subjective
estimates of strength The processing performance of sound and tender lines from the same mob The impact of the research results on clip preparation The relative proportions of the lower lines of a clip The measured characteristics of lower lines compared with fleece lines The processing performance of fleece lines, lower lines and mixtures of the two Conclusions to be drawn from processing trials on the preparation of lower lines and their
separation from the fleece lines
Key terms and CcLower lines or cast lines, pieces, skirtings, bellies, locks, crutchings, stains, tender wool, staple strength, short fibre, additivity of processing, colour, brightness, yellowness, VM particles in tops, dark fibres (pigmented or stained), mob concept.
Introduction to lecture 3This lecture examines the efficacy of classing fleeces on the basis of subjective estimates of staple strength or “tenderness”. The differences achieved in terms of measured staple strength and the processing consequences of these differences are examined. Tender fleeces are grouped together with other wool faults under the general heading of “cast lines” that also include other faults such as stains or pigmented fleeces.
In order to establish clip preparation limits, a study is made of the processing of lower lines of the clip such as bellies, skirtings, locks and stains. This information provides an objective basis for clip preparation procedures.
The introduction of the presale certification of average fibre diameter and yield made the concept of maintaining most of the skirted fleeces from a single mob of sheep in the same line acceptable to the Industry. Further studies on staple length indicated that, as was the case for fibre diameter and yield, classing for length had little influence on either the mean results, the uniformity or the processing performance of the resulting classed lines.
Further, it became clear that the processing performance of these large lines produced results that could be accurately predicted from the average results of their component parts. For example, the OCP lines produced results that lay intermediate between those of the major fleece lines resulting from traditional methods (AAA, AAACOM, AA and AACOM).
The same effect could be observed with staple length: the long (L), medium (M) and short (S) fleeces from a mob could be blended in various ways to produce a top-making performance and consequent fibre length in the top that could be predicted from the blend components. In other words processing performance was additive. This conclusion is most significant as it suggested that measurement of the raw material might ultimately provide a means of accurately predicting the processing performance of mill consignments and even individual sale lots thus providing a true measure of value.
WOOL422/522 Wool Marketing and Clip Preparation 2 - 19 ©2009 The Australian Wool Education Trust licensee for educational activities University of New England

It was clear that other factors would have to be considered and the most obvious one in relation to skirted fleeces that was known to have a major impact on fibre length in the top was staple strength or “tenderness”.
It was also important to establish the significance of “lower lines” such as skirtings, locks and crutchings in processing in order to provide a sound basis for clip preparation procedures.
2.13 Staple and fibre strength The arrangement of individual fibres in a staple is complex and extremely variable. Therefore, it might be preferable to know the average fibre strength rather than staple strength. This is not technically feasible on a commercial basis and may provide little, if any, advantage over staple strength, as the aim of the measurements we are considering is to enable the prediction of processing performance rather than an absolute value. In addition, it should be remembered that wool is presented to the card in a scoured form so that the staple structure may still exert a substantial influence on fibre breakage and, consequently, upon fibre length in the top.
Fibre strength and staple strength in greasy wool are useful in predicting fibre length in the top and beyond this point they have little or no value. For the prediction of spinning performance a measurement of fibre strength is required but this relates to fibre strength measured after top-making, during which process the fibres would have been broken at their weakest point thus invalidating any fibre or staple strength results that were obtained for the greasy wool.
It is now well established that staple strength, together with staple length, fibre diameter and VM content account for most of the variation observed in the conversion of greasy wool to top and in the quality of the top. This suggests that any alternate measurements could only provide marginal improvement.
2.14 Components of variation of staple strength Unlike fibre diameter and staple length, the greatest variation in staple strength in a mob of sheep is found among fleeces (Table 2.13).
Table 2.13 Components of Variation of Staple Strength. Source: Rottenbury and Smith (1979); Rottenbury et al. (1981).
However, the large variation among fleeces cannot be attacked very effectively by the classer because the traditional procedures for examining wool for staple weakness identified wools that we now know have a staple strength of only 20N/ktex and below.
The basic aim of traditional clip preparation methods was to achieve sale lots that would be easy to value using subjective procedures. Once objective procedures become available and their significance in processing determined, then this requirement disappears and becomes a burden on the system. In addition, the availability of objective measurement enables the demonstration of staple strength values (from 20 – 100 N/ktex ) far above the level at which wools were discounted under the old system. This higher range has an important influence on processing and, consequently, valuation (Rottenbury et al. 1985).
2 - 20 – WOOL422/522 Wool Marketing and Clip Preparation©2009 The Australian Wool Education Trust licensee for educational activities University of New England
Component Total Variation (%)Within Fleece Sites 20Among Fleece Sites 20Among Fleeces Within Mob 60

2.15 Variation in staple strength among fleeces from a mob
The major determinant of staple strength is nutrition, in particular, its consistency over the growing period. High average staple strength results from a ‘uniform’ nutritional intake, be it consistently low as in drought, or high as in a good season. Low average staple strength occurs when there is a variation in nutritional intake, such as in a change in seasonal conditions or stress e.g. from lambing or illness. The very wide distribution of staple strength that occurs among fleeces within mobs at all levels of staple strength is shown in Figs 2.9 and 2.10
Figure 2.10 illustrates the distribution of staple strength when the sheep had reasonably constant nutritional conditions. The average staple strength is 40 N/ktex which is high but there is a wide spread from “rotten” to quite exceptional strength.
Figure 2.9 The distribution of staple strength among the fleeces of a mob of sheep grown under constant levels of nutrition. Source: Rottenbury and Smith (1979).
Figure 2.10 The distribution of staple strength among fleeces of a mob of sheep grown under varying levels of nutrition. Source: Rottenbury and Smith (1979).
WOOL422/522 Wool Marketing and Clip Preparation 2 - 21 ©2009 The Australian Wool Education Trust licensee for educational activities University of New England

In Figure 2.10, the results are from sheep that experienced adverse nutritional conditions. The average strength is approximately half that for the fleeces in Figure 2.9 but there is still a wide spread of individual results.
2.16 Processing trials To examine the effect of separating the tender fleeces during clip preparation on subsequent processing performance, the tender and AAA lines from three clips were examined. The results in Table 2.14 show firstly that the tender lines all had staple strength values close to 20 N/ktex . For the strongest clip, A, a large difference was achieved (20N/ktex) between the sound and tender lines whereas in the weakest clip, C, the difference was only 7 N/ktex.
Table 2.14 Staple Strength of Sound and Tender Lines. Source: Rottenbury and Smith (1979).
MobStaple Strength (N/ktex)Tender AAA
Farm A 22 42Farm B 20 33Farm C 20 27
In contrast, reference to Figures 2.10 and 2.11 shows that the quantity of wool below the 20 N/ktex level is very small in the sound clip but very large in a tender clip.
The conventional wisdom would suggest that the tender lines would produce more card waste and noil accompanied by a reduction in fibre length in the top (Hauteur). Although this is the case (Table 2.15) the differences between the sound and tender lines in the mobs of low staple strength are small and there were no problems associated with the processing of the tender wool.
Table 2.15 Processing Sound and Tender Wools. Source: Rottenbury and Smith (1979).
Mob Line Card Loss (%)
Noil (%) Top Length (mm)
Short Fibre(< 25 mm)
Farm A AAATDR
6.27.0
4.86.2
7865
34
Farm B AAATDR
5.45.7
7.18.5
6157
1719
Farm C AAATDR
5.26.4
6.97.8
6158
1313
The largest difference was in the fibre length of the tops for Mob A. This is to be expected because of the substantial difference in staple strength. However, in this mob, the tender line represents only approximately 10% of the mob by weight and a mixture of the two lines would produce a top length of approximately 77mm. As the average staple strength of the fleeces in a mob decreases, the quantity of tender wool will increase and the difference between the sound and tender lines will decrease. In mobs B and C the fibre length in the top of the two lines differ only by 4 and 3 mm respectively.
Recalling again that the principle reason behind the classing of skirted fleeces was to assist valuation, the availability of staple strength testing enables one to reconsider whether the procedure is justified in terms of the processing results. There is certainly no suggestion that the inclusion of the tender line with the main lines will interfere with processing. The results will be in accord with the measurements obtained on the components.
2 - 22 – WOOL422/522 Wool Marketing and Clip Preparation©2009 The Australian Wool Education Trust licensee for educational activities University of New England

Note also that there are similarities in the processing performance of the sound and tender lines from the same clip but large differences between clips. For example, the two lowest levels of noil and of short fibres in the top, and the longest fibre length in the top, are all observed in the sound and tender lines of Clip A. These results also emphasise the uniformity of the mob and the value of maintaining fleeces from the same mob as a single unit.
It is necessary to take account of the price/strength relationships and the average staple strength of the mob to decide whether of not it is worthwhile to remove tender fleeces. Current regulations require that tender wool be removed.
2.17 General clip preparation The research has demonstrated that the availability of pre-sale testing of sale lots removes emphasis on the classing of skirted fleeces and the results proved that the performance of unclassed, skirted fleece lines could be predicted from the performance of their component classed lines.
Further research was then undertaken to determine whether this concept of additivity could be expanded to include all the lines from a mob of sheep. Classing (of fleeces) is only one aspect of clip preparation: the others are separation (of bellies, locks and stains), and skirting (of fleeces). This raises the issue of what preparation procedures optimise the processing of all the wool from a mob of sheep. A major research project was initiated in the late 70s to answer this question. One of the catalysts for the project was the research into automated shearing/biological defleecing. It was appreciated that these ‘wool harvesting’ alternatives to conventional shearing may well result in a fragmented fleece making it very difficult to separate belly wool and skirtings from fleece wool.
The eighteen project clips were selected to give a wide range of characteristics (Charlton 1983). The composition of the clips is illustrated in Table 2.16.
Table 2.16 Mob Structure (% by weight of 18 clips). Source: Charlton (1983).
Average (%) Range (%)Skirted Fleece 73 66 – 82Pieces 15 5 – 22Bellies 7 6 – 8Locks 3 1 – 5Stains 2 0 - 11
Each clip was prepared in accordance with the recommended Objective Clip Preparation procedures and, at the same time, unconventional lines were prepared to represent the effect of each preparation step, i.e. separation, skirting and classing. These unconventional lines and their component conventional lines were:
1. Mob Unit, the entire wool production from the mob, i.e. classed fleece lines (e.g. AAAM, BBB, TDR, COL) + pieces + bellies + locks + stains;
2. Unskirted/Unclassed fleece line, i.e. classed fleece lines (e.g. AAAM + BBB + TDR + COL) + pieces;
3. Skirted/Unclassed fleece line, i.e. classed fleece lines (e.g. AAAM + BBB + TDR + COL);
4. NON FLC i.e. pieces + bellies + locks + stains.
WOOL422/522 Wool Marketing and Clip Preparation 2 - 23 ©2009 The Australian Wool Education Trust licensee for educational activities University of New England

The influence that each sequential preparation step has on ‘improving’ the fleece characteristics may be assessed by comparing lines as follows: Separation – 1. Mob Unit with 2. Unskirted/Unclassed fleece line, Skirting – 2. Unskirted/Unclassed line with 3. Skirted/Unclassed line, Classing – 3. Skirted/Unclassed line with the AAAM line.
Separation and skirting can be expected to reduce the vegetable matter content of fleeces in clips with vegetable matter contamination although the reduction is dependent on the degree of contamination and the level of skirting undertaken. However, any reduction in the vegetable matter content of fleece-wool is at the ‘cost’ of forming BLS and PCS lines with VM contents much higher than any of the fleece-wool lines (Charlton 1983).
The average raw wool characteristics of fibre diameter, staple length and staple strength for each clip line are summarized in Table 2.17.
The accumulative effect on the fleece characteristics as a result of separation, skirting and classing was marginal (typically 1 unit) although separation and skirting produced lower lines that measured significantly different to the fleece wool.
Table 2.17 Influence of Preparation on Some Raw Wool Characteristics – Average for All Clips. Source: Charlton (1983).
Line Fibre Diameter (um)
Staple Length (mm)
Staple Strength (N/ktex)
AAAM 20.9 91 40Unclassed/Skirted Fleeces 21.2 92 41Unclassed/Unskirted Fleeces 21.0 92 41Mob Unit 21.0 90 40PCS 19.9 79 38BLS 20.7 73 29NON FLC 20.5 75 37
Selected lines from various clips were processed to assess the impact preparation procedures had on processing losses and top characteristics. Top fibre diameter and fibre length results are given in Table 2.18.
Table 2.18 Influence of Preparation on Top Diameter and Length. Source: Rottenbury (1983).
LineFibre Diameter Fibre Length - Hauteur
Mean (um) CV (%) Mean (mm) CV (%)AAAM 22.6 21.4 67 50Unclassed/Skirted Fleeces 22.8 21.9 68 50Unclassed/Unskirted Fleeces 22.8 22.3 66 51Mob Unit 22.7 22.0 64 51PCS 22.2 22.0 57 52BLS 22.8 21.1 54 51NON FLC 22.3 23.0 55 52
As might be anticipated from the raw wool characteristics (Table 2.17), preparation had very little influence on fleece fibre diameter. In the case of top fibre length, there was an improvement of 4mm in fleece lines from separation and skirting but classing reduced this by only 1mm. The lower lines produced tops that were up to 13 mm shorter than the fleece lines.
2 - 24 – WOOL422/522 Wool Marketing and Clip Preparation©2009 The Australian Wool Education Trust licensee for educational activities University of New England
In terms of variability, there was little or no change in CV of fibre length due to preparation, while fibre diameter variability was reduced by about half a percent by classing. The research showed that, in general, much larger differences in fibre variability (diameter and length) exist between different clips than amongst lines within a clip (Rottenbury 1983). That is, variability is a function of breeding and nutrition, not preparation.
Top quality and hence top value, is dependent not only on diameter and length values but also on the presence of discountable faults, such as colour, VM Particles and Dark Fibre Content. Results for these top faults are given in Table 2.19.
Separation and skirting had little or no effect on top colour. Separation and to a lesser extent, skirting, did result in lower VM Particles for the high VM group. Classing gave the lowest values for VM Particles although the reduction was not particularly significant. It should be noted that the techniques adopted by commercial processors when combing high fault wool could be expected to produce much lower levels of VM Particles in the top than those reported here (Plate & Robinson 1983).
The most significant effect of preparation was achieved in the Dark Fibre count by separation. This was not unexpected since any urine-stained wool present on the sheep was not removed from the BLS or PCS and was a component of the NON FLC line. This was the major difference in the preparation for these experimental clips compared with normal preparation that requires the complete removal of stains. Non removal of stains was a deliberate decision taken in order to examine the degree to which urine stain may contaminate clip lines if not effectively removed in clip preparation. Detailed information on dark fibre research and the analysis conducted on these clips has been reported (Foulds 1989; Burbidge McInnes & Foulds 1991).
Table 2.19 Influence of Preparation on Top Faults. Source: Rottenbury (1983).
. Line
Colour* VM Particles**
(/100g)Dark Fibres (/100g)
Brightness Yellowness High LowAAAM 83 11 115 50 75Unclassed/Skirted Fleeces
83 11 134 72 55
Unclassed/Unskirted Fleeces
83 12 150 72 45
Mob Unit 82 12 206 62 1735PCS 81 13 420 143 475BLS 80 13 436 152 5210NON FLC 80 14 436 140 8865
* High values indicate higher levels of Brightness and higher levels of Yellowness . ** The 18 clips were divided into two groups representing high and low levels of VM contamination
2.18 AdditivityThe additivity of processing, with respect to clip preparation procedures, is illustrated in Table 2.20 for processing losses and top fibre length. The actual results obtained for the MOB UNIT from six clips are compared with predicted results based on the measurements and quantities of the component lots, that is, the Unclassed/Skirted fleeces and the NON FLC Lines.
WOOL422/522 Wool Marketing and Clip Preparation 2 - 25 ©2009 The Australian Wool Education Trust licensee for educational activities University of New England

Table 2.20 Additivity of Processing – Predicted and Actual Performance of the Mob Unit. Source: Rottenbury (1983).
ClipCard + Noil Loss (%) Top Fibre Length – Hauteur (mm)
Actual Predicted Actual PredictedB 24.7 25.0 57 56C 18.5 18.3 74 71D 33.9 30.2 59 62E 18.6 19.3 60 62F 13.9 14.3 63 62K 13.4 12.1 69 67Mean 19.9 19.9 64 63
The results obtained were predictable on an additive basis. The lower lines were slightly weaker, shorter by about 12mm and heavier in vegetable fault. There were heavier losses during top-making in the lower lines due primarily to the vegetable fault and shorter fibre length in the top due to the shorter staple length of these lines.
A further illustration of processing additivity, this time relating to skirting, may be obtained by comparing the actual result for the Unskirted/Unclassed line and the predicted result, calculated from the weighted results for the two component lines, namely, the Skirted/Unclassed and PCS lines.
2.19 DiscussionIt has been demonstrated that the processing results of combined lines may be predicted from the weighted combination of their component lines, with the exception of Dark Fibre Count. However, the successful commercial application of this knowledge, particularly where it involved significant departures from ‘acceptable’ clip preparation procedures, may be dependent on ‘additivity’ also applying to the ’commercial’ value of tops resulting from alternative preparation procedures.
For example, would the value of a top produced from Unskirted/unclassed fleeces be the same as the weighted combined price for the two component tops, i.e. the Skirted/Unclassed fleeces and the PCS? This question was considered as part of the ‘Preparation for Processing’ research outlined earlier. A ‘blind’ valuation was conducted on the tops by commercial topmakers and the results reported (Bell 1983). The presence of dark fibres complicated the analysis due to the high discount applied to tops that exceeded the ‘acceptable’ count. However, when the valuations were adjusted to remove the dark fibre discount, the value of tops comprising combinations of lines was equivalent to the combined value of the tops produced from their component lines (D.Charlton, pers. Comm..).
The results provide a basis for examining clip preparation procedures to ensure that they add value to the processing of the total production from a mob. From a technological point of view the additive nature of the results obtained here suggest that many of the traditional steps do not add value i.e. they do not provide a synergistic effect. The only obvious exception being dark fibre content.
The surprising aspect of this work is that all the wools even those with high VM contents processed satisfactorily on the worsted system. If the processor is able to effectively remove VM, as some certainly can, then no problems would be expected with later stages of processing.
Dark fibres are a much more serious problem and the inclusion of even a very small quantity of urine-stained wool could contribute to unacceptable levels in downstream processing and the quality of the final fabric or garment. The need for effective stain removal, ideally prior to shearing, is extremely important. Research into dark fibre contamination and its avoidance has been reported (Foulds 1989; Burbidge, McInnes & Foulds 1991).
2 - 26 – WOOL422/522 Wool Marketing and Clip Preparation©2009 The Australian Wool Education Trust licensee for educational activities University of New England
A final point is that the conclusions drawn here are based on processing performance and changes can only be introduced after commercial interests have accepted the results. Successful commercial adoption of these results has occurred only to a limited extent.
Fibre direct (1997) developed a brokerage system based on the sale of tops. Growers who consign their wool to Landmark Fibre Direct must agree to a set of procedures based heavily on the above (refer Topic 11) and other research.
The main steps involved are:
Within 3 months of shearing crutch ewes and /or pizzle ring wethers to remove stain. 5 – 9 weeks before shearing an accredited person takes midside samples and inspects the
shearing shed and yards. At shearing an accredited person overseas implementation of Fibre Direct clip preparation
standards, core testing and bale weighing procedures. During shearing particular care is taken to remove stains, pigmented fibres and non-wool
contaminants. All wool shorn from each sheep is then placed directly in the press.
These procedures are technically sound from a processing point of view but call for a much closer relationship between wool producers and early stage processors.
2.20 The mob concept From a processing point of view, pre-sale testing removed the need for classing of fleeces from the same mob for yield, fineness, length and strength. It was also recognised that all fleeces in a mob were comparatively uniform in respect to a number of important characteristics including style, tip damage and non-wool contaminants such as dirt and vegetable fault. This is not surprising as all sheep in a mob are subject to the same environmental and nutritional conditions. In the case of staple strength it would be expected that all fleeces would have a similar diameter profile along the length of individual fibres and, although individual sheep would show a good deal of variation in their resistance to nutritional changes during the growth period, there would be similarities in their processing performance (Table 2.15). Therefore, there are good reasons for keeping the fleeces from the same mob together rather than trying to match portions of the fleeces from different clips.
WOOL422/522 Wool Marketing and Clip Preparation 2 - 27 ©2009 The Australian Wool Education Trust licensee for educational activities University of New England
Readings The following readings are available on CD
1.Andrews, M.W. 1979, Processing Studies, Proc. of a seminar on staple length and staple strength of greasy wool: Measurement and effects on worsted processing, CSIRO Division of Textile Physics. Paper, 5. p. 93.
2.Bell, P.J.M. 1983, Implications for Topmakers and Woolcombers or Alternate Clip Preparation Procedures, Proceedings of a Seminar on Clip Preparation Research, CSIRO Division of Textile Physics and Australian Wool Corporation, Paper 9, p. 127.
3.Bow, M.R. 1979, Staple length, Processing Studies, Proceedings of a Seminar on Staple Length and Staple Strength of Greasy Wool: Measurement and Effects on Worsted Processing, CSIRO Division of Textile Physics, Paper 1, p. 17.
4.Plate, D.E.A. and Robinson, G.A. 1983, Clip preparation trials – processing performance from top to knitted fabric, Proceedings of a Seminar on Clip Preparation Research, CSIRO Division of Textile Physics and Australian Wool Corporation, Paper 9, pp. 93-108.
5.Rottenbury, R.A. 1979, Staple strength-appraisal and measurement, Proceedings Studies, Proceedings of a Seminar on Staple Length and Staple Strength of Greasy Wool: Measurement and Effects on Worsted Processing, CSIRO Division of Textile Physics, Paper 2, p. 39.
6.Rottenbury, R.A. 1983, The influence of preparation procedures on processing performance,’ Proceedings of a Seminar on Clip Preparation Research, CSIRO Division of Textile Physics and Australian Wool Corporation, Paper 7, pp. 61-76.
7.Whiteley, K.J. 1983, Fleece variability – its impact on processing, Proceedings of a Seminar on Clip Preparation Research, CSIRO Division of Textile Physics and Australian Wool Corporation, Paper 4, p. 27.
ActivitiesAvailable on WebCT
Multi-Choice QuestionsSubmit answers via WebCT
Useful Web LinksAvailable on WebCT
Assignment QuestionsChoose ONE question from ONE of the
topics as your assignment. Short answer questions appear on WebCT. Submit your answer via WebCt
2 - 28 – WOOL422/522 Wool Marketing and Clip Preparation©2009 The Australian Wool Education Trust licensee for educational activities University of New England

Summary Summary Slides are available on CD
Traditional clip preparation procedures were aimed at achieving a high level of visual uniformity. This applied particularly to the major fleece lines. Clean wool prices at auction were determined primarily by quality number and style with staple length and vegetable fault content playing minor roles. When measured fibre diameter, yield and vegetable fault were accepted as the commercial basis for the trading of mill consignments it became important to determine whether traditional clip preparation procedures were still appropriate. Results indicated that it was difficult to achieve significant differences in measured characteristics between classed lines by visual sorting, especially for fibre diameter. A new simplified approach to clip preparation, involving maintaining most of the skirted fleeces in one major line, was introduced. It was called Objective Clip Preparation (OCP).
The major differences in fibre diameter and fibre length are to be found among fibres within a staple. Sorting skirted fleeces using subjective methods improves visual uniformity of the resulting lines but has an insignificant effect on the uniformity of either fibre diameter or fibre length. Processing results prove conclusively that the skirted fleeces from a single mob will process according to the average values of their measured characteristics.
he major source of staple strength variation within a mob is to be found among fleeces and those with a staple strength of 20N/ktex or less are generally recognised as “tender”. However the staple strength of fleeces can be as high as 100N/ktex. In sound clips preparation of a tender line using manual methods of strength appraisal results in a very small tender line and a substantial difference between its average staple strength and that of the main fleece line. In tender clips the tender line is large but the difference in staple strength compared to the main fleece line is very small. Processing trials indicate that in both cases mixing the sound and tender lines together has very little effect on the final outcome.
The lower lines in a clip, the bellies and the skirtings (pieces, locks, stains) can all be processed on the worsted system without difficulty. The main function of skirting is to reduce the VM content of the main lines and the frequency of dark fibres. Dark fibres represent a particular difficulty as a very small amount of wool containing dark fibres can raise the main lines to unacceptable levels. Pre-shearing crutching is the most effective method of reducing the dark fibre count.
ReferencesAndrews, M.W. 1974, Fibre length variation in wool (“OMSA’74”), Proceedings. of Objective
Measurement Symposium – Australia, Australian Wool Corporation, Paper 5.Andrews, M.W., Blankenburg, G., Bownass, R., Mackay, B.H. and Walls, G.W. 1979, Processing
traits on wool classed by objective clip preparation, Journal of Textile Institute, vol. 70, p. 230. Andrews, M.W. and Rottenbury, R.A. 1975, The prediction of the fibre length of wool tops, Journal
of Textile Institute, vol. 65, p. 200. Bastawisy, A.D., Onions, W.J. and Townend, P.P. 1961, relationships between the properties of
/fibres and their behaviour. Journal of Textile Institute, vol. 52, p. T1. Baxter, B.P. 2001, ‘Precision of measurement of diameter, and diameter-length profile, of greasy
wool staples on-farm, using the OFDA2000 instrument,’ Wool Technology and Sheep. Breeding, vol. 49(2), pp. 42-52.
WOOL422/522 Wool Marketing and Clip Preparation 2 - 29 ©2009 The Australian Wool Education Trust licensee for educational activities University of New England
Bell, P.J.M. 1983, Implications for topmakers and woolcombers or alternate clip preparation procedures, Proceedings. of a Seminar on Clip Preparation Research, CSIRO Division of Textile Physics and Australian Wool Corporation, Paper 9, p. 127.
Bow, M.R. 1979, Staple length, Processing Studies, Proceedings. of a Seminar on Staple Length and Staple Strength of Greasy Wool: Measurement and Effects on Worsted Processing, CSIRO Division of Textile Physics, Paper 1, p. 17.
Burbidge, A., McInnes C.B. and Foulds, R.A. 1991, Development and preliminary evaluation of the CSIRO dark fibre risk scheme for individual sale lots of Australian wool, Proceedings. of IWTO, Technology and Standards Committee Meeting, Lisbon, Report No. 12.
Charlton, D. 1983, The influence of preparation procedures on raw wool characteristics, Proceedings. of a Seminar on Clip Preparation Research, CSIRO Division of Textile Physics and Australian Wool Corporation, Paper 6, p. 51.
Charlton, D. and David, H.G. 1987, The myth of the fine line, Wool Technology and Sheep Breeding., vol. 35(2), pp.131-141.
Charlton, D. and Whiteley, K.J. 1973, Some observations on the relationship of quality number, crimp frequency and fibre diameter in Australian greasy-wool sale-lots, in: Objective Measurement of Wool in Australia, Australian Wool Corporation., Technical Report, Paper No. 9.
David, H.G., McKay, B.H. and Charlton, D. 1973, Objective measurement of yield and fineness” objective measurement of wool in Australia, in: Objective Measurement of Wool in Australia, Australian Wool Corporation, Technical Report, Paper No. 15.
Duerden, J.E. 1929, Standards of thickness and crimps in Merino grease wools, Journal of Textile Institute, vol. 20, p. T93.
Dunlop, and McMahon, P.R. 1973, The relative importance of sources of variation in fibre Diameter for Australian Merino sheep, Objective Measurement of Wool in Australia, in: Objective Measurement of Wool in Australia, Australian Wool Corporation, Technical Report, Paper No. 5
Fibre Direct, 1997, Fibre Direct Grower Manual, Australian Wool Enhancers. Foulds, R.A. 1989, Dark fibre contamination in wool: Its prediction and ramifications, Wool
Technology and Sheep Breeding., vol. 37(1), p. 33.Hansford, K.H. 1997, A study of the specification and topmaking performance of Western
Australian fleece and sale lots, Proceedings. of IWTO, Technology and Standards Committee Meeting, Report 15.
Hopkins, H.W. and Whiteley, K.J. 1973, Subjective and objective estimates of greasy wool Part I: Fibre diameter, in: Objective Measurement of Wool in Australia, Australian Wool Corporation., Technical Report, Paper No. 11.
Humphries, W., Lukovic, L., Aspros, W.A. and Higgerson, G.J. 2001, Sirolan fleecescan: Performance and benefits of in-shed individual fleece testing, Proceedings. of IWTO, Technology and Standards Committee Meeting, Report No: CTF04.
Japan Wool Spinners Assoc. 1980, Joint wool processing experiments, CSIRO Division. Text. Physics and Australian Wool Corporation.
Lang, W.R. 1947. , The dependence of wool quality number on crimp and fineness in Australian wool, Journal of Textile Institute., vol. 38, p. T241.
Lunney, H.W.M. 1983, Traditional woolclassing – The background to the clip preparation research seminar, Proceedings. of a Seminar on Clip Preparation Research, CSIRO Division of Textile Physics and Australian Wool Corporation, Paper 2, p. 7.
McKinnon, J.M., Constantine, G. and Whiteley, K.J. 1973, Price-determining characteristics of greasy wool Part I: General study, in: Objective Measurement of Wool in Australia, Australian Wool Corporation., Technical Report, Paper No. 2.
McKinnon, J.M. and Whiteley K.J. 1973, Some observations on the objective characteristics of classed wool clips Part I: District analysis, in: Objective Measurement of Wool in Australia, Australian Wool Corporation., Technical Report, Paper No. 35.
Martindale, J.G. 1945, A new method of measuring the irregularity of yarns with some observations on the origin of irregularities in worsted slivers to yarns, Journal Of Textile Institute, vol. 36, p. T35.
Plate, D.E.A. and Robinson, G.A. 1983, Clip preparation trials – Processing performance from top to knitted fabric, Proceedings of a Seminar on Clip Preparation Research, CSIRO Division of Textile Physics and Australian Wool Corporation, Paper 9, p. 93.
2 - 30 – WOOL422/522 Wool Marketing and Clip Preparation©2009 The Australian Wool Education Trust licensee for educational activities University of New England
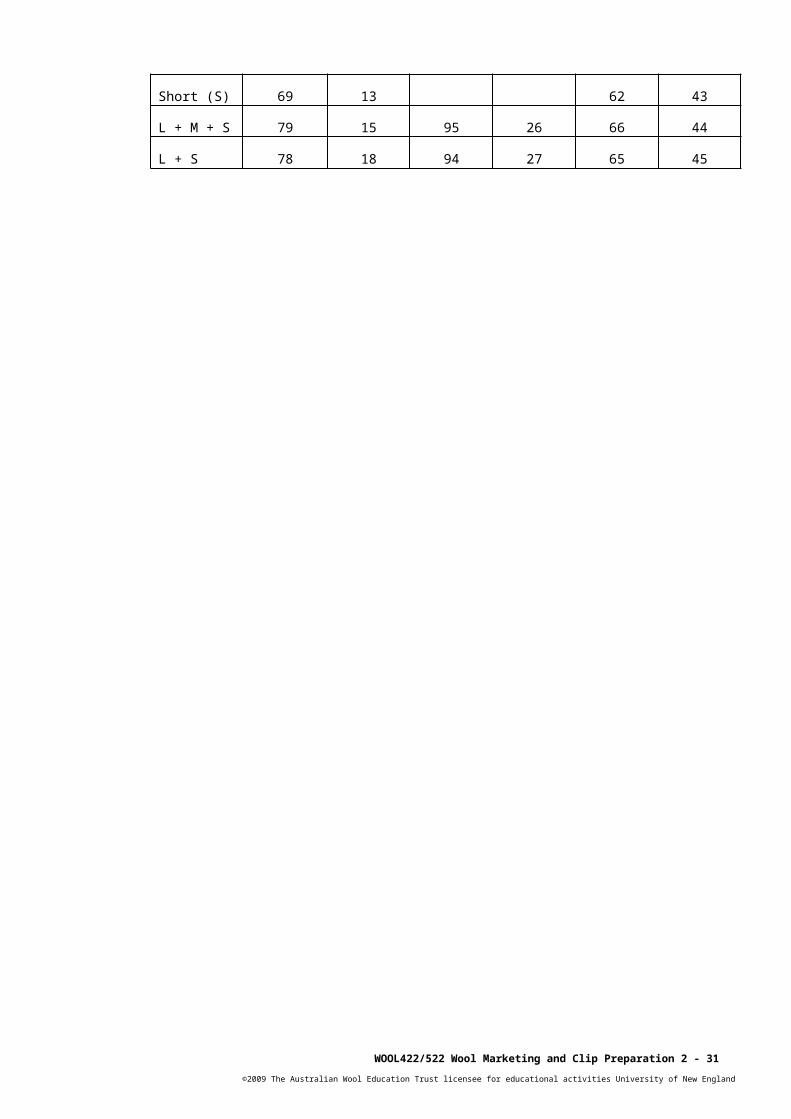
Quinnell, B., Whiteley, K.J. and Roberts, E.M. 1973, Variation in fibre diameter of wool fibres: A review, in: Objective Measurement of Wool in Australia, Australian Wool Corporation., Technical Report, Paper No. 4.
Roche, J. 1995, The International Wool Trade, WOODHEAD Publishing, Cambridge, England, ISBN 1 85573 191 6.
Rottenbury, R.A. 1983, The influence of preparation procedures on processing performance, Proceedings. of a Seminar on Clip Preparation Research, CSIRO Division of Textile Physics and Australian Wool Corporation, Paper 7, p. 61.
Rottenbury, R.A. and Andrews, M.W. 1975, ‘Fibre length variation in wool’, Wool Technology and Sheep Breeding., vol. 22(1), p. 27.
Rottenbury, R.A., Andrews, M.A., Bell, P.J.M. and Bownass, R. 1985. The effect of the strength properties of wool staples on worsted processing Part I: The level of staple strength, Proceedings. IWTO Technical Committee Meeting, Paris, Report No. 13.
Rottenbury, R.A., Bow, M.R., Kavanagh, W.J. and Caffin, R.N. 1981, Staple strength variation in Merino flocks, Wool Technology and Sheep Breeding., vol. 29(4), p. 143.
Rottenbury, R.A. and Smith, L.J. 1979, The processing consequences of classing fleeces for staple strength, Proceedings. IWTO Technical Committee Meeting, London, Report No. 5.
Skinner, J.N. 1964, Are we giving away our best wool? Wool Technology and Sheep Breeding, vol. 11(1), p. 15.
Whan, R.B. 1971, BAE Res. Report No. 21, Canberra. Whan, R.B. 1973, Staple-length variation in greasy wool, in: Objective Measurement of Wool in
Australia, Australian Wool Corporation., Technical Report, Paper No. 6.Whan, R.B. 1973, Fibre-length variation in greasy wool. in: Objective Measurement of Wool in
Australia, Australian Wool Corporation. Technical Report, Paper No. 7.Whan, R.B. 1973, The effect of fibre-length and staple-length variation in processing, in: Objective
Measurement of Wool in Australia, Australian Wool Corporation., Technical Report, Paper No. 8.
Whiteley, K.J. 1974. Objective measurement symposium, Australia. Australian Wool Corporation, Melbourne. Paper 4.
Whiteley, K.J. 1983, Fleece variability – its impact on processing, Proceedings of a Seminar on Clip Preparation Research, CSIRO Division of Textile Physics and Australian Wool Corporation, Paper 4, p. 27.
Whiteley, K.J. and Charlton, D. 1973, Some observations on the relationship of quality number, crimp frequency and fibre diameter in Australian greasy-wool sale lots, in: Objective Measurement of Wool in Australia, Australian Wool Corporation., Technical Report, Paper No. 9.
Whiteley, K.J. and Hopkins, H.W. 1973, Subjective and objective estimates of greasy wool, Part II: yield and vegetable matter, in: Objective Measurement of Wool in Australia, Australian Wool Corporation., Technical Report, Paper No. 12.
Whiteley, K.J. and McKinnon, J.M. 1973, Some observations on the objective characteristics of classed wool clips, Part III: Fibre diameter groups, in: Objective Measurement of Wool in Australia, Australian Wool Corporation., Technical Report, Paper No. 37.
Whiteley, K.J. and Welsman, S.J. 1977, Minspec, Australian Wool Corporation.Whiteley, K.J. and Wilkins, O.D. 1973, Some observations on the objective characteristics of
classed wool clips, Part II: A theoretical approach to wool classing, in: Objective Measurement of Wool in Australia, Australian Wool Corporation., Technical Report, Paper No. 36.
WOOL422/522 Wool Marketing and Clip Preparation 2 - 31 ©2009 The Australian Wool Education Trust licensee for educational activities University of New England
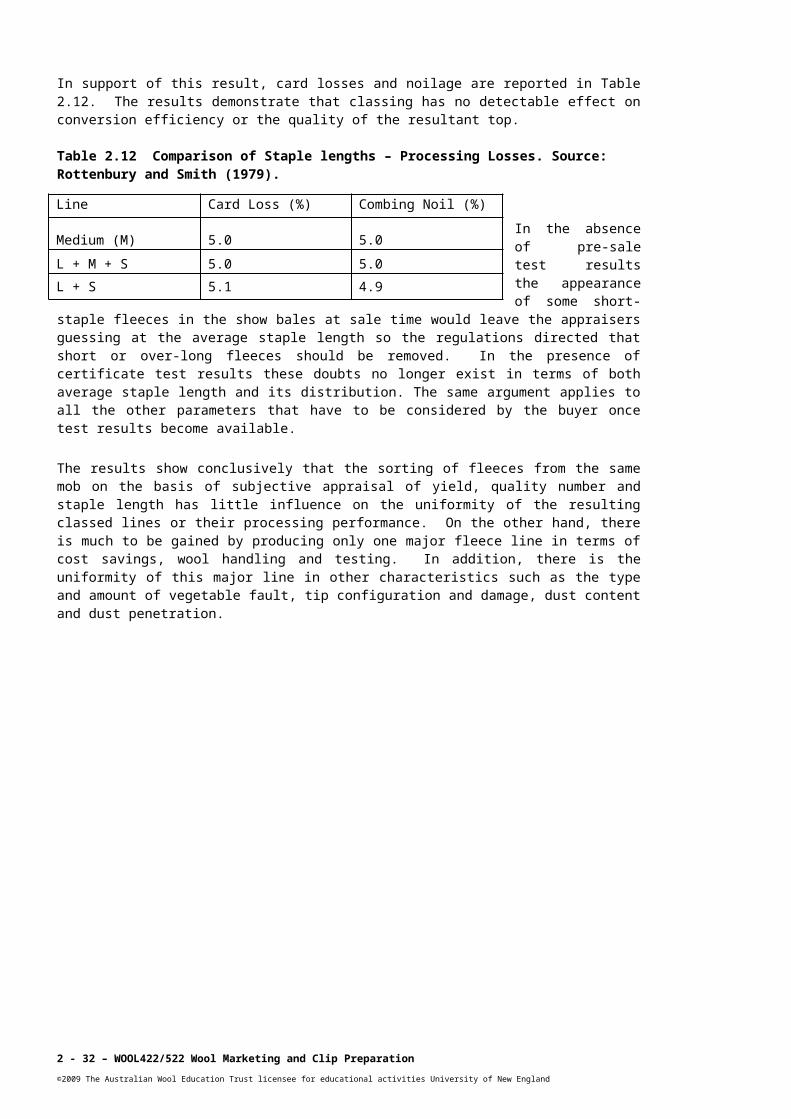
Glossary of terms
Broad Wool with a coarse fibre diameter. In merinos this often refers to wool over 23 microns in average fibre diameter
Card Waste Due to fibre breakage during carding there is a loss of fibre as card fly and in the removal of vegetable fault
Condition line A classed line comprising fleeces of lower yield and inferior, but scourable, colour. These lines were usually referred to as AA or AACOM depending on whether they were comprised of the finer or coarser fleeces from the mob
Cotted Fleeces that have become matted due to fibre entanglement. Associated with tenderness
“Dermo” Fleeces from animals infected with dermatitis
Doggy Coarse wool of high lustre that may develop with age
Fineness, Quality Number, Spinning Count
Terms originally referred to the spinning performance of wool but known to be based primarily on staple crimping
Flock All the sheep on a property
Hauteur Traditional term for fibre length in the top
Mill Consignment Composed of many different growers’ sale lots to fill an order
Mob A group of sheep of the same breed run together since the last shearing, for example adult ewes or young sheep etc.
NoilThe short fibre removed during the combing process. It is of low value and is processed on the woollen system
Objective Clip Preparation A system of clip preparation that was accepted with the introduction of pre-sale testing for yield and fibre diameter. Fleeces were maintained in one major line with only the very short, very coarse and tender fleeces removed together with other fleeces containing obvious faults
Style
A term describing the visual appearance of wool including staple shape, and crimp structure, dust contamination and additional boundary conditions regarding vegetable fault and staple strength
Tender Staple strength as appraised by manually breaking the staple
Wool topA rope-like assembly of fibres produced by carding, gilling and combing
Worsted Processing
The major processing pathway for Australian wool. Involves extensive combing to produce an assembly of parallel fibres that can be spun into fine uniform yarns
Worsted Spinning
Wool tops are reduced in thickness by drafting into rovings and then twisted to form yarns. The major guide to spinning performance is the number of breakages at a given spinning speed (ends down/100 spindle hours). Yarn quality is gauged by breaking load, breaking extension, evenness and hairiness
2 - 32 – WOOL422/522 Wool Marketing and Clip Preparation©2009 The Australian Wool Education Trust licensee for educational activities University of New England