microsoft word - section 9
TRANSCRIPT

7/27/2019 Microsoft Word - Section 9
http://slidepdf.com/reader/full/microsoft-word-section-9 1/34
Level I Course Manual – Section 9Publ No 1 560 009 C
1
9. Application studies
Thermographic inspection of electrical installationsBy
Vicente Ribeiro/Bo WallinAGEMA Infrared Systems AB
1. Introduction
Thermography is today, in the crossover from one millenium to another, a well-established technique for the inspection of electrical installations. This was the first andis still the largest application of thermography. Today we have many years of experience of thermography as a leading technique for inspection of electricalinstallations. The infrared camera itself has gone through an explosive developmentand we can say that today the 8th generation of thermographic systems is available. Itall began in 1964. This is about a third of a century ago. The technique is nowestablished throughout the whole world. Industrialized countries as well as developingcountries have adopted this technique. Some of the systems are shown below.
Figure 1.Thermovision 750 from 1973. Figure 2. Thermovision 470 from 1988.The first portable thermographic system. The first system in one piece.
Figure 3. AGEMA 570 from 1997, the first portable system with an uncooled detector.
7/27/2019 Microsoft Word - Section 9
http://slidepdf.com/reader/full/microsoft-word-section-9 2/34
Level I Course Manual – Section 9Publ No 1 560 009 C
2
Thermography in conjunction with vibration analysis has over the latest decades beenthe dominating method for fault diagnostics in the industry as a part of the preventivemaintenance program. The great advantage of these methods is that it is not onlypossible to carry out the inspection on installations in operation, but it should be donethen. So the ongoing production process is not disturbed. Thermographic inspection of electrical installations are used in three main areas:
Power generationPower transmissionPower distribution, i.e. industrial use of electrical energy.Installation with less intense use of electricity. This has become the casemainly over the latest years.
The fact that these controls are carried out under normal operation conditions hascreated a natural division between these groups. The power generation companies
measure during the periods of high load. These periods vary from country to countryand with the climatic zones. The measurement periods may also differ depending onthe type of plant to be inspected, be it hydroelectric, nuclear, coal-based or oil-basedplants.
In the industry in the inspections are – at least in Nordic countries with clear seasonaldifferences – carried out during spring or autumn or short before longer stops in theoperation. Thus repairs are made when the operation is stopped anyway. However,this seems to be the rule less and less, which has lead to inspections of the plantsunder varying load and operation conditions.
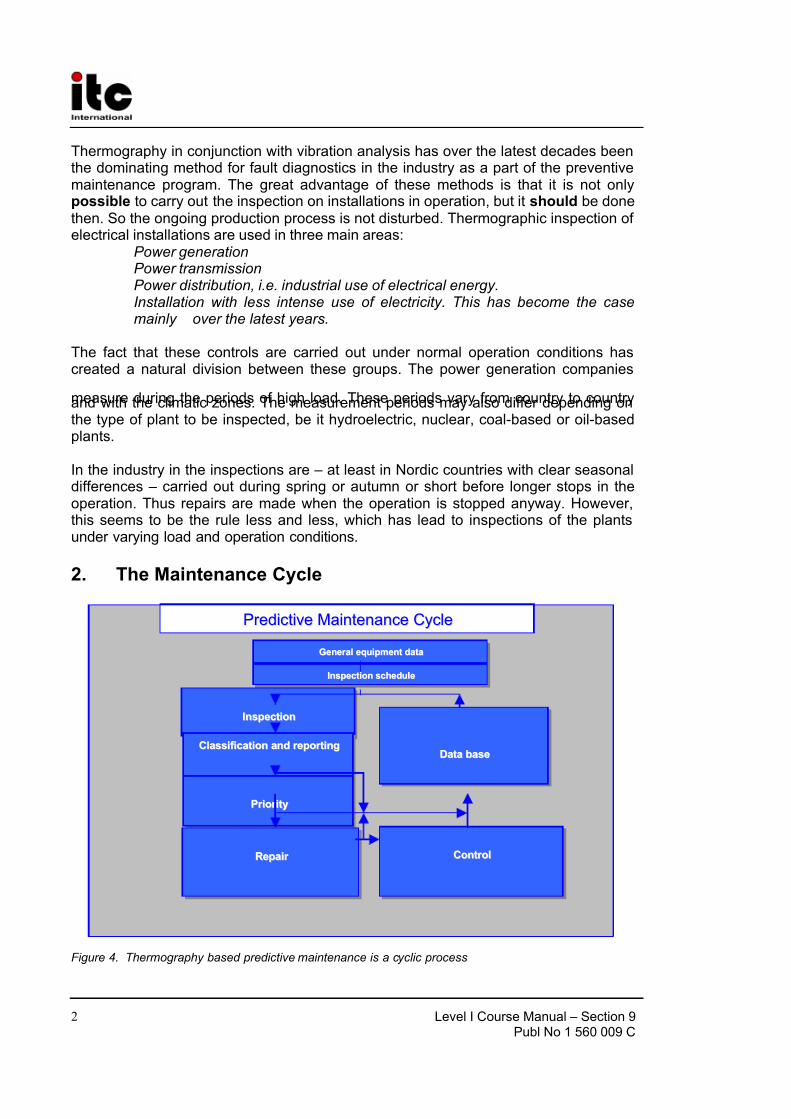
2. The Maintenance Cycle
Figure 4. Thermography based predictive maintenance is a cyclic process
PPr r eeddiiccttiivvee MMaaiinntteennaannccee CCyyccllee
GGeenneer r aall eeqquuiippmmeenntt ddaattaa
IInnssppeeccttiioonn sscchheedduullee
IInnssppeeccttiioonn
CCllaassssiif f iiccaattiioonn aanndd r r eeppoor r ttiinngg
PPr r iioor r iittyy
DDaattaa bbaassee
CCoonnttr r ooll RReeppaaiir r

7/27/2019 Microsoft Word - Section 9
http://slidepdf.com/reader/full/microsoft-word-section-9 3/34
Level I Course Manual – Section 9Publ No 1 560 009 C
3
2.1 General equipment dataThe equipment to be inspected has a certain temperature behaviour that should beknown to the thermographer before the inspection takes place. In the case of electricalequipment the physical principle of why faults show a different temperature patternbecause of increased resistance or increased electrical current is well known.
However is good to think that, in some cases, e.g. solenoids, “temperature rise “ isnatural and does not correspond to a developing defect. In other cases, like theconnections in electrical motors, the temperature rise might depend on the fact that thehealthy part is taking the entire load and therefore becomes overheated. A similar example is shown in chapter 5.6.1.
Defective parts of electrical equipment can therefore both show a temperature rise andbe cooler than the normal “healthy” components. It is necessary to be aware of what to
expect by getting as much information as possible about the equipment before it isinspected.The general rule is, however, that a hot spot is a probable defect. The temperature andthe load of that specific component at the moment of the inspection will give anindication of how serious the fault is and can become in other conditions.
Correct assessment in each specific case demands detailed information about thethermal behaviour of the components, i.e. we need to know the maximum allowedtemperature of the materials involved and the role the component plays in the system.Cables, for example, lose their insulation properties above a certain temperature, whichincreases the risk for fires.
In the case of breakers, at too high temperature parts can melt and make it impossibleto open the breaker, thereby destroying its functionality.
The more the IR camera operator knows about the equipment that he or she is about toinspect the higher the quality of the inspection. But it is nearly impossible for an IRthermographer to have detailed knowledge about all the different types of equipmentthat can be controlled. It is therefore almost a must that a person responsible for theequipment is present during the inspection.
2.2 Inspection schedule
Condition monitoring of equipment is a cyclic process. The period between inspectionsis dependent on the type of components, their strategic importance and the loads theycarry. The vicinity to the salt air of the sea, or the acid ambience of a paper mill is morecorrosive and requires more frequent controls. The same applies for the equipment thatis often subjected to heavy and quickly changing loads like in a hot rolling mill.
The importance of the equipment is also an important factor when determining thefrequency of the inspections. It is important to find faults in a distribution power line inorder to save time and to direct the repair crew to the right spot. A defect in a highvoltage power line can cause, should a fault occur, very heavy economical and other losses. It has, therefore, normally a much higher priority. The frequency of inspection of power lines is therefore higher than for distribution lines.

7/27/2019 Microsoft Word - Section 9
http://slidepdf.com/reader/full/microsoft-word-section-9 4/34
Level I Course Manual – Section 9Publ No 1 560 009 C
4
The ambient and the working conditions of the equipment as well as its importancedetermine the schedule of the inspection. So does the age of the equipment and thenumbers and gravity of the defects found during previous inspections.
2.3 InspectionThe preparation of the inspection should include the choice of the right type of templateto use and the type of report to make. It is often necessary to use complementaryequipment like ammeters in order to correctly measure the current in the found defects.Furthermore you have to decide about anemometers if you want to measure the windspeed in case of high voltage equipment at outdoor inspection.
Modern report software makes it a 5-minute work to report the 20-30 defects you mayhave found during a substation inspection. Provided, of course, that the inspection wasduly prepared and that the data collection during the inspection was done
systematically.
Figure 5. Thermographic inspection of a substation
In all cases, the inspection starts by collecting the general parameters. They can berecorded in the report comment of the AGEMA software. Information is also neededabout the ambient conditions or load conditions, which applies for all the group of components in the report. After that the operator scans the equipment with the camera.
In modern cameras the automatic functions help the IR operator to visualise an IRimage of the components with the right contrast to allow easy identification of a fault or a hot spot. It is nearly impossible to miss a hot spot on a scanned component. Ameasurement function will also automatically display the hottest spot within an area inthe image or the difference between the maximum temperature in the chosen area anda reference, which can be chosen by the operator, for example the ambienttemperature.

7/27/2019 Microsoft Word - Section 9
http://slidepdf.com/reader/full/microsoft-word-section-9 5/34
Level I Course Manual – Section 9Publ No 1 560 009 C
5
Figure 6. Thermal image of a hot spot Figure 7. Photo of the component in figure 6.
When the fault is clearly identified and the IR thermographer has made sure that it isnot a reflection or a naturally occurring hot spot, the collection of the data starts, whichwill allow the correct reporting of the fault. The emissivity, the identification of thecomponent, and the actual working conditions will, together with the measuredtemperature, be used in the report. In order to make it easy to identify the component avisual photo of the defect is often taken. With the increasing resolution of the IR imagesthe need for photos will decrease.
The voice comment makes the recording of local parameters for the fault easy. At therecording moment a text file in the display, which has been prepared previously, and apart of the used report template will help the operator remember all the data to becollected. (Voice comment.txt).
The identification and the comments that will be part of the report of the fault arerecorded in the voice comment or in another way. The big advantage with the voicecomment is the way that it is used in the AGEMA software. The voice comment is apart of the image file. Thereby they are like glued together and you cannot mix them upwith other voice comments.
2.4 Classification and reporting Reporting has traditionally been the most time consuming part of the IR survey. A one-day inspection could result in one or two days of work to report and classify the founddefects. This is still the case for many thermographers, who have chosen not to use the
advantages that computers and modern reporting software have brought to IRcondition monitoring.
Reporting with the use of the facilities and tools like appropriated templates, reportcomment, voice comment, mentioned before as part of the AGEMA software, savesmuch time and increases the reliability of the report.
Even the classification of the identified defects is strongly simplified, as it is possible touse the temperature information recorded in the image file to perform calculationsautomatically. It is, for example, easy to calculate the temperature of the component for other conditions of electrical load or ambient temperature using the parameters, whichhave been collected during the inspection.
SP01
SP02

7/27/2019 Microsoft Word - Section 9
http://slidepdf.com/reader/full/microsoft-word-section-9 6/34
Level I Course Manual – Section 9Publ No 1 560 009 C
6
The classification of the defects gets a more complete meaning taking into account notonly the situation at the time of the inspection, which is certainly of great importance.Furthermore, you also have the possibility to normalise the temperature rise tostandard load and ambient temperature conditions.
A temperature rise of 30°C is certainly a significant fault. But if that temperature rise is
valid for a component working at 100% load and for another at 50% load, it is obviousthat the latest will reach a much higher temperature should its load increase from 50%to 100%! Such a standard can be chosen by the circumstances of the plant. Very often,however, the temperatures are predicted at 100 % load. A standard makes it easier tocompare the faults over time and thus to make a more complete classification.
A typical classification divides the defects into three groups: green, yellow and red. Themeaning is obviously that the red has a high gravity and the green a lower gravity. Very
often the recommendation in this case is Do not repair (yet) but Keep under control.The final decision on the repair priority has to take other factors into considerationbesides the temperature data and should therefore be given by someone with abroader type of view like the maintenance manager.
Figure 8. The output from the diagnosis is easy to understand. Red - danger, green - OK .
2.5 PriorityBased on the classification of the defects the responsible for the maintenance gives thedefects a repair priority. Very often the information gathered during the Infrared surveyis put together with complementary information on the equipment collected by other means like vibration monitoring, ultrasound or the preventive maintenance scheduled.
Even if the IR inspection is quickly becoming the most used type of gatheringinformation about electrical components in a safe way with the equipment in use, thereare many other sources of information the maintenance or the production manger hasto consider.

7/27/2019 Microsoft Word - Section 9
http://slidepdf.com/reader/full/microsoft-word-section-9 7/34
Level I Course Manual – Section 9Publ No 1 560 009 C
7
The priority of repair should therefore not be a task for the IR camera operator in thenormal case. If a critical situation is detected during the inspection or during theclassification of the defects, the attention of the maintenance manager should of coursebe drawn to it, but the responsibility for determining the urgency of the repair should behis.
2.6 Repair To repair the known defects is the most important function within preventivemaintenance. However, to assure the production at the right time or at the right costcan also be important goals for a maintenance group. The information provided by theInfrared survey can be used to improve the repair efficiency as well as to reach theother goals with a calculated risk.
To monitor the temperature of a known defect that can not be repaired immediately as
it should because the spare parts are not available can often pay a thousand times thecost of the inspection and sometimes the cost of the IR camera! To decide not to repair known defects to save the maintenance costs and avoid unnecessary downtime is alsoanother way of using the information from the IR survey in a productive way.
However, the most common result of the identification and classification of the detectedfaults is a recommendation to repair immediately or as soon as it is practically possible.It is important that the repair crew is aware of the physical principles for theidentification of defects. If a defect shows a high temperature and is in a criticalsituation, it is very common that the repair personnel expect a highly corrodedcomponent. It should not either be a surprise to the repair crew that a connection,which is usually healthy, can give the same high temperatures as a corroded one if it
has come loose. These misinterpretations are quite common and risk putting in doubtsthe reliability of the infrared survey.
2.7 Control A repaired component should be controlled as soon as possible after the repair. It isnot efficient to wait for the next scheduled IR survey in order to combine a newinspection with the control of the repaired defects. The statistics over the effect of therepair show that up to a third of the repaired defects still show an increasedtemperature. That is the same as to say that those defects represent a potential risk of failure.
To wait until the next scheduled IR survey represents an unnecessary risk for the plant
that can be avoided using an IR pyrometer. Once the position of the defect is knownthe use of an imaging system to correctly and safely measure the temperature of therepaired component is not strictly necessary. See figure 9.
Figure 9. Control after repair with a spot pyrometer

7/27/2019 Microsoft Word - Section 9
http://slidepdf.com/reader/full/microsoft-word-section-9 8/34
Level I Course Manual – Section 9Publ No 1 560 009 C
8
Besides increasing the efficiency of the maintenance cycle, measured in terms of lower risk for the plant, the immediate control of the repair work brings other advantages tothe performance of the repair crew itself.
When a defect still shows a temperature rise after the repair, the determination of thecause of temperature rise improves the repair procedure, helps choose the bestcomponent suppliers and detect design shortcomings on the electrical installation. Thecrew rapidly sees the effect of the work and can learn quickly both from successfulrepairs and from mistakes.
Another reason to provide the repair crew with an IR instrument is that many of thedefects detected during the IR survey are of a low gravity. Instead of repairing them,which consumes maintenance and production time, it can be decided to keep thesedefects under control. Therefore the maintenance personnel should have access to
their own IR equipment.
It is usual to note on the report form the type of fault observed during the repair as wellas the action taken. These observations make an important source of experience thatcan be used to reduce spare stock, choose the best suppliers or to teach newmaintenance personnel.
2.8 Data baseThe information gathered during the maintenance cycle is often saved in a database tohelp future infrared surveys, to increase the control of the equipment and to reduce thecosts of maintenance.
During the inspection some equipment and components could not be inspectedbecause they were either not in use or the load was too low to allow a correct IRinspection. Also some of the defects detected showed low temperature rise and it wasdecided not to perform any repair work on them but rather keep them under observation.
In other cases even though the classification showed that the defects should berepaired, the responsible maintenance manager decided that because of the lack of spare parts or for any other valid reason, the repair should be postponed.
In all the above cases there is a good reason to keep the identification of thecomponents available for use in future IR surveys.
Statistics of repair efficiency, type of repair performed, type of components used, andchanges of repair procedure, all this information is usually kept in a data base or experience data bank with the ultimate goal of increasing plant safety and decrease thecost of Infrared condition monitoring and maintenance.

7/27/2019 Microsoft Word - Section 9
http://slidepdf.com/reader/full/microsoft-word-section-9 9/34
Level I Course Manual – Section 9Publ No 1 560 009 C
9
3. Measurement technique for thermographic inspection of electrical installations
3.1 Systematic approach
A logical way to carry out a thermographic inspection on a sub-station is to follow thecurrent path in a systematic way. Thus you can be sure that no connections or apparatus will be overlooked.
Outdoor substations usually consist of several circuits. When conducting athermographic survey, it is recommended to take one circuit after the other, i.e. startingwith the incoming line, continuing with isolators, transformers, circuit breakers andcurrent transformers to the cable sealing end.
This systematic approach has two main advantages:
1. The risk of mixing up or overlooking components is eliminated.
2. The load can vary amongst the different ‘circuits’. This results in differentoperating temperatures, which may cause problems later on when analysingthe thermograms.
3.2 How to correctly set the equipment
A thermal image taken in a substation may show high temperature variations.
Figure 10. The temperature Figure 11. Here the middle Figure 12. Here the coldest scale is so selected that it fuse is enhanced. fuse is enhanced.enhances the right fuse.
Modern thermographic equipment can handle very large temperature differences withinthe image without losing any information neither at the top nor at the bottom of thetemperature scale. In the images above the fuse to the right has a maximumtemperature of 61ºC, whereas the one to the left is maximum 32ºC and the one in themiddle somewhere in between. The three images are different inasmuch as thetemperature scale enhances only one fuse in each image. However, it is the sameimage and the full information about all three fuses is there. It is only a matter of setting
40
60
30
35
40
25
30

7/27/2019 Microsoft Word - Section 9
http://slidepdf.com/reader/full/microsoft-word-section-9 10/34
Level I Course Manual – Section 9Publ No 1 560 009 C
10
of the temperature scale. The grey colour in the images shows areas, which are hotter than the selected maximum temperature of the image.
Today’s modern cameras like AGEMA 570 do in their normal operating modes cover alltemperatures from at least –20ºC up to close to 200ºC, which is certainly sufficient for the large majority of inspection situations.
3.3 Temperature measurement
The cameras today can automatically find the highest temperature in the image. For the operator it looks like in the image below. See the image below.
Figure 13. The measurement functions show exactly where to find the hottest spot.
The maximum temperature in the area is 62.2ºC. The spotmeter shows the exactlocation of the hot spot. The image can easily be stored to the memory of the camera.
A voice comment can be added. The reporting will follow, giving the above result.
33.6°C
77.4°C
40
50
60
70SP01
SP02
Figure 14. The camera cannot see the hot spot directly as it is hidden under a cover.
The correct temperature measurement depends, however, not only on the function of the evaluation software or the camera. It may happen that the actual fault is e.g. aconnection, which is hidden from the camera, N.B. in the position it happens to be for the moment. It might be so that you measure heat, which has been conducted over some distance, whereas the ‘real’ hot spot is hidden from you. An example is shown infigure 14.
Try to choose different angles and make sure that the hot area is seen in its full size,i.e. that it is not disappearing behind something, that might hide the hottest spot. In thispicture the hottest spot, N.B. of what the camera can ‘see’, is 83ºC, where the
40
60

7/27/2019 Microsoft Word - Section 9
http://slidepdf.com/reader/full/microsoft-word-section-9 11/34
Level I Course Manual – Section 9Publ No 1 560 009 C
11
operating temperature on the cables under the box is 60ºC. However, the real hot spotis most probably hidden under the box, see the in yellow encircled area. This fault isreported as a 23ºC temperature rise, but the real hot spot is probably essentially hotter.
Another reason for underestimating the temperature on an object is bad focusing. It isvery important that the found hot spot be in focus. See the example below!
Figure 15. The images show a difference of 13ºC because of focusing differences.
In the left image the lamp is in focus. Its temperature is 64ºC as an average. In the rightimage the lamp is out of focus, which will result in only 51ºC as the maximumtemperature.
3.4 Comparative measurement
For thermographic inspections of electrical installations a special method is used,
which is based on comparison of different objects, so-called measurement with areference. This simply means that you compare the three phases with each other. Thismethod needs systematic scanning of the three phases in parallel in order to assesswhether a point differs from the normal temperature pattern.
Figure 16. Fuses showing very small temperature diffrences
The image to the left here shows three fuses, the temperatures of which are very closeto each other. The inserted isotherm actually shows less than 2ºC temperaturedifference between the phases.
20
40
60
20
40
60
7/27/2019 Microsoft Word - Section 9
http://slidepdf.com/reader/full/microsoft-word-section-9 12/34
Level I Course Manual – Section 9Publ No 1 560 009 C
12
Different colours are usually the result if the phases are carrying unsymmetrical load.This difference in colours does not represent any temperature rise since this does notoccur locally but is spread along the whole phase.
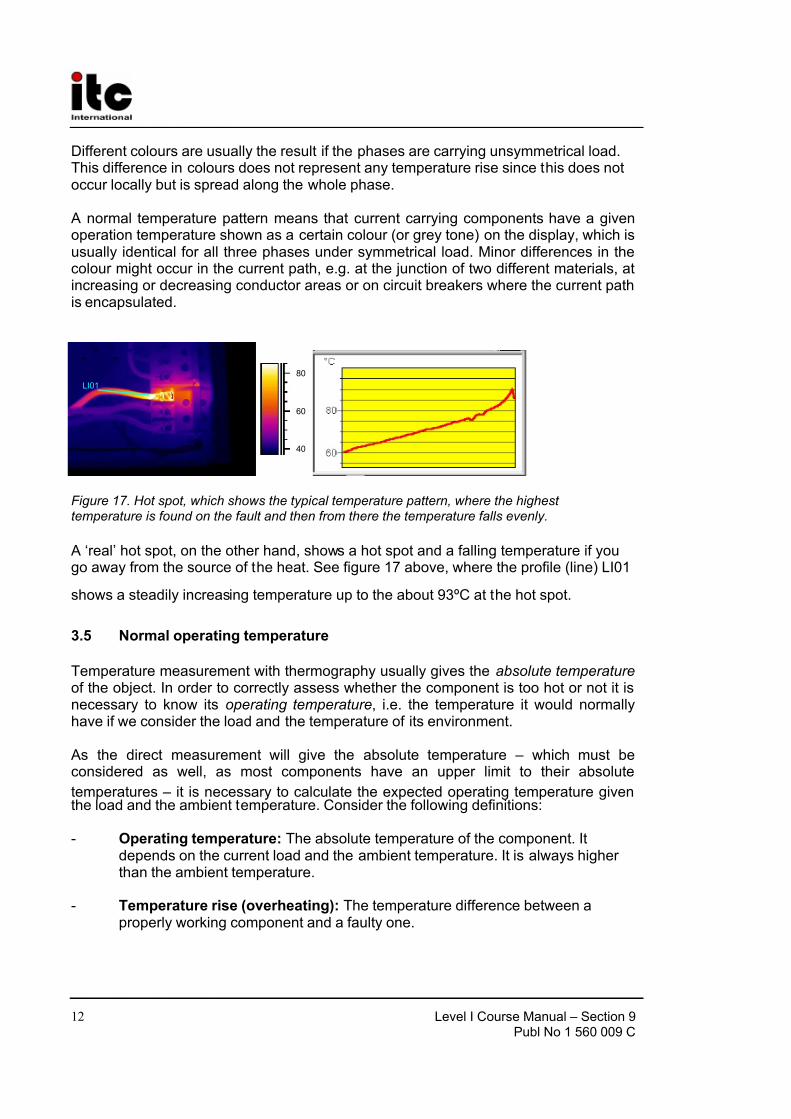
A normal temperature pattern means that current carrying components have a givenoperation temperature shown as a certain colour (or grey tone) on the display, which isusually identical for all three phases under symmetrical load. Minor differences in thecolour might occur in the current path, e.g. at the junction of two different materials, atincreasing or decreasing conductor areas or on circuit breakers where the current pathis encapsulated.
Figure 17. Hot spot, which shows the typical temperature pattern, where the highest temperature is found on the fault and then from there the temperature falls evenly.
A ‘real’ hot spot, on the other hand, shows a hot spot and a falling temperature if yougo away from the source of the heat. See figure 17 above, where the profile (line) LI01
shows a steadily increasing temperature up to the about 93ºC at the hot spot.
3.5 Normal operating temperature
Temperature measurement with thermography usually gives the absolute temperature of the object. In order to correctly assess whether the component is too hot or not it isnecessary to know its operating temperature, i.e. the temperature it would normallyhave if we consider the load and the temperature of its environment.
As the direct measurement will give the absolute temperature – which must beconsidered as well, as most components have an upper limit to their absolute
temperatures – it is necessary to calculate the expected operating temperature giventhe load and the ambient temperature. Consider the following definitions:
- Operating temperature: The absolute temperature of the component. Itdepends on the current load and the ambient temperature. It is always higher than the ambient temperature.
- Temperature rise (overheating): The temperature difference between aproperly working component and a faulty one.
40
60
80
LI01

7/27/2019 Microsoft Word - Section 9
http://slidepdf.com/reader/full/microsoft-word-section-9 13/34
Level I Course Manual – Section 9Publ No 1 560 009 C
13
The temperature rise is found as the difference between the temperature of a ‘normal’component and the temperature of its neighbour. It is important to compare the samepoints on the different phases with each other.
47.1°C
81.7°C
50
60
70
80
SP01
SP02
Figure 18. Thermogram of three phases, two with normal temperatures and the third is clearly overheated
The two left phases are considered as normal, whereas the right phase shows a veryclear temperature rise. Actually, the operating temperature of the left phase is 68ºC, i.e.quite a substantial temperature, whereas the faulty phase to the right shows atemperature of 86ºC. This means an temperature rise of 18ºC, i.e. a fault that has to beattended to within short.
For practical reasons the (normal, expected) operating temperature of a component istaken as the temperature of the components in at least two out of three phases,provided that you consider them working normally. The most normal case is of coursethat all three phases have the same or at least almost the same temperature. Theoperating temperature of outdoor components in substations or power lines is usuallyonly 1 or 2ºC above the air temperature. In indoor substations the operatingtemperatures vary a lot more.
46.2°C
122.1°C
60
80
100
120
SP01
SP02
Figure 19. Another hot spot
This fact is clearly shown in figure 19 as well. Here the left phase is the one, whichshows a temperature rise. The operating temperature, taken from the two ‘cold’ phasesis 66ºC. The faulty phase shows a temperature of 127ºC, which has to be attended towithout delay.

7/27/2019 Microsoft Word - Section 9
http://slidepdf.com/reader/full/microsoft-word-section-9 14/34
Level I Course Manual – Section 9Publ No 1 560 009 C
14
Figures 18 and 19 are both taken from indoor equipment.
3.6 Classification of faults
Once a faulty connection is detected, corrective measures may be necessary – or maynot be necessary for the time being. In order to recommend the most appropriateaction the following criteria should be evaluated:
- Load during the measurement- Even or varying load- Position of the faulty part in the electrical installation- Expected future load situation- Is the temperature rise measured directly on the faulty spot or indirectly through
conducted heat caused by some fault inside the apparatus?
Temperature rises measured directly on the faulty part are usually divided into threecategories relating to 100% of the maximum load.
I < 5ºC Beginning temperature rise. It ought to be kept under control.
II 5 -30ºC Developed temperature rise. It should be attended to at the firstpossibility, with due consideration to the load situation though.
III >30ºC Acute temperature rise. Ought to be repaired at once, however, withdue consideration to the load situation.
3.7 Recalculation of the temperature at an arbitrary load to the temperature at50% (or 100%) load
It seems expedient to apply the Joule’s law directly to the load and therefore find adirect connection between the expected temperature rises at different loads.Unfortunately this is not true. Tests have shown that the temperature grows moreslowly with load than predicted by Joule’s law. The most important reason for that arethe heat conductive properties of the component. The better the conduction, the lower is the power in the formula. Empirical tests have given the following figures:
Good heat conductivity: n = 1.6
Medium heat conductivity: n = 1.8
Bad heat conductivity: n = 2
The ‘n’ is the value of the exponent in the following formula:
∆tphase at 100% = ∆tphase x (I100%/ Iactual)n ºC

7/27/2019 Microsoft Word - Section 9
http://slidepdf.com/reader/full/microsoft-word-section-9 15/34
Level I Course Manual – Section 9Publ No 1 560 009 C
15
Suppose we have a temperature rise of 20ºC at 40% load. If the heat conduction in thecomponent varies according to the list below, we can expect the following temperaturerises at full load.
High conductivity: 20 x 4.33 = 87ºC
Medium conductivity: 20 x 5.2 = 104ºC
Low conductivity: 20 x 6.25 = 125ºC.
As we see we would in any case run into very high temperature rises at 100% load.Obviously the example would characterise quite a serious fault! For simplifiednormalisation of the values, see Attachment 1, Nomogram for normalisation of up to100% load.
A corresponding recalculation to 50% load would give temperature rises of the order of 28, 30 and 31ºC, i.e. serious faults also according to that criterion, which must beattended to at the first possibility.
4. Reporting
Thermographic inspections of electrical installations are nowadays probably withoutexception documented and reported by the use of a report program. These programs,which differ from one manufacturer to another, are usually directly adapted to the
cameras and will thus make reporting very quick and easy.
As the AGEMA 500 cameras have the voice recording facility, there is hardly any needto have any written protocol from the inspection. Instead the images are stored to harddisk together with a voice comment. Sometimes a photo is taken to show in a ‘normal’way what the faulty place looks like. See a page from a report example in figure 20.

7/27/2019 Microsoft Word - Section 9
http://slidepdf.com/reader/full/microsoft-word-section-9 16/34
Level I Course Manual – Section 9Publ No 1 560 009 C
16
Figure 20. An example of a report page
The program, which has been used for creating the report page shown below, is calledIRwin Report. It is adapted to several types of infrared cameras, among them andforemost, the AGEMA 500 series.
This is a so-called item page in the report, i.e. a page which shows a found fault andwhich usually also gives a recommendation about the classification of the fault.

7/27/2019 Microsoft Word - Section 9
http://slidepdf.com/reader/full/microsoft-word-section-9 17/34
Level I Course Manual – Section 9Publ No 1 560 009 C
17
5. Different types of hot spots in electrical installations
5.1 Reflections
The thermographic camera is, depending on the type and wavelength range of thecamera, in all essentials sensitive to infrared radiation in the 3.6 – 5.0 µm range, calledshort-wave, SW, or in the 8-14 µm range, called long-wave, LW. This has a certainimpact on the measurement technique mainly at outdoor measurement. The reason for that is that the sun radiates not only in the visible spectrum, 0.4 – 0.7 µm, but also inthe infrared spectrum up to about 4 µm. As the camera is sensitive to solar reflections –sometimes also called sun glint – the camera operator has to consider this effect. If notit could lead to solar reflections being reported as overheated components.
The figures below show an object taken with SW (left) and LW (right) cameras. The
thermograms have been taken on a sunny day. The SW image shows ‘hot spots’,which are nothing but solar reflections. In the LW image such reflections are nowhereto be seen.
Figure 21. Shortwave thermogram Figure 22. Longwave thermogram
This difference between SW and LW does not mean that the use of SW equipment inoutdoor applications is excluded just because of sun glint. Actually the majority of cameras used for this purpose around the world are SW. However, it is partly a matter of available technology from the manufacturers. Other factors like portability, ease of use and modern user interface are today probably more important. As long as the
operator knows what he is doing – which is important both for SW and for LWequipment – the small differences in handling can easily be mastered.
28.6°C
48.6°C
30
35
40
45
6.6°C
48.1°C
10
20
30
40

7/27/2019 Microsoft Word - Section 9
http://slidepdf.com/reader/full/microsoft-word-section-9 18/34
Level I Course Manual – Section 9Publ No 1 560 009 C
18
5.2 Solar heating
The surface of a component with a high emissivity, e.g. a breaker, can on a hot
summer day be heated up to quite considerable temperatures by the sun irradiation.The picture shows a circuit breaker, which has been heated up by the sun. The pictureis taken with a long-wave camera. Therefore there are no solar reflections.
Figure 23. Example of solar heating of an isolator and of other components, which do not carry any load.
5.3 Inductive heating
Figure 24. Inductively heated balance weights
Eddy currents can cause a warm spot in the current path. In case of very high currentsand close proximity of other metals, this has in some cases caused serious fires. This type of heating occurs in magnetic material around the current path, such as Metallicbottom plates for bushing insulators. In the picture above there are stabilising weights,through which a high current is running. These metal weights, which are made of aslightly magnetic material, will conduct no current but are exposed to the alternatingmagnetic fields, which eventually will heat up the weight. The temperature rise in thepicture is less than 5ºC. This, however, need not necessarily always be the case.
5
10
0
10

7/27/2019 Microsoft Word - Section 9
http://slidepdf.com/reader/full/microsoft-word-section-9 19/34
Level I Course Manual – Section 9Publ No 1 560 009 C
19
5.4 Load variations
The normal in electric utilities is 3-phase systems. When looking for overheated places,
it is easy to compare the three phases directly with each other, e.g. cables, breakers,insulators. An even load per phase should result in a uniform temperature pattern for allthree phases. A fault may be suspected in case the temperature of one phase differsconsiderably from that of the two remaining ones. However, you should always makesure that the load is indeed evenly distributed. A look at fixed ammeters or the use of aclip-on ammeter (up to 600 A) will tell.
Figure 25. Unsymmetric load Figure 26. The cables in the middle are heated upby the hot neighbour cables.
Figure 25 shows three cables beside each other. They are so far apart that they can beregarded as thermally insulated from each other. The one in the middle is colder thanthe other ones. Unless two phases are faulty and overheated this is a typical exampleof very unsymmetrical load. The temperature spreads very evenly along the cables,
which indicates a load-dependent temperature increase rather than a faulty connection.
Figur 26 shows two bundles of cables with very different load. Actually the bundle tothe right carries next to no load. The ones, which carry a considerable current load, areabout 5ºC hotter than the ones, which do not. No fault to be reported in theseexamples.
5.5 Varying cooling conditions
Figure 27. The cables in the middle are hotter than their neighbours because of worse cooling conditions.
40
28
30
32
35

7/27/2019 Microsoft Word - Section 9
http://slidepdf.com/reader/full/microsoft-word-section-9 20/34
Level I Course Manual – Section 9Publ No 1 560 009 C
20
When for example a number of cables are bundled together it can happen that theresulting bad cooling of the cables in the middle can lead to very high temperatures onthem. The cables to the right in the picture do not show any temperature rise close to
the bolts. In the vertical part of the bundle, however, the cables are held together verytightly, the cooling of the cables is bad,
the convection cannot take the heat away, and the cables are notably hotter, actuallyabout 5ºC above the temperature of the better cooled part of the cables.
5.6 Resistance variations
A temperature rise can have many origins. Some usual reasons are described below.
Low contact pressure can occur when mounting a joint, or through wear of the material,e.g. decreasing spring tension, worn threads in nuts and bolts, even too high applied
force at mounting. With increasing load and temperature, the yield point of the materialis exceeded and the tension weakens.
The picture to the left below shows a bad contact due to a loose bolt. Since the badcontact is of very limited dimensions, it causes temperature rise only in a very smallspot from which the heat is spread evenly along the connecting cable. Note the lower emissivity of the screw itself, which makes it look a bit colder than the insulated part of the cable and thereby it has a higher emissivity.
Figure 28. Loose bolt causing a Figure 29. Another loose bolt, probably substantial temperature rise cooled by wind, therefore it shows a
lower temperature rise
5.7 Temperature rise in one part as a result of a fault in another partSometimes a temperature rise can appear in a component although that component isOK. The reason is for example that two conductors share the load. One of theconductors has an increased resistance, but the other is OK. Thus the faultycomponent carries a lower load, whereas the fresh one has to take a higher, maybe toohigh, load, which causes the increased temperature. See the picture.
40
60
80
20
25
30

7/27/2019 Microsoft Word - Section 9
http://slidepdf.com/reader/full/microsoft-word-section-9 21/34
Level I Course Manual – Section 9Publ No 1 560 009 C
21
Figure 30. Here the ‘wrong’ part is hot. Figure 31. A photo of the circuit breaker,which shows a temperature rise in fig 30.
The temperature rise of this circuit breaker is most probably caused by bad contact inthe upper finger of the contactor. Thus the lower finger carries more current and gets
hotter. It is not the same, however similar, component in the thermogram and thephoto.
6. Disturbing factors at thermographic inspection of electrical installations
During thermographic inspections of different types of electrical installations, disturbingfactors such as wind, distance-to-object, rain or snow is often influencing upon themeasurement result.
6.1 Wind
During outdoor inspection the cooling effect of wind should be taken into account. Atemperature rise measured at a wind velocity of 5 m/s (10 knots) will be approximatelytwice as high at 1 m/s. A temperature rise measured at 8 m/s will be 2.5 times as highat 1 m/s. This correction factor, which is based on empirical measurements, is usuallyapplicable up to 8 m/s (16 knots).
There are, however, cases when you have to inspect even if the wind is stronger than 8m/s. There are many windy places in the world, islands, mountains etc. But it isimportant to know that found overheated components would have shown aconsiderably higher temperature at a lower wind speed. The empirical correction factor can be listed.
5
10
15

7/27/2019 Microsoft Word - Section 9
http://slidepdf.com/reader/full/microsoft-word-section-9 22/34
Level I Course Manual – Section 9Publ No 1 560 009 C
22
Wind speed (m/s) Correction factor
1 1
2 1.363 1.644 1.865 2.066 2.237 2.408 2.54
The measured temperature rise multiplied by the correction factor gives thetemperature rise at no wind, i.e. at 1 m/s.
6.2 Rain and snow
Rain and snow also have a cooling effect on electrical equipment. Thermographicmeasurement can still be conducted with satisfactory results during light snowfall withdry snow and light drizzle respectively. The image quality will deteriorate by heavysnow or rain and reliable measurement is no longer possible. This is mainly because atight snowfall as well as heavy rain is impenetrable to infrared radiation and it is rather the temperature of the snowflakes or the big raindrops that will be measured.
6.3 Distance to object
This picture is taken from a helicopter 20 m away from this faulty connection. Thedistancewas incorrectly set to 1 m and the temperature was measured to 37.9ºC. Themeasurement value after changing the distance to 20 m, which was done afterwards, isshown in the image to the right. The corrected temperature is there 38.8ºC. Thedifference is not too crucial, but may take the fault into a higher class of seriousness.So the distance setting must not be neglected.
Figure 32. Temperature difference because of wrong distance setting in the left image
20
25
30
20
25
30

7/27/2019 Microsoft Word - Section 9
http://slidepdf.com/reader/full/microsoft-word-section-9 23/34
Level I Course Manual – Section 9Publ No 1 560 009 C
23
Figure 33. The temperature readings from a blackbody at 85ºC at increasing distances
The measured average temperatures are from left to right 85.3, 85.3, 84.8, 84.8, 84.8and 84.3 from a blackbody at 85ºC. The thermograms are taken with a 12º lens. Thedistances are 1, 2, 3, 4, 5 and 10 m. The correction for the distance has been
meticulously set and works, because the object is big enough for correct measurement.Figure 33. The temperature readings from a blackbody at 85 deg C at increasing distances
6.4 Object size
The second series of pictures below shows the same but with the normal 24º lens.Here the measured average temperatures of the blackbody at 85ºC are: 84.2, 83.7,83.3, 83.3, 83.4 and 78.4ºC.
Figure 34. Same series as in figure 33 but with a 24º lens
84
85
86
84.0°C
.
84
85
86
AR01: 85.3°C
84.0°C
86.0°C
84
85
86
84.0°C84
85
86
AR01: 85.3°C
84
85
86
AR01: 84.8°C
80
82
84
86
80
82
84
86
78
80
82
84
86
78
80
82
84
86
78
80
82
84
86
78
80
82
84
86
64
66
68
70

7/27/2019 Microsoft Word - Section 9
http://slidepdf.com/reader/full/microsoft-word-section-9 24/34
Level I Course Manual – Section 9Publ No 1 560 009 C
24
The last value, 78.4ºC, is the maximum temperature as it was not possible to place acircle inside the now very small blackbody image. Obviously it is not possible tomeasure correct values if the object is too small. Please note that the distance wasproperly set to 10 m.
The reason for this effect is that there is a smallest object size, which gives correcttemperature measurement. This smallest size is easy to find in the AGEMA 500cameras. The picture below shows what you see in the viewfinder. The spotmeter hasan opening in its middle, more easily seen in the detail to the right. The size of theobject has to be bigger than that opening, else some radiation from its closestneighbours, which are much colder, will come into the measurement as well, stronglylowering the reading. In the above case, where we have a point-shaped object, whichis much hotter than the surroundings, the temperature reading will be too low.
Figure 35. An object has to fill the ‘hole’ in the cross-hair in order to be measured correctly
This effect is due to imperfections in the optics and to the size of the detector. It istypical for all infrared cameras and cannot be avoided completely.

7/27/2019 Microsoft Word - Section 9
http://slidepdf.com/reader/full/microsoft-word-section-9 25/34
Level I Course Manual – Section 9Publ No 1 560 009 C
25
7. Routing
7.1 DefinitionThe word Routing comes from the word route meaning “road, way”. The word routinehas the same root and routine inspection is also what routing is about. You start bydefining the equipment that you want to control and a way for the inspection from thefirst to the last point. You proceed methodically measuring and saving themeasurements on some kind of memory or logger going from point to point until youhave measured all the points that you need to control.
After some period it is time to check the same points and then again and again, aroutine measurement that you perform periodically on your equipment because youwant to be in control. You want to prevent failures from happening, and you want to getsome warning time. Last but not least you would like to be able to predict the
temperature evolution on the components – this is called trending - and to foresee whatmight happen.
‘Routine’ can be defined as an inspection that will be repeated regularly in order to lookfor trends.
7.2 Routing Procedure
A routing inspection does not start in the field like a common inspection. It starts in theoffice planning by preparing the routing list and the template to be used during theinspection. It is necessary to positively and unequivocally identify the components. Thedescription with a photo will guide the IR thermographer from one component to thenext in the best and quickest possible way. Many companies have digital descriptionsof all their equipment down to component level. That type of description can be used tocompile the routing list.
The inspection should be of one type for easy use of the template associated with thelist. Prepare the file directory with the report comment and the voice comment text thatbelong to the chosen template. If you are going to do a substation inspection choose atemplate, in which the temperature rise will be recalculated to 50% (or 100%) load andwhich also carries out wind speed correction.
Once in the field you recall from the PC card your list and start the inspection. The list
will guide you from one inspection point to the next. Once you have recorded onetemperature the software will suggest you the next place to inspect.
However, several things can happen that will disturb the routine that you are following:
• The item is OK, so there is no need to record the temperature
• Skip the item. In the case of an electrical inspection, it can mean that it is beingrepaired, that it carries a too low load or that it is just not functioning.
• The item that you want to inspect is not the next in the list. Go to routing list andchoose from there the correct item to inspect.
• You want to repeat the inspection of the item. Return to the item using the list,make the new inspection and overwrite the old one.

7/27/2019 Microsoft Word - Section 9
http://slidepdf.com/reader/full/microsoft-word-section-9 26/34
Level I Course Manual – Section 9Publ No 1 560 009 C
26
You will need to use the voice comment only when you identify a defect or a situationthat you find abnormal and therefore want to save the thermogram. However, if you arenot performing the inspection for the first time, the voice comment is not necessarily
making reporting easier. When returning to your office, the reporting software will helpyou select the thermograms from the PC card and almost automatically produce thereport.
7.3 New defects
In same cases in an electrical inspection the list does not describe all the connectionsof a panel. It is therefore possible that you will find a hot spot on a component that isnot reliably defined in the routing list.
Figure 36. Inspection of electrical components with an AGEMA 570
A similar case can happen when performing an electrical inspection and you just couldnot avoid seeing a faulty situation on one of the furnaces. In a situation like this, justchange your directory in the camera and make a standard fault report using theadequate template.
If needed you can, once you are back in the office, change the routing list and integratethe new item into it.
7/27/2019 Microsoft Word - Section 9
http://slidepdf.com/reader/full/microsoft-word-section-9 27/34
Level I Course Manual – Section 9Publ No 1 560 009 C
27
8. TrendingIn principle you can use routine inspection on all types of equipment. However, there is
equipment for which this type of inspection is more appropriate and the trendingpossibilities will give the best results.
8.1 Furnaces and ovensThe walls of furnaces and ovens tend to deteriorate with time. In similar cases in themetal industry, the walls are worn out quite quickly in a few months. To follow theevolution of the walls in this case can give several advantages
• Increased security as temperature alarm levels can be set
• Better utilisation of the insulation /refractory material because of the better controland in many cases longer use (under secure conditions)
• Less downtime because it is possible to foresee when and how much material isgoing to be needed for the repair
8.2 Vessels (ladles and other containers)
Even here the security aspect is stronger because these types of vessels are oftentransported from one point of the plant to another, over the heads of people and over other equipment. Accidents happen not only depending on the normal wear but also onthe metal infiltration between bricks. In the cold part of the cycle the metal solidifies andtears the bricks apart.
8.3 Electrical motors
Electrical motors are extremely common in the industry and vital to many processes.To have their temperature under control in several places will help increase motor lifetime, decrease energy losses (by increased efficiency), and prevent unscheduledstops. As they are rotating machines the balance of the motors is important for thelifetime and for the motor efficiency.
• The electrical connections should be checked. Vibrations will shake them loose.
• The temperature of the motor body will tell the condition of the insulation and theheat losses because of unbalance.
• The axis temperature will tell about the mechanical conditions of balance,lubrication and bearings.
Electrical motors are very common in all industries.
8.4 Rotating equipment
All rotating equipment like pumps, fans, motors (including electrical motors), etc., issubject to temperature rise because of friction. Bad bearings, bad conditions on thelubrication oil, uneven load, axial unbalance, will create an increase in temperature thatwill eventually lead to mechanical failure.
Today in the industry, vibration control is often synonymous with condition monitoring.Monitoring the thermal condition of the same equipment is not very common, albeit thefact that IR inspection is ten times quicker than vibration inspection. Companiesworking with both technologies use to first check the thermal condition to quickly
7/27/2019 Microsoft Word - Section 9
http://slidepdf.com/reader/full/microsoft-word-section-9 28/34
Level I Course Manual – Section 9Publ No 1 560 009 C
28
identify the problem items. Then they use vibration and other to identify the type of problem.
A rolling mill can have as much as 700 motors. To inspect one motor with IR takes acouple of minutes. In two days all the 700 motors can be inspected with IR. Vibrationwould take much longer. If one motor can be inspected in only 15 minutes it would take175 hours to inspect all motors, which is more than a month!
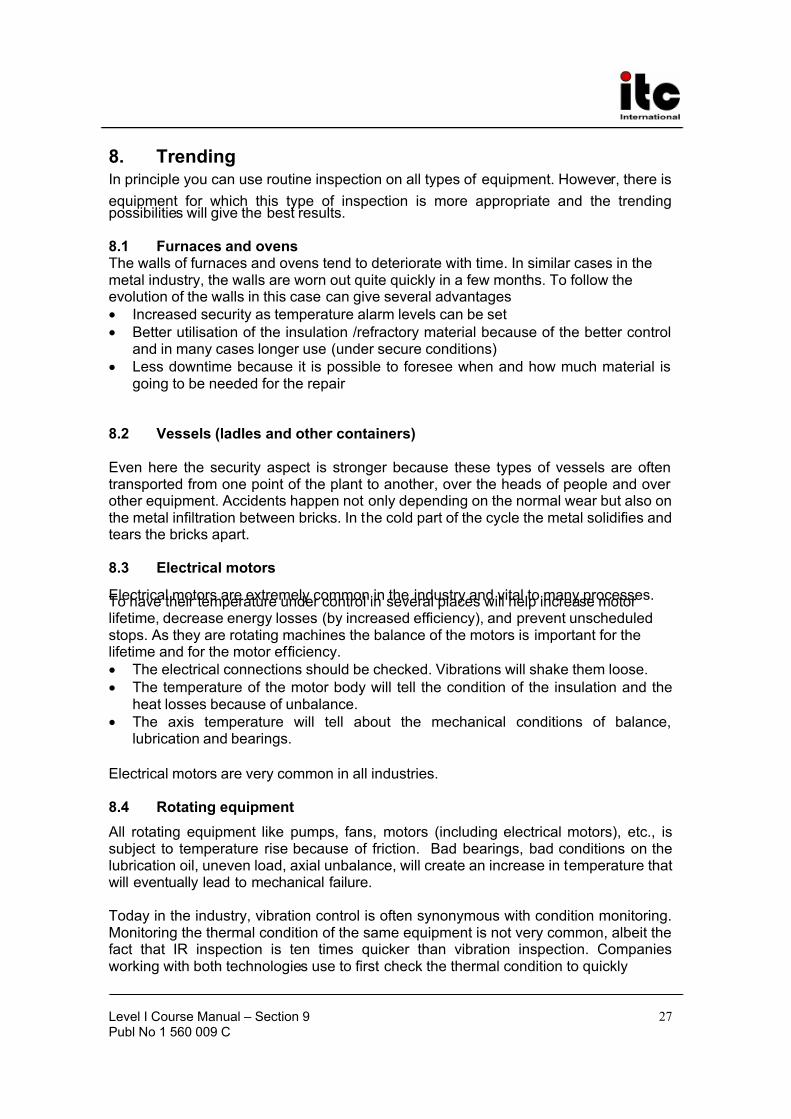
Figure 37. Electrical motor showing high temperature. Bad bearings?
As important as the load is for the electrical inspection, the rotating speed is (rpm.) for the inspection of rotating equipment. The temperature and the eventual over-temperature caused by a fault are directly proportional to the rotating speed at constantload. Also if the speed is constant but the load increases you can expect a higher working temperature and hotter defects.
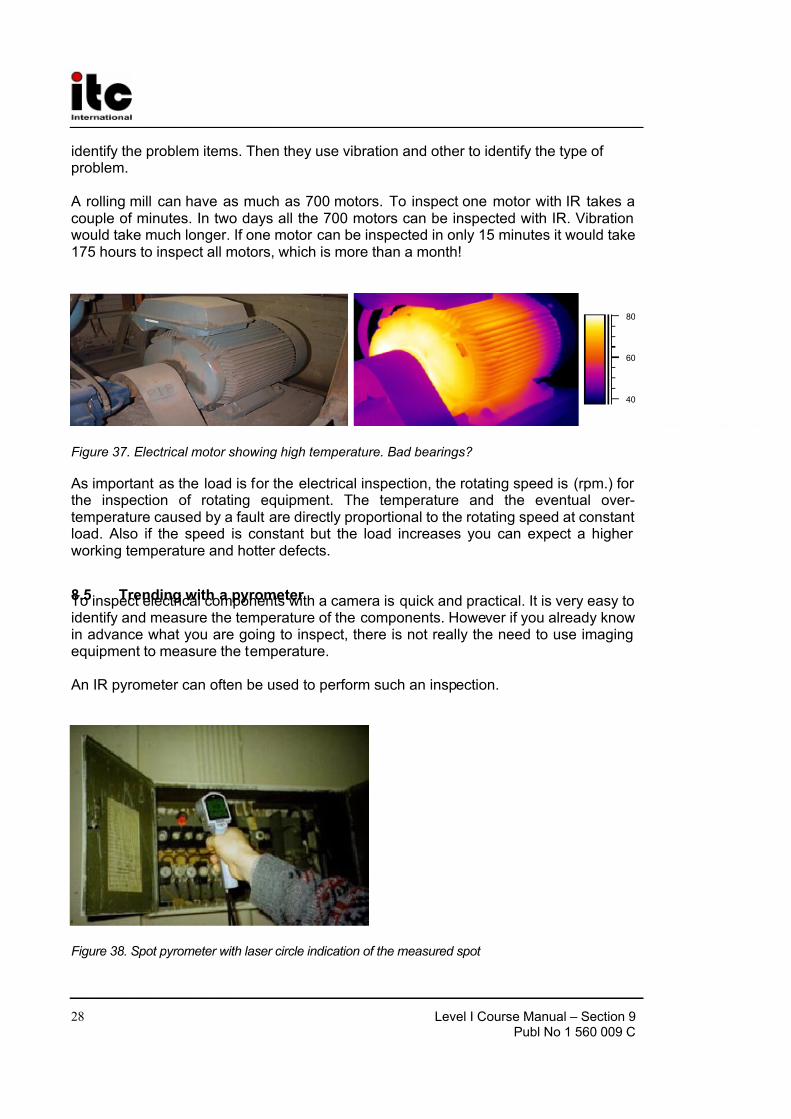
8.5 Trending with a pyrometer To inspect electrical components with a camera is quick and practical. It is very easy toidentify and measure the temperature of the components. However if you already knowin advance what you are going to inspect, there is not really the need to use imagingequipment to measure the temperature.
An IR pyrometer can often be used to perform such an inspection.
Figure 38. Spot pyrometer with laser circle indication of the measured spot
40
60
80

7/27/2019 Microsoft Word - Section 9
http://slidepdf.com/reader/full/microsoft-word-section-9 29/34
Level I Course Manual – Section 9Publ No 1 560 009 C
29
The routing list can be downloaded from a computer to the unit. The description of theitem to be inspected will appear on the display and the “next item” appearsautomatically. As with the camera, it is possible to overwrite an already inspected itemor to move in the routing list to another location. Once back in the office the routingresult list is downloaded and added to the log files of previous inspections.
Figure 39. Trending diagram of two electrical components
Trending a certain point is also easy. The software will allow the operator to see thetemperature of a chosen component during a certain time period, in a diagram.
It is possible with the help of the diagram showing the trend for the componenttemperature to foresee with reasonable accuracy when you will need to perform repair work, replace an item or order material and people to a planned shutdown. Thepossibility to see a faulty component in 1000 different components saves time and justifies the use of more sophisticated equipment like a camera.
Only a thermal camera can scan vast areas of a furnace in a short time in order topinpoint abnormally heated zones, and to make sure that every such hot area has beenidentified. However, it is easy to see from the thermogram below, if you have decidedto trend all the three phases it is not necessary to use a IR camera. The greatadvantage of the imaging cameras lie in the fact that they can show the thermal imageof the equipment, and allow to identify the faulty components quickly and accurately.
Figure 40. Cable box showing a temperature rise

7/27/2019 Microsoft Word - Section 9
http://slidepdf.com/reader/full/microsoft-word-section-9 30/34
Level I Course Manual – Section 9Publ No 1 560 009 C
30
8.6 Use of trending diagramsTrending diagrams can be used for:
• Detecting at an early stage of a fault like an unbalanced motor, bad lubrication,loose connection that is evolving over time.
• To monitor temperature alarm levels for more in-depth analysis of the condition of the equipment. That can mean vibration analysis, oil analysis, etc.
• To give alarm to corrective actions. Repair, partial repair or replacement of components.
• To prevent failures and prepare for actions that will take place in the future asindicated by the trend with the target of reducing down time.
Condition monitoring in general and vibration in particular is today widely used in theindustrial maintenance to obtain the results above mentioned. IR routing is not asknown and has therefore a big potential use.
IR inspection is, no doubt, one of the fastest growing methods for condition monitoringof equipment. IR routing has the advantage in many cases to be a quicker and moreefficient way of monitoring the condition of the equipment than traditional vibrationrouting and should with time become at least a popular maintenance tool.

7/27/2019 Microsoft Word - Section 9
http://slidepdf.com/reader/full/microsoft-word-section-9 31/34
Level I Course Manual – Section 9Publ No 1 560 009 C
31
9. Practical advice for the thermographer
Working in a practical way with a camera you will find out small things that make your jobeasier. Here are ten of them to start with.
9.1 From cold to hot
You have been out with the camera at 5 °C. To continue your work you now have to
perform the inspection indoors. As soon as you come into the house you will have toclean your glasses. Water has condensed on their surface and you see nothing. Thesame thing happens with the camera. If you don’t want to get a measurement error youshould clean the lenses carefully with an optical cleaning tissue. But you can also cover the lenses with a thin plastic film of the type, which is used at home to wrap food!Polyethylene plastic is good for LW systems. You can do the same when you are invery humid environments. To compensate for the absorption in the plastic film, changethe distance setting until you measure the same temperature as you do without theplastic.
9.2 Rain showers
If it starts raining you should not perform the inspection because the water willdrastically change the surface temperature that you are measuring. Nevertheless,sometimes you need to use the camera even under rain showers or splashes. Protectyour camera with a simple plastic bag. Protect the lenses as indicated above. Do not
forget to correct for the attenuation, which is caused by the plastic bag.
9.3 Emissivity
You have to determine the emissivity for a material, which you are measuring on andyou don’t find the value in your tables. Use optical paint, i.e. Nextel Black Velvet. Painta small piece of the material you are working with. The emissivity of the optical paint isnormally 0,96 for shortwave systems and 0.94 for longwave systems. Remember thatthe object has to have a temperature, which is different, usually higher than theambient temperature. The larger the difference the better the accuracy in the emissivitycalculation. Remember that there are other paints that support very high temperatures
up to 800°C. The emissivity may, however, be lower than that of optical black.
Sometimes you don’t or cannot paint the object that you are measuring. Use a tape. Athin tape for which you have previously determined the emissivity will work in mostcases and you can remove it afterwards without damaging the object of your study.Pay attention to the fact that some tapes are semi-transparent and thus are not verygood for this purpose. Be careful when choosing the tape. The best are the tissuebased ones, which are used for electrical or medical purposes.

7/27/2019 Microsoft Word - Section 9
http://slidepdf.com/reader/full/microsoft-word-section-9 32/34
Level I Course Manual – Section 9Publ No 1 560 009 C
32
9.4 Reflected ambient temperature
You are in a measurement situation where there are several hot sources that influence
upon your measurement. You need to have the right value for the ambient temperatureto input to the camera and thus get the best possible correction. Do it in this way: Adjust the camera lens to near focus and looking away from the object, save oneimage. With the area or the isotherm determine the most probable value of the averageof the image and use that value for your input of reflected ambient temperature.
9.5 Object too far away?
You are measuring and you are not sure that the camera you have is measuringcorrectly over the actual distance. Make a small rule of thumb for each of your lenses.Divide the FOV by the specification of 50% SRF. Twenty 20 degrees correspond toabout 350 mrad. Divide the result by two. If the FOV is 1 mrad and you are using a 20ºlens you get 175:1. This means that at 17.5 meters your target is about 0.1 meter or 100 mm wide. Try to work on the safe side by coming closer than 17.5 meters. At 10-12 meters your measurement should be correct.
9.6 Circular objects
You are measuring a cylindrical chimney. You look from the north, you take a secondlook from the south. Is that enough? No, unfortunately when it comes to measuringcircular objects from all sides you should have at least three views with 120 degreesangle each. The reason is that the emissivity of the object will change for angles larger then 60 degrees from the orthogonal.
9.7 Angle of measurement
You are measuring a roof where you know the emissivity of the roof cover material.The measurement should not present any difficulties but the results may “funny” andyou don’t understand why. The reason might be that you are viewing the roof under anangle, which is too small. The emissivity value changes, usually to a lower value. Tomeasure correctly you have to change your point of observation. A higher one, fromanother building, a stairs or… use you imagination. It is the same physicalphenomenon as in the case of circular objects explained above.
9.8 Outdoors and freezing
Sometimes it is cold e.g. -10 or -20 °C and windy. Everything is cold including the
equipment that you had in the trunk of your car together with the rest of your luggage.When you start the camera it seems to have run out of power. If you have amechanical scanning system it might not start at all. The reason is usually that thebatteries are too cold. The camera is normally specified down to these temperaturesand will normally work. The best way to avoid such problems is to always make surethat the batteries are warm. While working keep the other batteries warm by, for example, keeping them under your coat. If the batteries are inside the camera, thepower dissipated by the camera will warm it up, normally to 10-15°C above ambient

7/27/2019 Microsoft Word - Section 9
http://slidepdf.com/reader/full/microsoft-word-section-9 33/34
Level I Course Manual – Section 9Publ No 1 560 009 C
33
temperature. This should make it possible to work for a long time before the problemcomes back and the batteries, the camera and yourself get too cold from this outdoor work.
9.9 Measuring behind walls
You may have been asked many times if the camera can measure behind the wall or the panel or measure the temperature inside the furnace. Sometimes it can, providedyou get a window. A correct window does not have to be neither expensive nor difficultto install. Find out the pressure, the temperature and the mechanical characteristicsand contact your representative. He should be able to recommend you or quote youthe correct window for that application.

7/27/2019 Microsoft Word - Section 9
http://slidepdf.com/reader/full/microsoft-word-section-9 34/34
Attachment 1. Nomogram for normalisation up to 100% load
Normalization
0 1 2 3 4 5 6 7 8 9
10 11 12 13 14 15 16 17
0.5 1 1.5 2 2.5 3 3.5 4
Relation 100% load /actual
O v e r t e m
e r a t u
r e i n c r e a s e ,
t i m e s
Bad conductivity Medium cond. Good cond.