microsoft powerpoint june 27 07 final ppt - nordex · china india established markets emerging ......
TRANSCRIPT

Conference CallJune 27, 2007
Nordex AG

Page 2
Situation
• Major shareholders Goldman Sachs and CMP Capital Management Partners are investigating a possible sale of their shares in the company
• At this stage, it is not possible to ascertain whether and in what form a total or partial sale will take place
• Nordex has decided to use the increased visibility of the business to provide a long-term view on the stand-alone value of the company
• Nordex keeps its existing medium-term guidance of 50% top-line growth unchanged but provides more detail on strategy and business development
Page 3
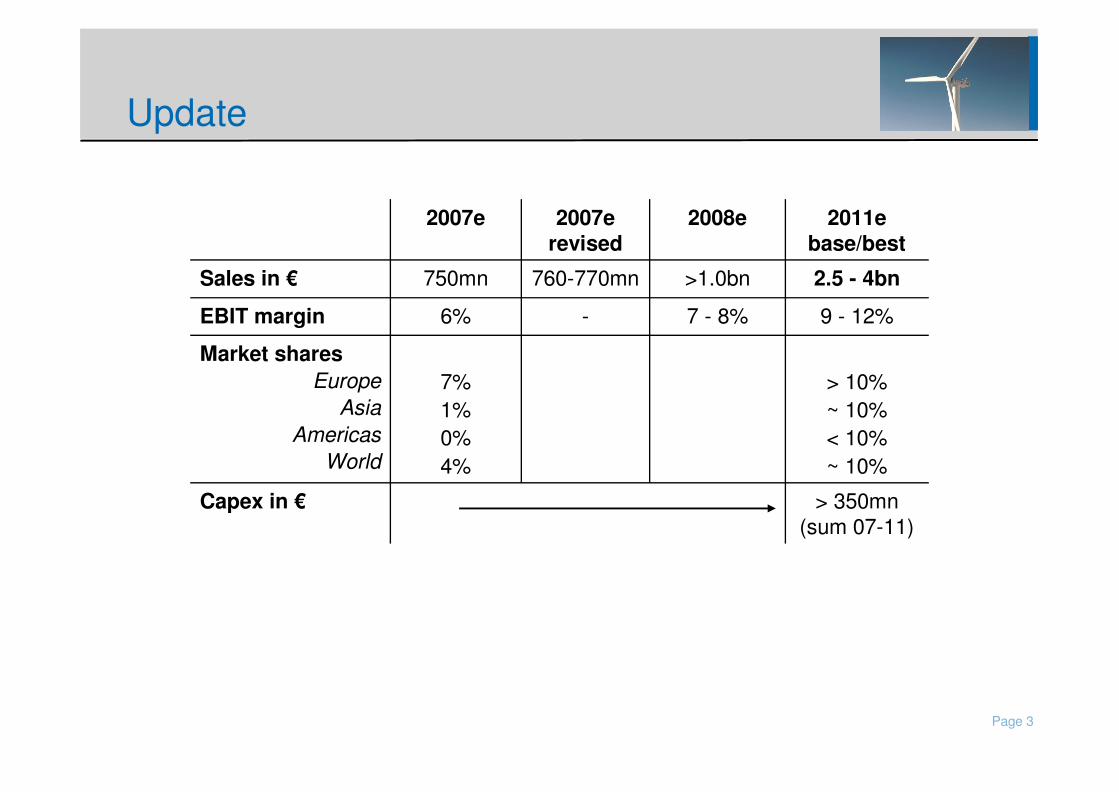
Update
7 - 8%
>1.0bn
2008e
> 10%~ 10%< 10%~ 10%
7%1%0%4%
Market sharesEurope
AsiaAmericas
World
> 350mn (sum 07-11)
Capex in €
9 - 12%-6%EBIT margin
2.5 - 4bn760-770mn750mnSales in €
2011e base/best
2007e revised
2007e

Page 4
Strategy to maintain above industry growth
1. Focus on selective growth markets
• Core European markets
• Infrastructure in China set for future growth
• Re-entry in North America
� Leverage strong track record
2. Drive local markets from within
• Own legal entities with local management in each volume market
• Implementation of value chain in each region
• Market-specific product development
3. Focus on MW class with highly attractive growth rates
4. Focus on long-standing relationship with utilities and IPPs

Page 5
Strong market outlook
2007e 2008e 2009e 2010e 2011e
Europe Americas Asia/Pacific RoW
BTM growth projection until 2011 by region New installations 2007-11
CAGR
Asia/Pacific: 29%
Americas: 24%
Europe: 16%
Thereof Offshore: 5%
18,800
21,980
25,730
28,835
33,500
CAGR: 17.4% Share
46%
2%
26%
26%
Source: BTM 2007

Page 6
Nordex core markets
EuropeNew MW -2011: 48,000CAGR 16%
CAGR of core markets 2007-2011Germany 9% Scandinavia 40%France 20% Poland 47%UK 29% Ireland 15%Italy 24% Turkey 33%
Nordex market share:2006 2011e7% > 10%
Asia/PacificNew MW -2011: 23,500 CAGR 29%
� Local production and purchasing structures up and running
Nordex market share:2006 2011e1% ~ 10%
North AmericaNew MW -2011: 28,000 CAGR 24%
� Set-up of full operationstructures (incl. Production) by 2009
Nordex market share:2006 2011e0% < 10%
Source: MAKE, Nordex

Page 7
MW class will increase in importance
< 750 750 - 1500 1501 - 2500 > 2500
8.305
0
2.000
4.000
6.000
8.000
10.000
12.000
2003
16.007
2006
14.000
16.000
50%
43%
Market Growth by Product Segments
35%
56%
Nordex is well positioned in high-growth product segments
Source: BTM 2007
Development of market segments by 2011
Offshore
Western Europe
North America
Established markets
Spain
China
India
Emerging markets
Offshore
Western Europe
(incl. Spain)
North America
China
India
Established markets
Emerging markets
no relevant growth
emerging markets continue to use smaller
turbines
key growth markets with
significant turbine up-scaling
drive growth of MW class
Page 8
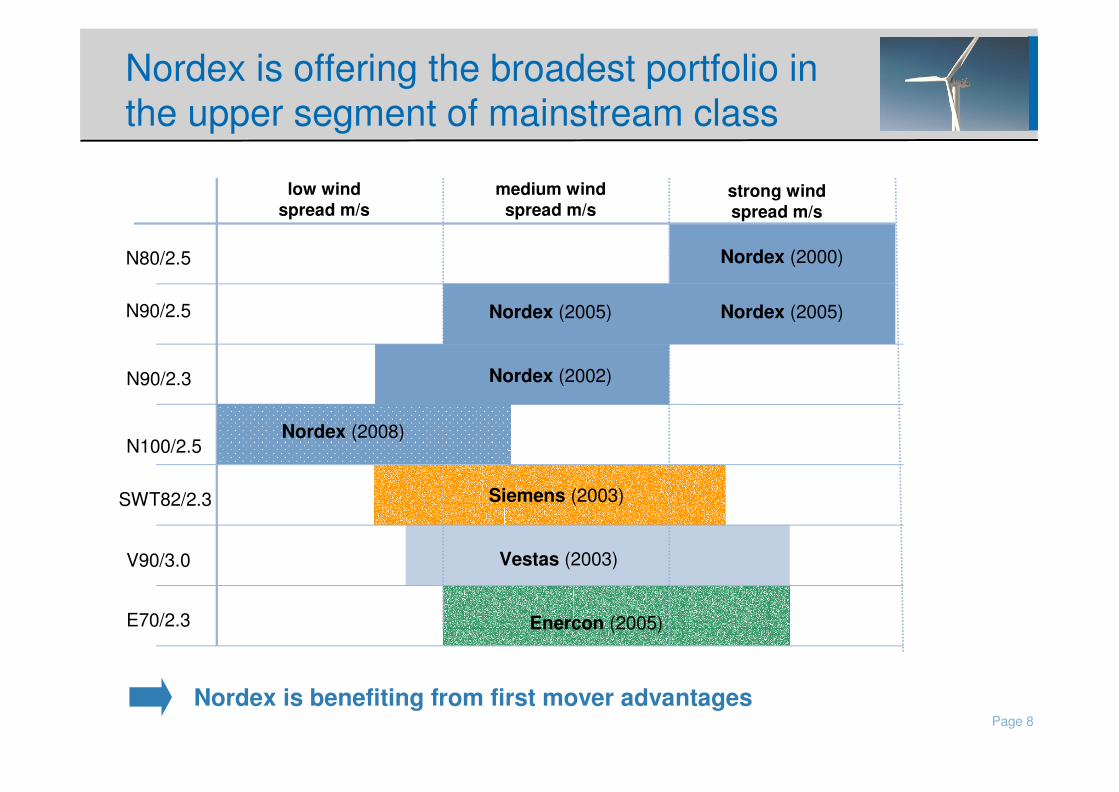
Nordex is offering the broadest portfolio in the upper segment of mainstream class
low windspread m/s
medium windspread m/s
N80/2.5
N90/2.5
Nordex (2000)
SWT82/2.3
V90/3.0
E70/2.3
N90/2.3
strong windspread m/s
N100/2.5
Nordex (2005)Nordex (2005)
Nordex (2002)
Nordex (2008)
Siemens (2003)
Vestas (2003)
Enercon (2005)
Nordex is benefiting from first mover advantages

Page 9
Leveraging established products –strong pipeline
2007 2008 2009 2010 2011 2012
N 60
S 70/77
N 80/90
N 100
N1XX
Product offering Europe
Main product Asia
Product offering Europe
Product offering U.S.
Product offering Europe/U.S. – completion of product range
Prototype
Product offering Asia/Europe Only delivery of single projects
Prototype U.S.
(Production only from Asia)
Prototype Maturity phase

Page 10
in € m
Reinvestments
New investments*
Germany
China
USA
Other Countries
Total CAPEX
Extension of production capacities to fulfil sales scenarios 2008 - 2011
2007e 2008e 2009e 2010e 2011e
Σ 70 Σ 100
Σ 50
Σ 80
Σ 50
Σ > 350
* blade + turbine production
Total capacity of 4,450 MW will secure mid-term growth path of 50% per year
Page 11
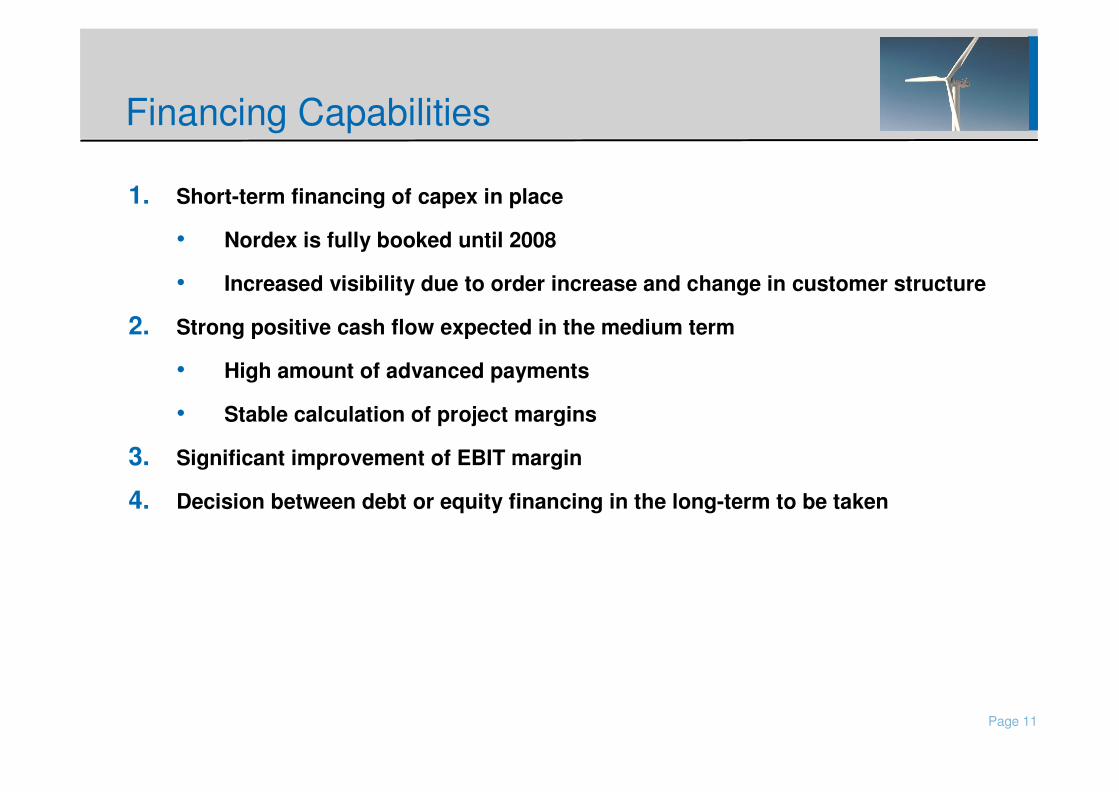
Financing Capabilities
1. Short-term financing of capex in place
• Nordex is fully booked until 2008
• Increased visibility due to order increase and change in customer structure
2. Strong positive cash flow expected in the medium term
• High amount of advanced payments
• Stable calculation of project margins
3. Significant improvement of EBIT margin
4. Decision between debt or equity financing in the long-term to be taken
Page 12
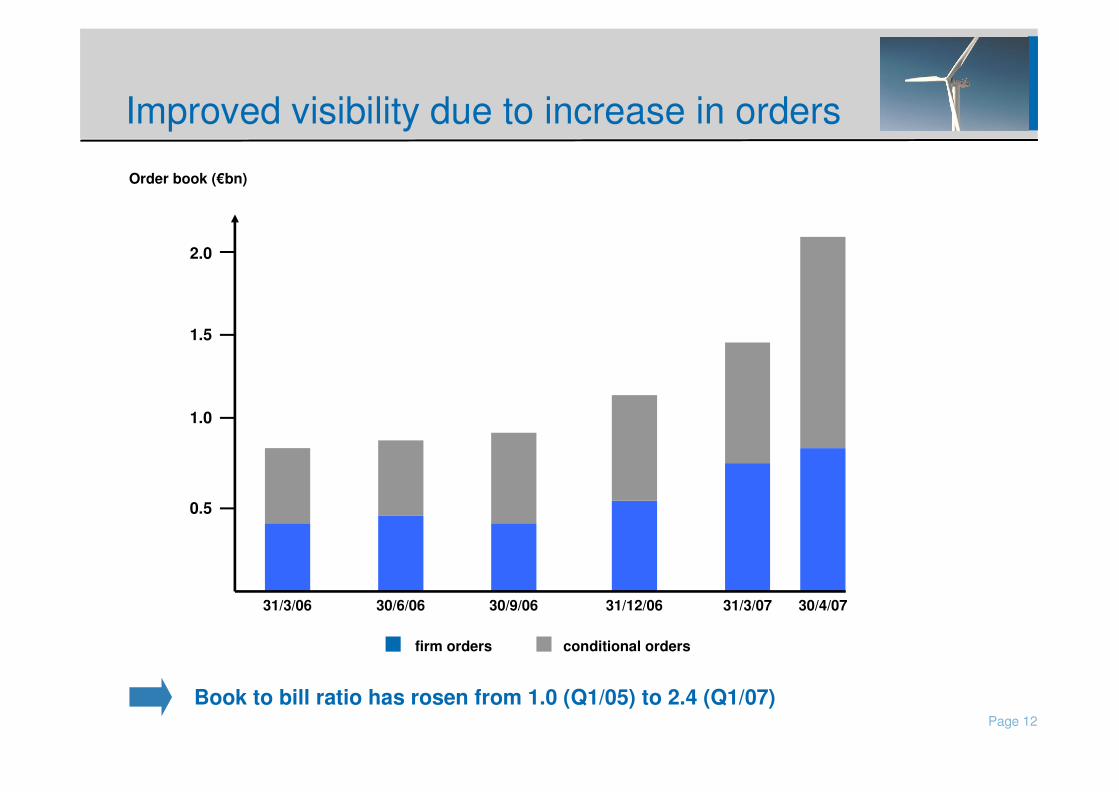
Improved visibility due to increase in orders
Order book (€ bn)
0.5
1.0
1.5
2.0
firm orders conditional orders
31/3/06 30/6/06 30/9/06 31/12/06 31/3/07 30/4/07
Book to bill ratio has rosen from 1.0 (Q1/05) to 2.4 (Q1/07)

Page 13
Nordex is benefiting from change in customer structure
Operator Capacity*
Iberdrola
Acciona
EDP
FPL
Endesa
EURUS
Essent
B & B
Shell
EDF
…
Total Share
1,877 MW
1,433 MW
1,094 MW
800 MW
700 MW
574 MW
530 MW
451 MW
109 MW
90 MW
…
7,658 MW(51%)
Nordex customer structure 2005 – 07eUtilities & IPP counting for >>>> 50% of new installed capacity in 2006
* New installed 2006
Utilities & IPP
2005
2006
2007e
65%
79%
53%
� Long standing relationship
� Financial stability
� Earnings visibility

Page 14
Main drivers of bottom-line growth
2007e 2008e 2011e
Target EBIT margin 6% 7-8% 9-12%
++ Higher utilisation of capacity
+ Price increase per MW due to shortages of WTG
- Expenditures into new markets

Page 15
Proven process stability under strong growth path of 50% per year
Example: contribution margin sales vs. final calculation
0.9%
2004
2005
2006
100% 98%
100% 100.9%
-2%
100% 100.8%0.8%
Tight processes and quality control
• Gate approval process (sales)
• Expected demand (supply)
• Production plan
• Project (start) calculation
• Internal handover (PM / service)
1-5/07 100% 101.2%1.2%

Page 16
Determinants of future Nordex growth path
1. Sustainable strong market growth for wind turbines
2. Products meeting market requirements
3. Availability of needed financial funds
4. Sufficient production capacities in place
5. Stability of business processes in Nordex
2005 -´07 2008 -´11
CAGR: 17% forecasted
2.0 – 3.0 MW expected to stay mainstream
Positive negotiations / talks (bonds, cash)
Extension of facilities prefaced
Close controlling systems in place

Page 17
• Order backlog secures top-line growth of 50% per year until 2008
• Nordex set out to generate € 4.0bn revenues and an EBIT-margin of 12% in 2011
• Long-term view on stand-alone value to facilitate investment decisions for equity investors and potential strategic buyers
Conclusion