microsoft cloud workshops - azure boot camp...
TRANSCRIPT
Microsoft Cloud
Workshops Internet of Things (IoT)
Hackathon Guide
April 2017
© 2017 Microsoft Corporation. All rights reserved. This document is confidential and
proprietary to Microsoft. Internal use only. This document is for informational purposes
only. MICROSOFT MAKES NO WARRANTIES, EXPRESS OR IMPLIED, IN THIS SUMMARY.
This document is provided "as-is." Information and views expressed in this document,
including URL and other Internet Web site references, may change without notice. You
bear the risk of using it.
Some examples are for illustration only and are fictitious. No real association is intended
or inferred.
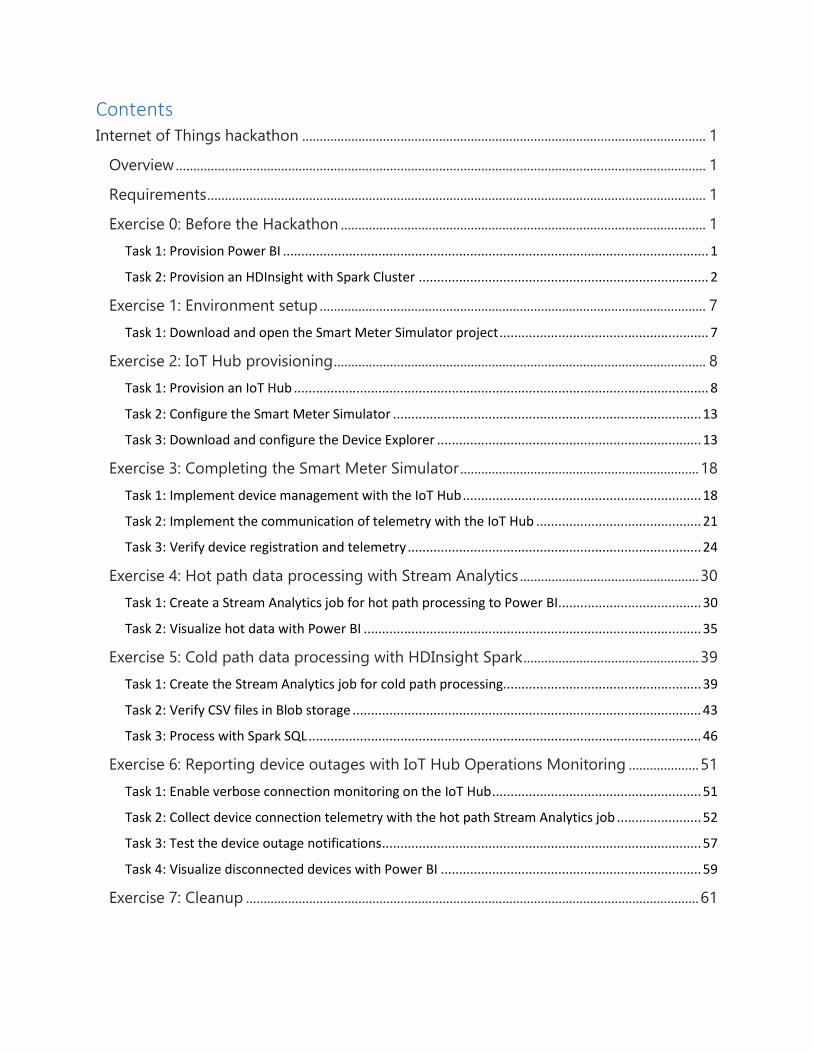
Contents Internet of Things hackathon ................................................................................................................... 1
Overview ....................................................................................................................................................... 1
Requirements .............................................................................................................................................. 1
Exercise 0: Before the Hackathon ........................................................................................................ 1
Task 1: Provision Power BI .................................................................................................................... 1
Task 2: Provision an HDInsight with Spark Cluster ............................................................................... 2
Exercise 1: Environment setup .............................................................................................................. 7
Task 1: Download and open the Smart Meter Simulator project ......................................................... 7
Exercise 2: IoT Hub provisioning .......................................................................................................... 8
Task 1: Provision an IoT Hub ................................................................................................................. 8
Task 2: Configure the Smart Meter Simulator .................................................................................... 13
Task 3: Download and configure the Device Explorer ........................................................................ 13
Exercise 3: Completing the Smart Meter Simulator .................................................................... 18
Task 1: Implement device management with the IoT Hub ................................................................. 18
Task 2: Implement the communication of telemetry with the IoT Hub ............................................. 21
Task 3: Verify device registration and telemetry ................................................................................ 24
Exercise 4: Hot path data processing with Stream Analytics ................................................... 30
Task 1: Create a Stream Analytics job for hot path processing to Power BI ....................................... 30
Task 2: Visualize hot data with Power BI ............................................................................................ 35
Exercise 5: Cold path data processing with HDInsight Spark .................................................. 39
Task 1: Create the Stream Analytics job for cold path processing...................................................... 39
Task 2: Verify CSV files in Blob storage ............................................................................................... 43
Task 3: Process with Spark SQL ........................................................................................................... 46
Exercise 6: Reporting device outages with IoT Hub Operations Monitoring .................... 51
Task 1: Enable verbose connection monitoring on the IoT Hub ......................................................... 51
Task 2: Collect device connection telemetry with the hot path Stream Analytics job ....................... 52
Task 3: Test the device outage notifications ....................................................................................... 57
Task 4: Visualize disconnected devices with Power BI ....................................................................... 59
Exercise 7: Cleanup ................................................................................................................................. 61

©2017 Microsoft Corporation
1
Internet of Things (IoT) hackathon Overview Fabrikam provides services and smart meters for enterprise energy (electrical power)
management. Their You-Left-The-Light-On service enables the enterprise to understand
their energy consumption.
In this Hackathon, you will construct an end-to-end solution for an IoT scenario that
includes device management; telemetry ingest; hot and cold path processing; and
reporting.
Requirements • Microsoft Azure subscription must be pay-as-you-go or MSDN.
o Trial subscriptions will not work.
• Local machine or a virtual machine configured with:
o Visual Studio 2015 Community Edition or later
o Azure SDK 2.8.2 for Visual Studio
o Azure PowerShell 1.0.0 or later
• A running HD Insight Spark cluster (see Exercise 0).
Exercise 0: Before the Hackathon Duration: 60 minutes
Synopsis: You should follow all of the steps provided in Exercise 0 of the Proctor Guide
(included in this document) before attending the Hackathon.
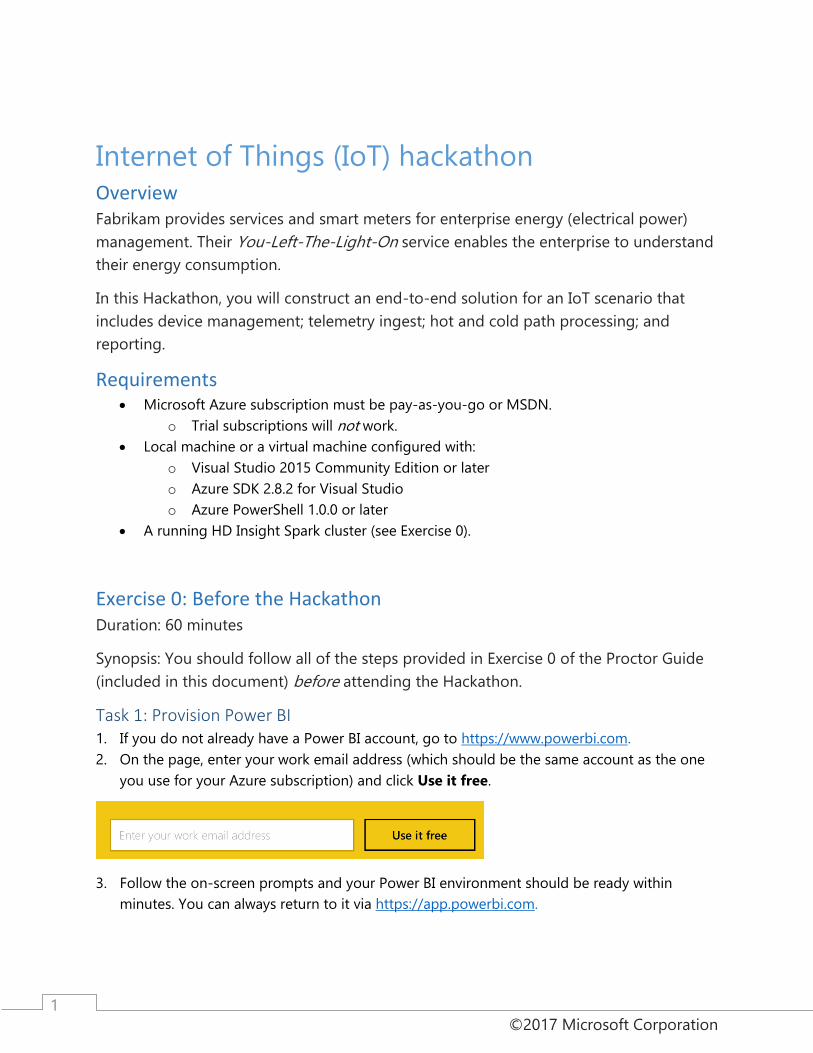
Task 1: Provision Power BI 1. If you do not already have a Power BI account, go to https://www.powerbi.com.
2. On the page, enter your work email address (which should be the same account as the one
you use for your Azure subscription) and click Use it free.
3. Follow the on-screen prompts and your Power BI environment should be ready within
minutes. You can always return to it via https://app.powerbi.com.
©2017 Microsoft Corporation
2
Task 2: Provision an HDInsight with Spark Cluster
Using the Azure Portal, provision a new HDInsight cluster.
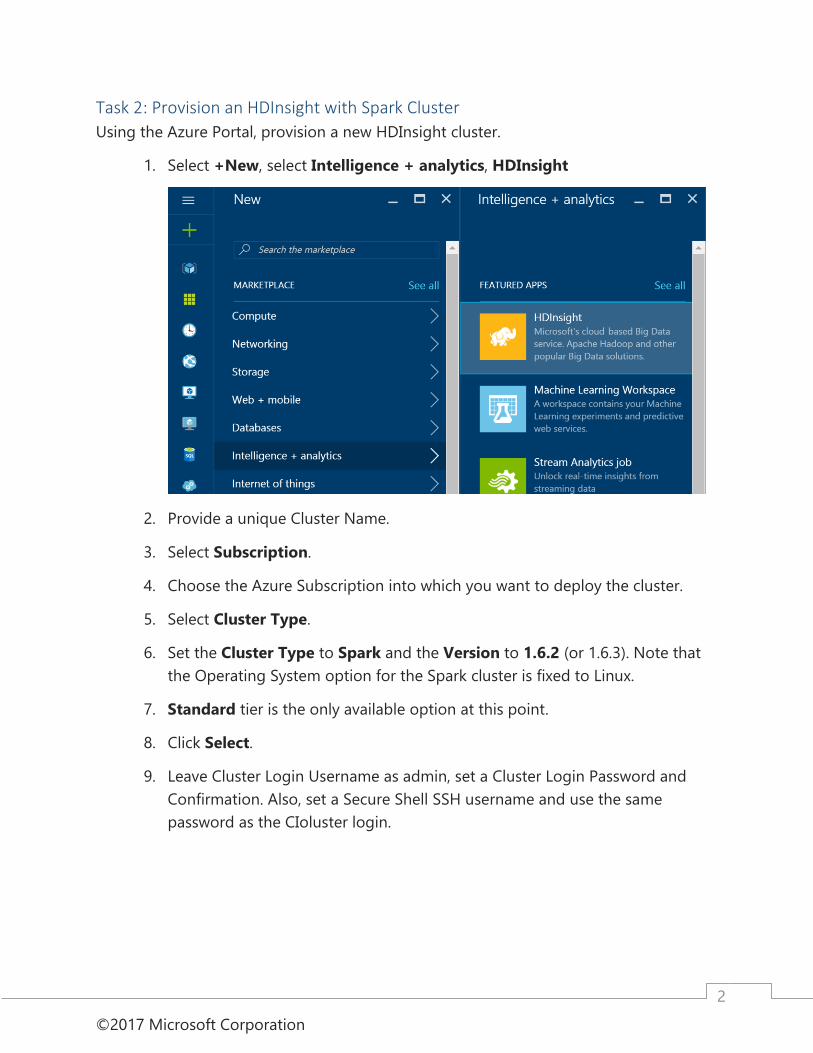
1. Select +New, select Intelligence + analytics, HDInsight
2. Provide a unique Cluster Name.
3. Select Subscription.
4. Choose the Azure Subscription into which you want to deploy the cluster.
5. Select Cluster Type.
6. Set the Cluster Type to Spark and the Version to 1.6.2 (or 1.6.3). Note that
the Operating System option for the Spark cluster is fixed to Linux.
7. Standard tier is the only available option at this point.
8. Click Select.
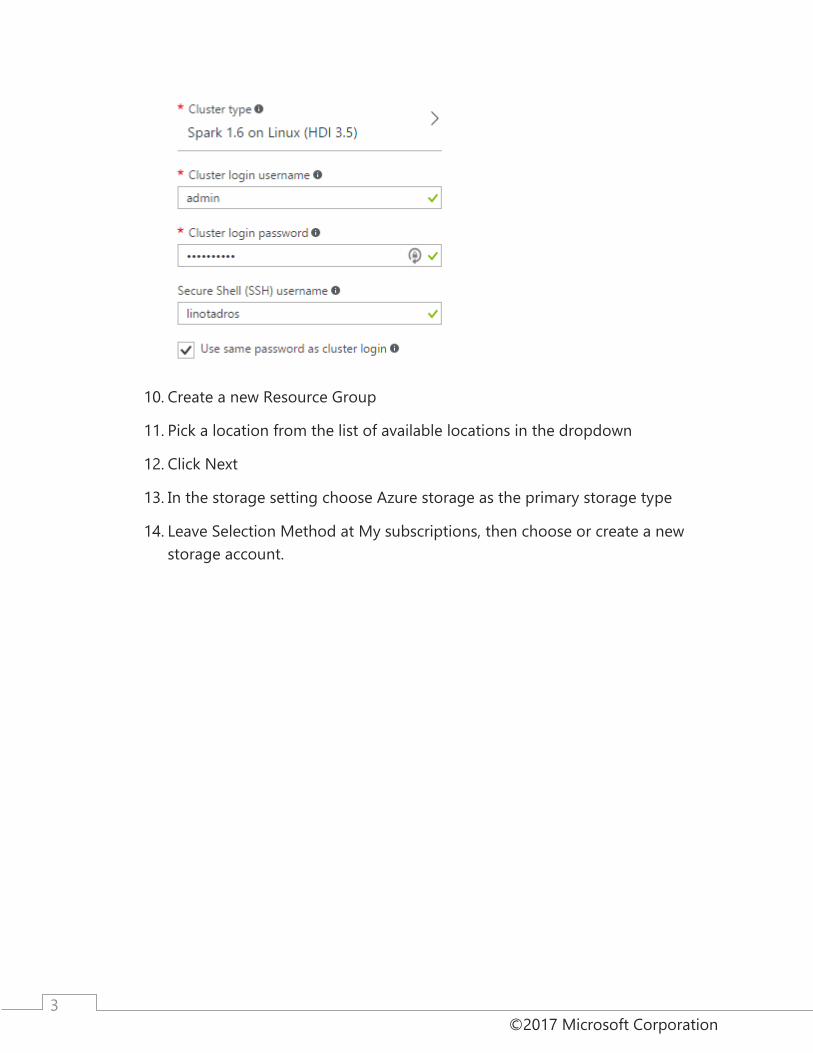
9. Leave Cluster Login Username as admin, set a Cluster Login Password and
Confirmation. Also, set a Secure Shell SSH username and use the same
password as the CIoluster login.
©2017 Microsoft Corporation
3
10. Create a new Resource Group
11. Pick a location from the list of available locations in the dropdown
12. Click Next
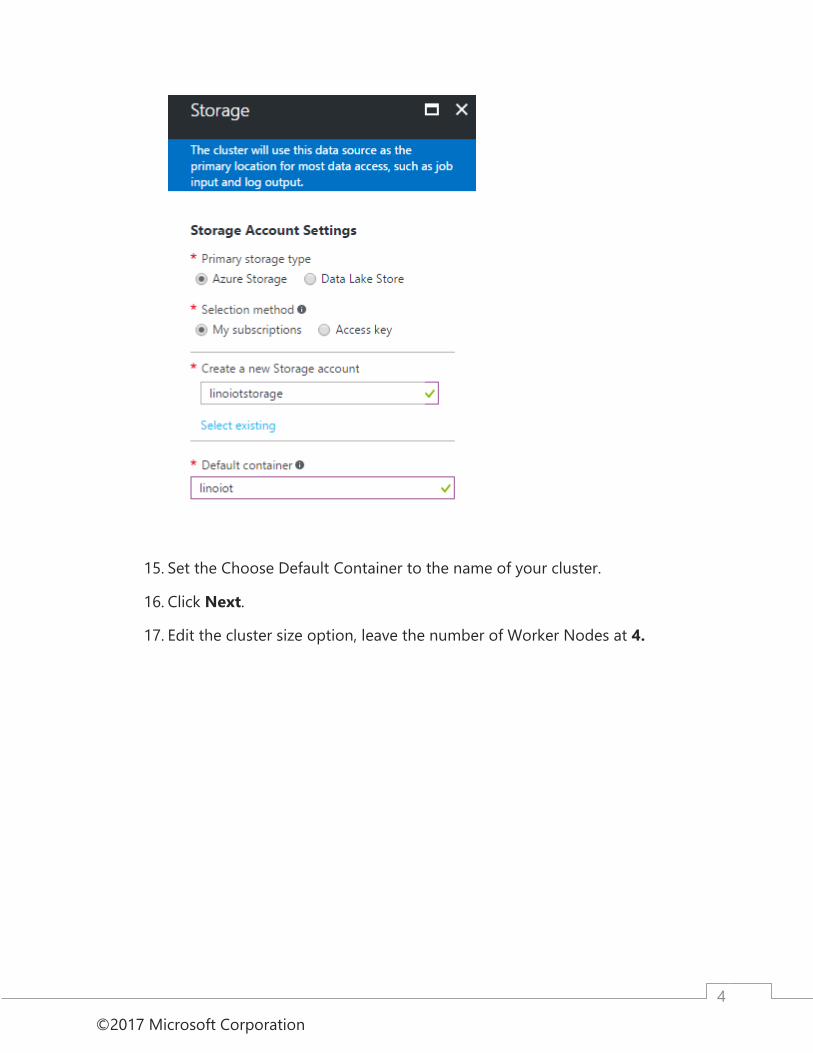
13. In the storage setting choose Azure storage as the primary storage type
14. Leave Selection Method at My subscriptions, then choose or create a new
storage account.
©2017 Microsoft Corporation
4
15. Set the Choose Default Container to the name of your cluster.
16. Click Next.
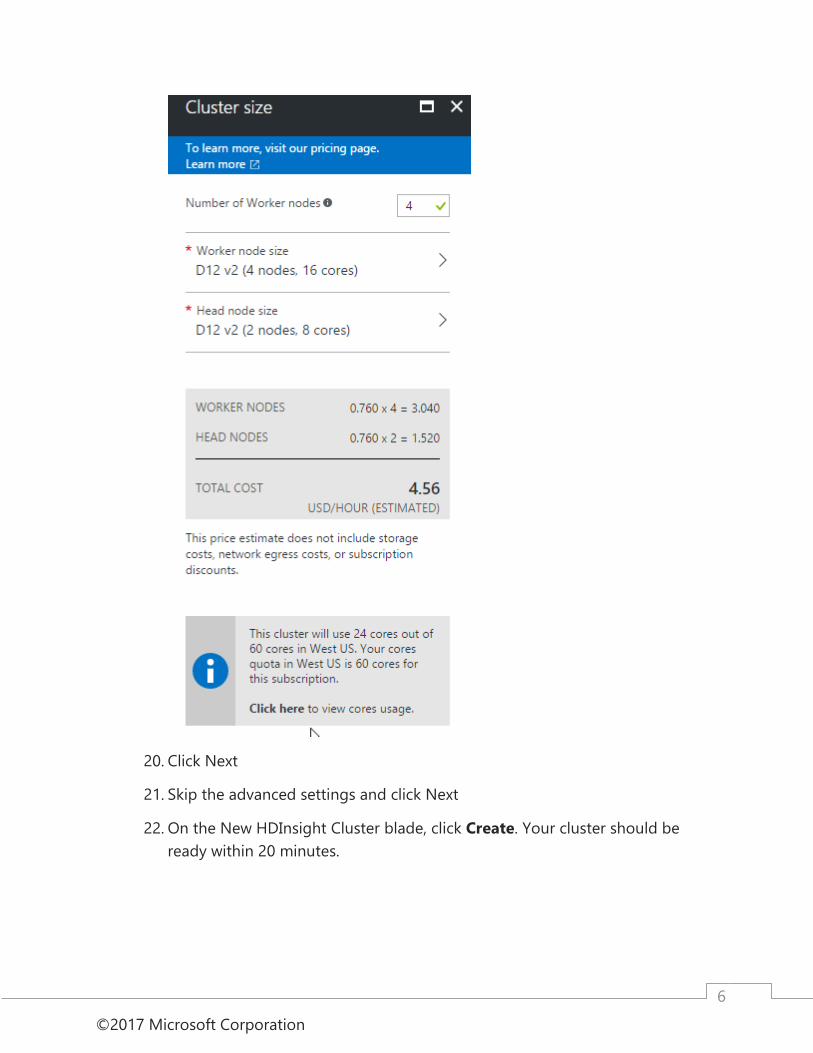
17. Edit the cluster size option, leave the number of Worker Nodes at 4.
©2017 Microsoft Corporation
5
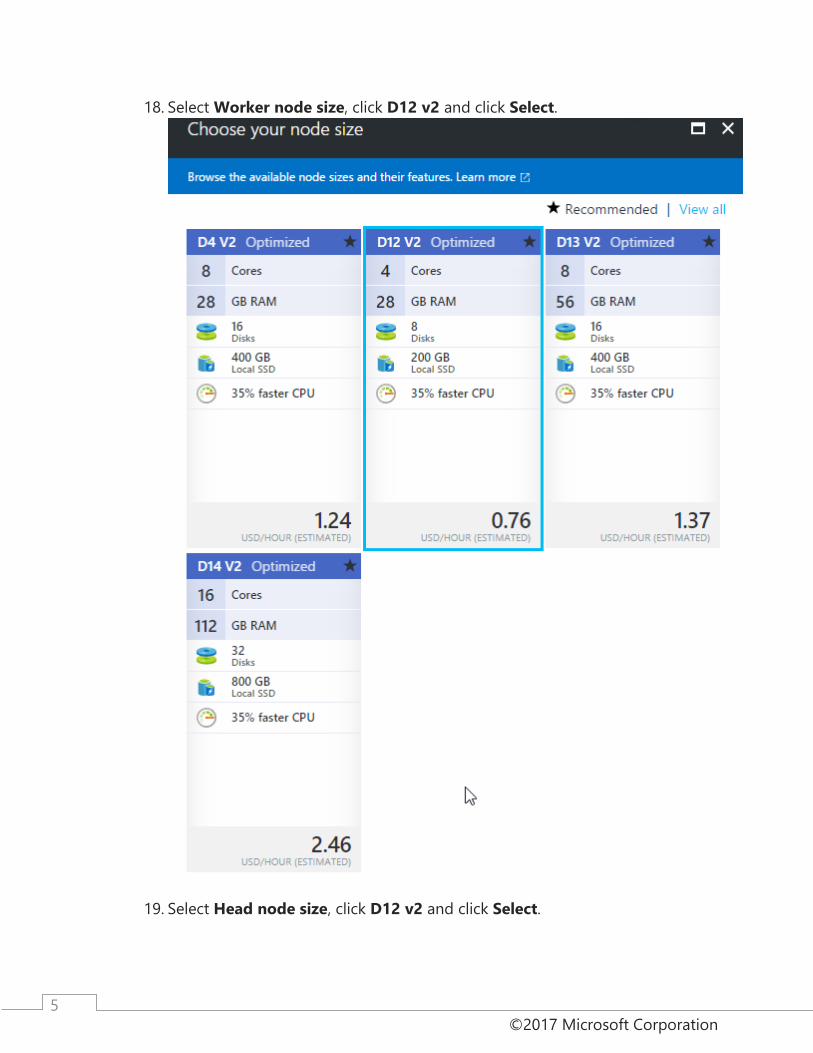
18. Select Worker node size, click D12 v2 and click Select.
19. Select Head node size, click D12 v2 and click Select.
©2017 Microsoft Corporation
6
20. Click Next
21. Skip the advanced settings and click Next
22. On the New HDInsight Cluster blade, click Create. Your cluster should be
ready within 20 minutes.
©2017 Microsoft Corporation
7
Exercise 1: Environment setup Duration: 10 minutes
Synopsis: Fabrikam has provided a Smart Meter Simulator that they use to simulate
device registration as well as the generation and transmission of telemetry data. They
have asked you to use this as the starting point for integrating their smart meters with
Azure.
Task 1: Download and open the Smart Meter Simulator project 1. Download the Smart Meter Simulator starter project from the following URL:
http://bit.ly/1KR8TPY. (Note: the URL is case-sensitive)
2. Unzip the contents.
3. Open SmartMeterSimulator.sln with Visual Studio.
Note: If you attempt to build the solution at this point, you will see many build errors.
This is intentional. You will correct these in the exercises that follow.
©2017 Microsoft Corporation
8
Exercise 2: IoT Hub provisioning Duration: 20 minutes
Synopsis: In your architecture design session with Fabrikam, it was agreed that you
would use an Azure IoT Hub to manage both the device registration and telemetry
ingest from the Smart Meter Simulator. Your team also identified the Microsoft provided
Device Explorer project that Fabrikam can use to view the list and status of devices in
the IoT Hub registry.
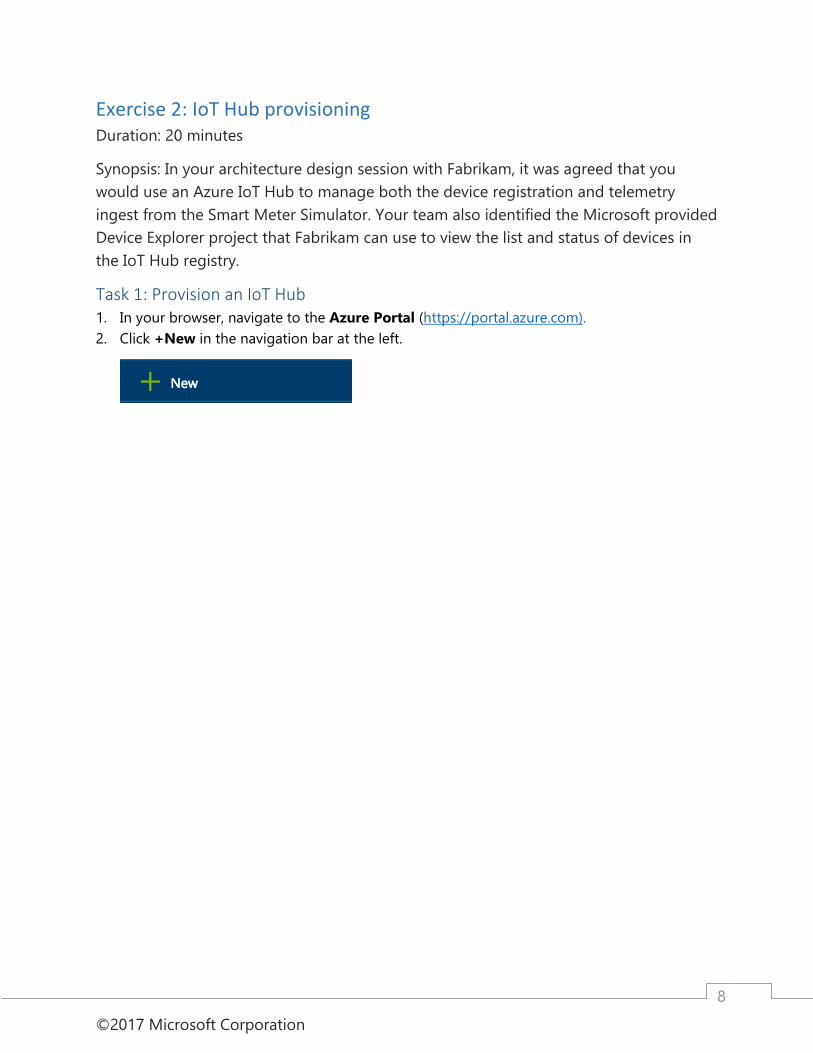
Task 1: Provision an IoT Hub 1. In your browser, navigate to the Azure Portal (https://portal.azure.com).
2. Click +New in the navigation bar at the left.
©2017 Microsoft Corporation
9
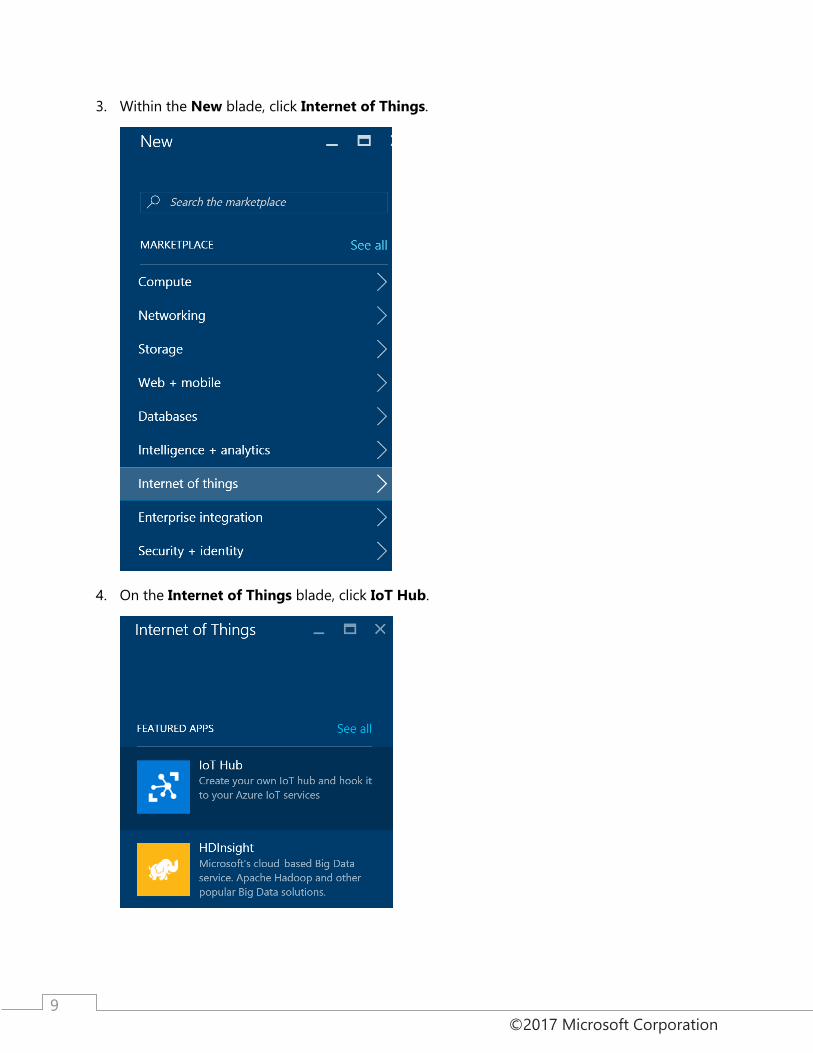
3. Within the New blade, click Internet of Things.
4. On the Internet of Things blade, click IoT Hub.
©2017 Microsoft Corporation
10
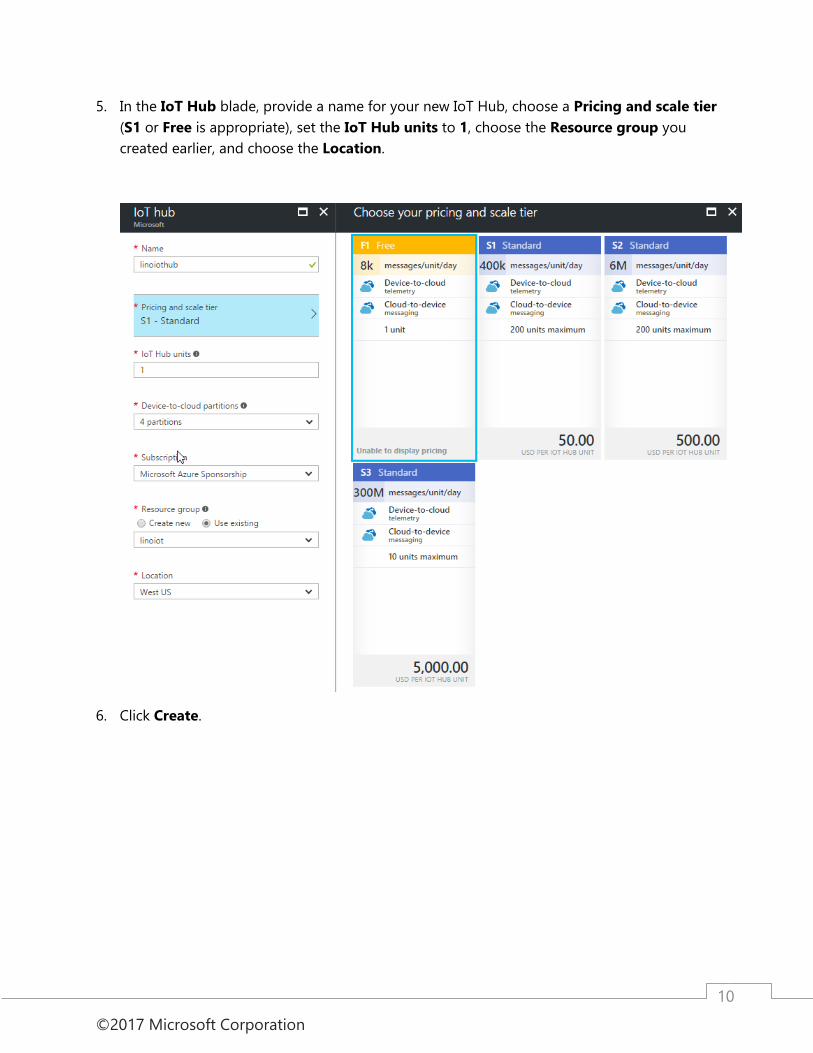
5. In the IoT Hub blade, provide a name for your new IoT Hub, choose a Pricing and scale tier
(S1 or Free is appropriate), set the IoT Hub units to 1, choose the Resource group you
created earlier, and choose the Location.
6. Click Create.
©2017 Microsoft Corporation
11
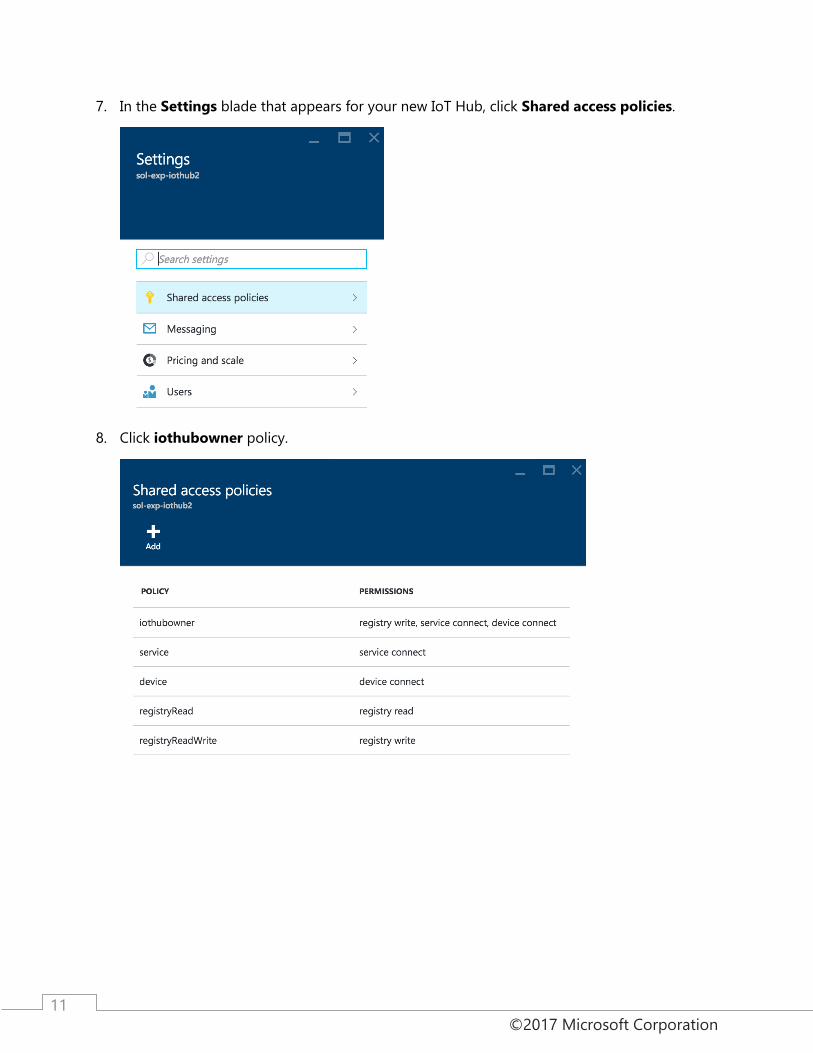
7. In the Settings blade that appears for your new IoT Hub, click Shared access policies.
8. Click iothubowner policy.
©2017 Microsoft Corporation
12
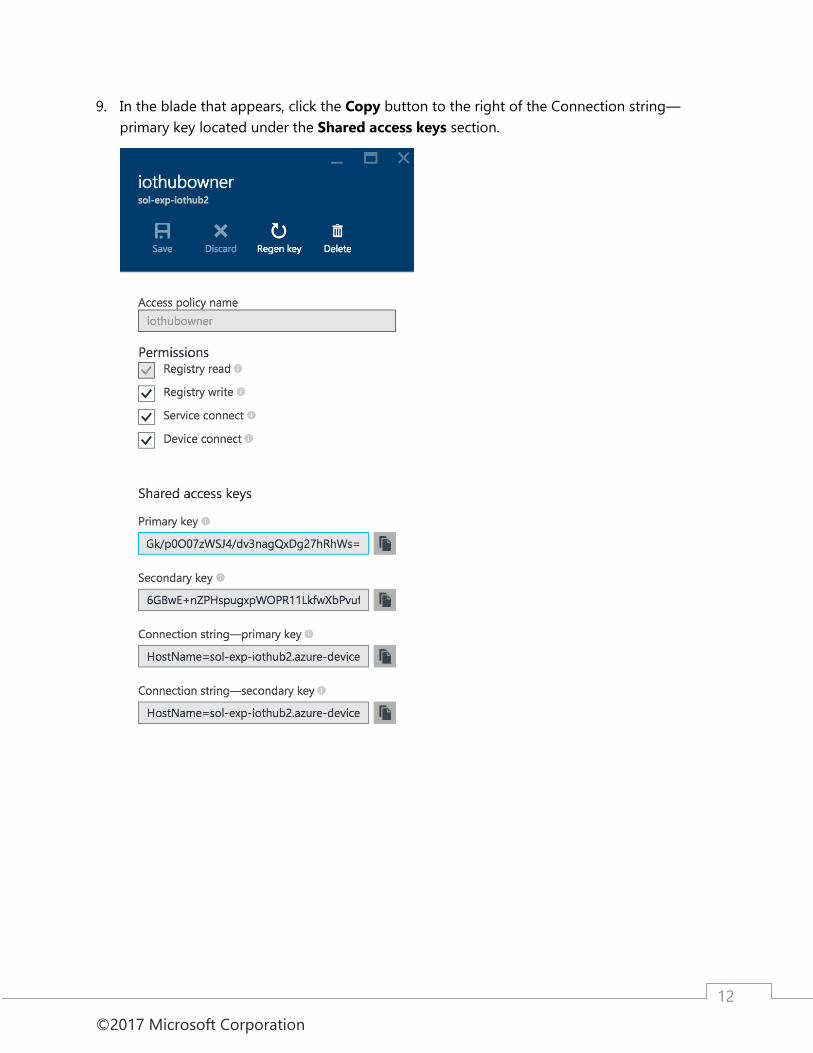
9. In the blade that appears, click the Copy button to the right of the Connection string—
primary key located under the Shared access keys section.
©2017 Microsoft Corporation
13
Task 2: Configure the Smart Meter Simulator
If you want to save this connection string with your project (in case you stop debugging
or otherwise close the simulator), you can set this as the default text for the text box.
Follow these steps to configure the connection string:
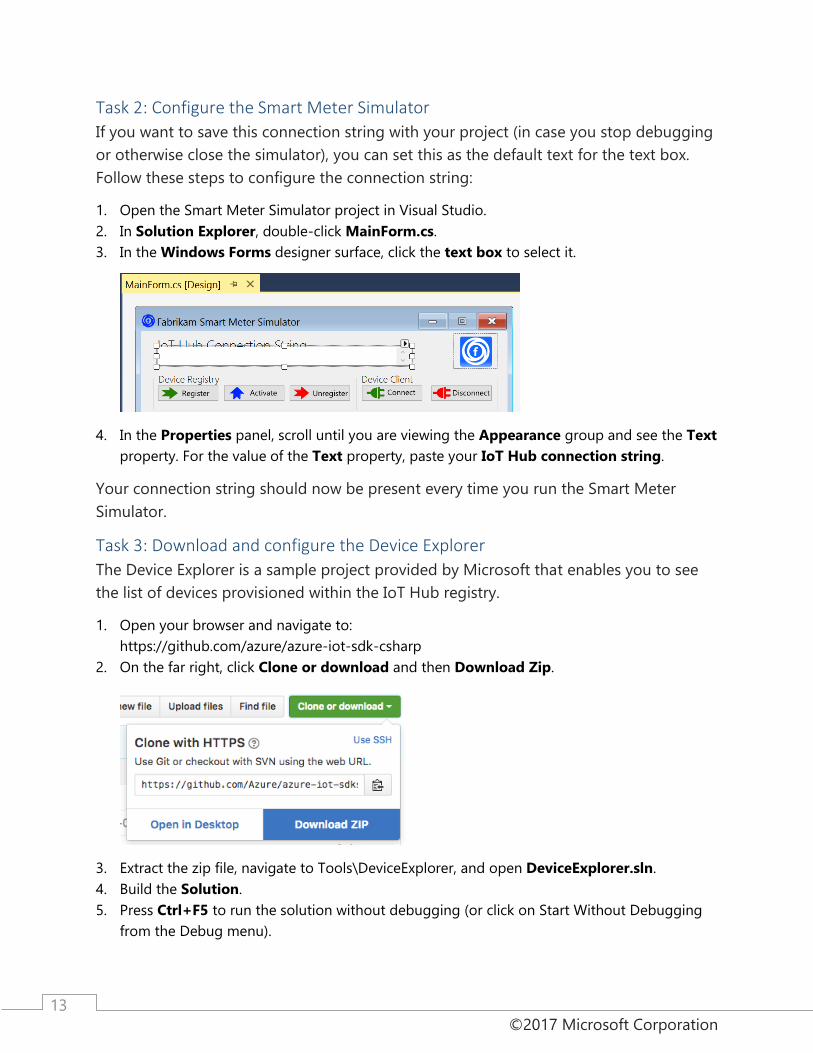
1. Open the Smart Meter Simulator project in Visual Studio.
2. In Solution Explorer, double-click MainForm.cs.
3. In the Windows Forms designer surface, click the text box to select it.
4. In the Properties panel, scroll until you are viewing the Appearance group and see the Text
property. For the value of the Text property, paste your IoT Hub connection string.
Your connection string should now be present every time you run the Smart Meter
Simulator.
Task 3: Download and configure the Device Explorer
The Device Explorer is a sample project provided by Microsoft that enables you to see
the list of devices provisioned within the IoT Hub registry.
1. Open your browser and navigate to:
https://github.com/azure/azure-iot-sdk-csharp
2. On the far right, click Clone or download and then Download Zip.
3. Extract the zip file, navigate to Tools\DeviceExplorer, and open DeviceExplorer.sln.
4. Build the Solution.
5. Press Ctrl+F5 to run the solution without debugging (or click on Start Without Debugging
from the Debug menu).

©2017 Microsoft Corporation
14
6. Device Explorer will appear as follows:
7. To get to the IoT Hub connection string to use, you could reuse the same connection string
for the iothubowner policy you used for the Smart Meter Simulator; however, since we are
only interested in querying the device registry, we can use the more specific registryRead.
8. From your IoT Hub’s blade, click Settings. In the Settings blade that appears, click Shared
access policies.
©2017 Microsoft Corporation
15
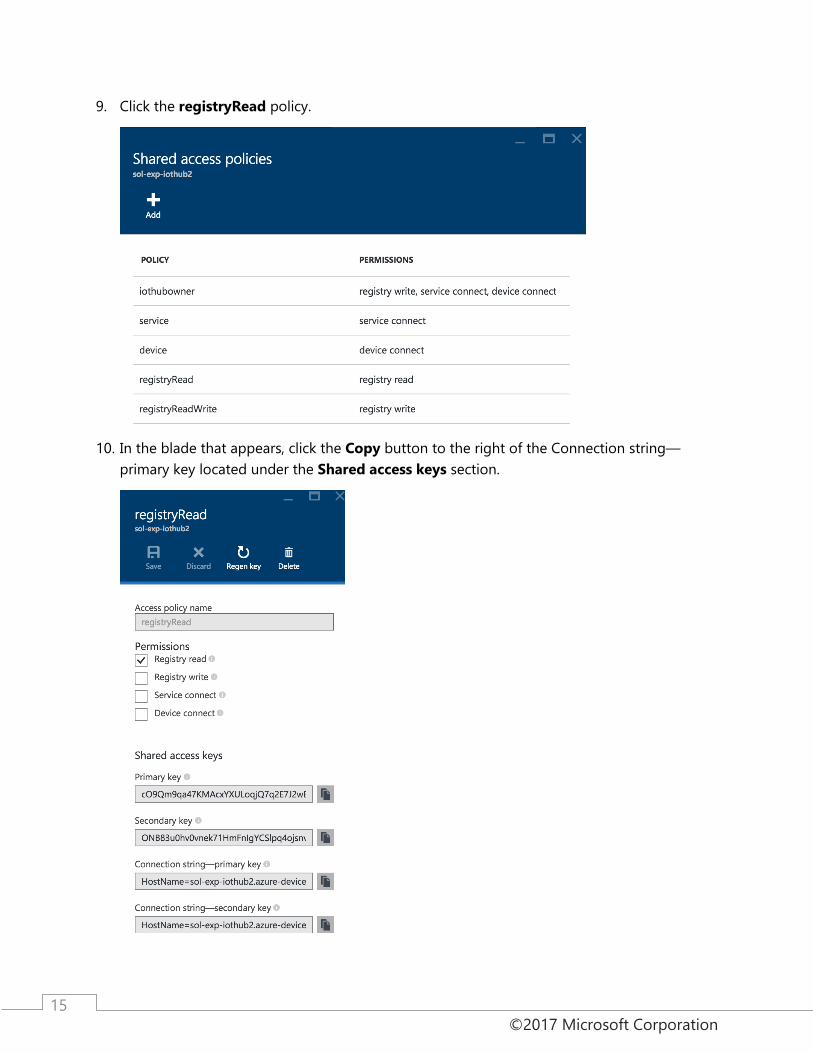
9. Click the registryRead policy.
10. In the blade that appears, click the Copy button to the right of the Connection string—
primary key located under the Shared access keys section.
©2017 Microsoft Corporation
16
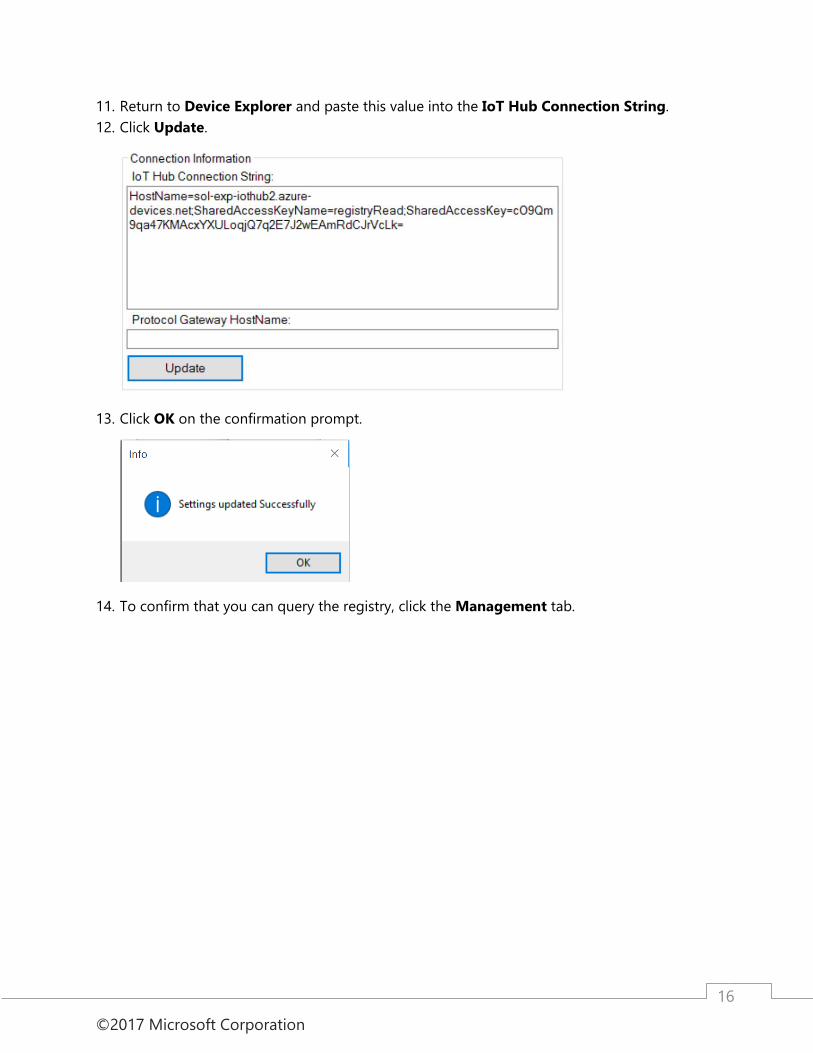
11. Return to Device Explorer and paste this value into the IoT Hub Connection String.
12. Click Update.
13. Click OK on the confirmation prompt.
14. To confirm that you can query the registry, click the Management tab.
©2017 Microsoft Corporation
17
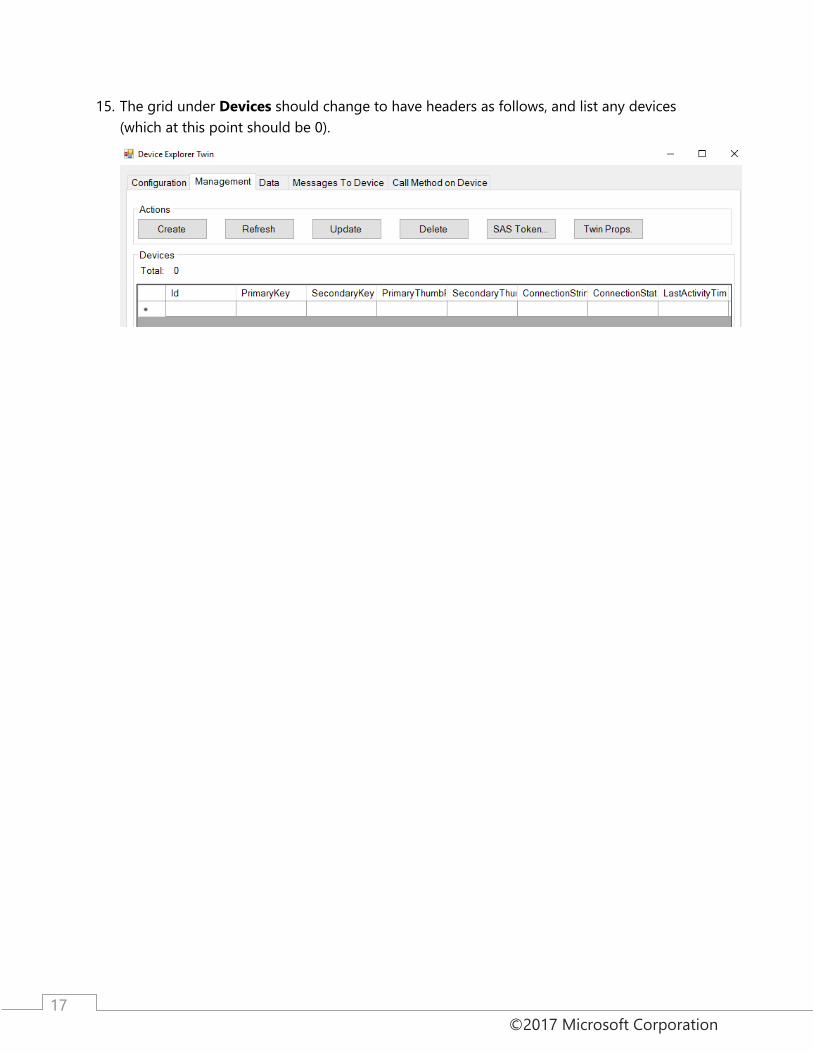
15. The grid under Devices should change to have headers as follows, and list any devices
(which at this point should be 0).
©2017 Microsoft Corporation
18
Exercise 3: Completing the Smart Meter Simulator Duration: 90 minutes
Fabrikam has left you a partially completed sample in the form of the Smart Meter
Simulator solution. You will need to complete the missing lines of code that deal with
device registration management and device telemetry transmission that communicate
with your IoT Hub.
Task 1: Implement device management with the IoT Hub 1. With the Smart Meter Simulator solution open in Visual Studio, use Solution Explorer to
open the file DeviceManager.cs.
2. From the View menu, click Task List. There you will see a list of TODO tasks, where each task
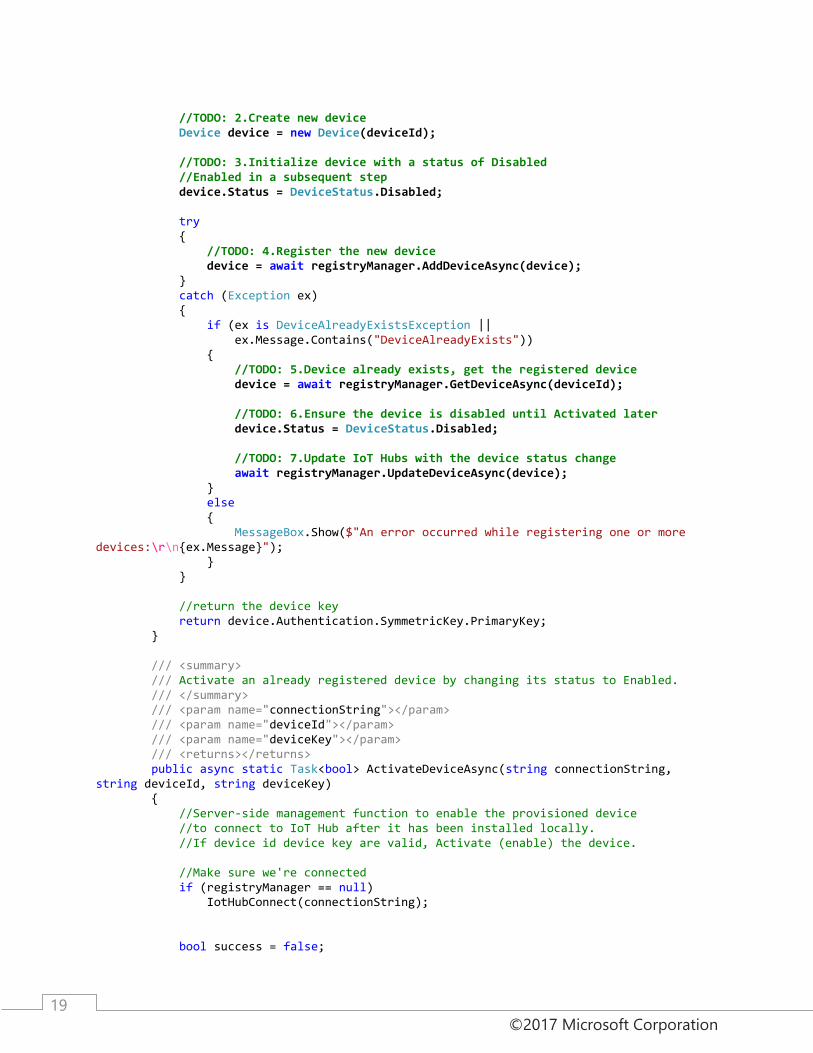
represents one line of code that needs to be completed. Copy the code in bold below the
corresponding TODO item in the completed code that follows.
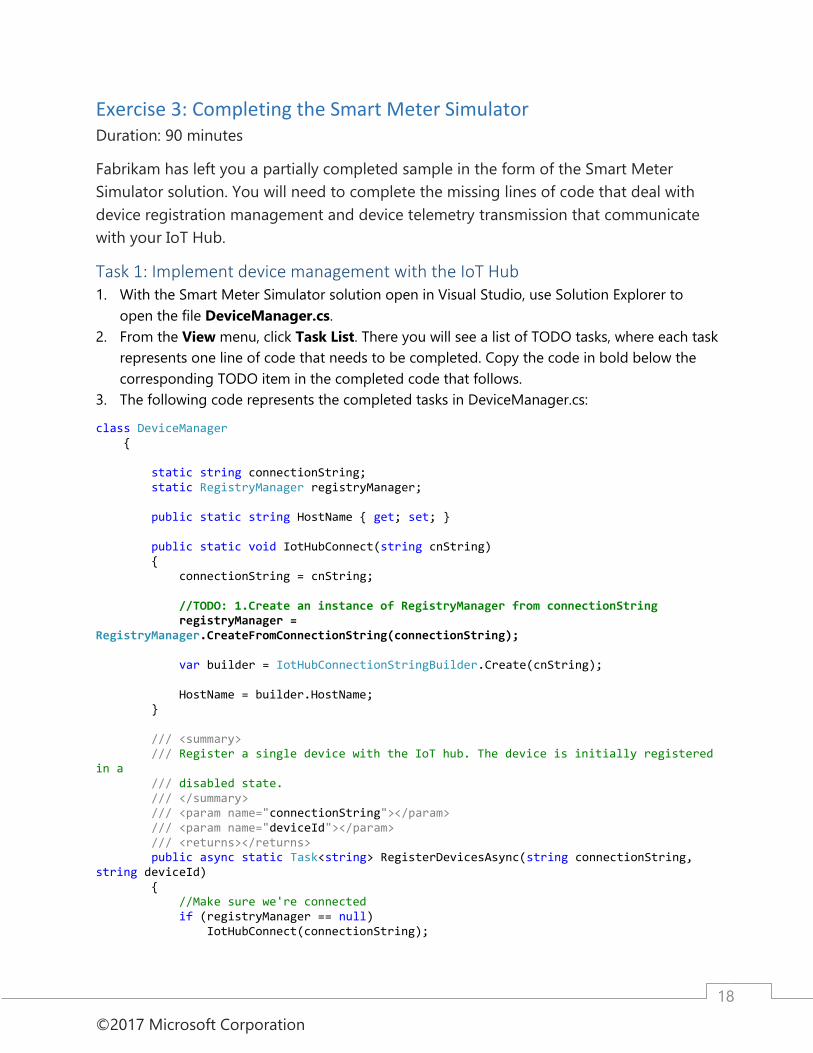
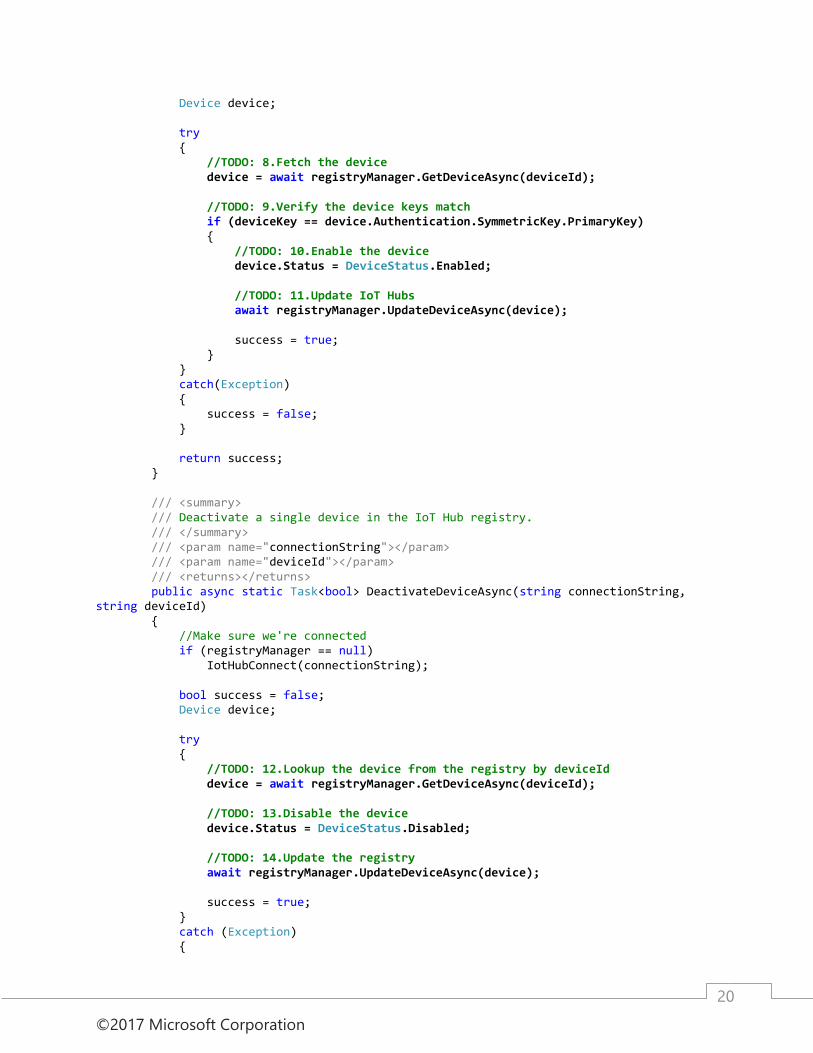
3. The following code represents the completed tasks in DeviceManager.cs:
class DeviceManager { static string connectionString; static RegistryManager registryManager; public static string HostName { get; set; } public static void IotHubConnect(string cnString) { connectionString = cnString; //TODO: 1.Create an instance of RegistryManager from connectionString registryManager = RegistryManager.CreateFromConnectionString(connectionString); var builder = IotHubConnectionStringBuilder.Create(cnString); HostName = builder.HostName; } /// <summary> /// Register a single device with the IoT hub. The device is initially registered in a /// disabled state. /// </summary> /// <param name="connectionString"></param> /// <param name="deviceId"></param> /// <returns></returns> public async static Task<string> RegisterDevicesAsync(string connectionString, string deviceId) { //Make sure we're connected if (registryManager == null) IotHubConnect(connectionString);
©2017 Microsoft Corporation
19
//TODO: 2.Create new device Device device = new Device(deviceId); //TODO: 3.Initialize device with a status of Disabled //Enabled in a subsequent step device.Status = DeviceStatus.Disabled; try { //TODO: 4.Register the new device device = await registryManager.AddDeviceAsync(device); } catch (Exception ex) { if (ex is DeviceAlreadyExistsException || ex.Message.Contains("DeviceAlreadyExists")) { //TODO: 5.Device already exists, get the registered device device = await registryManager.GetDeviceAsync(deviceId); //TODO: 6.Ensure the device is disabled until Activated later device.Status = DeviceStatus.Disabled; //TODO: 7.Update IoT Hubs with the device status change await registryManager.UpdateDeviceAsync(device); } else { MessageBox.Show($"An error occurred while registering one or more devices:\r\n{ex.Message}"); } } //return the device key return device.Authentication.SymmetricKey.PrimaryKey; } /// <summary> /// Activate an already registered device by changing its status to Enabled. /// </summary> /// <param name="connectionString"></param> /// <param name="deviceId"></param> /// <param name="deviceKey"></param> /// <returns></returns> public async static Task<bool> ActivateDeviceAsync(string connectionString, string deviceId, string deviceKey) { //Server-side management function to enable the provisioned device //to connect to IoT Hub after it has been installed locally. //If device id device key are valid, Activate (enable) the device. //Make sure we're connected if (registryManager == null) IotHubConnect(connectionString); bool success = false;
©2017 Microsoft Corporation
20
Device device; try { //TODO: 8.Fetch the device device = await registryManager.GetDeviceAsync(deviceId); //TODO: 9.Verify the device keys match if (deviceKey == device.Authentication.SymmetricKey.PrimaryKey) { //TODO: 10.Enable the device device.Status = DeviceStatus.Enabled; //TODO: 11.Update IoT Hubs await registryManager.UpdateDeviceAsync(device); success = true; } } catch(Exception) { success = false; } return success; } /// <summary> /// Deactivate a single device in the IoT Hub registry. /// </summary> /// <param name="connectionString"></param> /// <param name="deviceId"></param> /// <returns></returns> public async static Task<bool> DeactivateDeviceAsync(string connectionString, string deviceId) { //Make sure we're connected if (registryManager == null) IotHubConnect(connectionString); bool success = false; Device device; try { //TODO: 12.Lookup the device from the registry by deviceId device = await registryManager.GetDeviceAsync(deviceId); //TODO: 13.Disable the device device.Status = DeviceStatus.Disabled; //TODO: 14.Update the registry await registryManager.UpdateDeviceAsync(device); success = true; } catch (Exception) {
©2017 Microsoft Corporation
21
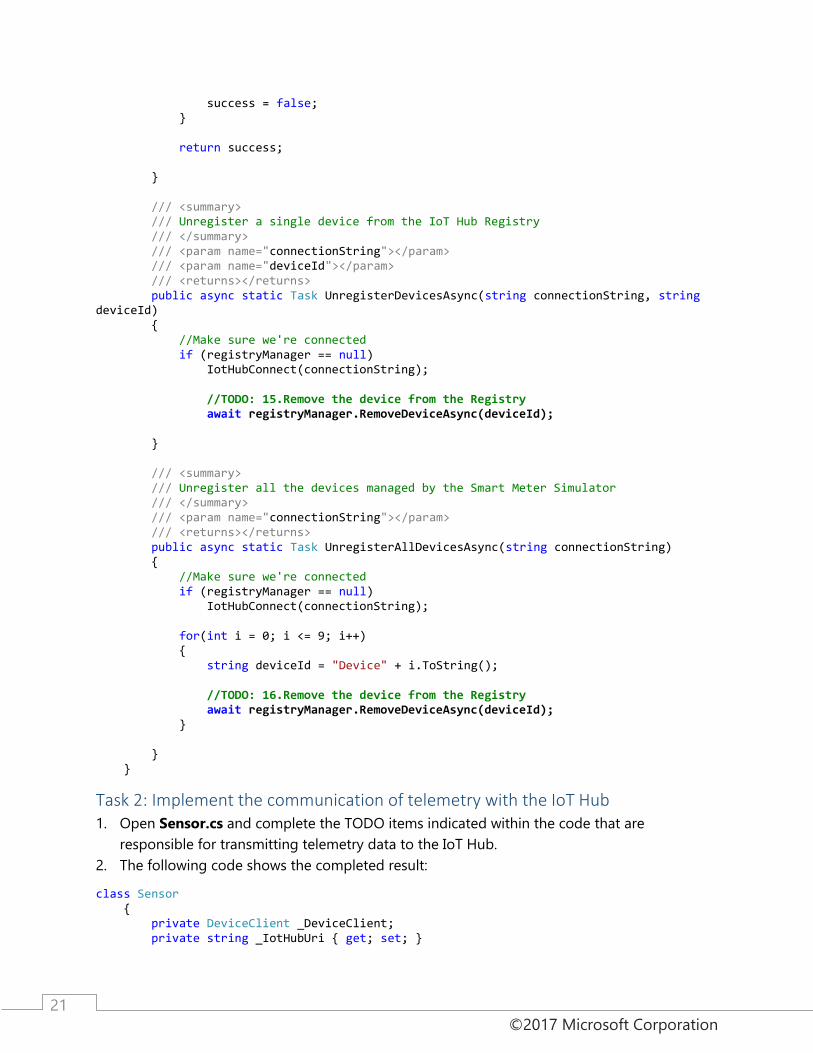
success = false; } return success; } /// <summary> /// Unregister a single device from the IoT Hub Registry /// </summary> /// <param name="connectionString"></param> /// <param name="deviceId"></param> /// <returns></returns> public async static Task UnregisterDevicesAsync(string connectionString, string deviceId) { //Make sure we're connected if (registryManager == null) IotHubConnect(connectionString); //TODO: 15.Remove the device from the Registry await registryManager.RemoveDeviceAsync(deviceId); } /// <summary> /// Unregister all the devices managed by the Smart Meter Simulator /// </summary> /// <param name="connectionString"></param> /// <returns></returns> public async static Task UnregisterAllDevicesAsync(string connectionString) { //Make sure we're connected if (registryManager == null) IotHubConnect(connectionString); for(int i = 0; i <= 9; i++) { string deviceId = "Device" + i.ToString(); //TODO: 16.Remove the device from the Registry await registryManager.RemoveDeviceAsync(deviceId); } } }
Task 2: Implement the communication of telemetry with the IoT Hub 1. Open Sensor.cs and complete the TODO items indicated within the code that are
responsible for transmitting telemetry data to the IoT Hub.
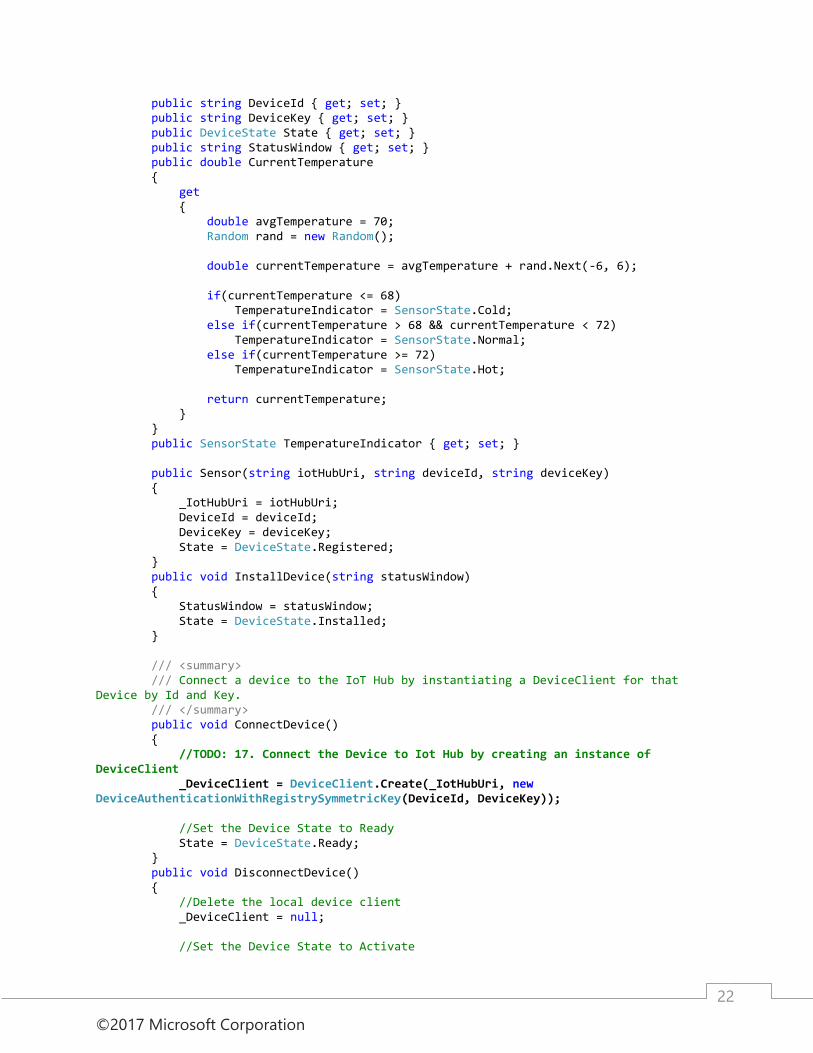
2. The following code shows the completed result:
class Sensor { private DeviceClient _DeviceClient; private string _IotHubUri { get; set; }
©2017 Microsoft Corporation
22
public string DeviceId { get; set; } public string DeviceKey { get; set; } public DeviceState State { get; set; } public string StatusWindow { get; set; } public double CurrentTemperature { get { double avgTemperature = 70; Random rand = new Random(); double currentTemperature = avgTemperature + rand.Next(-6, 6); if(currentTemperature <= 68) TemperatureIndicator = SensorState.Cold; else if(currentTemperature > 68 && currentTemperature < 72) TemperatureIndicator = SensorState.Normal; else if(currentTemperature >= 72) TemperatureIndicator = SensorState.Hot; return currentTemperature; } } public SensorState TemperatureIndicator { get; set; } public Sensor(string iotHubUri, string deviceId, string deviceKey) { _IotHubUri = iotHubUri; DeviceId = deviceId; DeviceKey = deviceKey; State = DeviceState.Registered; } public void InstallDevice(string statusWindow) { StatusWindow = statusWindow; State = DeviceState.Installed; } /// <summary> /// Connect a device to the IoT Hub by instantiating a DeviceClient for that Device by Id and Key. /// </summary> public void ConnectDevice() { //TODO: 17. Connect the Device to Iot Hub by creating an instance of DeviceClient _DeviceClient = DeviceClient.Create(_IotHubUri, new DeviceAuthenticationWithRegistrySymmetricKey(DeviceId, DeviceKey)); //Set the Device State to Ready State = DeviceState.Ready; } public void DisconnectDevice() { //Delete the local device client _DeviceClient = null; //Set the Device State to Activate
©2017 Microsoft Corporation
23
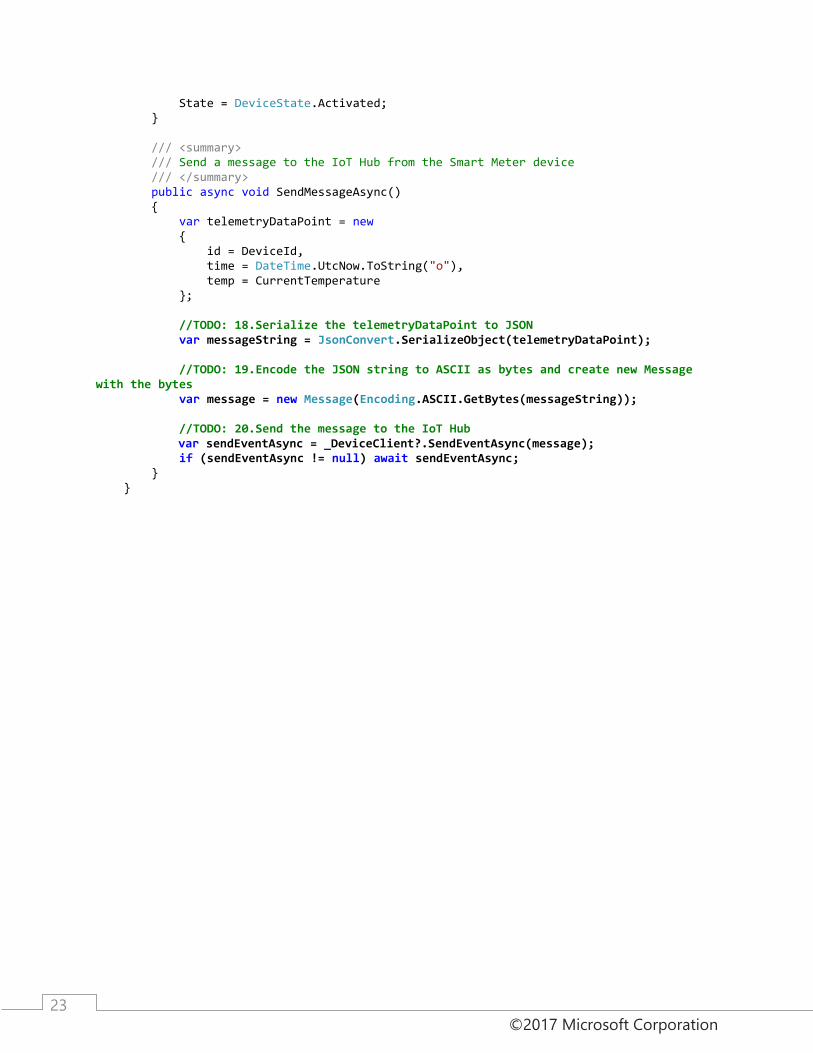
State = DeviceState.Activated; } /// <summary> /// Send a message to the IoT Hub from the Smart Meter device /// </summary> public async void SendMessageAsync() { var telemetryDataPoint = new { id = DeviceId, time = DateTime.UtcNow.ToString("o"), temp = CurrentTemperature }; //TODO: 18.Serialize the telemetryDataPoint to JSON var messageString = JsonConvert.SerializeObject(telemetryDataPoint); //TODO: 19.Encode the JSON string to ASCII as bytes and create new Message with the bytes var message = new Message(Encoding.ASCII.GetBytes(messageString)); //TODO: 20.Send the message to the IoT Hub var sendEventAsync = _DeviceClient?.SendEventAsync(message); if (sendEventAsync != null) await sendEventAsync; } }
©2017 Microsoft Corporation
24
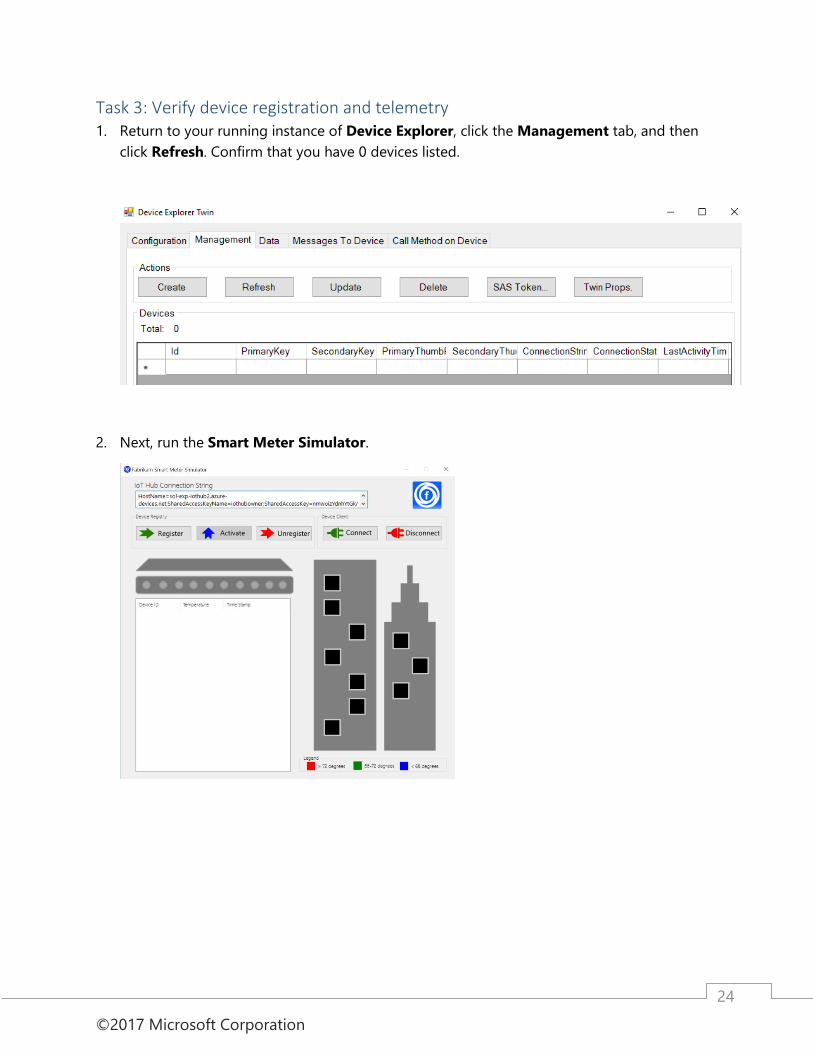
Task 3: Verify device registration and telemetry 1. Return to your running instance of Device Explorer, click the Management tab, and then
click Refresh. Confirm that you have 0 devices listed.
2. Next, run the Smart Meter Simulator.
©2017 Microsoft Corporation
25
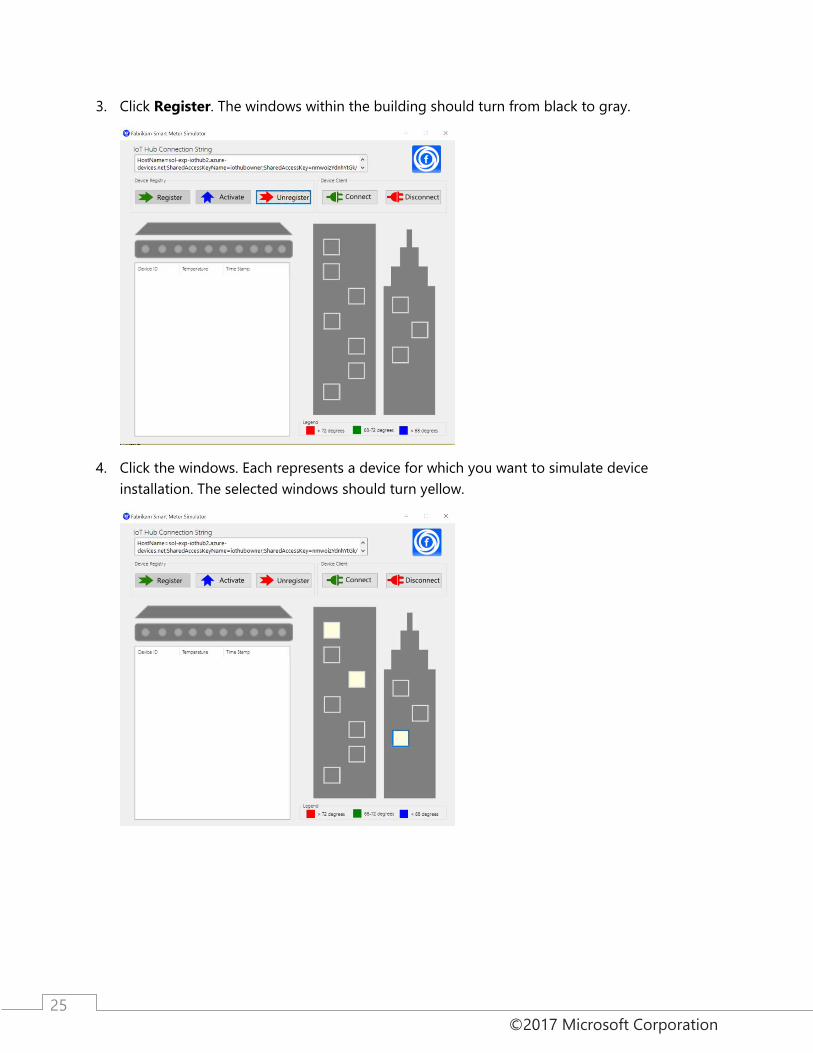
3. Click Register. The windows within the building should turn from black to gray.
4. Click the windows. Each represents a device for which you want to simulate device
installation. The selected windows should turn yellow.
©2017 Microsoft Corporation
26
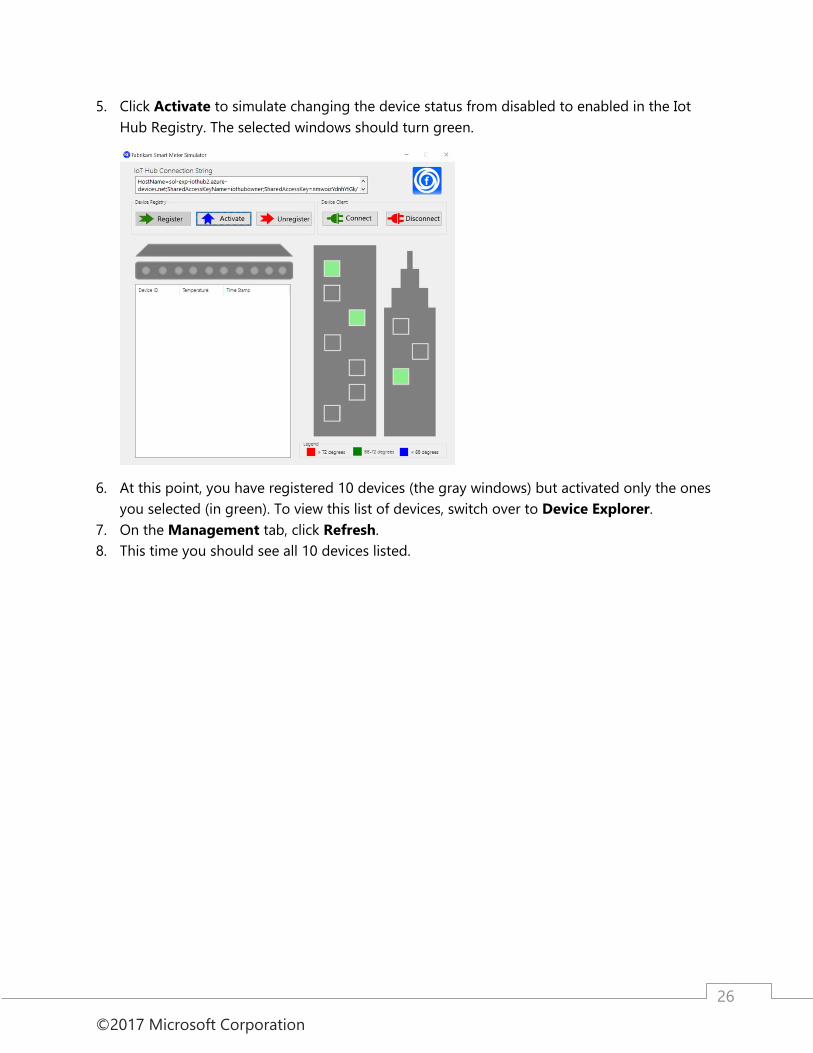
5. Click Activate to simulate changing the device status from disabled to enabled in the Iot
Hub Registry. The selected windows should turn green.
6. At this point, you have registered 10 devices (the gray windows) but activated only the ones
you selected (in green). To view this list of devices, switch over to Device Explorer.
7. On the Management tab, click Refresh.
8. This time you should see all 10 devices listed.
©2017 Microsoft Corporation
27
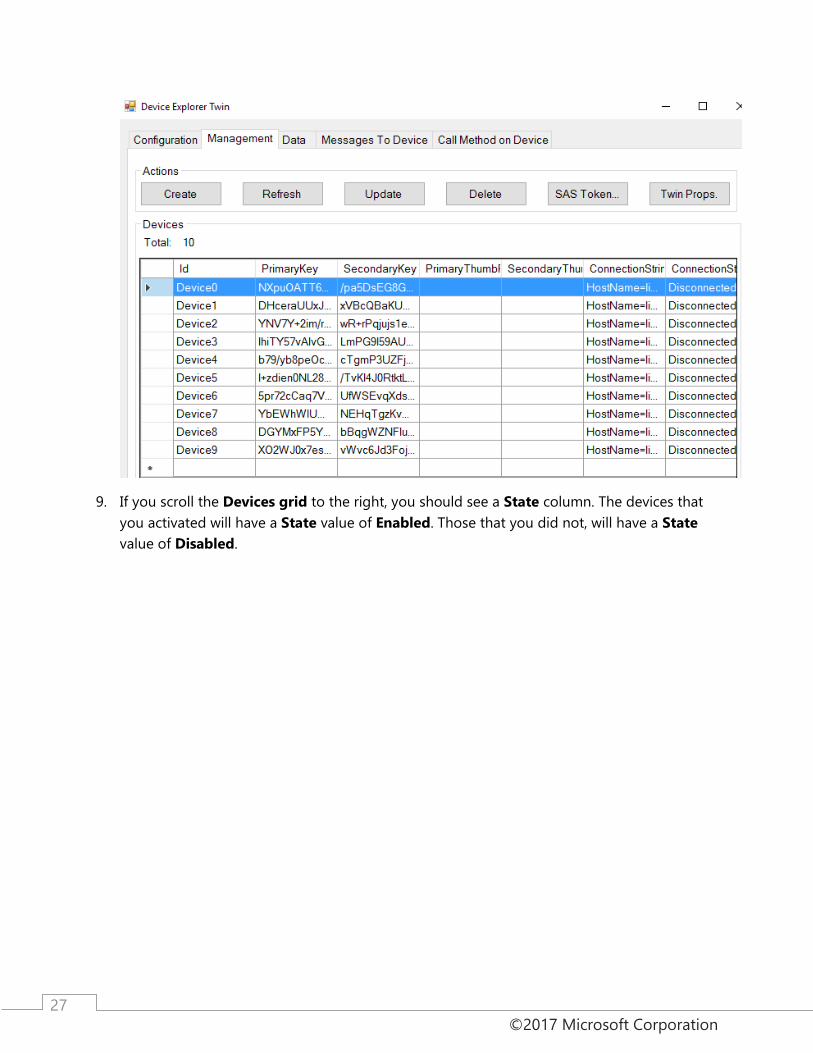
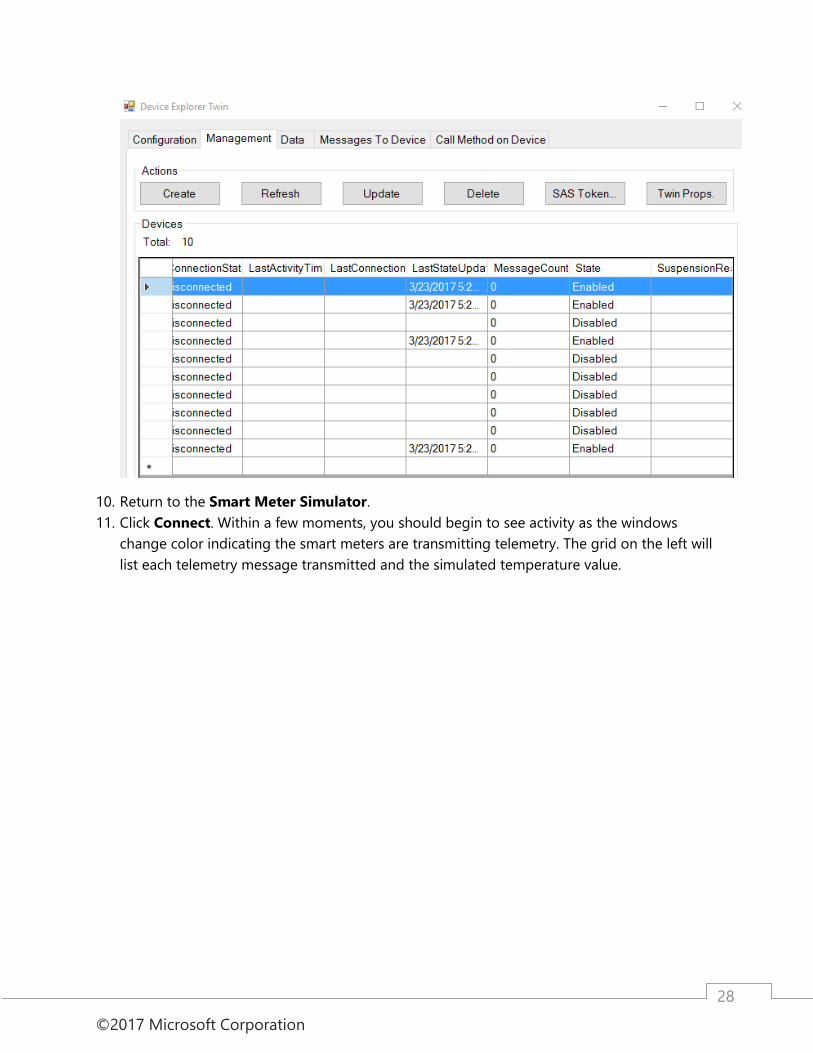
9. If you scroll the Devices grid to the right, you should see a State column. The devices that
you activated will have a State value of Enabled. Those that you did not, will have a State
value of Disabled.
©2017 Microsoft Corporation
28
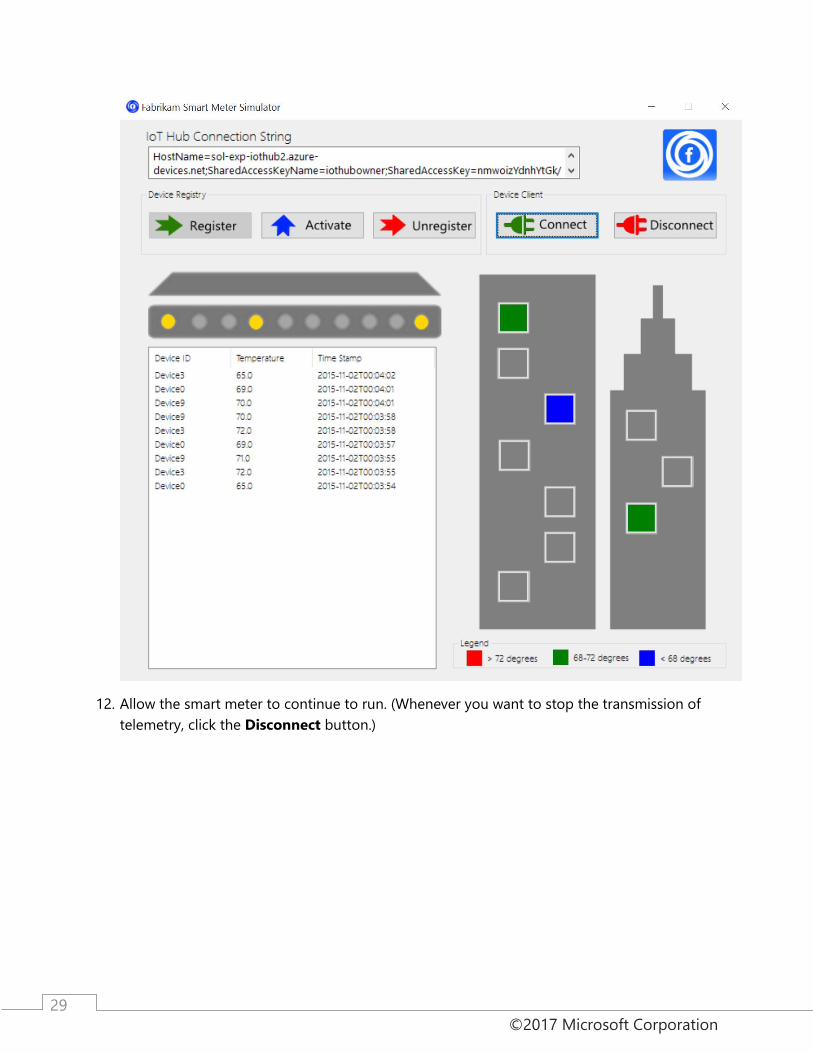
10. Return to the Smart Meter Simulator.
11. Click Connect. Within a few moments, you should begin to see activity as the windows
change color indicating the smart meters are transmitting telemetry. The grid on the left will
list each telemetry message transmitted and the simulated temperature value.
©2017 Microsoft Corporation
29
12. Allow the smart meter to continue to run. (Whenever you want to stop the transmission of
telemetry, click the Disconnect button.)
©2017 Microsoft Corporation
30
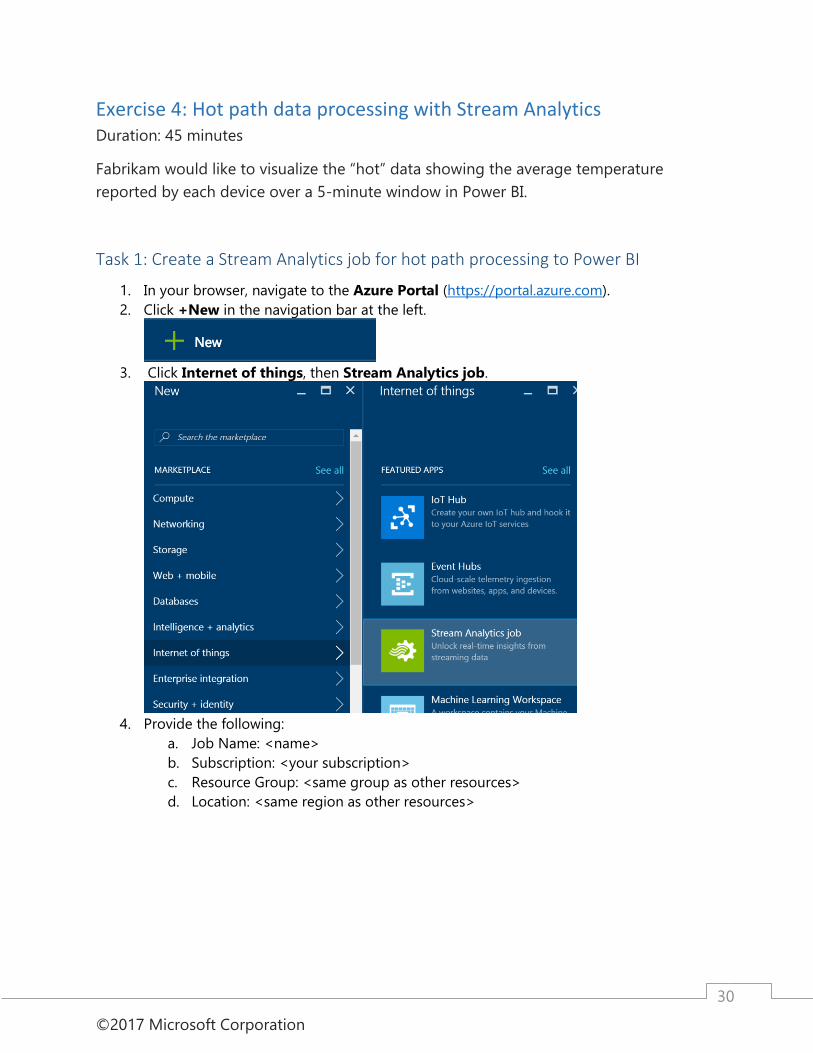
Exercise 4: Hot path data processing with Stream Analytics Duration: 45 minutes
Fabrikam would like to visualize the “hot” data showing the average temperature
reported by each device over a 5-minute window in Power BI.
Task 1: Create a Stream Analytics job for hot path processing to Power BI
1. In your browser, navigate to the Azure Portal (https://portal.azure.com).
2. Click +New in the navigation bar at the left.
3. Click Internet of things, then Stream Analytics job.
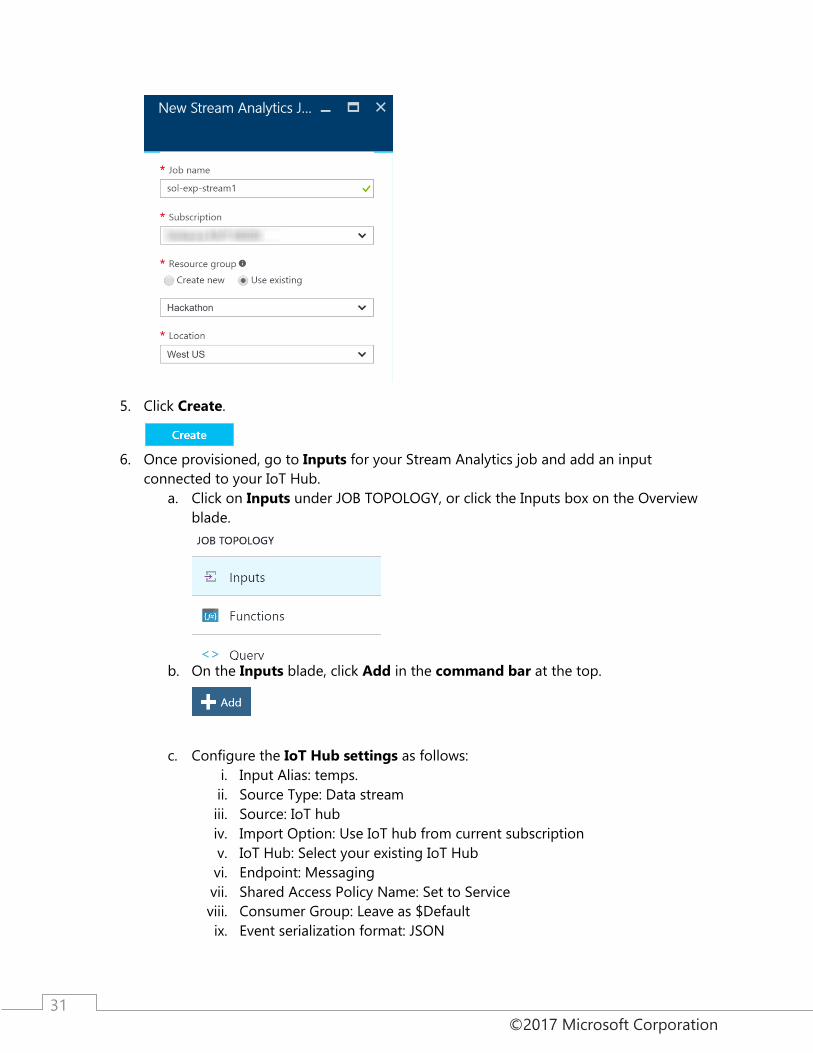
4. Provide the following:
a. Job Name: <name>
b. Subscription: <your subscription>
c. Resource Group: <same group as other resources>
d. Location: <same region as other resources>
©2017 Microsoft Corporation
31
5. Click Create.
6. Once provisioned, go to Inputs for your Stream Analytics job and add an input
connected to your IoT Hub.
a. Click on Inputs under JOB TOPOLOGY, or click the Inputs box on the Overview
blade.
b. On the Inputs blade, click Add in the command bar at the top.
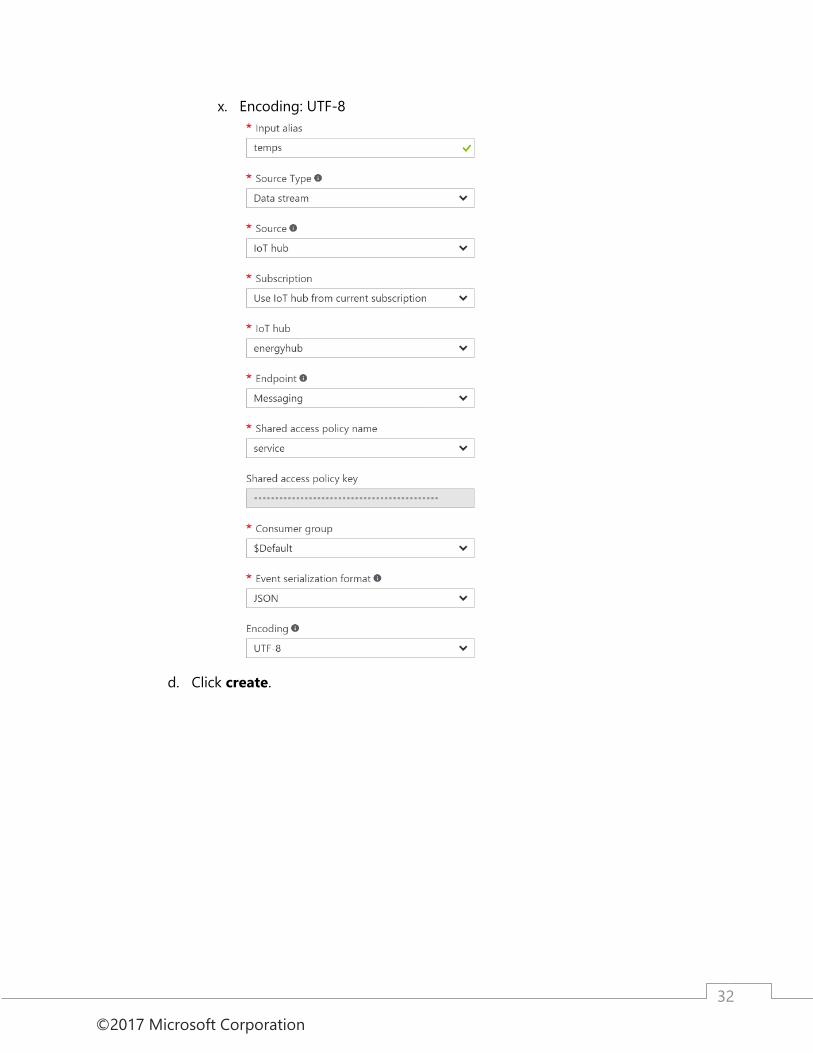
c. Configure the IoT Hub settings as follows:
i. Input Alias: temps.
ii. Source Type: Data stream
iii. Source: IoT hub
iv. Import Option: Use IoT hub from current subscription
v. IoT Hub: Select your existing IoT Hub
vi. Endpoint: Messaging
vii. Shared Access Policy Name: Set to Service
viii. Consumer Group: Leave as $Default
ix. Event serialization format: JSON
©2017 Microsoft Corporation
32
x. Encoding: UTF-8
d. Click create.
©2017 Microsoft Corporation
33
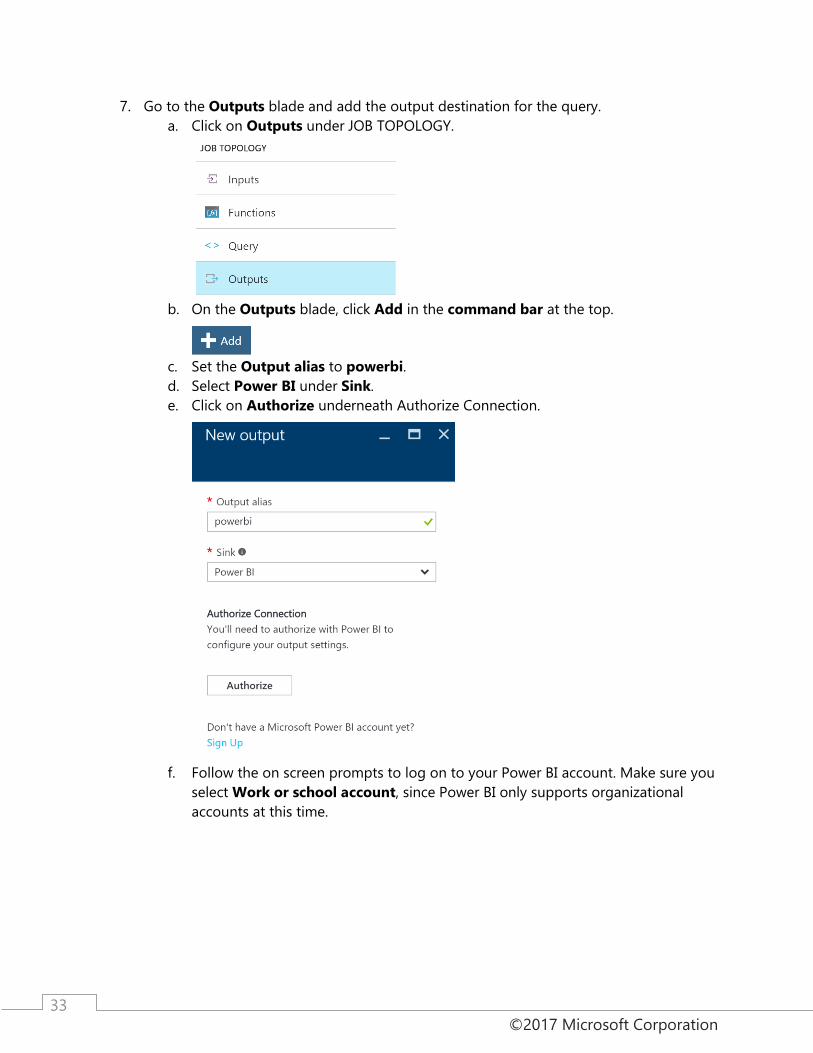
7. Go to the Outputs blade and add the output destination for the query.
a. Click on Outputs under JOB TOPOLOGY.
b. On the Outputs blade, click Add in the command bar at the top.
c. Set the Output alias to powerbi.
d. Select Power BI under Sink.
e. Click on Authorize underneath Authorize Connection.
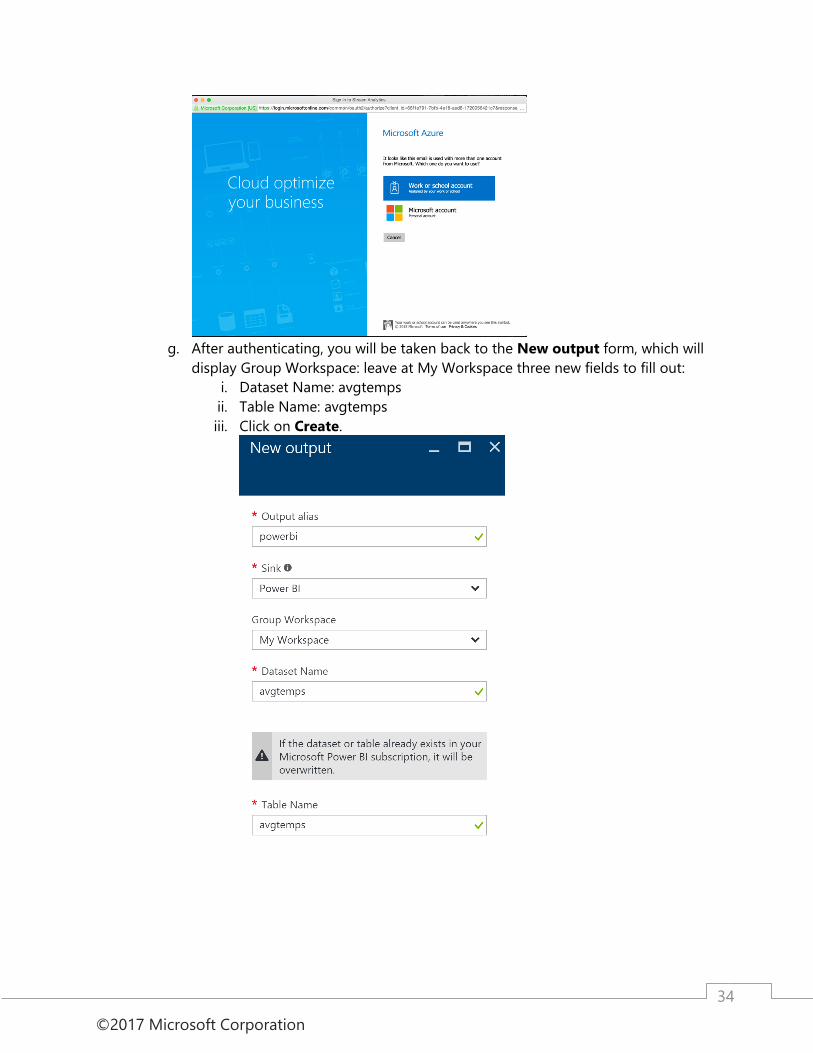
f. Follow the on screen prompts to log on to your Power BI account. Make sure you
select Work or school account, since Power BI only supports organizational
accounts at this time.
©2017 Microsoft Corporation
34
g. After authenticating, you will be taken back to the New output form, which will
display Group Workspace: leave at My Workspace three new fields to fill out:
i. Dataset Name: avgtemps
ii. Table Name: avgtemps
iii. Click on Create.
©2017 Microsoft Corporation
35
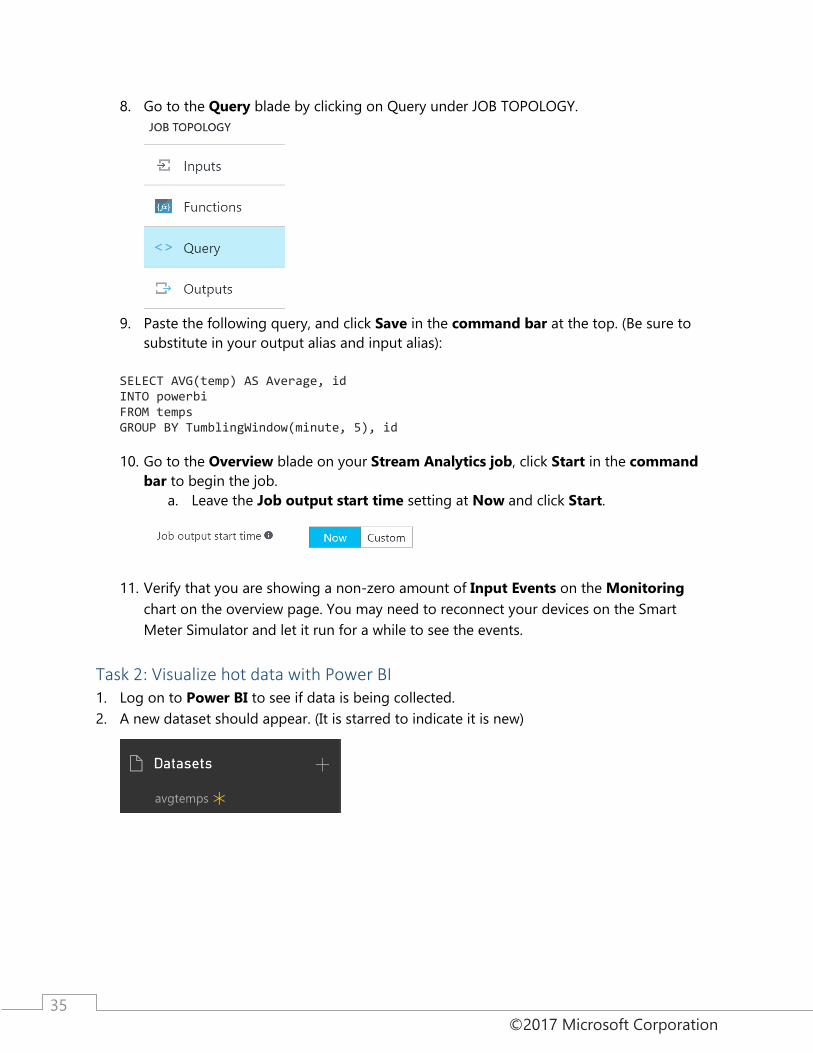
8. Go to the Query blade by clicking on Query under JOB TOPOLOGY.
9. Paste the following query, and click Save in the command bar at the top. (Be sure to
substitute in your output alias and input alias):
SELECT AVG(temp) AS Average, id INTO powerbi FROM temps GROUP BY TumblingWindow(minute, 5), id
10. Go to the Overview blade on your Stream Analytics job, click Start in the command
bar to begin the job.
a. Leave the Job output start time setting at Now and click Start.
11. Verify that you are showing a non-zero amount of Input Events on the Monitoring
chart on the overview page. You may need to reconnect your devices on the Smart
Meter Simulator and let it run for a while to see the events.
Task 2: Visualize hot data with Power BI 1. Log on to Power BI to see if data is being collected.
2. A new dataset should appear. (It is starred to indicate it is new)
©2017 Microsoft Corporation
36
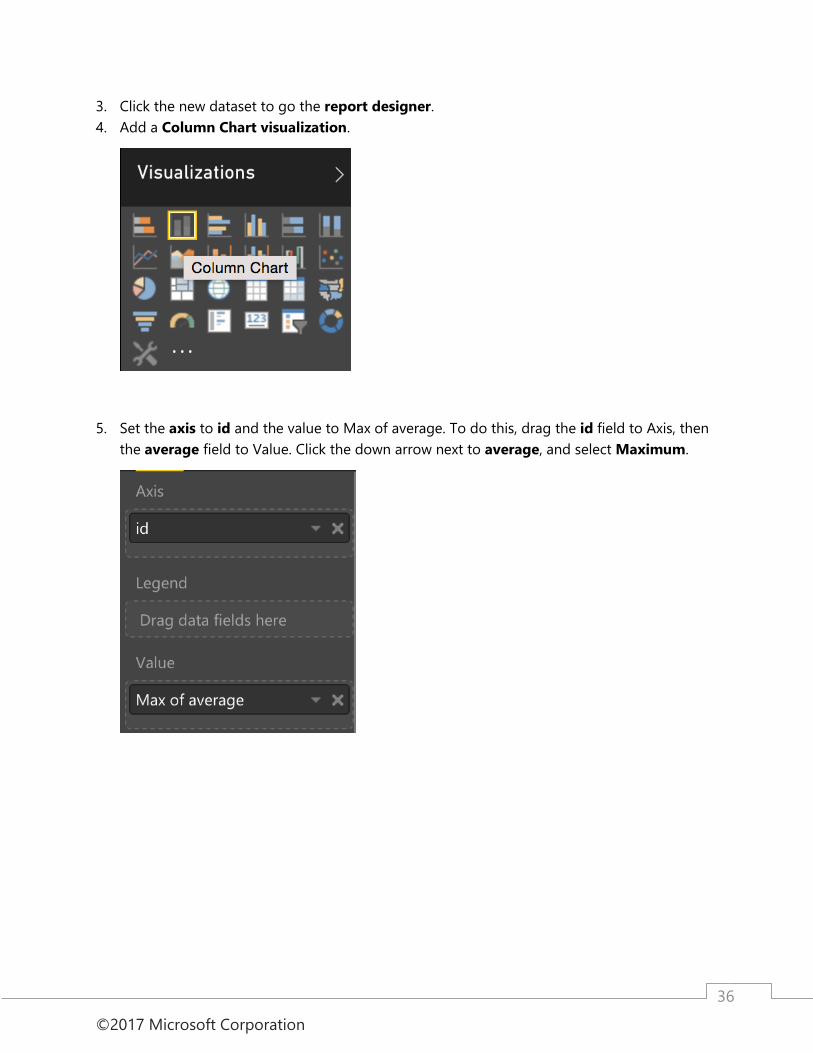
3. Click the new dataset to go the report designer.
4. Add a Column Chart visualization.
5. Set the axis to id and the value to Max of average. To do this, drag the id field to Axis, then
the average field to Value. Click the down arrow next to average, and select Maximum.
©2017 Microsoft Corporation
37
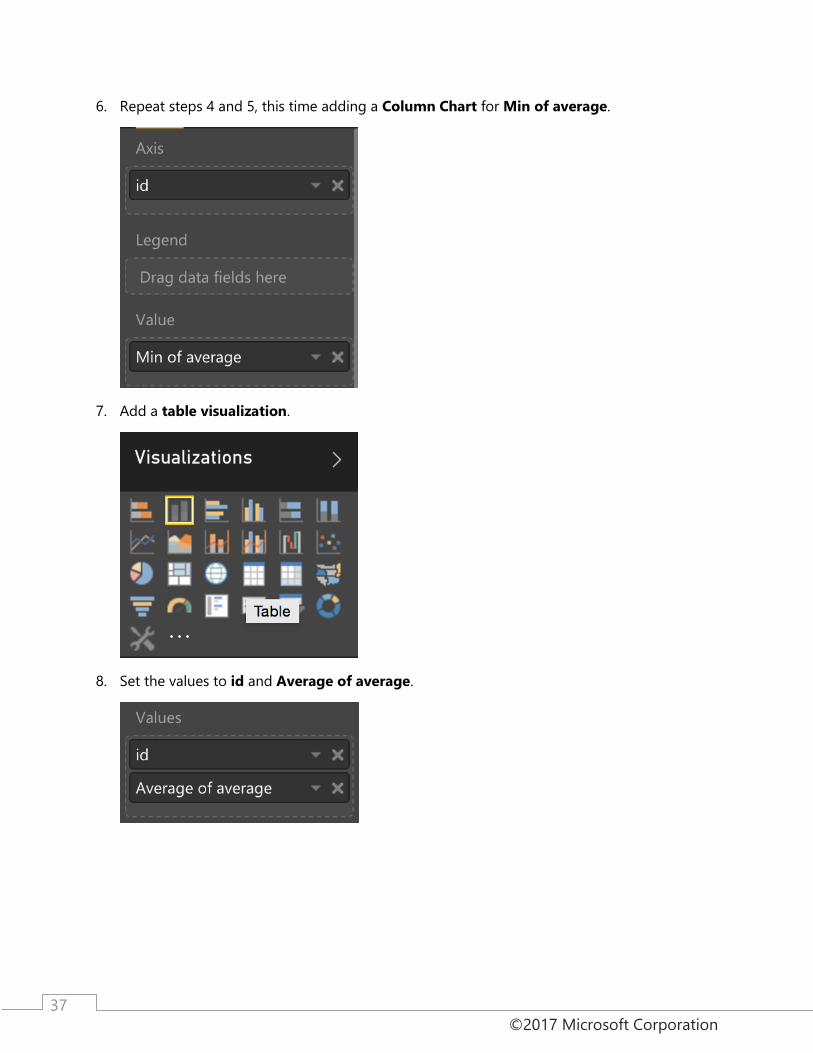
6. Repeat steps 4 and 5, this time adding a Column Chart for Min of average.
7. Add a table visualization.
8. Set the values to id and Average of average.
©2017 Microsoft Corporation
38
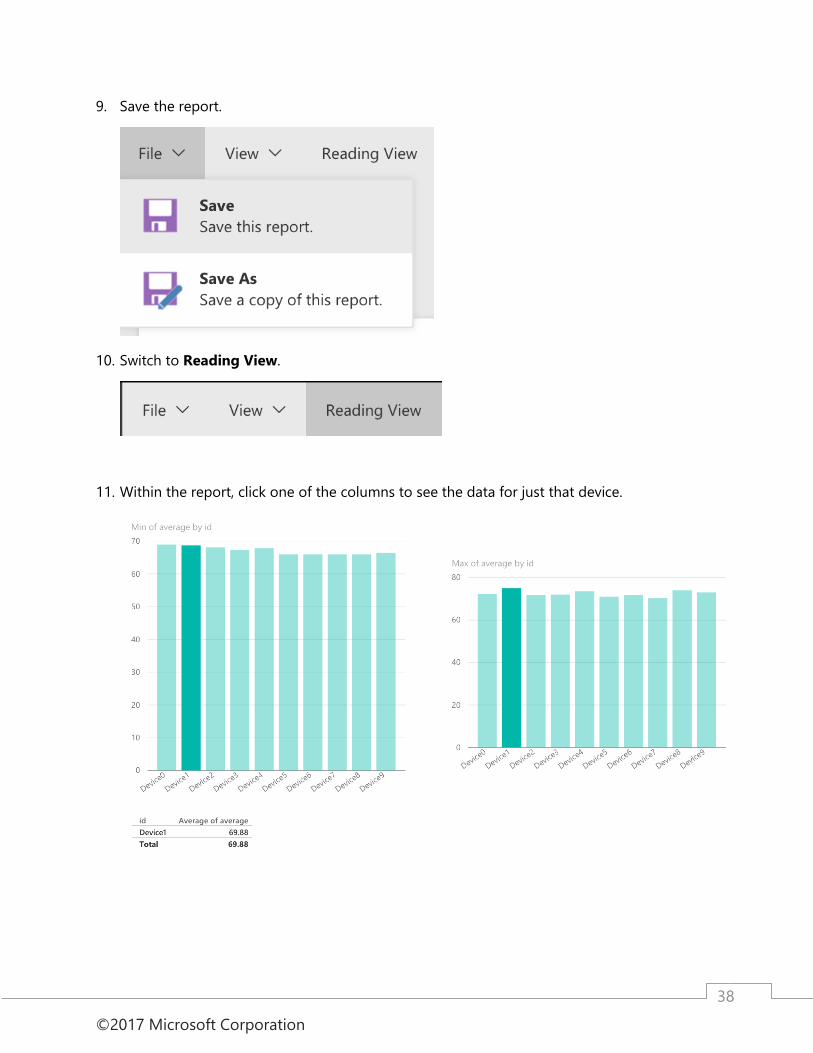
9. Save the report.
10. Switch to Reading View.
11. Within the report, click one of the columns to see the data for just that device.
©2017 Microsoft Corporation
39
Exercise 5: Cold path data processing with HDInsight Spark Duration: 60 minutes
Fabrikam would like to be able to capture all of the “cold” data into scalable storage so
that they can summarize it periodically using a Spark SQL query.
Task 1: Create the Stream Analytics job for cold path processing
In order to capture all metrics for the cold path, set up another Stream Analytics job that
will write all events to Blob storage for analyses by Spark running on HDInsight.
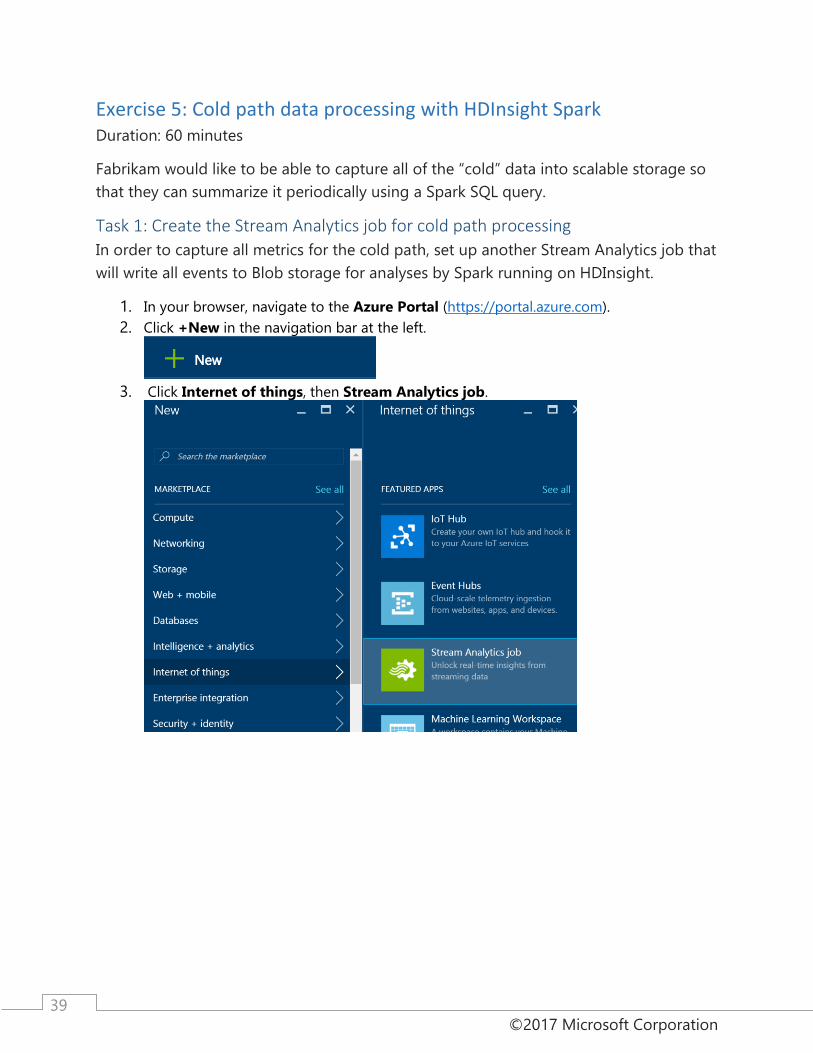
1. In your browser, navigate to the Azure Portal (https://portal.azure.com).
2. Click +New in the navigation bar at the left.
3. Click Internet of things, then Stream Analytics job.
©2017 Microsoft Corporation
40
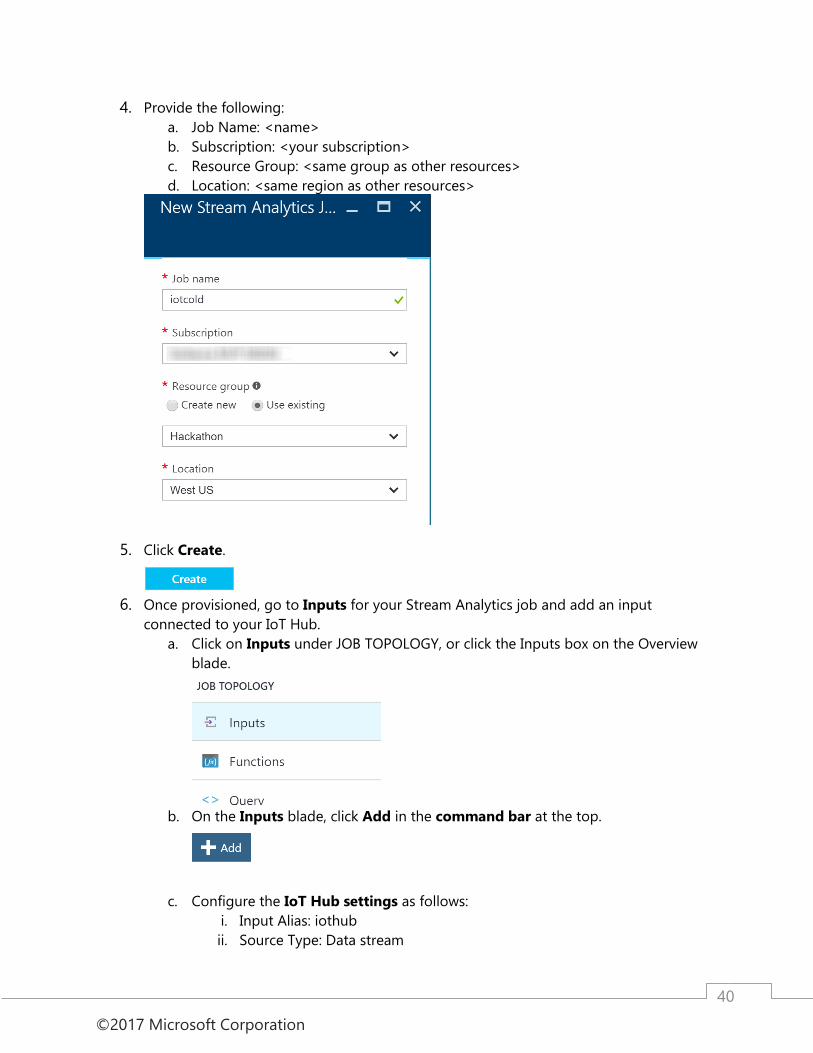
4. Provide the following:
a. Job Name: <name>
b. Subscription: <your subscription>
c. Resource Group: <same group as other resources>
d. Location: <same region as other resources>
5. Click Create.
6. Once provisioned, go to Inputs for your Stream Analytics job and add an input
connected to your IoT Hub.
a. Click on Inputs under JOB TOPOLOGY, or click the Inputs box on the Overview
blade.
b. On the Inputs blade, click Add in the command bar at the top.
c. Configure the IoT Hub settings as follows:
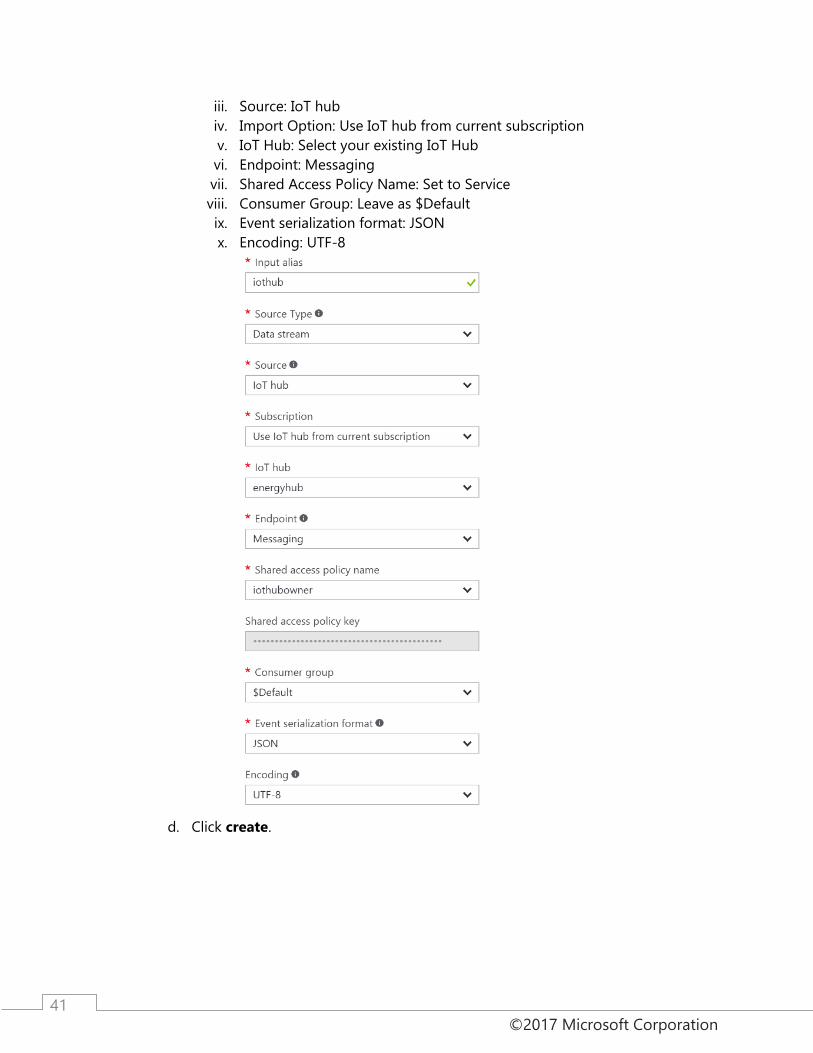
i. Input Alias: iothub
ii. Source Type: Data stream
©2017 Microsoft Corporation
41
iii. Source: IoT hub
iv. Import Option: Use IoT hub from current subscription
v. IoT Hub: Select your existing IoT Hub
vi. Endpoint: Messaging
vii. Shared Access Policy Name: Set to Service
viii. Consumer Group: Leave as $Default
ix. Event serialization format: JSON
x. Encoding: UTF-8
d. Click create.
©2017 Microsoft Corporation
42
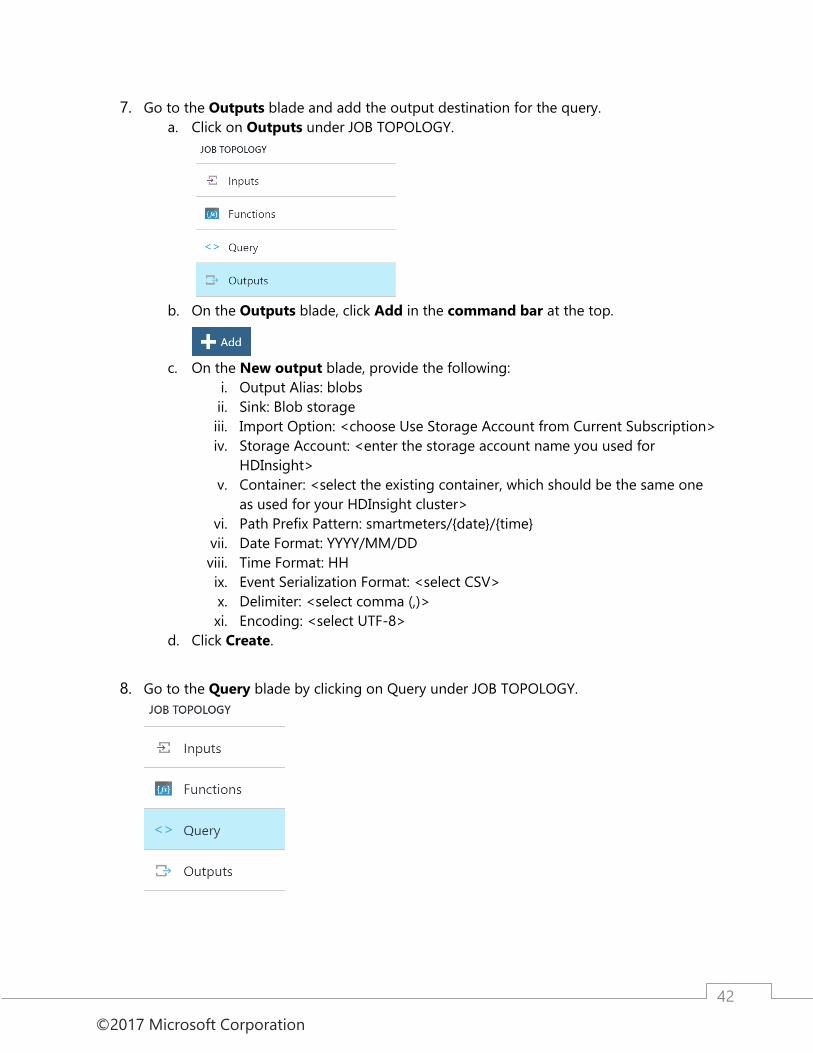
7. Go to the Outputs blade and add the output destination for the query.
a. Click on Outputs under JOB TOPOLOGY.
b. On the Outputs blade, click Add in the command bar at the top.
c. On the New output blade, provide the following:
i. Output Alias: blobs
ii. Sink: Blob storage
iii. Import Option: <choose Use Storage Account from Current Subscription>
iv. Storage Account: <enter the storage account name you used for
HDInsight>
v. Container: <select the existing container, which should be the same one
as used for your HDInsight cluster>
vi. Path Prefix Pattern: smartmeters/{date}/{time}
vii. Date Format: YYYY/MM/DD
viii. Time Format: HH
ix. Event Serialization Format: <select CSV>
x. Delimiter: <select comma (,)>
xi. Encoding: <select UTF-8>
d. Click Create.
8. Go to the Query blade by clicking on Query under JOB TOPOLOGY.
©2017 Microsoft Corporation
43
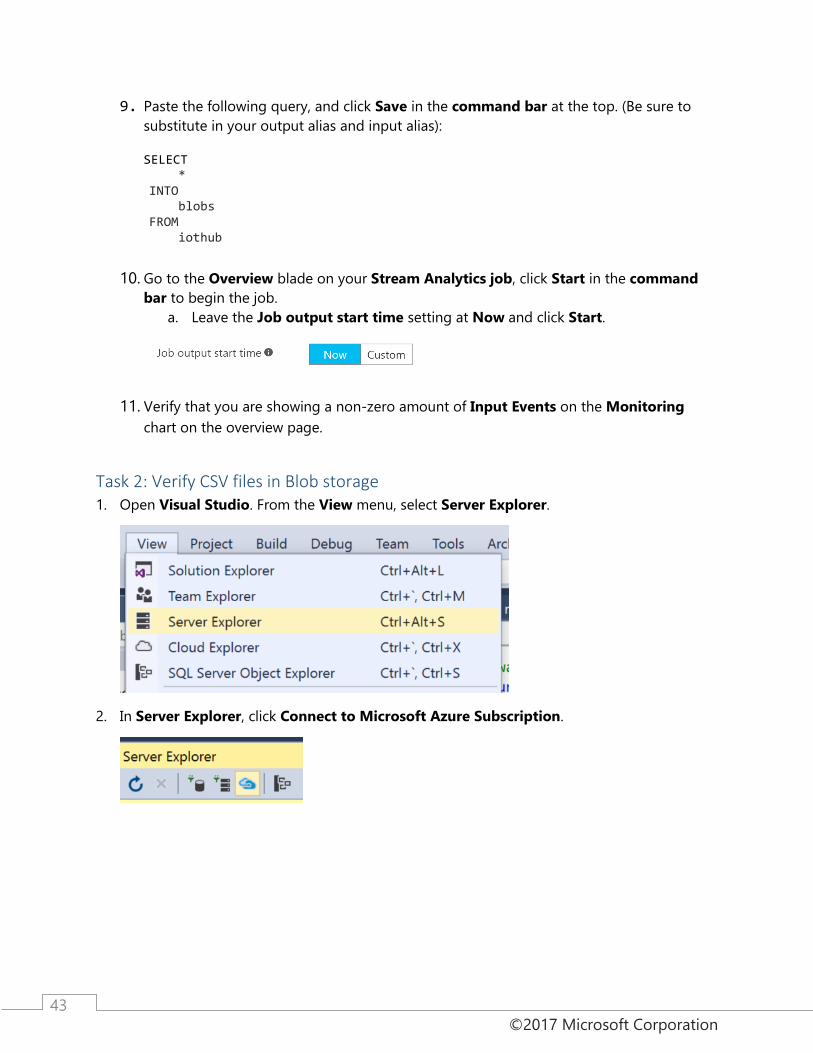
9. Paste the following query, and click Save in the command bar at the top. (Be sure to
substitute in your output alias and input alias): SELECT
* INTO blobs FROM iothub
10. Go to the Overview blade on your Stream Analytics job, click Start in the command
bar to begin the job.
a. Leave the Job output start time setting at Now and click Start.
11. Verify that you are showing a non-zero amount of Input Events on the Monitoring
chart on the overview page.
Task 2: Verify CSV files in Blob storage 1. Open Visual Studio. From the View menu, select Server Explorer.
2. In Server Explorer, click Connect to Microsoft Azure Subscription.
©2017 Microsoft Corporation
44
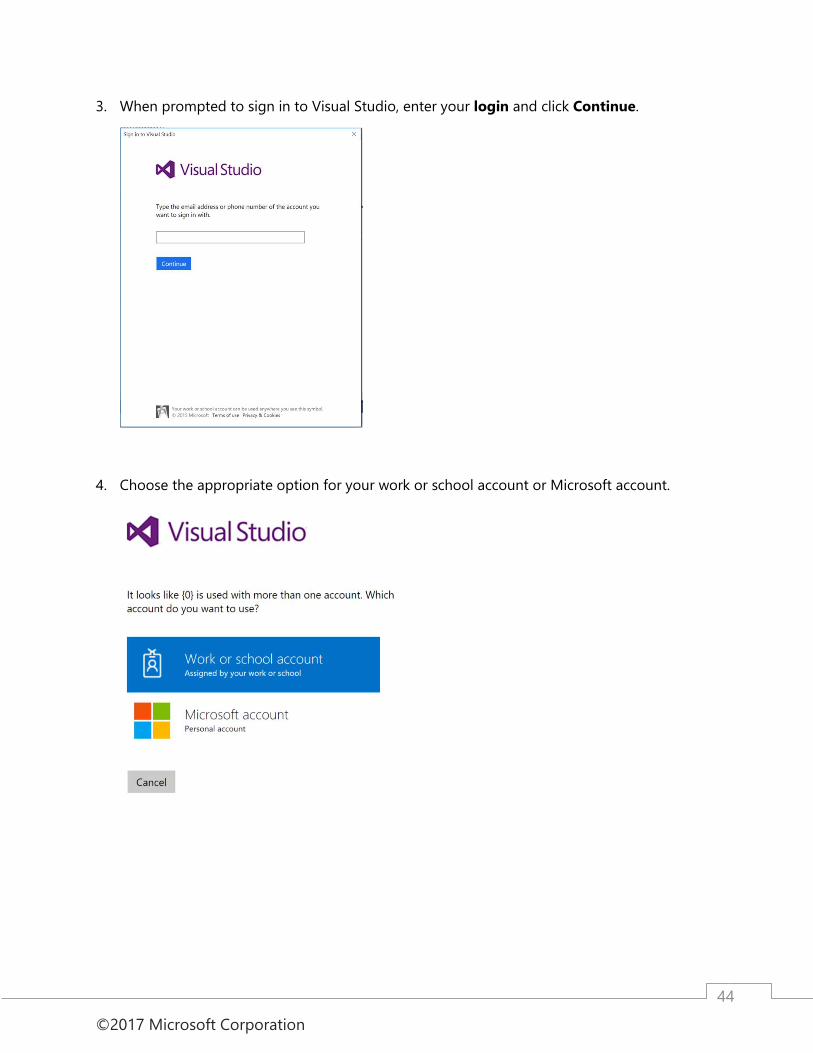
3. When prompted to sign in to Visual Studio, enter your login and click Continue.
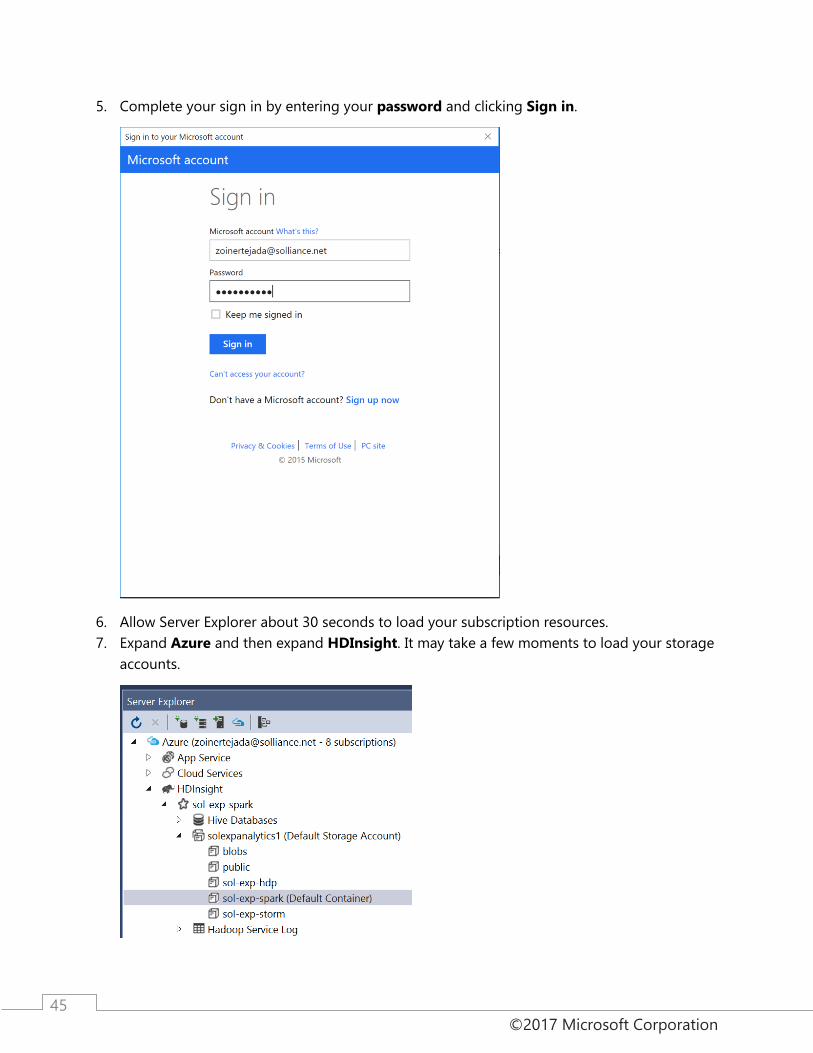
4. Choose the appropriate option for your work or school account or Microsoft account.
©2017 Microsoft Corporation
45
5. Complete your sign in by entering your password and clicking Sign in.
6. Allow Server Explorer about 30 seconds to load your subscription resources.
7. Expand Azure and then expand HDInsight. It may take a few moments to load your storage
accounts.

©2017 Microsoft Corporation
46
8. Expand the Default Storage Account used for your HDInsight cluster, and right-click the
container named after your HDInsight cluster. Select View Container.
9. Verify files are being written to Blob storage and take note of the path to one of the files
(the files should be located underneath the smartmeters folder).
Task 3: Process with Spark SQL 1. Navigate to the blade for your Spark Cluster in the Portal.
2. Under Quick Links, click Cluster Dashboards.
©2017 Microsoft Corporation
47
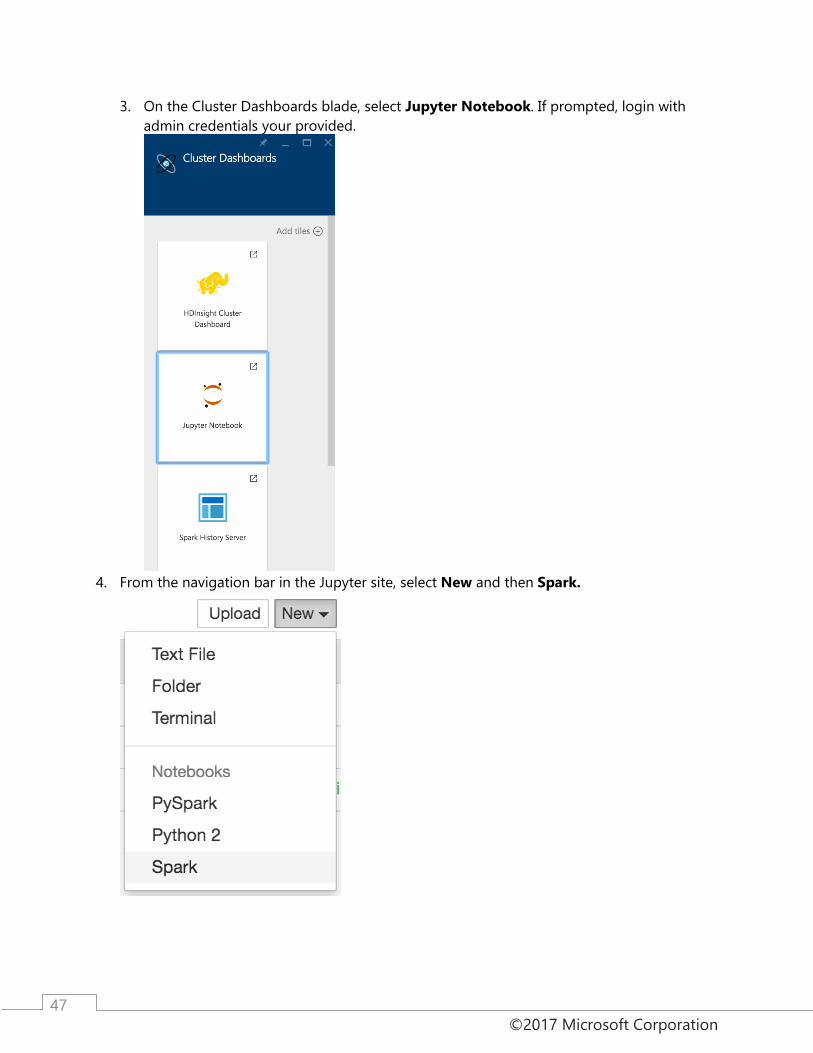
3. On the Cluster Dashboards blade, select Jupyter Notebook. If prompted, login with
admin credentials your provided.
4. From the navigation bar in the Jupyter site, select New and then Spark.
©2017 Microsoft Corporation
48
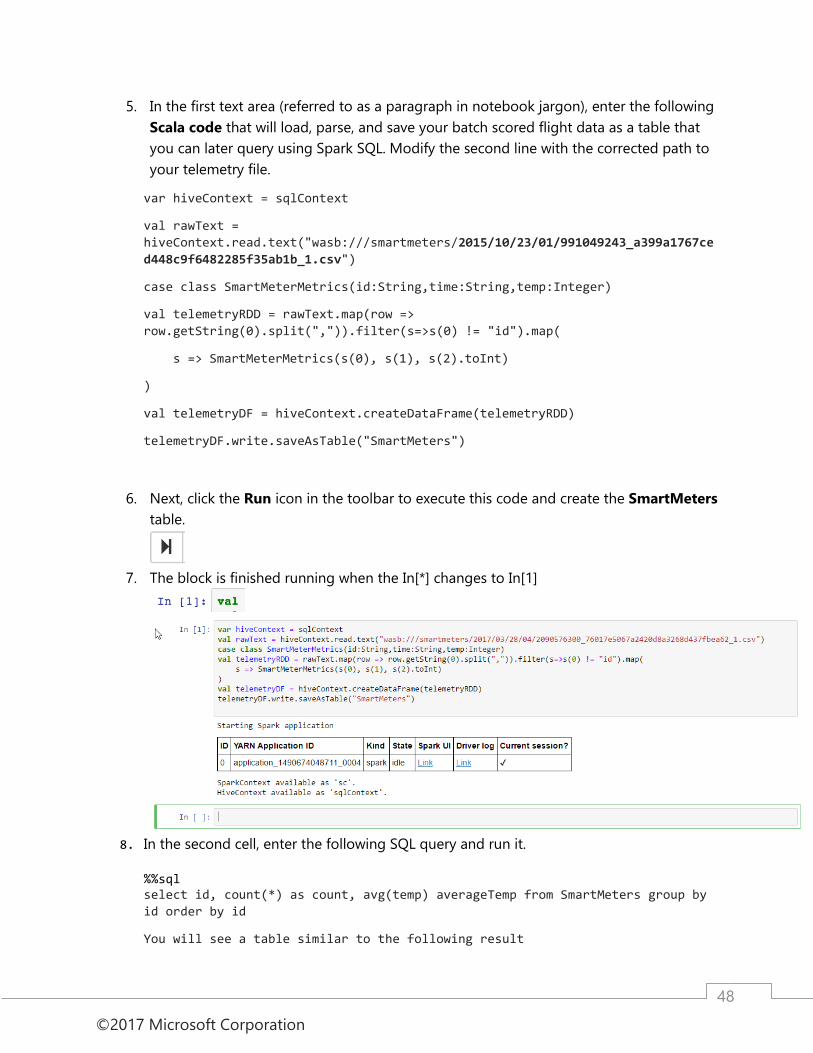
5. In the first text area (referred to as a paragraph in notebook jargon), enter the following
Scala code that will load, parse, and save your batch scored flight data as a table that
you can later query using Spark SQL. Modify the second line with the corrected path to
your telemetry file.
var hiveContext = sqlContext
val rawText =
hiveContext.read.text("wasb:///smartmeters/2015/10/23/01/991049243_a399a1767ce
d448c9f6482285f35ab1b_1.csv")
case class SmartMeterMetrics(id:String,time:String,temp:Integer)
val telemetryRDD = rawText.map(row =>
row.getString(0).split(",")).filter(s=>s(0) != "id").map(
s => SmartMeterMetrics(s(0), s(1), s(2).toInt)
)
val telemetryDF = hiveContext.createDataFrame(telemetryRDD)
telemetryDF.write.saveAsTable("SmartMeters")
6. Next, click the Run icon in the toolbar to execute this code and create the SmartMeters
table.
7. The block is finished running when the In[*] changes to In[1]
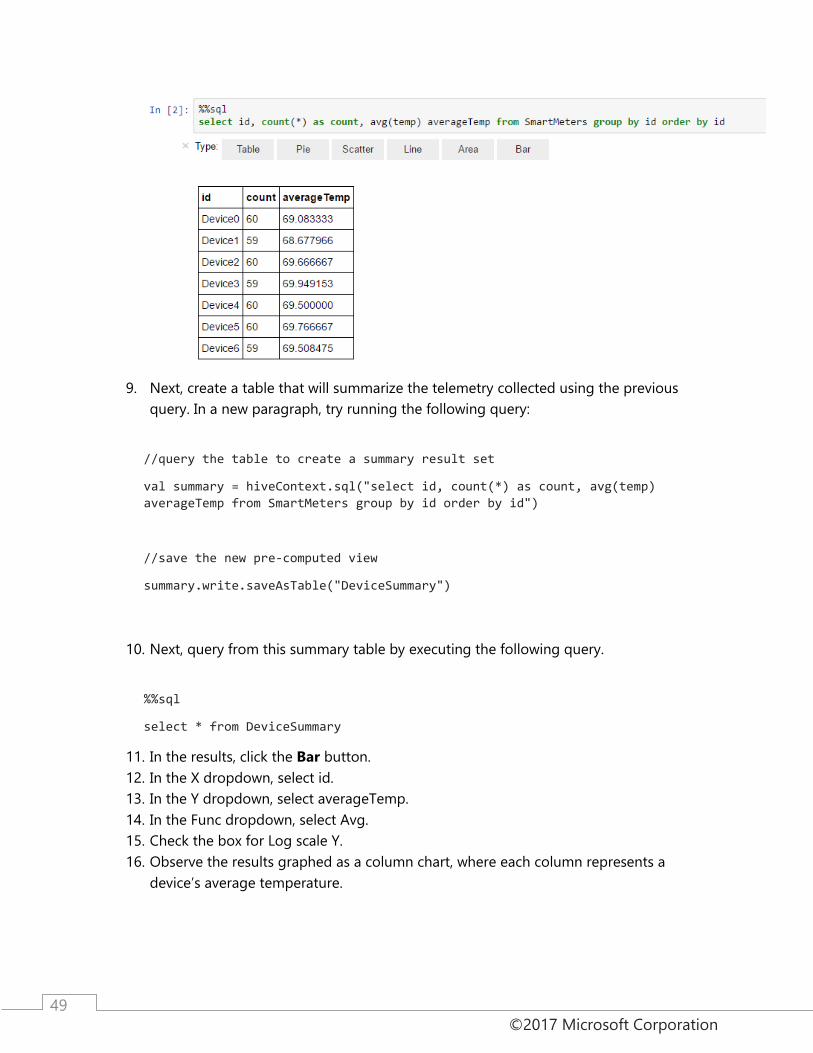
8. In the second cell, enter the following SQL query and run it.
%%sql select id, count(*) as count, avg(temp) averageTemp from SmartMeters group by
id order by id
You will see a table similar to the following result
©2017 Microsoft Corporation
49
9. Next, create a table that will summarize the telemetry collected using the previous
query. In a new paragraph, try running the following query:
//query the table to create a summary result set
val summary = hiveContext.sql("select id, count(*) as count, avg(temp)
averageTemp from SmartMeters group by id order by id")
//save the new pre-computed view
summary.write.saveAsTable("DeviceSummary")
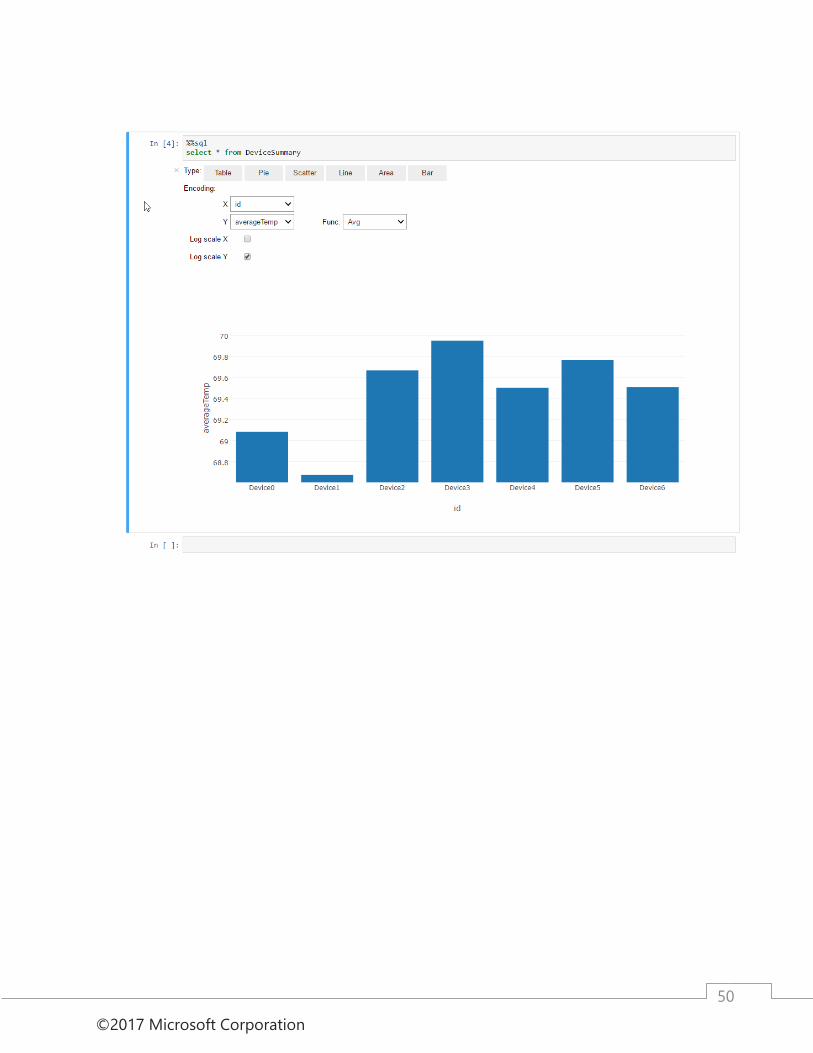
10. Next, query from this summary table by executing the following query.
%%sql
select * from DeviceSummary
11. In the results, click the Bar button.
12. In the X dropdown, select id.
13. In the Y dropdown, select averageTemp.
14. In the Func dropdown, select Avg.
15. Check the box for Log scale Y.
16. Observe the results graphed as a column chart, where each column represents a
device’s average temperature.
©2017 Microsoft Corporation
50
©2017 Microsoft Corporation
51
Exercise 6: Reporting device outages with IoT Hub Operations
Monitoring Duration: 20 minutes
Synopsis: Fabrikam would like to be alerted when devices disconnect, but fail to
reconnect after a period. Since they are already using PowerBI to visualize hot data, they
would like to see a list of any of these devices in a report.
Task 1: Enable verbose connection monitoring on the IoT Hub
To keep track of device connects and disconnects, we first need to enable verbose
connection monitoring.
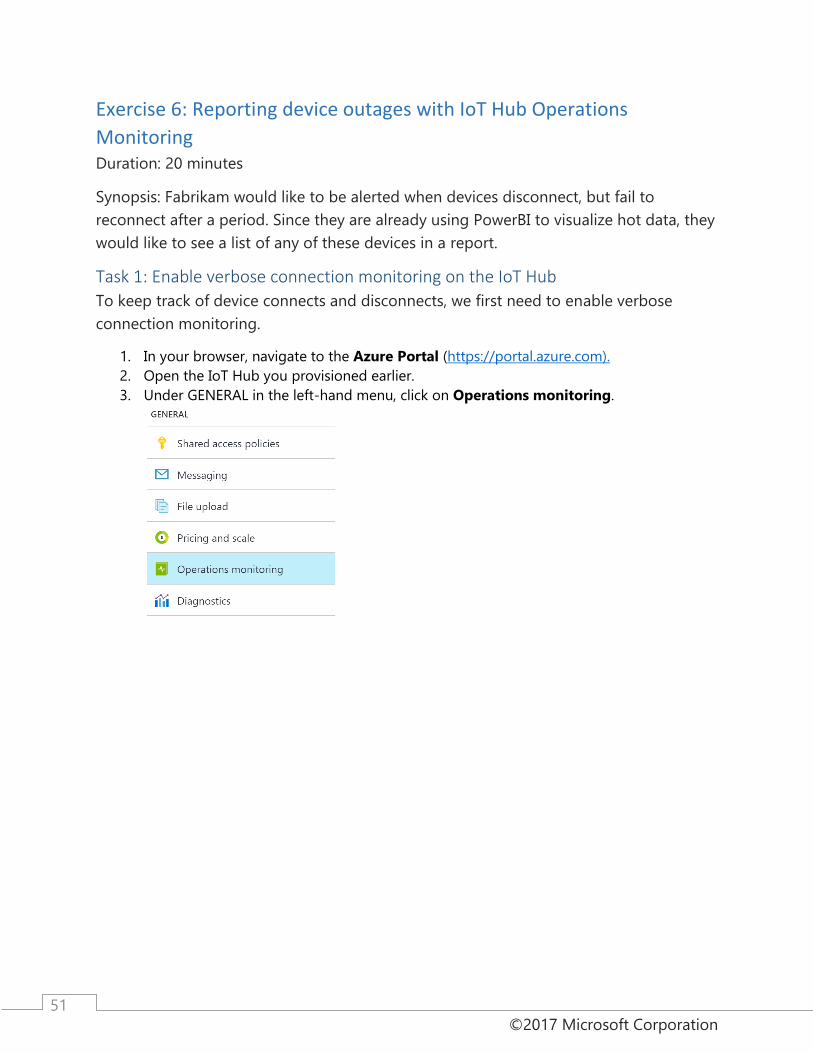
1. In your browser, navigate to the Azure Portal (https://portal.azure.com).
2. Open the IoT Hub you provisioned earlier.
3. Under GENERAL in the left-hand menu, click on Operations monitoring.
©2017 Microsoft Corporation
52
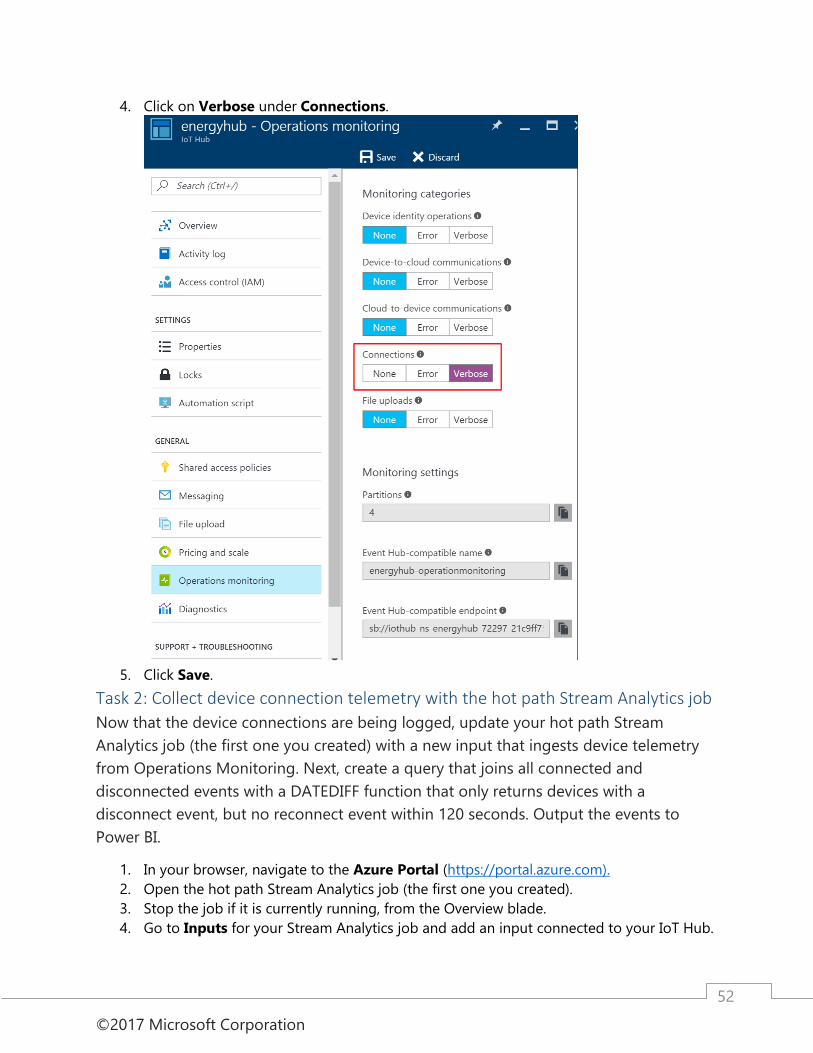
4. Click on Verbose under Connections.
5. Click Save.
Task 2: Collect device connection telemetry with the hot path Stream Analytics job
Now that the device connections are being logged, update your hot path Stream
Analytics job (the first one you created) with a new input that ingests device telemetry
from Operations Monitoring. Next, create a query that joins all connected and
disconnected events with a DATEDIFF function that only returns devices with a
disconnect event, but no reconnect event within 120 seconds. Output the events to
Power BI.
1. In your browser, navigate to the Azure Portal (https://portal.azure.com).
2. Open the hot path Stream Analytics job (the first one you created).
3. Stop the job if it is currently running, from the Overview blade.
4. Go to Inputs for your Stream Analytics job and add an input connected to your IoT Hub.
©2017 Microsoft Corporation
53
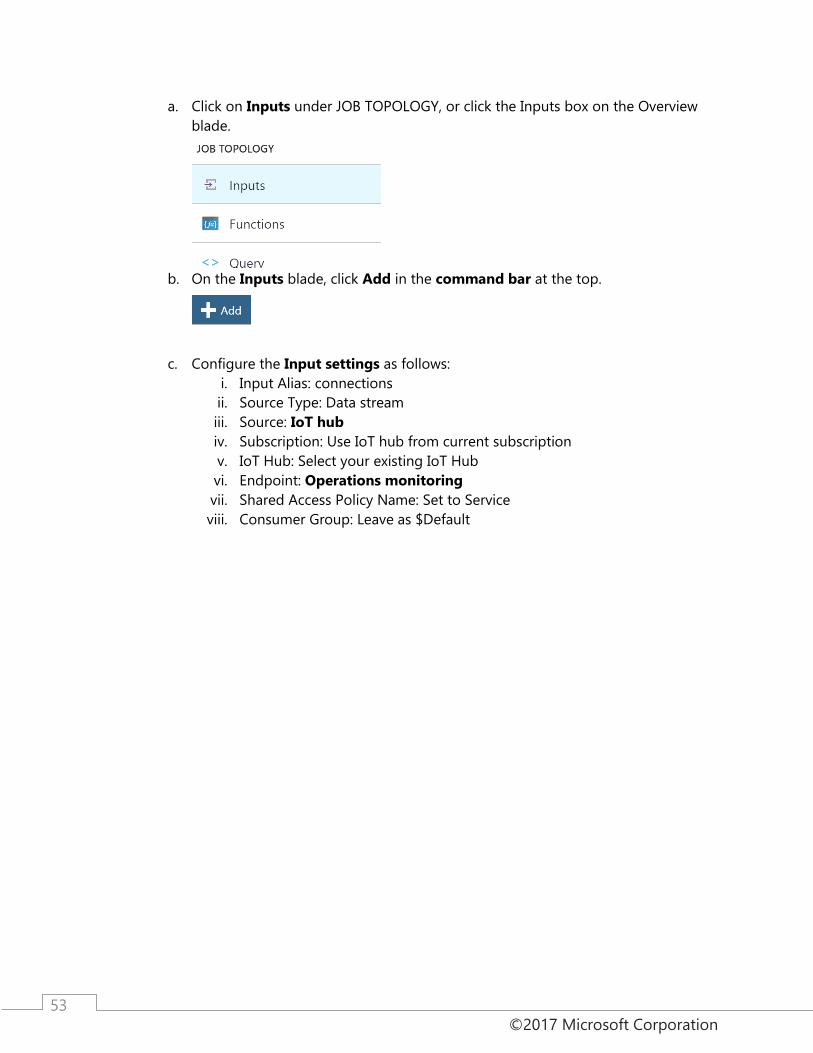
a. Click on Inputs under JOB TOPOLOGY, or click the Inputs box on the Overview
blade.
b. On the Inputs blade, click Add in the command bar at the top.
c. Configure the Input settings as follows:
i. Input Alias: connections
ii. Source Type: Data stream
iii. Source: IoT hub
iv. Subscription: Use IoT hub from current subscription
v. IoT Hub: Select your existing IoT Hub
vi. Endpoint: Operations monitoring
vii. Shared Access Policy Name: Set to Service
viii. Consumer Group: Leave as $Default
©2017 Microsoft Corporation
54
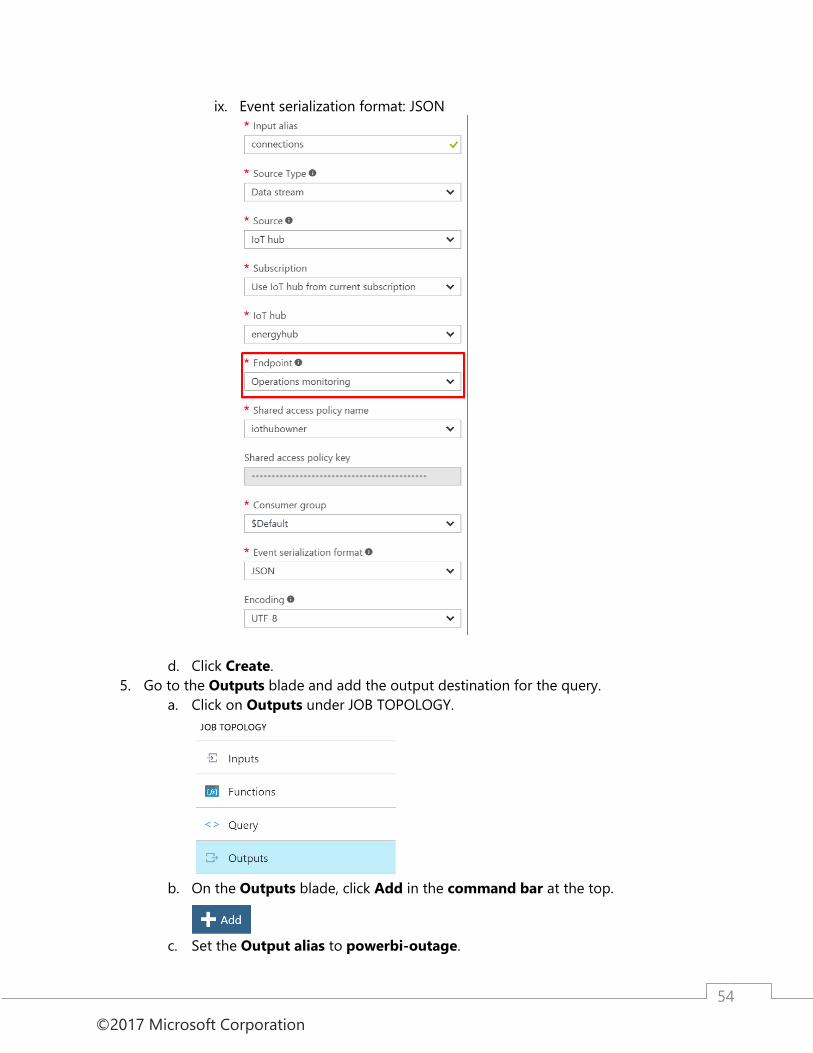
ix. Event serialization format: JSON
d. Click Create.
5. Go to the Outputs blade and add the output destination for the query.
a. Click on Outputs under JOB TOPOLOGY.
b. On the Outputs blade, click Add in the command bar at the top.
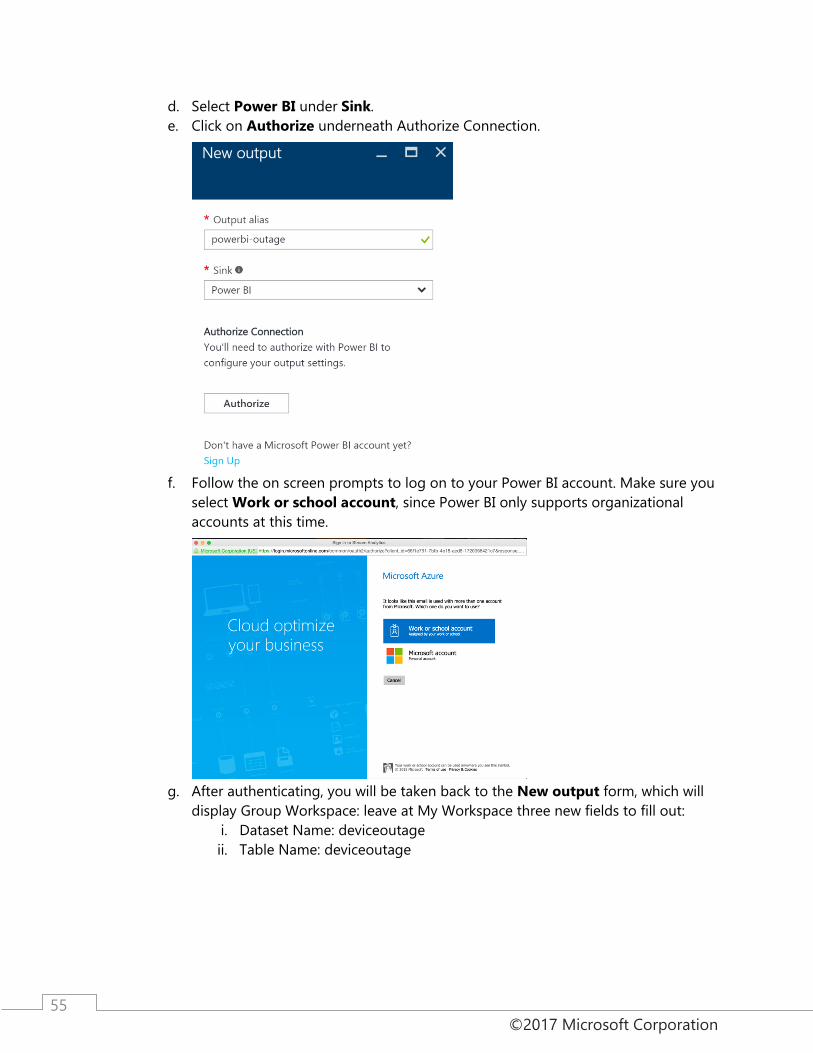
c. Set the Output alias to powerbi-outage.
©2017 Microsoft Corporation
55
d. Select Power BI under Sink.
e. Click on Authorize underneath Authorize Connection.
f. Follow the on screen prompts to log on to your Power BI account. Make sure you
select Work or school account, since Power BI only supports organizational
accounts at this time.
g. After authenticating, you will be taken back to the New output form, which will
display Group Workspace: leave at My Workspace three new fields to fill out:
i. Dataset Name: deviceoutage
ii. Table Name: deviceoutage

©2017 Microsoft Corporation
56
iii. Click on Create.
6. Go to the Query blade by clicking on Query under JOB TOPOLOGY.
7. We will replace the hot path query, which selects the averages of the temperatures into
the PowerBI output, with queries that perform the following:
a. Select device disconnection events.
b. Select device connection events.
c. Join these two streams together using the Stream Analytics DATEDIFF operation
on the LEFT JOIN, and then filter out any records where there was a match. This
gives us devices that had a disconnect event, but no corresponding connect
event within 120 seconds. Output to the Service Bus.
d. Execute the original hot path query.
©2017 Microsoft Corporation
57
8. Replace the existing query with the following, and click Save in the command bar at the
top. (Be sure to substitute in your output aliases and input aliases):
WITH Disconnected AS ( SELECT * FROM connections TIMESTAMP BY [Time] WHERE OperationName = 'deviceDisconnect' AND Category = 'Connections' ), Connected AS ( SELECT * FROM connections TIMESTAMP BY [Time] WHERE OperationName = 'deviceConnect' AND Category = 'Connections' ) SELECT Disconnected.DeviceId, Disconnected.Time INTO [powerbi-outage] FROM Disconnected LEFT JOIN Connected ON DATEDIFF(second, Disconnected, Connected) BETWEEN 0 AND 120 AND Connected.deviceId = Disconnected.deviceId WHERE Connected.DeviceId IS NULL; SELECT AVG(temp) AS Average, id INTO powerbi FROM temps GROUP BY TumblingWindow(minute, 5), id;
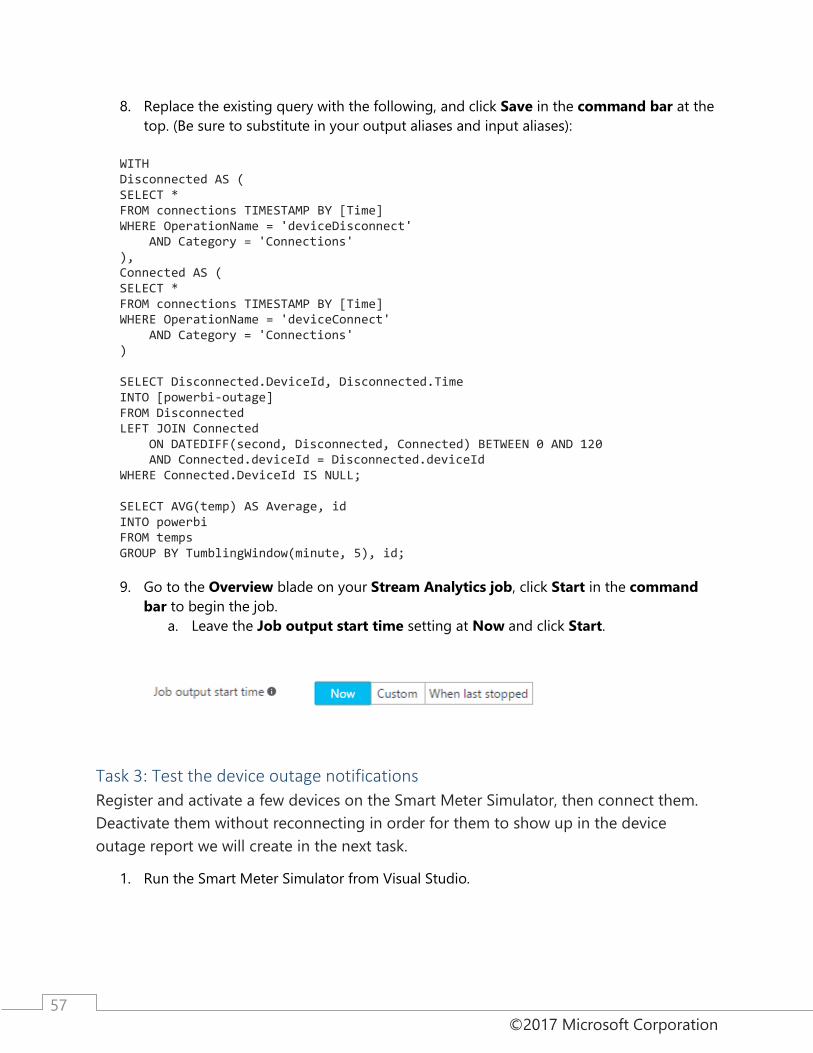
9. Go to the Overview blade on your Stream Analytics job, click Start in the command
bar to begin the job.
a. Leave the Job output start time setting at Now and click Start.
Task 3: Test the device outage notifications
Register and activate a few devices on the Smart Meter Simulator, then connect them.
Deactivate them without reconnecting in order for them to show up in the device
outage report we will create in the next task.
1. Run the Smart Meter Simulator from Visual Studio.

©2017 Microsoft Corporation
58
2. Click the Register button.
3. Click on 3 of the windows to highlight them.
4. Click the Activate button.
5. Click the Connect button.
6. After a few seconds, click Disconnect.
7. Click Unregister.
8. It may take up to 10 minutes, but you should receive 3 emails that contain the
corresponding Device Id and date/time stamps of when the device was disconnected,
one for each device.
©2017 Microsoft Corporation
59
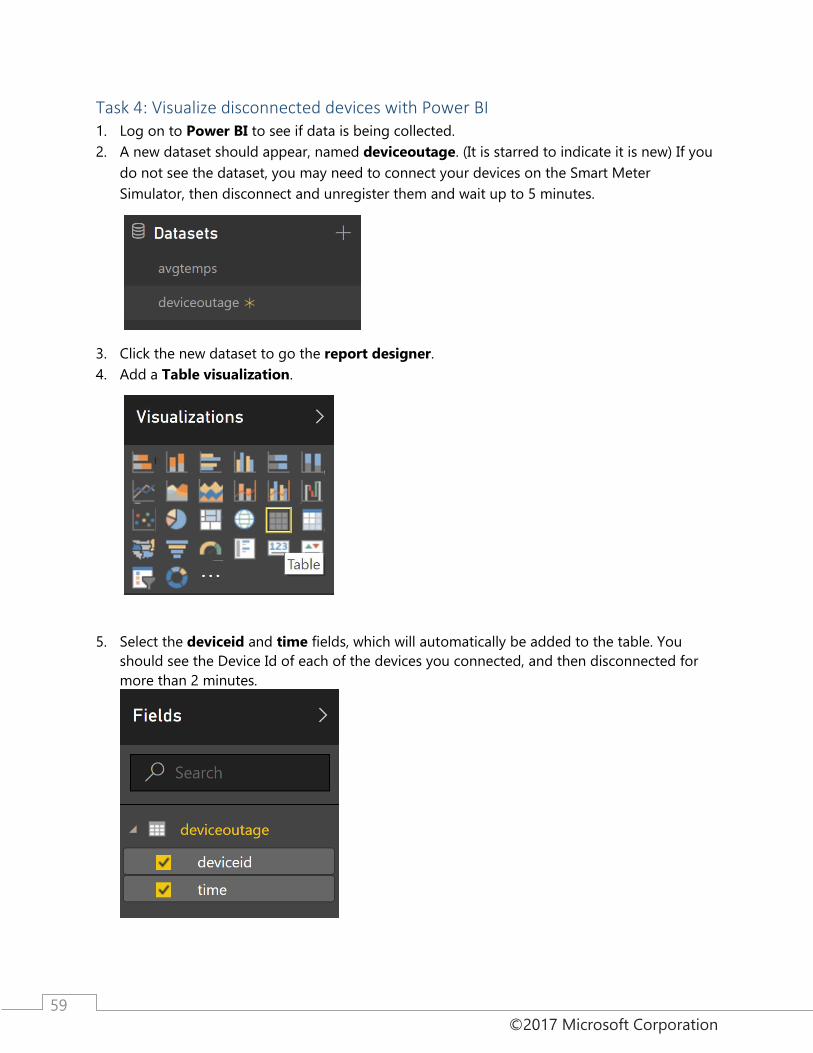
Task 4: Visualize disconnected devices with Power BI 1. Log on to Power BI to see if data is being collected.
2. A new dataset should appear, named deviceoutage. (It is starred to indicate it is new) If you
do not see the dataset, you may need to connect your devices on the Smart Meter
Simulator, then disconnect and unregister them and wait up to 5 minutes.
3. Click the new dataset to go the report designer.
4. Add a Table visualization.
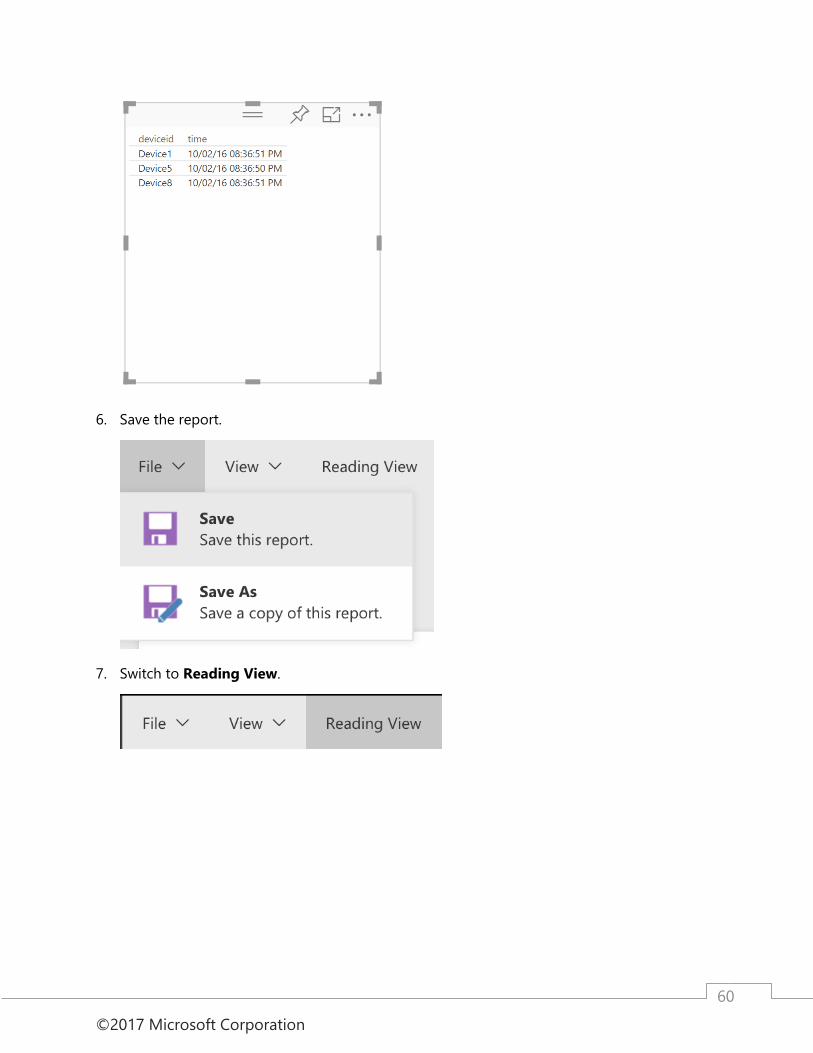
5. Select the deviceid and time fields, which will automatically be added to the table. You
should see the Device Id of each of the devices you connected, and then disconnected for
more than 2 minutes.
©2017 Microsoft Corporation
60
6. Save the report.
7. Switch to Reading View.
©2017 Microsoft Corporation
61
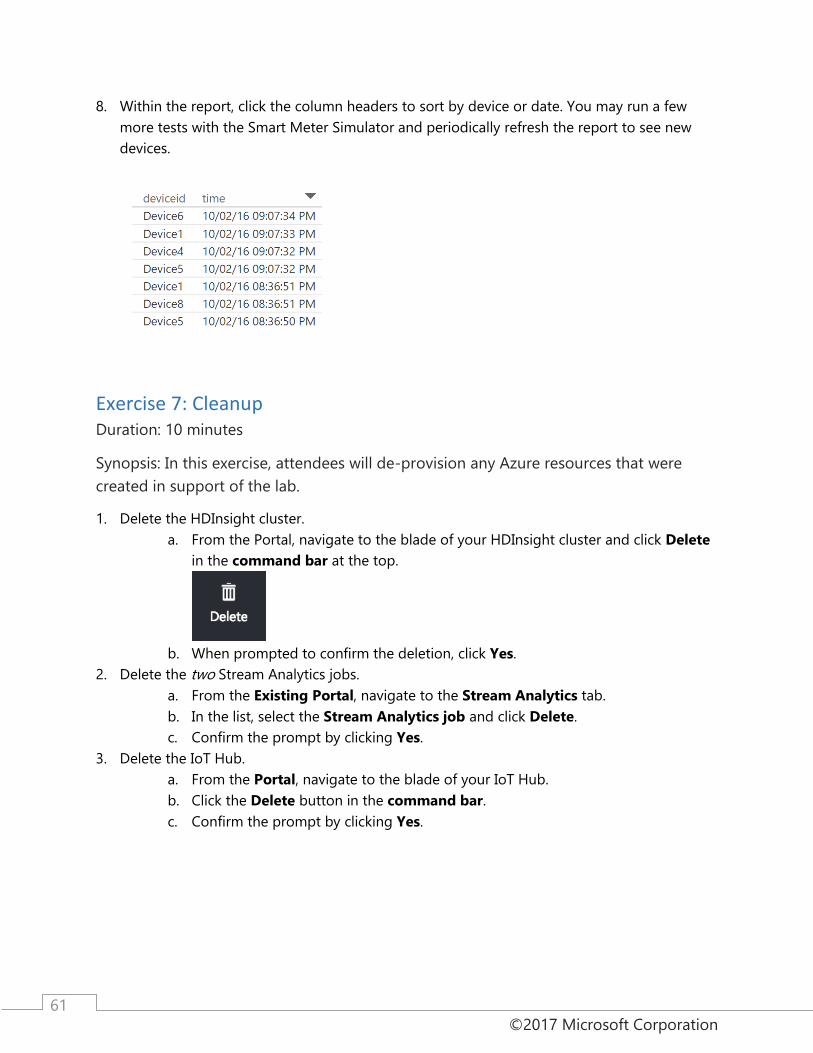
8. Within the report, click the column headers to sort by device or date. You may run a few
more tests with the Smart Meter Simulator and periodically refresh the report to see new
devices.
Exercise 7: Cleanup Duration: 10 minutes
Synopsis: In this exercise, attendees will de-provision any Azure resources that were
created in support of the lab.
1. Delete the HDInsight cluster.
a. From the Portal, navigate to the blade of your HDInsight cluster and click Delete
in the command bar at the top.
b. When prompted to confirm the deletion, click Yes.
2. Delete the two Stream Analytics jobs.
a. From the Existing Portal, navigate to the Stream Analytics tab.
b. In the list, select the Stream Analytics job and click Delete.
c. Confirm the prompt by clicking Yes.
3. Delete the IoT Hub.
a. From the Portal, navigate to the blade of your IoT Hub.
b. Click the Delete button in the command bar.
c. Confirm the prompt by clicking Yes.