microscopy basics and the study of actin–actin-binding protein interactions
TRANSCRIPT

Accepted Manuscript
Review
Review: Microscopy Basics and the Study of Actin – Actin-Binding Protein
Interactions
Maggie S. Thomasson, Megan A. Macnaughtan
PII: S0003-2697(13)00438-7
DOI: http://dx.doi.org/10.1016/j.ab.2013.09.008
Reference: YABIO 11489
To appear in: Analytical Biochemistry
Received Date: 1 June 2013
Revised Date: 5 September 2013
Accepted Date: 6 September 2013
Please cite this article as: M.S. Thomasson, M.A. Macnaughtan, Review: Microscopy Basics and the Study of Actin
– Actin-Binding Protein Interactions, Analytical Biochemistry (2013), doi: http://dx.doi.org/10.1016/j.ab.
2013.09.008
This is a PDF file of an unedited manuscript that has been accepted for publication. As a service to our customers
we are providing this early version of the manuscript. The manuscript will undergo copyediting, typesetting, and
review of the resulting proof before it is published in its final form. Please note that during the production process
errors may be discovered which could affect the content, and all legal disclaimers that apply to the journal pertain.

1
Review: Microscopy Basics and the Study of Actin – Actin-Binding Protein Interactions
Maggie S. Thomasson, Megan A. Macnaughtan
Louisiana State University
Choppin Hall
Baton Rouge, LA 70803
Phone: 1-225-578-7975
Email: [email protected]
Subject category: Protein Structure and Analysis
Short title: Microscopy for the Study of Actin/ABPs

2
Abstract: Actin is a multifunctional eukaryotic protein with a globular monomer form
that polymerizes into a thin, linear microfilament in cells. Through interactions with
various actin-binding proteins (ABPs), actin plays an active role in many cellular
processes, such as cell motility and structure. Microscopy techniques are powerful
tools for determining the role and mechanism of actin-ABP interactions in these
processes. In this article, we describe the basic concepts of fluorescence speckle
microscopy, total internal reflection fluorescence microscopy, atomic force microscopy,
and cryo-electron microscopy and review recent studies that utilize these techniques to
visualize the binding of actin with ABPs.
Keywords: Actin, actin-binding proteins, atomic force microscopy, microscopy, protein
structure, electron microscopy, electron tomography, cryomicroscopy, fluorescence
speckle microscopy, review, total internal reflection fluorescence microscopy

3
Introduction
Actin is a protein that is found in all eukaryotic cells. It is highly conserved, with
no more than 20% amino acid sequence difference between species. [1] Actin is 42
kDa in size and has a globular shape. Monomer units of actin polymerize into
filamentous actin (F-actin) in the presence of adenosine triphosphate (ATP), facilitated
in vitro by a divalent cation (Ca2+ or Mg2+) and dithiothreitol. F-actin participates in
many important cellular processes, such as cell motility, cargo transport, muscle
contraction, and the formation of microfilaments to aid in structure and support of cells
and muscle tissue. [1]
Proteins that interact with actin are called actin-binding proteins (ABPs). Due to
variations in the definition of ABPs, there are between 60 and 100 known ABPs, which
perform various functions and bind either globular actin or F-actin. [2] ABPs can be
categorized into classes based on function: regulators of F-actin assembly and
disassembly, regulators of higher-order F-actin structures, and proteins that use F-actin
as a mechanical framework. [3] Many ABPs bind actin through two calponin homology
domains, each approximately 100 residues with a conserved amino acid sequence. [4;
5]
Binding studies of F-actin and ABPs are typically performed using
ultracentrifugation and polyacrylamide gel electrophoresis (PAGE) or affinity
chromatography. [6] F-actin and the ABP are centrifuged at high speeds to pellet F-
actin and any ABP bound to it. The supernatant and pellet are analyzed with PAGE,
and the relative concentrations in the supernatant and pellet are determined
densitometrically. Binding is confirmed when the concentration of ABP in the

4
supernatant is lower than the concentration in the pellet. Affinity chromatography is
another method that can be used to identify ABPs. Columns with F-actin immobilized
on the stationary phase were invented in 1989 by Miller et al. [7] ABPs from complex
mixtures, such as cell extracts, are selectively retained and separated from other
proteins. Results from these methods are useful to identify ABPs and may indicate a
role of the ABP in polymerization or depolymerization of F-actin, but to understand the
binding mechanism, more sophisticated methods, such as microscopy, are needed.
Microscopy is used to image and analyze objects at the nm - μm scale.
Biological samples can be studied with microscopy at the cellular and subcellular levels,
including imaging individual organelles and protein networks like F-actin. Recent
advances in the areas of fluorescence microscopy, atomic force microscopy, and cryo-
electron microscopy have greatly improved our ability to study processes such as cell
motility, filament assembly, and protein-protein interactions. The application of these
methods to the study of actin filaments and ABPs has led to important discoveries
concerning the behavior of F-actin in biological systems. This review describes the
basics of these techniques and highlights recent microscopy studies that visualize F-
actin and its interaction with various ABPs.
Fluorescence Microscopy
In fluorescence microscopy, the fluorescence emission from a sample is imaged.
If a sample does not autofluoresce, then the sample is prepared for microscopy by
labelling with a fluorescent marker or stain. A common method to study proteins, like
actin and ABPs, is to express a recombinant fluorescent-fusion protein. Another option
is to use fluorescent dyes, such as x-rhodamine, which specifically bind to the analyte.

5
There have been two derivatives of fluorescence microscopy used to study the binding
dynamics of actin and ABPs: fluorescent speckle microscopy and total internal reflection
fluorescence microscopy.
Fluorescent Speckle Microscopy. Developed in the 1990s by Waterman-
Storer et al., [8] fluorescent speckle microscopy (FSM) was originally used to investigate
macromolecular assembly dynamics both in vivo and in vitro. [9] It is a derivative of
fluorescent analog cytochemistry, in which fluorophore-labeled proteins are expressed
or microinjected in vivo and are incorporated into macromolecular structures. [10; 11;
12] F-actin filaments were imaged using FSM by injecting x-rodamine-lableled actin into
cells (Figure 1 [13]). As the labeled actin was incorporated into the filaments, the
filaments appeared “speckled” due to the distribution of fluorescently labeled actin
among unmodified-actin. [8]
Figure 1. [13] Speckle formation of x-rhodamine-labeled actin filaments injected into an epithelial cell,
fixed and then stained with Alexa-488 phalloidin. (e) The organization of F-actin in amorphous networks
and bundles can be seen. (f) A single FSM image of actin filaments. Structural information appears to be
lost, but time-lapse FSM series rectifies this loss and provides further motility and structure information.

6
Speckles can be visualized only if the ratio between labeled and endogenous
molecules is low because a lower concentration results in the appropriate contrast
between neighboring diffraction-limited image regions. This contrast is only achieved
via microinjection of the protein or a low level of expression. Speckle contrast can
therefore be increased by decreasing the fraction of labeled molecules, but only to a
point. Noise obscures speckle signals at very low concentrations. It has been found
that optimal conditions for speckle fluorescence occur when the ratio of fluorophore-
labeled molecules is between 0.5% and 2.0%. [9]
The behavior, turnover, and movement of biopolymers in filamentous forms, such
as actin, can be observed using speckle fluorescence time-lapse microscopy. More
recently, the use of FSM has been expanded from a single spectral channel to
multispectral FSM. [14] This advancement has led to an emergence of studies in focal
adhesion proteins, such ABPs, and their interactions with filamentous biomolecules,
such as F-actin. [13]
Advantages of FSM. The low fraction of fluorescent subunits strongly reduces
background fluorescence that may arise from unincorporated fluorescent molecules or
those that may be out of focus. The distribution of speckles also allows for detection of
movement and turnover of molecules when imaged over time. This dynamic process is
impossible to see in the case of uniformly labeled filaments.
FSM study: Correlation of Actin Assembly with a GFP-p34 Signal. In
biological systems, Arp2/3 is a protein complex that is thought to promote
polymerization of networking filaments by aiding new filament creation from preexisting
ones. This protein has been described in the literature as a mediator of actin, helping to

7
regulate processes of polymerization and depolymerization in tandem. [15; 16; 17] It
has been shown that Arp2/3 is present along the lamellipodium, the cytoskeletal protein
actin at the mobile edge of cells. Interestingly, Arp2/3, detected with fluorescent stain,
was also present in punctate patterns within the lamella, a dense structure formed by
the cell at the leading edge for cell motility and migration. These observations led to
speculation that Arp2/3 was clustering in areas of F-actin assembly.
Time-resolved quantitative FSM (qFSM) F-actin assembly and disassembly
maps were correlated with time-lapse images of the green fluorescent protein (GFP)-
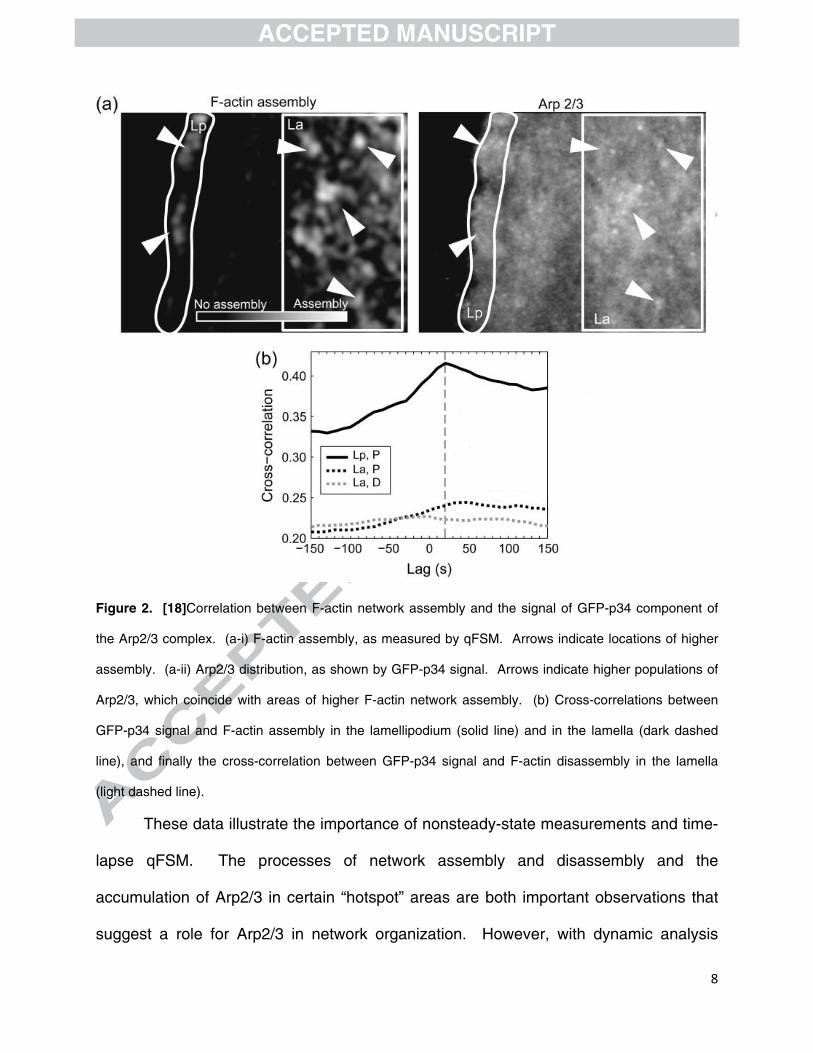
p34 component of the Arp2/3 complex. [17] Figure 2 shows the correlation found
between F-actin network assembly, measured with qFSM, and the signal from the GFP-
p34 component of the Arp2/3 complex. Pockets of higher F-actin network assembly, as
seen by the bright spots in figure 2a-i, appeared to coincide with bright pockets of GFP-
p34 signal as seen in 2a-ii; however, cross-correlation of the two maps over time
produced an average correlation coefficient of 0.22, as shown in figure 2b (dark dashed
line). The same, low correlation was observed between GFP-p34 and the disassembly
map (shown in the supplemental material within [17]) of the F-actin network (light
dashed line), indicating a correlation in space but not in time between F-actin
assembly/disassembly and Arp2/3 complex.
8
Figure 2. [18]Correlation between F-actin network assembly and the signal of GFP-p34 component of
the Arp2/3 complex. (a-i) F-actin assembly, as measured by qFSM. Arrows indicate locations of higher
assembly. (a-ii) Arp2/3 distribution, as shown by GFP-p34 signal. Arrows indicate higher populations of
Arp2/3, which coincide with areas of higher F-actin network assembly. (b) Cross-correlations between
GFP-p34 signal and F-actin assembly in the lamellipodium (solid line) and in the lamella (dark dashed
line), and finally the cross-correlation between GFP-p34 signal and F-actin disassembly in the lamella
(light dashed line).
These data illustrate the importance of nonsteady-state measurements and time-
lapse qFSM. The processes of network assembly and disassembly and the
accumulation of Arp2/3 in certain “hotspot” areas are both important observations that
suggest a role for Arp2/3 in network organization. However, with dynamic analysis

9
using time-lapse qFSM, the network processes and Arp2/3 accumulation were found to
be independent of each other in time. Additionally, the correlation of qFSM data with
image cues, such as accumulation or sudden lack of fluorescent signal or the apparent
relocation of speckles, allows for the examination of functional relationships between
proteins.
Total Internal Reflection Fluorescence Microscopy. Studying processes on
surfaces with fluorescence microscopy can be a challenge with conventional techniques
because of noise from fluorophores that have bound to the surface or are present in the
surrounding medium. To circumvent this problem, Daniel Axelrod combined total
internal reflection with microscopy as a tool to study surfaces and called the new
method total internal reflection fluorescence microscopy (TIRFM). [19] In TIRFM, an
evanescent wave is generated from light that, at a given incident angle, is internally
reflected along the glass-sample interface. It is a technique for studying occurrences at
surfaces, such as cell surfaces and membranes, because the evanescent wave only
penetrates to a depth of approximately 100 nm into the sample. This thin layer is called
the “evanescent field,” and it exponentially decays in intensity with increasing distance
from the surface.
TIRFM has been in use longer than other microscopy methods, so F-actin and
ABPs have been extensively studied using this method both in vitro and in vivo. Some
recent studies of actin and ABPs with TIRFM include studies on the stabilization of
actin, [20] the adhesion of actin to surfaces via ABPs, [21] the properties of ABPs, [22]
and the visualization of actin assembly. [23]

10
Advantages of TIRFM. TIRFM allows for direct observations of biochemical and
biological processes at the surface of a sample. Without perturbing the system, TIRFM
allows for the study of protein functions involved in actin polymerization and related
regulatory processes within the cell. It is also a method that does not require
stabilization of the actin filaments, so observations can be made in native conditions.
Study: Assembly of F-actin Barbed Ends in Association with Formins.
Formin proteins are a family of proteins known to act as actin assembly aids. Each
contains a formin homology 2 (FH2) domain that promotes F-actin assembly by
assisting and accelerating elongation at the barbed end of the filament. The FH2
domain is approximately 400 residues in length and, in all known cases, forms a dimer.
[24]
TIRFM was used to observe the polymerization of F-actin in the presence of
formin proteins. Glass slides were preincubated with NEM myosin-II, which bound to
actin filaments and anchored them to the slide, leaving both the barbed end and the
pointed end of the filaments free (figure 3-a). The actin filaments were exposed to
formins in solution to observe polymerization. TIFRM images (figure 4) show that the
barbed end of the filament elongates while the pointed end does not. This observation
confirms that formin-aided F-actin polymerization occurs at the barbed end.
In a second set-up, F-actin was exposed to glass slides preincubated with
formins, and bound to the anchored formins by the barbed end of the filament (figure 3-
b). [22] Elongating filaments did not appear to dissociate from the immobilized formin,
as seen in the TIFRM images (figure 5). Since polymerization occurs at the barbed end
of the filament, it follows that insertional polymerization must be occurring. This

11
conclusion was confirmed by the observation that filaments grow even when bound by
NEM myosin-II and the barbed end was bound by formin (schematic in figure 3-c).
Figure 3. [22] A schematic of F-actin attachment on slides coated with NEM-myosin II (a), formin or GST-
formin (b), and NEM-myosin II and formin (c).
Figure 4. [22] The growth of F-actin bound to a glass slide by NEM myosin-II. White cirlces are the point
of binding. Red arrows point to the pointed end of the filament. Green arrows point to the barbed end.
Scale bar = 5 µm. The graph shows the length from the point of binding to each end of the filament.
Figure 5. [22]The growth of F-actin on the slide at its barbed end is observed with TIRFM. White circles
indicate the points at which filaments are attached at their barbed end to formin. The free filaments of
actin grow linearly, while the filaments with the bound barbed end buckle in the middle during growth.
Scale bar = 5 µm. The graph shows the length of the filaments as they increase over time.

12
In addition to observing insertional polymerization at the barbed end of F-actin,
the force supplied by the polymerization of actin was measured. It has been reported
that actin polymerization produces the force for cell motility. [25; 26] F-actin was
polymerized on slides preincubated with both a formin and NEM-myosin II, which
provided a second attachment point for the filament (figure 3-c). When tethered by
NEM-myosin II, growth of the F-actin caused it to buckle, which appears in the TIRFM
image as a loop between the two points of attachment. The force of polymerization that
caused buckling was calculated in this study using a derivation of the Euler equation for
maximum axial load on a column [27]. Forces ranging from 0.25 – 1.3 pN were
measured, with smaller filaments of actin producing higher forces.
Fluorescence – Conclusion. Fluorescence microscopy is a powerful and
versatile tool for the study of actin filaments and APBs. The impact that an ABP can
have on the structure, polymerization, motility, or stability of actin can be viewed in
native conditions. Time-lapse FSM proves beneficial for the study of actin filament
dynamics, providing visual evidence of movement and structural changes over time.
TIRFM is useful for studies at surfaces and cell membranes, providing high-contrast and
high-resolution images of biochemical processes that answer questions about the
molecular nature of proteins and their interactions.
Atomic Force Microscopy
While the dynamic behavior of proteins can be studied using fluorescence
microscopy, the resolution of the technique is limited to 0.5 µm. [28] Atomic force
microscopy (AFM) is a molecular imaging method that can produce images of biological
samples in aqueous solutions with lateral resolution of 1 nm and height resolution of

13
less than 1 Å, [29; 30; 31] making it suitable for studying the structural properties of
actin and ABPs. Sample imaging with AFM involves the acquisition of sample height
information across many points of a sample surface. Resolution is limited by the
number of data points and the speed is limited by the imaging rate.
High-speed AFM (HS-AFM) in tapping mode was developed by the Hansma and
the Ando research groups to increase the imaging rate of AFM. [32; 33] HS-AFM has
been used to capture an image of a protein molecule within 100 ms without disturbing
the structure or the function of the protein. [34] This technique makes ms – s dynamic
measurements with AFM possible. Recent imaging studies with HS-AFM have
captured images of F-actin remodeling [35] and time-lapse videos of actin/ABP
interaction. [34]
Advantages. AFM can provide higher resolution images of proteins compared
to fluorescence microscopy. The technique does not disturb the integrity or motility of
the protein. There is no need for fluorescent markers or staining of the sample to be
imaged by AFM. The molecules themselves are imaged, as opposed to imaging the
fluorophores in fluorescence microscopy.
AFM of F-Actin Remodeling when Bound by Drebrin A. High-resolution AFM
was used by Sharma et al. to analyze the interaction between drebrin A, a major
neuronal ABP, and F-actin. [35] Figure 5 shows AFM images of actin filaments alone
(A, C) and with bound drebrin (B, D) over a mica substrate, at both low and high
resolution. F-actin alone was shown to have a helical pitch of 36 ± 2 nm, consistent
with previous studies. [36] Drebrin binds to actin with regular periodicity along the
filament, giving an image described as a “pearl necklace” like morphology. Height and

14
periodicity variations across the F-actin backbone (both bound and unbound) can be
seen in the graphs of Figure 5E and 5F. The peak periodicity profile of the F-actin
filaments increases from 36 nm to 40 nm when bound to drebrin, demonstrating that the
helical pitch of F-actin increases as a result of binding drebrin.
AFM was also used to determine the helical pitch of F-actin bound with cofilin.
Cofilin is a 16 kDa ABP that severs “overtwisted” F-actin by means of capturing and
stabilizing. [37] Unlike drebrin, cofilin decreases the helical pitch of F-actin when
bound. [37] AFM images of F-actin filaments bound with cofilin confirmed a
significantly lower helical pitch (average 28.7 nm) (Table 1). While drebrin modifies F-
actin by increasing the helical pitch and persistence length of filaments, cofilin has the
opposite effect.

15
Figure 6. [38]Drebrin–F-actin complex. AFM images of unbound F-actin (A, C) and drebrin-bound F-
actin (B, D) at lower (A, B) and higher (C, D) resolution. E and F display periodicity and height profiles
obtained from arrowed areas in A and B.
Table 1. [38] Comparison of ABP-bound F-actin Filaments. a: [39] and [40], b: [41], c: [42]

16
Hand-Over-Hand Motion of Myosin V on F-actin. Double-headed myosin V
(M5) homodimer is a member of the myosin superfamily of proteins. Its primary function
in cells is cargo transportation. It has been shown to progressively move along an actin
filament, 36 nm at a time, [43] as it binds and unbinds itself along the way. [44] This
motion is described as “hand-over-hand”, meaning that the two heads, the N-terminal
domains, of the M5 homodimer alternately step ahead of each other as though it were
“crawling” or “walking” forward. While this behavior has been accepted and implied in
studies using single-molecule fluorescence microscopy, [45; 46; 47] it was not
visualized until recently when the Ando group obtained high-resolution HS-AFM images
of M5 “walking” across F-actin. [34; 48]
To obtain the HS-AFM images of M5 “walking”, actin filaments were immobilized
on a surface through partial biotinylation of the actin followed by interaction with an
electrically neutral biotin-lipid bilayer surface formed on mica. Tail-truncated M5 (M5-
HMM) was added in solution, and movement of M5-HMM homodimer was visualized at
7 frames per second (fps), as shown in figure 12a. Steps appeared to be approximately
36 nm in size, and unique structural features were observed. First, the area at the
junction of the motor domain of the leading head appears to be smooth, while that at the
trailing head has a V-shape (schematic in figure 12b). Second, the coiled tail of M5-
HMM tilts towards the minus end of F-actin. Since these features occurred universally
and reproducibly, they provide a marker of the polarity of the actin filament when bound
M5-HMM is stationary. A third observation is that M5-HMM appears to bind at the
groove between actin filaments, taking step sizes based on the pitch of the helix.

17
Step movement of M5-HMM along F-actin occurs very quickly, and the process
was complete within a frame. In order to slow down the steps for imaging, streptavidin
molecules were placed on the substrate surface. These molecules served as obstacles
to binding, which slowed the rate of movement enough for imaging, as seen in figure 6c
and illustrated in figure 6d. The trailing head detaches from F-actin and the leading
head appears to rotate in order to pull the molecule forward. After bypassing the
streptavidin molecules, the leading head completes its rotation and the trailing head
moves onward to bind at a location farther up the F-actin chain. During this “walk,” the
trailing head does not interact with the F-actin molecule until it binds and becomes the
new leading head. The rotation of the leading head serves as a fulcrum point, in
agreement with a proposed mechanism in the literature. [49]

18
Figure 7. [50] Walking M5-HMM imaged by HS-AFM in 1µM ATP. (a) AFM images were taken over time
(frame rate 7 fps) to show the movement of M5-HlMM across F-actin. (b) An illustration of M5-HMM
bound to F-actin at both heads. (c) AFM images were taken over time (frame rate 7 fps) to show hand-
over-hand movement. The swinging point is shown by a white line marker. (d) An illustration of the
images in c.
Conclusion. AFM imaging of ABPs and their interactions with F-actin is a
powerful method to study the binding process at the molecular level. With advances in
speed and resolution, AFM can provide dynamic and structural information
simultaneously.
Transmission Electron Microscopy
Transmission Electron Microscopy (TEM) is an imaging technique in which a
beam of electrons is transmitted through a sample. After the electrons interact and
pass through the sample, they are focused onto a capture device, such as a charge-
coupled device, to produce an image. TEM has higher resolution than light
microscopes due to the small de Broglie wavelength of electrons, making it an attractive
method for studying proteins. Cryogenic freezing is used for biological samples for
immobilization and protection from radiation and high vacuum during analysis. [51]
Focused ion beam is a milling technique that uses a beam of gallium or helium ions to
cut a portion of the specimen for analysis and can be used in sample preparation. [52;
53] Two TEM methods, cryo-electron microscopy and cryo-electron tomography, can
be used to study actin and ABPs.
Cryo-Electron Microscopy. Cryo-electron microscopy (cryoEM) is a form of
TEM useful to the field of structural biology. Samples are cooled to cryogenic
temperatures, usually below -150 °C (123 K). The frozen sample is subjected to a high

19
voltage electron beam that is used to illuminate the specimen and produce an image. In
order to obtain the highest resolution possible, distortions inherent from the electron
microscope (the contrast transfer function, CTF) are corrected. [54; 55] 3D surface
maps of an object can be constructed from TEM images taken at varying defoci. [56; 57]
Before the development of a superfluid helium stage, cryoEM images were
limited to a resolution of 13 Å, and [58; 59; 60] thin (100 Å diameter), flexible structures
like F-actin were difficult to image because of inaccurate image alignment. The
superfluid helium stage allows for continuous cooling of samples [61] and improves CTF
correction of the electron diffraction pattern. [62] This advancement has allowed for
structural analysis of helical, biomolecular assemblies, like F-actin, at near atomic-level
resolution. [62; 63; 64] In 2010, Takashi Fujii et al. used cryoEM to generate a 3D
image model of F-actin at 6.6 Å resolution. [65] This study demonstrated the potential
of cryoEM to image the secondary structure of smaller, thinner species than had
previously been achieved and paved the way for studies of F-actin complexes with
ABPs.

20
Figure 8. [66] High-contrast cryoEM image of F-actin filaments. Scale bar = 100nm.
Advantages of CryoEM. Unlike fluorescence microscopic methods, cryoEM
samples do not need to be stained or marked in order to be imaged, which allows for
species to be viewed directly. Of the methods covered in this review, cryoEM is
capable of the highest resolution images of filaments, nearing atomic resolution.
CryoEM Study: Remodeling of actin filaments by ADF/cofilin proteins.
Using cryoEM, Vitold Gakin et al. generated a high-resolution (9 Å) image of F-actin
filaments with and without bound cofilin-2. Cofilin/ADF proteins are known modifiers of
actin in cells. They regulate actin assembly, including the formation of actin-cofilin rods
during neurodegeneration [67] and depolymerization and severing of actin filaments.
[68] The cryoEM images of F-actin bound with cofilin-2 were used to construct 3D
models of the cofilin-decorated F-actin as shown in figure 8. Using the models, it was
21
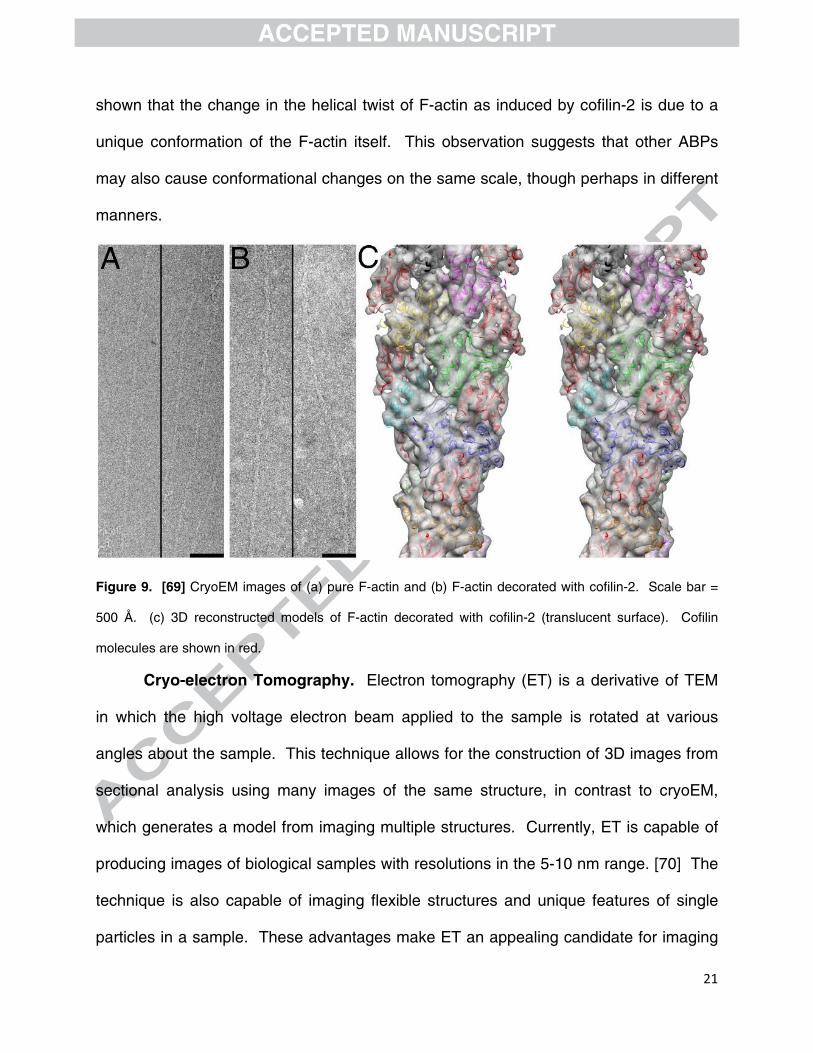
shown that the change in the helical twist of F-actin as induced by cofilin-2 is due to a
unique conformation of the F-actin itself. This observation suggests that other ABPs
may also cause conformational changes on the same scale, though perhaps in different
manners.
Figure 9. [69] CryoEM images of (a) pure F-actin and (b) F-actin decorated with cofilin-2. Scale bar =
500 Å. (c) 3D reconstructed models of F-actin decorated with cofilin-2 (translucent surface). Cofilin
molecules are shown in red.
Cryo-electron Tomography. Electron tomography (ET) is a derivative of TEM
in which the high voltage electron beam applied to the sample is rotated at various
angles about the sample. This technique allows for the construction of 3D images from
sectional analysis using many images of the same structure, in contrast to cryoEM,
which generates a model from imaging multiple structures. Currently, ET is capable of
producing images of biological samples with resolutions in the 5-10 nm range. [70] The
technique is also capable of imaging flexible structures and unique features of single
particles in a sample. These advantages make ET an appealing candidate for imaging

22
actin filament networks and actin-ABP complexes. In cryo-electron tomography
(cryoET), as in cryo-electron microscopy, the sample is cooled to cryogenic
temperatures for analysis.
Speculation: CryoET for the Study of Actin-ABP Complexes. CryoET has
already been used extensively for the study of actin filaments and networks, but no
studies of actin-ABP interactions were found. The Hanein lab has performed numerous
studies of actin using cryoET and written several good reviews on the subject. [71; 72]
CryoET would be useful for studying actin-ABP complexes because 3D volumes can be
produced for unique features such as branching, cross-linking, and overlapping of
filaments in networks. [73] The primary limitation of cryoET compared to cryoEM for the
study of protein complexes is the relatively low resolution. A new approach to improving
the final resolution is sub-volume averaging, where multiple structures are imaged,
aligned, and averaged. [74; 75] Actin-ABP complexes should be a good candidate for
sub-volume averaging since multiple ABP molecules can bind along one F-actin
filament.
Transmission Electron Microscopy - Conclusion. Recent advances have
made cryoEM a viable method to study thin filaments in biological systems. CryoEM
paired with 3D reconstruction software has been used to visualize the structure of F-
actin and its complex with cofilin-2. Future studies will aid our understanding of F-actin
structural changes in the presence of ABPs. CryoET’s ability to analyze sections of
sample at varying rotations and construct a 3D image from the data collected make it a
powerful tool. However, a major disadvantage of TEM methods, especially of cryoET, is
the poor signal-to-noise ratio, which is difficult to overcome when there is a need to

23
minimize radiation damage to the sample. [76] It is possible that as higher resolution
electron microscopy and tomography methods become available, it will be possible to
obtain “snapshots” of structural processes such as binding, polymerization, or
depolymerization of actin filaments.
Looking Forward: Correlative Light/Electron Microscopy
In the past decade, there has been an increased interest in combining both light
and electron microscopy methods in order to exploit the advantages of both techniques.
Light microscopy allows for rapid screening of a large area, and electron microscopy
produces images at a higher resolution than light microscopy methods. Correlative
light/electron microscopy (CLEM) was first used in the 1970s to study stained cells in
tissue samples by coupling light immunohistological cell staining with electron
microscopy. [77] With CLEM, the sample is cooled to cryogenic temperatures, aligned
to a grid, and imaged with light microscopy, typically fluorescence microscopy. Areas of
interest are identified and their coordinates on the sample grid are recorded and relayed
to the electron microscope for imaging. Since navigation to the areas of interest is
streamlined, pre-irradiation and damage of the sample are minimized. [76] CLEM also
allows for a direct correlation between data collected using both methods, which aids in
image interpretation. The primary limitation of CLEM is the specialized nature of the
technique, which requires multiple, expensive instruments and the software and
expertise to interface them.
CLEM has not been used to study actin-ABP complexes, but has advantages
specific to such systems. In particular, CLEM is well-suited for cryoET sub-volume

24
averaging approaches. With a fluorescently labeled ABP, CLEM could be used to
quickly identify bound ABP and direct cryoET imaging of multiple complexes.
Discussion
Images of F-actin and ABP interactions provide information about the binding
process, such as alteration of the helical twist, ABP dynamics, physical bending of
filaments, and network assembly dynamics. These mechanistic details of actin and
ABPs are crucial to understand the function of the F-actin networks within cells.
Fluorescence microscopy (FSM and TIRFM) and atomic force microscopy can be
used to generate time-lapse images of binding and dynamics. Visual data can be easily
interpreted and explain physical occurrences within the sample. Additionally, both
methods can be quantitative, providing numerical data to supplement visual evidence.
While fluorescence microscopy is widespread, cheaper, and very efficient for the study
of structural proteins, F-actin does not autofluoresce and requires sample preparation.
Since only fluorescent molecules are imaged, fluorescence microscopy provides a level
of specificity in imaging that is difficult to obtain with other forms of microscopy. AFM
does not require sample preparation beyond immobilization, but the high cost of AFM
remains a limitation to study F-actin.
Advances in cryo-electron microscopy and tomography now allow for detailed
visualization of actin filaments. There is also no need for marking, staining, or dyeing of
the sample. Electron microscopy methods are the highest resolution techniques
available to image F-actin and its complexes. We anticipate that cryo-ET sub-volume
averaging, possibly implemented as a CLEM technique, will improve the 3D resolution

25
imaging of actin-ABP complexes and advance our knowledge about the role of ABP’s in
cells.
References
[1] G.J. Doherty, and H.T. McMahon, Mediation, modulation, and consequences of membrane-
cytoskeleton interactions. Annu. Rev. Biophys. 37 (2008) 65-95.
[2] C.G. Dos Remedios, D. Chhabra, M. Kekic, I.V. Dedova, M. Tsubakihara, D.A. Berry, and N.J.
Nosworthy, Actin binding proteins: regulation of cytoskeletal microfilaments. Physiol. Rev. 83 (2003)
433-473.
[3] S.J. Winder, and K.R. Ayscough, Actin-binding proteins. J. Cell Sci. 118 (2005) 651-654.
[4] K.D. Carugo, S. Banuelos, and M. Saraste, Crystal structure of a calponin homology domain. Nat.
Struct. Mol. Biol. 4 (1997) 175-179.
[5] E. Korenbaum, and F. Rivero, Calponin homology domains at a glance. J. Cell Sci. 115 (2002) 3543-
3545.
[6] T.D. Pollard, and E.D. Korn, Acanthamoeba Myosin II interaction with actin and with a new cofactor
protein required for actin activation of Mg2+ adenosine triphosphate activity. J. Biol. Chem. 248 (1973)
4691-4697.
[7] K.G. Miller, and B.M. Alberts, F-actin affinity chromatography: technique for isolating previously
unidentified actin-binding proteins. Proc. Natl. Acad. Sci. U. S. A. 86 (1989) 4808-4812.
[8] C.M. Waterman-Storer, A. Desai, J. Chloe Bulinski, and E.D. Salmon, Fluorescent speckle microscopy,
a method to visualize the dynamics of protein assemblies in living cells. Curr. Biol. 8 (1998) 1227-1230.
[9] G. Danuser, and C.M. Waterman-Storer, Quantitative fluorescent speckle microscopy: where it came
from and where it is going. J. Microsc. 211 (2003) 191–207.
[10] Y.-L. Wang, Chapter 1: Fluorescent analog cytochemistry: tracing functional protein components in
living cells. in: D.L.T. Yu-Li Wang, and K.W. Jeon, (Eds.), Methods in Cell Biology, Academic Press, 1988,
pp. 1-12.
[11] C.M. Waterman-Storer, and E.D. Salmon, How microtubules get fluorescent speckles. Biophys. J. 75
(1998) 2059-2069.
[12] C.M. Waterman-Storer, and G. Danuser, New directions for fluorescent speckle microscopy. Curr.
Biol. 12 (2002) R633-R640.
[13] G. Danuser, and C.M. Waterman-Storer, Quantitative fluorescent speckle microscopy of
cytoskeleton dynamics. Annu. Rev. Biophys. Biomol. Struct. 35 (2006) 361-387.
[14] W.C. Salmon, M.C. Adams, and C.M. Waterman-Storer, Dual-wavelength fluorescent speckle
microscopy reveals coupling of microtubule and actin movements in migrating cells. J. Cell Biol. 158
(2002) 31-37.
[15] S.L. Gupton, K.L. Anderson, T.P. Kole, R.S. Fischer, A. Ponti, S.E. Hitchcock-DeGregori, G. Danuser,
V.M. Fowler, D. Wirtz, D. Hanein, and C.M. Waterman-Storer, Cell migration without a lamellipodium:
translation of actin dynamics into cell movement mediated by tropomyosin. J. Cell Biol. 168 (2005) 619-
631.
[16] A. Ponti, M. Machacek, S.L. Gupton, C.M. Waterman-Storer, and G. Danuser, Two distinct actin
networks drive the protrusion of migrating cells. Science 305 (2004) 1782-1786.
[17] A. Ponti, A. Matov, M. Adams, S. Gupton, C.M. Waterman-Storer, and G. Danuser, Periodic patterns
of actin turnover in lamellipodia and lamellae of migrating epithelial cells analyzed by quantitative
fluorescent speckle microscopy. Biophys. J. 89 (2005) 3456-3469.
[18] Reprinted from Biophysical Journal, 89, A. Ponti, A. Matov, M. Adams, S. Gupton, C. M. Waterman-
Storer, and G. Danuser, Periodic patterns of actin turnover in lamellipodia and lamellae of migrating

26
epithelial cells analyzed by quantitative fluorescent speckle microscopy, 3466, Copyright (2005), with
permission from Elsevier.
[19] D. Axelrod, Cell-substrate contacts illuminated by total internal reflection fluorescence. J. Cell Biol.
89 (1981) 141-145.
[20] M.K. Gardner, B.D. Charlebois, I.M. Jánosi, J. Howard, A.J. Hunt, and D.J. Odde, Rapid microtubule
self-assembly kinetics. Cell 146 (2011) 582-592.
[21] M.A. Caporizzo, Y. Sun, Y.E. Goldman, and R.J. Composto, Nanoscale topography mediates the
adhesion of F-actin. Langmuir 28 (2012) 12216-12224.
[22] D.R. Kovar, and T.D. Pollard, Insertional assembly of actin filament barbed ends in association with
formins produces piconewton forces. Proc. Natl. Acad. Sci. U. S. A. 101 (2004) 14725-14730.
[23] E. Helfer, Visualization of individual actin filament assembly, Actin-Based Motility, Springer, Van
Godewijckstraat, 2010, pp. 317-333.
[24] V. Ramabhadran, P.S. Gurel, and H.N. Higgs, Mutations to the formin homology 2 domain of INF2
protein have unexpected effects on actin polymerization and severing. J. Biol. Chem. 287 (2012) 34234-
34245.
[25] A. Mogilner, and G. Oster, Force generation by actin polymerization II: the elastic ratchet and
tethered filaments. Biophys. J. 84 (2003) 1591-1605.
[26] M.-F. Carlier, C.L. Clainche, S. Wiesner, and D. Pantaloni, Actin-based motility: from molecules to
movement. BioEssays 25 (2003) 336-345.
[27] J. Howard, Mechanics of motor proteins. in: F. Flyvbjerg, F. Jülicher, P. Ormos, and F. David, (Eds.),
Physics of Bio-Molecules and Cells, Springer Berlin - Heidelberg, Berlin, 2002, pp. 69-94.
[28] R. Heintzmann, and G. Ficz, Breaking the resolution limit in light microscopy. Briefings Funct.
Genomics Proteomics 5 (2006) 289-301.
[29] S. Karrasch, R. Hegerl, J.H. Hoh, W. Baumeister, and A. Engel, Atomic force microscopy produces
faithful high-resolution images of protein surfaces in an aqueous environment. Proc. Natl. Acad. Sci. U.
S. A. 91 (1994) 836-838.
[30] G. Binnig, C.F. Quate, and C. Gerber, Atomic force microscope. Phys. Rev. Lett. 56 (1986) 930-933.
[31] S. Gould, O. Marti, B. Drake, L. Hellemans, C.E. Bracker, P.K. Hansma, N.L. Keder, M.M. Eddy, and
G.D. Stucky, Molecular resolution images of amino acid crystals with the atomic force microscope.
Nature 332 (1988) 332-334.
[32] D.A. Walters, J.P. Cleveland, N.H. Thomson, P.K. Hansma, M.A. Wendman, G. Gurley, and V. Elings,
Short cantilevers for atomic force microscopy. Rev. Sci. Instrum. 67 (1996) 3583-3590.
[33] T. Ando, N. Kodera, E. Takai, D. Maruyama, K. Saito, and A. Toda, A high-speed atomic force
microscope for studying biological macromolecules. Proc. Natl. Acad. Sci. U. S. A. 98 (2001) 12468-
12472.
[34] N. Kodera, D. Yamamoto, R. Ishikawa, and T. Ando, Video imaging of walking myosin V by high-
speed atomic force microscopy. Nature 468 (2010) 72-76.
[35] S. Sharma, E.E. Grintsevich, M.L. Phillips, E. Reisler, and J.K. Gimzewski, Atomic force microscopy
reveals drebrin induced remodeling of f-actin with subnanometer resolution. Nano Lett. 11 (2011) 825-
827.
[36] Z. Shao, D. Shi, and A.V. Somlyo, Cryoatomic force microscopy of filamentous actin. Biophys. J. 78
(2000) 950-958.
[37] A. McGough, B. Pope, W. Chiu, and A. Weeds, Cofilin changes the twist of F-actin: implications for
actin filament dynamics and cellular function. J. Cell Biol. 138 (1997) 771-781.
[38] Reprinted (adapted) with permission from S. Sharma, E.E. Grintsevich, M.L. Phillips, E. Reisler, and
J.K. Gimzewski, Atomic force microscopy reveals drebrin induced remodeling of F-actin with
subnanometer resolution. Nano Lett. 11 (2011) 825-827. Copyright (2011) American Chemical Society.

27
[39] C. Frontali, E. Dore, A. Ferrauto, E. Gratton, A. Bettini, M.R. Pozzan, and E. Valdevit, An absolute
method for the determination of the persistence length of native DNA from electron micrographs.
Biopolymers 18 (1979) 1353-1373.
[40] T. Takebayashi, Y. Morita, and F. Oosawa, Electron microscopic investigation of the flexibility of F-
actin. Biochim. Biophys. Acta, Protein Struct. 492 (1977) 357-363.
[41] R. Ishikawa, K. Hayashi, T. Shirao, Y. Xue, T. Takagi, Y. Sasaki, and K. Kohama, Drebrin, a
development-associated brain protein from rat embryo, causes the dissociation of tropomyosin from
actin filaments. J. Biol. Chem. 269 (1994) 29928-29933.
[42] H. Isambert, P. Venier, A. Maggs, A. Fattoum, R. Kassab, D. Pantaloni, and M. Carlier, Flexibility of
actin filaments derived from thermal fluctuations. Effect of bound nucleotide, phalloidin, and muscle
regulatory proteins. J. Biol. Chem. 270 (1995) 11437-11444.
[43] T. Sakamoto, M.R. Webb, E. Forgacs, H.D. White, and J.R. Sellers, Direct observation of the
mechanochemical coupling in myosin Va during processive movement. Nature 455 (2008) 128-132.
[44] A.D. Mehta, R.S. Rock, M. Rief, J.A. Spudich, M.S. Mooseker, and R.E. Cheney, Myosin-V is a
processive actin-based motor. Nature 400 (1999) 590-593.
[45] A. Yildiz, J.N. Forkey, S.A. McKinney, T. Ha, Y.E. Goldman, and P.R. Selvin, Myosin V walks hand-over-
hand: single fluorophore imaging with 1.5-nm localization. Science 300 (2003) 2061-2065.
[46] J.N. Forkey, M.E. Quinlan, M. Alexander Shaw, J.E.T. Corrie, and Y.E. Goldman, Three-dimensional
structural dynamics of myosin V by single-molecule fluorescence polarization. Nature 422 (2003) 399-
404.
[47] D.M. Warshaw, G.G. Kennedy, S.S. Work, E.B. Krementsova, S. Beck, and K.M. Trybus, Differential
labeling of myosin V heads with quantum dots allows direct visualization of hand-over-hand
processivity. Biophys. J. 88 (2005) L30-L32.
[48] T. Ando, T. Uchihashi, and N. Kodera, High-speed atomic force microscopy. Jpn. J. Appl. Phys. 51
(2012) 08KA021-08KA0215.
[49] H.E. Huxley, The mechanism of muscular contraction. Science 164 (1969) 1356-1366.
[50] Adapted by permission from Macmillan Publishers Ltd: Nature (N. Kodera, D. Yamamoto, R.
Ishikawa, and T. Ando, Video imaging of walking myosin V by high-speed atomic force microscopy.
Nature 468 (2010) 72-76.), copyright (2010)
[51] M. Adrian, J. Dubochet, J. Lepault, and A.W. McDowall, Cryo-electron microscopy of viruses. Nature
308 (1984) 32-36.
[52] M. Osumi, Visualization of yeast cells by electron microscopy. J. Electron Microsc. (Tokyo) 61 (2012)
343-365.
[53] M. Suzuki, Y. Asada, D. Watanabe, and Y. Ohya, Cell shape and growth of budding yeast cells in
restrictive microenvironments. Yeast 21 (2004) 983-989.
[54] J.A. Mindell, and N. Grigorieff, Accurate determination of local defocus and specimen tilt in electron
microscopy. J. Struct. Biol. 142 (2003) 334-347.
[55] S.J. Ludtke, P.R. Baldwin, and W. Chiu, EMAN: semiautomated software for high-resolution single-
particle reconstructions. J. Struct. Biol. 128 (1999) 82-97.
[56] P.L. Stewart, S.D. Fuller, and R.M. Burnett, Difference imaging of adenovirus: bridging the resolution
gap between X-ray crystallography and electron microscopy. EMBO J 12 (1993) 2589-2599.
[57] P.A. Penczek, J. Zhu, R. Schröder, and J. Frank, Three domensional reconstruction with contrast
transfer function compensation from defocus series. Scanning Microscopy 11 (1997) 147-154.
[58] T. Oda, M. Iwasa, T. Aihara, Y. Maeda, and A. Narita, The nature of the globular- to fibrous-actin
transition. Nature 457 (2009) 441-445.
[59] V.E. Galkin, A. Orlova, O. Cherepanova, M.-C. Lebart, and E.H. Egelman, High-resolution cryo-EM
structure of the F-actin–fimbrin/plastin ABD2 complex. Proc. Natl. Acad. Sci. U. S. A. 105 (2008) 1494-
1498.

28
[60] K.C. Holmes, I. Angert, F. Jon Kull, W. Jahn, and R.R. Schroder, Electron cryo-microscopy shows how
strong binding of myosin to actin releases nucleotide. Nature 425 (2003) 423-427.
[61] Y. Fujiyoshi, T. Mizusaki, K. Morikawa, H. Yamagishi, Y. Aoki, H. Kihara, and Y. Harada, Development
of a superfluid helium stage for high-resolution electron microscopy. Ultramicroscopy 38 (1991) 241-
251.
[62] C. Sachse, J.Z. Chen, P.D. Coureux, M.E. Stroupe, M. Fandrich, and N. Grigorieff, High-resolution
electron microscopy of helical specimens: a fresh look at tobacco mosaic virus. J. Mol. Biol. 371 (2007)
812-835.
[63] K. Yonekura, S. Maki-Yonekura, and K. Namba, Complete atomic model of the bacterial flagellar
filament by electron cryomicroscopy. Nature 424 (2003) 643-650.
[64] A. Miyazawa, Y. Fujiyoshi, and N. Unwin, Structure and gating mechanism of the acetylcholine
receptor pore. Nature 423 (2003) 949-955.
[65] T. Fujii, A.H. Iwane, T. Yanagida, and K. Namba, Direct visualization of secondary structures of F-
actin by electron cryomicroscopy. Nature 467 (2010) 724-728.
[66] Reprinted by permission from Macmillan Publishers Ltd: Nature (T. Fujii, A.H. Iwane, T. Yanagida,
and K. Namba, Direct visualization of secondary structures of F-actin by electron cryomicroscopy. Nature
467 (2010) 724-728), copyright (2010)
[67] J.R. Bamburg, B.W. Bernstein, R.C. Davis, K.C. Flynn, C. Goldsbury, J.R. Jensen, M.T. Maloney, I.T.
Marsden, L.S. Minamide, C.W. Pak, A.E. Shaw, I. Whiteman, and O. Wiggan, ADF/Cofilin-actin rods in
neurodegenerative diseases. Curr. Alzheimer Res. 7 (2010) 241-250.
[68] B.R. McCullough, L. Blanchoin, J.-L. Martiel, and E.M. De La Cruz, Cofilin increases the bending
flexibility of actin filaments: implications for severing and cell mechanics. J. Mol. Biol. 381 (2008) 550-
558.
[69] V.E. Galkin, A. Orlova, D.S. Kudryashov, A. Solodukhin, E. Reisler, G.F. Schröder, and E.H. Egelman,
Remodeling of actin filaments by ADF/cofilin proteins. Proc. Natl. Acad. Sci. U. S. A. 108 (2011) 20568-
20572.
[70] C.A. Diebolder, A.J. Koster, and R.I. Koning, Pushing the resolution limits in cryo electron
tomography of biological structures. J. Microsc. 248 (2012) 1-5.
[71] D. Hanein, Chapter Ten - Tomography of Actin Cytoskeletal Networks. in: J.J. Grant, (Ed.), Methods
Enzymol, Academic Press, 2010, pp. 203-214.
[72] P. van der Heide, X.-P. Xu, B.J. Marsh, D. Hanein, and N. Volkmann, Efficient automatic noise
reduction of electron tomographic reconstructions based on iterative median filtering. J. Struct. Biol. 158
(2007) 196-204.
[73] E. Urban, S. Jacob, M. Nemethova, G.P. Resch, and J.V. Small, Electron tomography reveals
unbranched networks of actin filaments in lamellipodia. Nat. Cell Biol. 12 (2010) 429-435.
[74] A. Bartesaghi, P. Sprechmann, J. Liu, G. Randall, G. Sapiro, and S. Subramaniam, Classification and
3D averaging with missing wedge correction in biological electron tomography. J. Struct. Biol. 162 (2008)
436-450.
[75] A. Bartesaghi, and S. Subramaniam, Membrane protein structure determination using cryo-electron
tomography and 3D image averaging. Curr. Opin. Struct. Biol. 19 (2009) 402-407.
[76] A. Sartori, R. Gatz, F. Beck, A. Rigort, W. Baumeister, and J.M. Plitzko, Correlative microscopy:
Bridging the gap between fluorescence light microscopy and cryo-electron tomography. J. Struct. Biol.
160 (2007) 135-145.
[77] S. Kobayashi, Y. Serizawa, T. Fujita, and R.E. Coupland, SGC (Small granule chromaffin) cells in the
mouse adrenal medulla - light and electron microscopic identification using semi-thin and ultra-thin
sections. Endocrinol. Jpn. 25 (1978) 467-476.