microplastics in fisheries and aquaculture
TRANSCRIPT

1
MICROPLASTICS IN FISHERIES ANDAQUACULTURE
What do we know?Should we be worried?

2 MICROPLASTICS IN FISHERIES AND AQUACULTURE
The public interest and the scientific literature on microplastics in the aquatic environment is increasing. Publication trends suggest that the topic of marine microplastics pollution will gain further attention by the media, consumers, environmental NGOs, academia, authorities and industry.
1 FAO. 2017. Microplastics in fisheries and aquaculture. Fisheries and Aquaculture Technical Paper 615. http://www.fao.org/3/a-i7677e.pdf
Considering the growing concern on its impacts in relation to fisheries and aquaculture products, FAO responded to the international call to take stock of the knowledge available1 in this field. From an FAO perspective, issues of particular concern are the potential contamination of seafood by microplastics and the health implications for consumers, as well as the need for a better understanding of the impacts of microplastics on fish populations.
This report looks into the issue of microplastics from the fisheries and aquaculture perspective. It is based on existing scientific literature and benefitted from the contribution of a group of experts who assessed the potential impact of microplastics and related contaminants on fish consumers’ health and the ecological implications for aquatic organisms. This booklet summarizes the main findings of the report at the attention of policy makers and general audience.
615 Micro
plastics in
fish
eries and
aqu
acultu
re: status o
f kno
wled
ge o
n th
eir occu
rrence an
d im
plicatio
ns fo
r aqu
atic org
anism
s and
foo
d safety FA
O
This report looks into the issue of microplastics from the fisheries and aquaculture perspective. Based on existing scientific literature, a group of
experts assessed the potential impact of microplastics and related contaminants on fish consumers’ health and the ecological implications for aquatic organisms. A workshop
was organized with invited experts (Rome, 5-8 December 2016) who complemented the published information and carried out a risk profiling of microplastics in aquaculture and fishery products. Despite the large amount of scientific data available, there are still significant knowledge gaps,
in particular regarding impacts at fish population and community level, detailed data for a proper risk assessment and implications of nanoplastics presence in the marine environment.
Nonetheless, measures should be taken at international, governmental and consumer levels to undertake cost-effective ecological and seafood safety risk assessments on
micro- and nanoplastics and associated polymers, to reduce plastic use and encourage the use of alternative materials, recycling and the adoption
of sustainable practices in using plastics and managing plastic pollution.
615
FAOFISHERIES
ANDAQUACULTURE
TECHNICALPAPER
ISSN 2070-7010
Microplastics in fisheriesand aquacultureStatus of knowledge on their occurrence and implicationsfor aquatic organisms and food safety
I7677EN/1/08.17
ISBN 978-92-5-109882-0
9 7 8 9 2 5 1 0 9 8 8 2 0
ISSN 2070-7010
C
M
Y
CM
MY
CY
CMY
K
COVER-615-FINAL.pdf 1 09/08/2017 15:55:01

3What do we know? Should we be worried?
WHAT ARE MICROPLASTICS?
Figure 1
Size ranges of plastics in the marine environment from mega to nanoplastics
Plastic is a general term for a range of polymer materials with different properties. Depending on the requirements of the end product, these polymers are mixed with different additives to enhance their performance (plasticizers, antioxidants, flame retardants, ultraviolet stabilizers, lubricants, colorants). There are many types of plastics but five dominate the global production: polyethylene, polypropylene, polyvinylchloride, polystyrene, and polyethylene terephthalate (GESAMP, 2015).
Microplastics are small particles and fibres of plastic. There is no recognised standard for the maximum particle size but they are generally considered to be particles measuring less than 5 millimetres in diameter, a classification that includes nano-size plastics which are fragments measuring less than 100 nanometres2. They are largely classified by their morphological characteristics: size, shape and colour. Size is in particular an important factor when studying microplastics as it dictates the range of organisms it may affect (Figure 1).
2 1 nanometre = 10-9 m = 10-6 mm = 10-3 µm
Plastic bottle cap
Cigarette filter
Polystyrene pellets
3 mm
2 mm1 mm
Great black-backed gull
28 mm
77 mm
6 mm
Size does matter
Part
icle
invi
sibl
e to
nak
ed e
ye
ANIMAL GROUPS AFFECTED BY ENTANGLEMENT, SUFFOCATION AND / OR INGESTIONDebris
size category
1 metre
2.5 centimetre
5 millimetre
Whales, seals, dolphins,
turtles, birds
Birds, fish,invertebrates
Fish, invertebrates,other filter feeders
Invertebrates,other filter feeders
1 micron
MEGA
MACRO
MESO
MICRO
NANO
Source: UNEP and GRID-Arendal (2016)

4 MICROPLASTICS IN FISHERIES AND AQUACULTURE
WHERE DO MICROPLASTICS COME FROM?
Global plastic production and use has increased exponentially since the 1950s, reaching over 320 million tonnes in 2015. Given the growing market demand for plastic products, the production is expected to exceed 1 billion tonnes by 2050. Microplastics originate from a wide range of sources (Figure 2) and are divided into two main groups:
• Primary microplastics intentionally manufactured to be of a particular size. Examples include: pellets, powders, and domestic and industrial abrasives.
• Secondary microplastics result from the breakdown of larger materials, i.e. fragmentation of macroplastics (e.g. plastic bags, food packaging, ropes) or the release of microplastics from terrestrial transportation (e.g. abrasion of car tyres during use is the most significant source).
Initially, microplastics were derived from abrasion, degradation, and physical breakdown originating mainly from land-based sources. More recently, manufacturing of plastics at the micro- and nano-scale have further exacerbated environmental occurrence and potential risks. First reports of plastic contamination from plastic debris of various sizes occurred as early as the 1960s, based on studies of stranded seabirds.
In the fisheries and aquaculture sector, plastic is commonly used for manufacturing fishing gears, cages, buoys, as well as boat construction and maintenance. Boxes and packaging material of plastic are used for the transportation and distribution of fish products. In addition, abandoned, lost or otherwise discarded fishing gears (ALDFGs) are considered one of the main maritime sources of plastic marine litter. These uses of plastic in the fisheries and aquaculture sector are all potential sources of microplastics. However, there is no quantification available on the contribution of the sector to the overall input of microplastics in the marine environment. Source: GESAMP (2016)
Fragmentation& degradation
Examples of marine litter coming from fisheries and aquaculture
Plastic producersFabricators & recyclers
Food and drink packagingCosmetics and personal care productsTextiles and clothing
Solid wasteWater & waste water
Cages
Producers / converters
Sectoral consumers
Individual consumers
Waste management
AgricultureFisheriesAquacultureConstructionTerrestrial transportationShipping/offshore industryTourism industry
Boxes
Buoys
Figure 2
Sources of plastics reaching the marine environment
MICRO-PLASTICS
MACRO-PLASTICS

5What do we know? Should we be worried?
Microplastics can be found in the following five main compartments of the aquatic environment: the ocean surface, the water column, the seafloor, the shoreline and in biota. However, there is a lack of data on the amount of plastic in each compartment and almost no knowledge about the fluxes between these compartments. There is even less known about microplastics in freshwater environments. The movement of microplastics is complex and driven by many factors including winds, buoyancy, biofouling, polymer type, size
WHAT ARE THE DYNAMICS OF MICROPLASTICS IN THE AQUATIC ENVIRONMENT?
Figure 3
Model results for plastic particles global density (pieces km−2; see colorbar) in four size classes (0.33–1.00 mm, 1.01–4.75 mm, 4.76–200 mm, and >200 mm).
0.33-1.00 mm
4.76-200 mm
1.01-4.75 mm
>200 mm
and shape, local and large-scale currents, and wave action (GESAMP, 2016). Attempts to model the spatial distribution of microplastics produced an overview of accumulation zones at the global scale and highlighted the differences in amounts of microplastics between regional and local areas that can be of several orders of magnitude. Areas of major presence of microplastics are in the Mediterranean Sea, the Seas of East and Southeast Asia and in the equatorial convergence zones (gyres) of the North Atlantic and North Pacific (Figure 3).
Source: Eriksen et al. (2014)
1 000 000
100 000
10 000
1 000
100
10
1

6 MICROPLASTICS IN FISHERIES AND AQUACULTURE
Observations of microplastic uptake by aquatic wildlife have been reported in a range of habitats, including the sea surface, water column, benthos, estuaries, beaches (Figure 5) and aquaculture facilities. Over 220 different species have been found to ingest microplastic debris in natural conditions. Excluding birds, turtles and mammals, 55 percent are species (invertebrates to fish) of commercial importance, such as: mussels, oysters, clams, brown shrimp, Norway lobster, anchovies, sardines, Atlantic herring, Atlantic and chub mackerels, scads, blue whiting, Atlantic cod, common carp and Acoupa weakfish, among others (GESAMP 2015, 2016).
In wild aquatic organisms, microplastics have only been observed in the gastrointestinal tract (i.e. gut) so far, usually in small numbers. Very few scientific works have investigated the ecological effects of microplastics at population or species assemblage level in aquatic environments and hence there is limited knowledge on the capacity of microplastics
to alter ecological processes, nor direct evidence of trophic transfer of microplastics in wild populations. Experimental studies carried out in controlled environments concluded that biodegradable and conventional larger-sized plastic might affect species richness, as well as the total number of organisms and affect the primary productivity of habitats (Green, 2016; Green et al., 2017).
Adverse effects of microplastics ingestion have been observed in aquatic organisms under laboratory conditions, usually at very high exposure concentrations that exceed current environmental concentrations by several orders of magnitude. Under such conditions, and when individuals were chronically exposed, microplastics have shown to have a negative effect on fecundity, larval survival and suitable development. However, little is known about the capacity of microplastics to alter ecological processes and to accumulate through trophic transfer in natural conditions.
Figure 4
Microplastics in water: additives leaching and contaminants sorption patterns
WHAT ARE THE ENVIRONMENTAL IMPACTS OF MICROPLASTICS?
Microplastics contain additives, a mixture of chemicals added during manufacture that can leach into the surrounding environment (Figure 4). Microplastics also efficiently sorb persistent bioaccumulative and toxic contaminants (PBTs) that are present in the marine environment, such as persistent organic pollutants (POPs). In addition, microplastics serve as substrate for the settlement of living organisms like marine invertebrates, microalgae, bacteria, fungi or viruses, some of which are potential pathogens.
Particle matrixcontains additives
Particle floats near organic contaminants
Additives leachto waters
Contaminants sorb to particle
sorption
leaching

7What do we know? Should we be worried?
Figure 5
Interaction of microplastics with marine organisms and potential trophic transfer to humans.
Marinemammals
Cephalopods
Algae Bivalves
Annelids
Crustaceans
Holothurians
Demersal fish
Mesopelagic fish
Zooplankton
Zooplankton
Pelagic fish
Sea birds
Zooplankton
Crustaceans
Blue dots represent micro plastic particles and the black dotted arrows indicate an observed interaction between organism and particle (direct ingestion/uptake). The black arrows indicate indirect ingestion of MPs (potential trophic transfer). The yellow lines indicate potential route of micro plastics to humans following ingestion of seafood. Finally, arrow thickness represents potential bioaccumulation of particles through the foodweb.
8 MICROPLASTICS IN FISHERIES AND AQUACULTURE
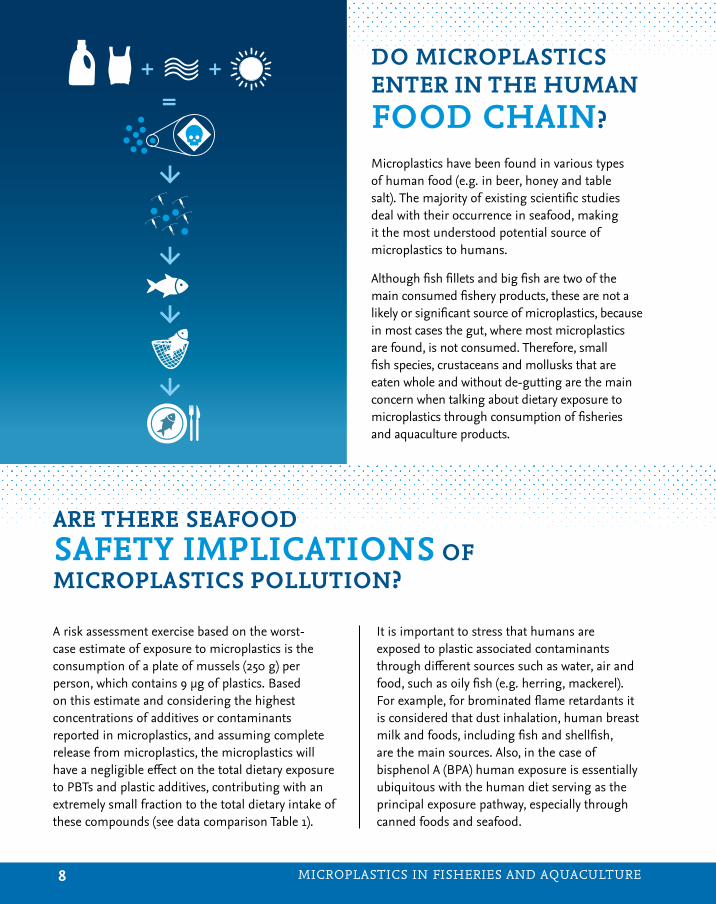
Microplastics have been found in various types of human food (e.g. in beer, honey and table salt). The majority of existing scientific studies deal with their occurrence in seafood, making it the most understood potential source of microplastics to humans.
Although fish fillets and big fish are two of the main consumed fishery products, these are not a likely or significant source of microplastics, because in most cases the gut, where most microplastics are found, is not consumed. Therefore, small fish species, crustaceans and mollusks that are eaten whole and without de-gutting are the main concern when talking about dietary exposure to microplastics through consumption of fisheries and aquaculture products.
DO MICROPLASTICS ENTER IN THE HUMAN FOOD CHAIN?
ARE THERE SEAFOOD SAFETY IMPLICATIONS OF MICROPLASTICS POLLUTION?
A risk assessment exercise based on the worst-case estimate of exposure to microplastics is the consumption of a plate of mussels (250 g) per person, which contains 9 µg of plastics. Based on this estimate and considering the highest concentrations of additives or contaminants reported in microplastics, and assuming complete release from microplastics, the microplastics will have a negligible effect on the total dietary exposure to PBTs and plastic additives, contributing with an extremely small fraction to the total dietary intake of these compounds (see data comparison Table 1).
It is important to stress that humans are exposed to plastic associated contaminants through different sources such as water, air and food, such as oily fish (e.g. herring, mackerel). For example, for brominated flame retardants it is considered that dust inhalation, human breast milk and foods, including fish and shellfish, are the main sources. Also, in the case of bisphenol A (BPA) human exposure is essentially ubiquitous with the human diet serving as the principal exposure pathway, especially through canned foods and seafood.

9What do we know? Should we be worried?
Compound Highest concentration in microplastics (ng/g)*
Calculated intake from microplastics (pg/kg bw/day)**
Total intake from the diet (pg/kg bw/day)**
Ratio intake microplastics/total dietary intake (%)
ContaminantsNon-dioxin like PCBs 2 970 0.3
EFSA, 2012 4 300a 0.007JECFA, 2016 1 000a 0.03
PAHs 44 800 4.5EFSA, 2008 28 800b 0.02JECFA, 2006 4 000c 0.1
DDT 2 100 0.2EFSA, 2006 5 000d 0.004JECFA, 1960 100 000 000l 0.0000002
Additives/monomersBisphenol A 200 0.02
EFSA, 2015a 130 000e 0.00002FAO/WHO, 2011 400 000f 0.000005
PBDEs 50 0.005EFSA, 2011 700g 0.0007JECFA, 2006 185h 0.003
NP 2 500 0.3 NAi
OP 50 0.005 NAi
Even though it is known that microplastics distribution is ubiquitous, there is currently no reliable quantitative and global estimate of their presence in the various compartments of the marine environments. Quantifying their occurrence would help focus on hot spots to collect more detailed information and identify suitable solutions.
WHAT DO WE STILL NEED TO KNOW?
It is expected that in the near future, microplastics contamination can only increase and will add to the current environmental stresses on fisheries resources. Filling the research gap on microplastic impacts at population and species assemblage levels would help understand better the implications for fisheries and aquaculture resources.
a lowest intake of 6 indicators of non-dioxin like PCBs, representing about 50 percent of all non-dioxin like PCBs
b median intake (EFSA, 2008)c mean intake of benzo[a]pyrene (JECFA)d lowest intake, DDT and related compounds (EFSA,
2006)e average intake adults (EFSA, 2015a)f lowest intake FAO/WHO
g lowest intake, sum of BDE-47, -209, -153, -154 (EFSA, 2011)
h lowest intake JECFAi NA: dietary intake not available from EFSA or
JECFAl provisional tolerable daily intake (JECFA)
Note: PCBs (Polychlorinated biphenyls), PAHs (Polycyclic aromatic hydrocarbons), DDT (Dichlorodiphenyltrichloroethane),
PDBEs (Polybrominated diphenyl ethers), NP (Nonylphenol), OP (Octylphenol)
EFSA: European Food Safety Authority perspective.JECFA: The Joint FAO/WHO Expert Committee on Food Additives
* ng/g: nanograms per gram** pg/kg bw/day: picograms per kilogram by
weight per day
Source: Lusher, Hollman and Mendoza-Hill (2017)
Table 1
Comparison of the calculated intake of contaminants and additives (worst case scenario) directly from microplastics in seafood and the total dietary intake of these compounds

10 MICROPLASTICS IN FISHERIES AND AQUACULTURE
WHAT CAN WE DO?
Plastic and microplastic contamination is an increasing trend that can only add to the environmental stress that fisheries and aquaculture resources are facing. Therefore, there is a great need to raise awareness and find suitable solutions on how to cut the sources and loadings of microplastics in the marine environment.
Cutting the sources of plastic is a collective effort involving all sectors (transport, industry, sewage, maritime …). For the fisheries and aquaculture sector, seeking and finding valid alternatives to plastic use where feasible, eliminating the discard of plastic at sea (e.g. fishing gear, strapping bands, gloves, styrofoam fish boxes, aquaculture buoys, etc.), modifying gears or fishing practices to minimise risk of fragmentation (e.g. ground ropes) and accidental loss would contribute to a decrease in the sources of microplastics. This includes the minimization of abandoned, lost or otherwise discarded fishing
gears (ALDFGs) that are currently the main source of marine litter coming from the sector.
Risk assessment, communication and management of microplastics in seafood need to be well-targeted and cost-effective in order to provide reliable results in various contexts taking into account pollution intensity and local and regional seafood consumption patterns.
Given the numerous data and information gaps that persist, especially in developing countries, there is a stringent need for capacity development to support monitoring and research to increase knowledge, including through the standardization of the current analytical methods for microplastics (including nanoplastics) detection and quantification in environment (water, sediments and biota), food, human tissues and blood. This would help understand the risks involved, as well as its implications for fisheries and aquaculture resources and food safety.
The size of the microplastic is a critical factor as it conditions their capacity to cross the cell membranes of gastrointestinal tract and the bloodstream of animals and humans. In this respect, microplastics have limited or no capacity, whereas nanoplastics are likely to be able to cross cell membranes which could lead to internal exposure. Still, microfibres may be relatively long but the shape or aspect ratio may allow them to penetrate cell membranes (Hann et al. 2017). However, there are currently no methods available for detection and quantification of nanoplastics and this gap needs to be filled. Studies on nanoplastics dynamics and impacts would be relevant both from the ecological and human health perspective.
The toxicity of several additives and contaminants associated with microplastics that may be present in seafood is well established and the human health risk due to consumption of fishery and aquaculture products is known to be negligible. However the toxicity of the most common plastic monomers and polymers present in these products and some of the plastic additives has not been evaluated.
Although it has been documented that plastic debris can act as a substrate for diverse microbial communities, sufficient data are lacking to include pathogens in any risk profiling on microplastics exposure through seafood consumption.

11What do we know? Should we be worried?
EFSA (European Food Safety Authority). 2006. Opinion of the Scientific Panel on Contaminants in the Food Chain on a Request from the Commission related to DDT. EFSA J., 433: 1-69.
EFSA. 2008. Polycyclic aromatic hydrocarbons in food: Scientific opinion of the Panel on Contaminants in the Food Chain. EFSA J., 6(8):724, 114 pp. doi:10.2903/j.efsa.2008.724
EFSA. 2011. Scientific Opinion on Polybrominated Diphenyl Ethers (PBDEs) in Food. EFSA J., 9(5): 2156
EFSA. 2012. Update of the monitoring of levels of dioxins and PCBs in food and feed. EFSA J., 10(7): 2832, 82 pp. doi:10.2903/j.efsa.2012.2832
EFSA. 2015a. Scientific Opinion on the risks to public health related to the presence of bisphenol A (BPA) in foodstuffs: Part I − Exposure assessment. EFSA J., 13(1): 396
Eriksen, M., Lebreton, L.C.M., Carson, H.S., Thiel, M., Moore, C.J., Borerro J.C., Galgani, F., Ryan, P.G., Reisser, J. 2014. Plastic Pollution in the World’s Oceans: More than 5 Trillion Plastic Pieces Weighing over 250,000 Tons Afloat at Sea. PLOS ONE 9(12): e111913. https://doi.org/10.1371/journal.pone.0111913
GESAMP. 2015. “Sources, fate and effects of microplastics in the marine environment: a global assessment”. (Kershaw, P. J., ed.). (IMO/FAO/UNESCO-IOC/UNIDO/WMO/IAEA/UN/UNEP/UNDP Joint Group of Experts on the Scientific Aspects of Marine Environmental Protection), Rep. Stud. GESAMP No. 90, 96 p.
GESAMP. 2016. “Sources, fate and effects of microplastics in the marine environment: part two of a global assessment” (Kershaw, P.J., and Rochman, C.M., eds). (IMO/FAO/UNESCO-IOC/UNIDO/WMO/IAEA/UN/UNEP/UNDP Joint Group of Experts on the Scientific Aspects of Marine Environmental Protection). Rep. Stud. GESAMP No. 93, 220 p.
Green, D. S. 2016. Effects of microplastics on European flat oysters, Ostrea edulis and their associated benthic communities. Environ. Pollut., 216: 95-103.
Green, D.S., Boots, B., Sigwart, J., Jiang, S. & Rocha, C. 2016. Effects of conventional and biodegradable microplastics on a marine ecosystem engineer (Arenicola marina) and sediment nutrient cycling. Environ. Pollut., 208: 426-434.
Hann, S. et al. 2017. Investigating options for reducing releases in the aquatic environment of microplastics emitted by (but not intentionally added in) products. Interim Report. http://www.eunomia.co.uk/reports-tools/investigating-options-for-reducing-releases-in-the-aquatic-environment-of-microplastics-emitted-by-products/
Lusher, A.L., Hollman, P.C.H. & Mendoza-Hill, J.J. 2017. Microplastics in fisheries and aquaculture: status of knowledge on their occurrence and implications for aquatic organisms and food safety. FAO Fisheries and Aquaculture Technical Paper. No. 615. Rome, Italy. http://www.fao.org/3/a-i7677e.pdf
UNEP and GRID-Arendal. 2016. Marine Litter Vital Graphics. United Nations Environment Programme and GRID-Arendal. Nairobi and Arendal. www.unep.org, www.grida.no
REFERENCES

12 MICROPLASTICS IN FISHERIES AND AQUACULTURE
TAKE-HOME MESSAGES
Contacts: [email protected]
Microplastics are everywhere and numbers are likely to increase in a near future
Fisheries and aquaculture are relatively minor contributors compared to other sectors
Experimental studies show some negative impacts on marine animals (at very high exposures), but there are currently no reliable data on wild populations
From a food safety point of view, ingestion of microplastics through seafood consumption is responsible for an exposure to contaminants that is negligible compared to other sources
Future research as well as risk analysis and management need to focus on the smaller particles (small microplastics, micro-fibres and nanoplastics) that have the capacity to enter and cross cell membranes
Fisheries and aquaculture products are important in many diets as a source of essential nutrients. On the basis of current evidence, the risk of not including fish in our diets is far greater than the risks posed by exposure to plastic-related contaminants in fish products.
Some rights reserved. This work is availableunder a CC BY-NC-SA 3.0 IGO licence ©
FAO
, 201
9C
A35
40E
N/1
/02.
19