micropatterned surface electrode for massive selective ... · antonio sirid,e luca pellegrinoe a...
TRANSCRIPT

1
Micropatterned surface electrode for massive selective stimulation of
intraepidermal nociceptive fibres.
Massimo Leandria,b
Lucio Marinellia,b,c
Antonio Sirid,e
Luca Pellegrinoe
a) Department of Neuroscience, Rehabilitation, Ophthalmology, Genetics, Maternal and Child
Health (DINOGMI), University of Genova, L.go Daneo 3, 16132 Genova, Italy
b) Interuniversity Centre for Pain Neurophysiology (CIND), University of Genova, Via
Dodecaneso 35, 16146 Genova, Italy
c) Department of Neuroscience, Ospedale Policlinico San Martino, L.go R. Benzi 10, 16132
Genova, Italy
d) Physics Department, University of Genova, Via Dodecaneso 33, 16146 Genova, Italy
e) National Research Council. CNR-SPIN, Corso Perrone 24, Genova, 16152, Italy
Corresponding author:
Massimo Leandri.
Department of Neuroscience, Rehabilitation, Ophthalmology, Genetics, Maternal and Child Health
(DINOGMI), University of Genova
L.go Daneo, 3,
16132 Genova, Italy
Email: [email protected]
Tel. +39-010-3537081
The article has been published as: Leandri M, Marinelli L, Siri A, Pellegrino L. Micropatterned
surface electrode for massive selective stimulation of intraepidermal nociceptive fibres. Journal of
Neuroscience Methods 293C (2018) pp. 17-26. doi: 10.1016/j.jneumeth.2017.08.032. PubMed
PMID: 28899650.

2
Abstract
Background
No satisfactory neurophysiological test for nociceptive afferents is available to date. Laser stimuli
present risks of skin damage, whilst electrical stimulation through specially designed electrodes is
not selective enough.
New Method
We present a new electrode designed according to critical issues identified in preliminary computer
simulations concerning electric field gradient through the skin. To provide selective stimulation the
activating electric field must be limited to intraepidermal free nerve endings. To this end, a new
interdigitated electrode (IDE) was made of conductive rails arranged in a comb-like micropattern,
situated only 150 m apart from each other (150 IDE) and alternately connected to the opposite
poles of the stimulator.
Results
Evoked potentials recorded from the scalp were obtained after stimulation with the 150 IDE and
with a similarly designed, but more widely spaced electrode (1000 m, or 1000 IDE). Small
amplitude early and medium latency components were recorded with the 1000 IDE, suggesting
activation of A fibres. On the other hand, the 150 IDE only evoked late responses, confirming
sufficient selectivity in small fibre activation.
Comparison with existing method(s).
The main differences with existing electrodes are:
1) Microspaced interdigitated conductive rails.
2) The potentially unlimited surface of stimulation and high efficiency per surface unit,
resulting in large numbers of activated nociceptors.
3
Conclusions
A new electrode providing selective stimulation of nociceptive nerve free endings is presented. It is
non-invasive, and its surface can be enlarged at will. It is expected that it may greatly help in
neurophysiological assessment of conditions affecting the nociceptive pathway.
Keywords
Pain
Free nerve endings
Electrode
Micropattern
Evoked potentials
Stimulation
Acronyms
150 IDE (150 m interdigitated electrode)
1000 IDE (1000 m interdigitated electrode)
LEP (laser evoked potential)
PREP (pain related evoked potential)
SEP (somatosensory evoked potential)

4
1 Introduction
One of the mainstays of clinical electrophysiology is the ability to record activity of the nervous
system evoked by suitable stimuli delivered to peripheral nerves or receptors. Refinements of
hardware and software have brought important advances in detecting very small signals, even when
embedded within undesired noise, provided that stimulus synchronization is feasible. Most of the
techniques used so far allow objective and very reliable assessment of the nervous transmission,
completely independent from the subject’s alertness.
Unfortunately, such highly sophisticated tests are only suitable to explore the fast conducting fibres.
So far, no electrophysiological method allows similar precision nor independence from the subject’s
collaboration when the transmission through small myelinated (A ) or unmyelinated (C) fibres is
concerned.
Two challenges are to be overcome. First, the selective stimulation of these two groups of fibres.
Second, the recording of action potentials that are thousands of times smaller than those of the large
fibres (unless they are “amplified” by the associative areas of the cortex, but this is another story).
In this paper we address the first challenge, that is selective stimulation. The best method developed
so far is an infrared laser pulse, irradiating thermal energy in a short period of time, from 5 to 50
ms, and absorbed by the superficial layer of the skin, where only the free nerve endings of A and C
fibres are situated. Long latency evoked responses are thus recorded from the scalp, related to the
stimulus (Treede et al., 2003). However, there are several drawbacks: the heat pulse damages the
skin, so it can only be repeated a few times, and never on the same spot; the device is costly, and,
because the irradiated spot has very limited area, only a few afferents can be excited. In addition,
the selectivity of solid state lasers has been questioned, as their radiation penetrates deep enough to
also activate non-nociceptive receptors and fibres (Leandri et al., 2006). A simpler, but even more
debated method, is represented by electrical pulses delivered through electrodes designed so that the
generated field would stay superficial enough (Katsarava et al., 2006; Inui and Kakigi, 2012).
5
Unfortunately, the performance of the electrodes so far proposed has been challenged by a number
of experiments, questioning their selectivity (Perchet et al., 2012). The electric stimulus in principle
has optimal characteristics of control, ease of generation and delivery, instantaneous propagation
(so that a number of fibres or receptors can be depolarized at the same time) and ease of
synchronization with recording devices. We thought that the properties of the electric stimulus
could be exploited provided the stimulating electrode could be designed in a more sophisticated
manner. We investigated the existing electrodes, tested them with computer simulations as to the
generated electric field, and here propose a new electrode which according to our simulation and
experimental tests generates electric fields superficial enough to be selective for free nerve endings
and at the same time able to activate a large number of receptors.
2 Materials and methods
2.1 Computer simulation
Finite element analysis of the electrode performance was carried out using Comsol Multiphysics®
4.3b (electric currents module) with a Intel® Core™ i7-3820 CPU @3.6GHz equipped with 64 Gb
of RAM.
We studied the static response of the electrode considering a pure resistive model of the human skin
adapted from one previously proposed (Mørch et al., 2011). It consisted of 4 layers: stratum
corneum (thickness 29 μm), epidermis (60 μm), dermis (1300 μm) and hypodermis (5000 μm)
having different conductivity values (stratum corneum σ = 5x10⁻⁴
S/m, epidermis σx = 0.95 S/m σy
= 0.15 S/m, dermis σx = 2.57 S/m σz = 1.62 S/m, hypodermis σ = 2x10⁻²
S/m). The conductivity of
the stratum corneum was set to match the resistance of our 150 m and 1000 m interdigitated
electrodes (see section 2.3) measured in real experimental conditions. The voltage polarization and
the ground conditions were applied to cathode and anode line regions with same dimension as the
electrodes and which rested on the upper boundaries of the stratum corneum. Continuity conditions
for current were set in the inner boundaries (interfaces between the layers), while electric insulation
6
conditions were set for the external boundaries. Free triangular meshes were employed for all
layers, with maximum and minimum element size of 5 m and 0.2 m and 10(x):1(y) aspect ratio
(y-direction scale =10) for both the stratum corneum and epidermis layers. Free triangular meshes
with 1:1 aspect ratio and predefined “extremely fine” conditions were used for the dermis and
hypodermis layers.
2.2 Subjects
All recordings were performed on ten healthy volunteers, 8 males and 2 females, ranging in age
from 24 to 35 years, from the medical personnel of the Department of Neuroscience. All of them
gave informed consent for the procedure and data treatment. The procedures were totally non-
harmful and the study was carried out in accordance with the Code of Ethics of the World Medical
Association (Declaration of Helsinki) for experiments involving humans. The study had been
approved by the local ethics committee.
2.3 Electrodes
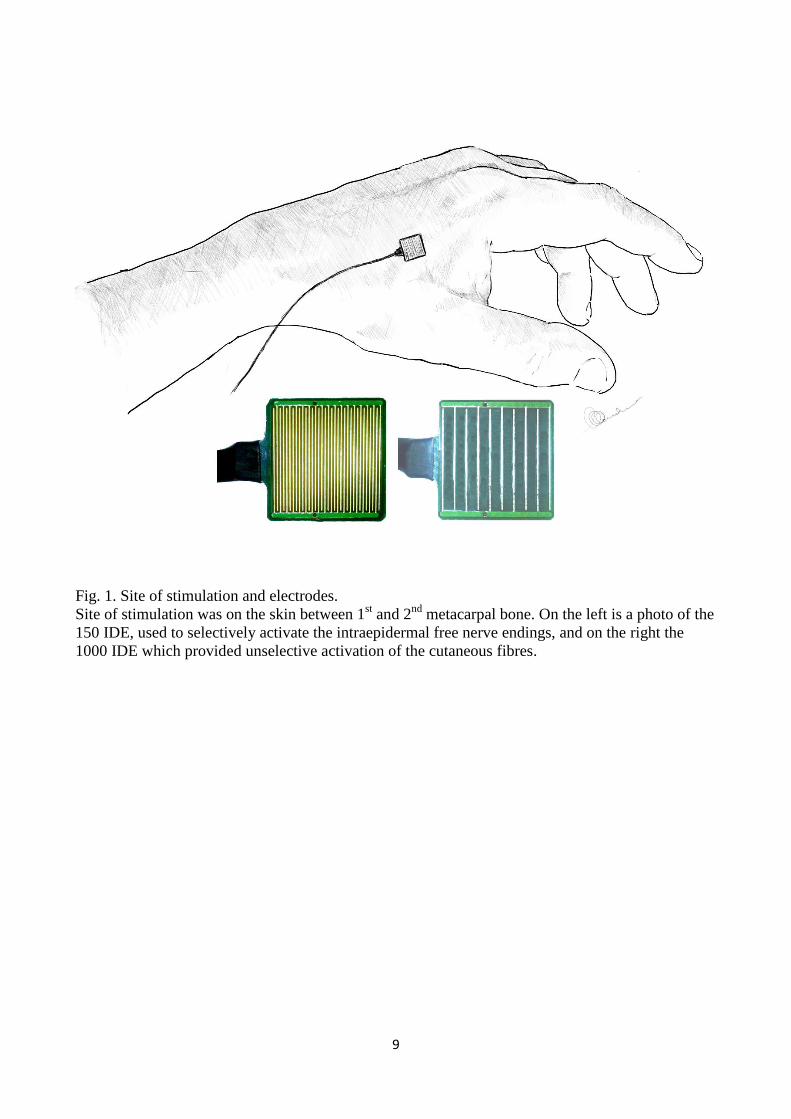
Three types of stimulating electrodes were used in the real experiments: i) a micropatterned
interdigitated electrode with inter-rail distance and rail width of 150 m (from now on named 150
IDE) (Fig. 1, bottom left), which was intended to stimulate the intraepidermal free nerve endings
only; ii) a micropatterned interdigitated electrode with inter-rail distance of 1000 m and rail width
of 150 m (from now on named 1000 IDE) (Fig. 1, bottom right), intended to stimulate deeper
intradermal nerve fibres and iii) traditional, self-adhesive electrodes for surface stimulation of
peripheral nerves, which will be referred to as “classic electrodes” in the text to follow.
The 150 IDE is the main object of this paper. It was designed and built as a prototype by three of
the authors (M. Leandri, L. Pellegrino and A. Siri). The invention has been registered as Italian
Patent n. 1425199, also published as WO/2015/186087, joint property of the University of Genova
and Italian National Research Council (CNR). The 150 IDE and the 1000 IDE used in the
experiments were made under licence by Bionen (Florence, Italy). They were made of a glass epoxy

7
substrate with a micropattern of gold conductor rails which interdigitated in a double comb-like
fashion. Each of the two “combs” was connected to one of the stimulator poles. The area covered
by these electrodes was in either case 10 x 10 mm.
The classic electrodes were type SilveRest by Vermed (Buffalo, New York), with dimension of 25
x 22.86 mm.
2.4 Sites of stimulation
The 150 IDE and 1000 IDE were always applied to the hairy skin of the hand dorsum between the
1st and 2
nd metacarpal bone of the non dominant side (Fig. 1). Hairy skin was chosen because it is
richly innervated by AMH II nerve endings (Treede et al., 1995), the main target of our work. The
skin was gently cleansed with cotton wool moistened with ethanol then left to dry. The procedure
had the advantage of cleansing the surface and reducing possible perspiration. Deliberately, no gel
was used, to avoid electric shorting of the electrode rails.
In three subjects, the median nerve was stimulated at the wrist with the classic electrodes, cathode
proximal.
2.5 Electric stimuli
Electric pulses of 0.2 ms duration were always used. These were delivered either as single or in
bursts of 3, 5, 8, 10, according to the experimental design (see Section 2.8). The period inside the
burst was 1 ms, so that a burst of ten pulses, for example, had an overall duration of 10 ms.
We used a constant voltage stimulator (EbNeuro, Florence, Italy), while voltage and current applied
to the electrode were monitored through a purpose built optical isolator and read on the screen of an
oscilloscope (TDS2004C, Tektronix, Beaverton, Oregon). Measured with this method, the
impedance of the 150 IDE usually varied between 3 and 5 kOhm, and that of the 1000 IDE was 7-
10 kOhm. In order that a perception threshold could be reached with the 150 IDE, a voltage of no
less than 40-50 V had to be delivered. At the same time, a minimum current of 2-5 mA was
necessary. The rate of stimulation was varied according to the experiment, as detailed in Section
2.8. Stimulus strength was set at 1.1-1.2 times the sensory perception threshold. Since its very
8
threshold, perception was always a moderately painful, localized pricking sensation with the 150
IDE. When the 1000 IDE was used, the subject also perceived a pricking sensation, but together
with an electric shock like sensation irradiating towards the 2nd
finger. The perception threshold
with the 1000 IDE was reached at 1-2 mA, with voltages ranging between 50 and 70 V. As before,
the stimulus strength was set slightly above the perception threshold.
2.6 Recording sites
Responses were recorded from the Erb site and from the scalp derivations Cz-Auc, and C3’/C4’-Fz.
At the Erb site, two subdermal needle electrodes were placed along and just behind the clavicle of
the stimulated side, with the distal electrode connected to the non inverting input of the differential
amplifier, and the proximal one connected to the inverting input.
On the scalp, the “active” electrode was always connected to the non inverting input of the
amplifier, whilst the reference was connected to the inverting input.
In order to make our traces comparable to those of the literature, a polarity reversal was performed
by software, and in all our figures an upward deflection signifies a negative potential applied to the
non inverting input.
2.7 Signal amplification and processing
Signals were amplified 100,000 times, with bandpass 0.1-2000 Hz, 2nd
order Butterworth analogue
filtering (LT Bioamplifiers by Vertigo, Genova, Italy). They were then sent to an analogue to digital
converter (NI PCIe-6320, X Series Multifunction DAQ, 16 bit, 250 KS/s sampling rate by National
Instruments, Austin, Texas). Dedicated software, based upon the graphic language LabView 2014®
(National Instruments, Austin, Texas), acquired 20,000 samples for 1000 ms after each stimulus,
thus providing a high definition recording with a dwell time of 0.05 ms. Each single response was
stored onto hard disc and kept for off line averaging.
9
Fig. 1. Site of stimulation and electrodes.
Site of stimulation was on the skin between 1st and 2
nd metacarpal bone. On the left is a photo of the
150 IDE, used to selectively activate the intraepidermal free nerve endings, and on the right the
1000 IDE which provided unselective activation of the cutaneous fibres.
10
2.8 Design of experiments
2.8.1 Set 1.
This was a preliminary set of experiments which was performed in 3 subjects, to check the response
of peripheral nerve fibres to electric single pulses and to bursts (see 2.5 section for details). To do
so, we used the median nerve, where the nerve trunk could easily be accessible at the wrist and high
amplitude responses could be recorded at the Erb point (Fig. 5). Traditional bipolar stimulation with
classic electrodes was used. Stimulation was performed at 1.5 times the intensity of the motor
threshold for a thumb twitch, which ranged between 12 and 15 mA.
2.8.2 Set2.
The aim was to deliberately stimulate intraepidermal free nerve endings (A and C) and
subepidermal A fibres of the hand dorsum skin, to compare early responses. Both 150 IDE and
1000 IDE were used, with repetitive fast stimulation (approximately 500 stimuli, with rate of 0.7/s).
Recordings were performed from Erb point and C3’/C4’-Fz (Fig. 6 and Fig. 7). We used a burst of
5 pulses in order to allow recording of Erb point responses, which would have been hidden by the
stimulus artefact with a longer burst.
2.8.3 Set 3.
This setting was aimed at stimulating the hand dorsum with 150 IDE electrode using random slow
stimulation (20-30 stimuli with 10-20 s intervals) and recording from Cz-Auc and C3’/C4’-Fz. Fig.
8). We asked the subjects to direct their attention towards the stimulus by counting the number of
deliveries and by reporting changes in perception.
3 Results
3.1 Computer simulations of the electric field generated by our electrodes
All simulations were performed as 2 dimensional models, with the following parameters, according
to the electrode types: i) 5.0 mm width and 6.389 mm height for the 150 IDE (Fig. 2a) and 1000IDE
(Fig. 2b) micropatterned electrodes; ii) 10mm radius and 6.389 mm height for the axis-symmetric
11
model of the ring concentric electrode (Katsarava et al., 2006) (Fig. 2c); iii) 100mm width and
31.389 mm height for the classic electrode (Fig. 2d).
Fig. 2 shows the calculated distribution of the electric current for all three types of the experimental
electrodes (the 150 IDE, the 1000 IDE, and the classic electrodes), plus the concentric electrode
introduced by Katsarava et al. (Katsarava et al., 2006), that, although not tested in our experiments,
was of interest in the simulations for comparison purposes. Calculations were performed on a 2D
section of the electrodes as indicated in the figure. The alternated sequence of cathodic and anodic
regions for the 150 IDE and 1000 IDE resulted in the electric current being distributed beneath the
surface of the entire electrode, mainly in the stratum corneum and epidermis region. In the case of
the circular electrode, the current was localized mainly under the central cathode, peaking at its
edge.
The classic electrode (two SilveRest 25 x 22.86 mm placed in contact with the skin and 10 mm
apart from each other) was modelled using a 2D model on a vertical cross section, as indicated in
Fig. 2d, based on the same layered skin structure as that used for the micropatterned electrodes with
the only exception of an increased width of the skin model (100 mm) and height of the hypodermis
(30 mm). The electric current for the classic electrode yielded high values in the stratum corneum of
the epidermis and also all over the dermis region between the anode and cathode, as shown in Fig.
2d.

12
Fig. 2. Electric current under different electrodes.
Calculated distribution of the electric current under the 150 IDE (a), 1000 IDE (b), concentric
electrode (c) and classic electrode (d) is shown here. The colour plot represents the magnitude of
the current density at the given electric polarization of – 50 V applied to the cathodes. The arrow
plot indicates flowing of the electrical current inside the skin. Length of arrows is normalized to the
local current density magnitude (see also the colour plot for the associated magnitude) for (a),( b)
and (c). The arrow plot of the classic electrode (d) is reported in the upper inlet, encased in red
frame; arrow length is proportional to the magnitude of current density. The top view schematic of
each electrode is also shown on each graph together with the line cross-section used for simulations.
The blue contour lines (marked by the large blue arrow) indicate the spatial regions where the
current density has the representative value of 250 A/m2. Colour scale saturates for values above
1000 A/m2, the maximum values of the current density being about 2170 A/m
2 for the 150 IDE,
2165 A/m2 for the 1000 IDE, 4330 A/m
2 for the circular electrode and 3300 A/m
2 for the classic
electrode.
13
In order to visualize the regions where excitation of the fibres would take place, we plotted the
activating function, defined as the second spatial derivative of the extracellular potential along the
axis of a nerve (Rattay, 1986; Grill, 1999) and which is used to evaluate the efficiency of an
electrode by providing an indication of where the action potential preferentially will develop. As the
nociceptive fibres are directed along the skin’s depth, we considered the activating function along
this direction (y) only. The magnitude of the applied voltage, and the consequent value of the
activating function, is a free parameter during stimulation; for this reason the activating function has
been normalized to its value taken at -50 m under the skin surface below the center of each
electrode’s cathode.
As shown in Fig. 3a, the circular electrode (diameter of the inner conductor 0.5 mm) shows a peak
of the activating function at its edge in a region length extending for about 100 m below the
surface of the skin. It is worth noting that the diameter of the inner conductor does not
significantly affect the actual stimulating area, because the higher values of the activating function
are located at the borders, as already reported by other authors (Mørch et al., 2011)
In contrast to the concentric electrode, our 150 IDE yields a completely different pattern of the
activating function. Firstly, its -3 contour line, as shown in Fig. 3b, only reaches a depth of
approximately -35 m, about 1/3 of the concentric electrode.

14
Fig. 3. Absolute value of the activating function for the concentric electrode (a), 150 IDE (b) and
1000 IDE (c).
The activating function is calculated along the vertical direction where free nerve endings are
mainly oriented. The activating function has been normalized to its value taken under the centre of
each cathode at -50 m depth, where its absolute value is 3.16 x 10⁷ V/m
2 for the concentric
electrode, 3.91 x 10⁷ V/m
2 for the 150 IDE and 3.91 x 10
7 V/m
2V/m
2 for the 1000 IDE. The colour
plot is in logarithmic scale. The black contour lines identify the spatial regions where the activating
function is 100 ( -2 numbers) and 1000 ( -3 numbers) times lower than the normalized value (0 in
the logarithmic scale). The maximum value taken by the logarithm of the activating function is
0.83 for the circular electrode, 0.47 for the 150 IDE and 0.51 for the 1000 IDE. The stratum
corneum has been coloured grey to signify that no fibres are present in it.
Secondly, the activating function for the interdigitated electrode pattern and the associated regions
of activation is periodically repeated for about 25% of the whole electrode area, calculated as the
normalized ratio between the amount of cathode area and the whole electrode area. The same
calculation results in a ratio of less than 1% for the ring concentric electrode. As shown in Fig. 3b

15
and c, the effect of the inter-rail gap in the interdigitated electrodes is to change the lateral
distribution of the activating function below each rail, consequently affecting the stimulation area.
A clear idea of the importance of the inter-rail gap as to the spatial distribution of the activating
function can be gathered by examining the simulation related to the 1000 IDE. Here, the -3 contour
plot reaches a depth of about 70 m below skin surface, double that of the 150 IDE.
In the case of the classic electrode, the activating function only decreases by an order of magnitude
(-1 contour plot) by the depth of about 9 mm, well below the epidermis layer (Fig. 4a). Such deep
spread of the activating function is a clear indication that the classic electrodes yield a much
smoother distribution of the generated field than the interdigitated micropatterned electrodes, with
uniform penetration of the skin and subcutaneous, reaching suitable values to activate low threshold
deep myelinated fibres, without necessarily depolarizing the high threshold superficial free nerve
endings. Similarly to the other electrodes, the activating function is peaked at the electrode borders
(Fig. 4b and Fig. 4c), but the small area of these border regions and the large gap between anode to
cathode (here 10 mm) prevents efficient and selective stimulation of unmyelinated fibres.
16
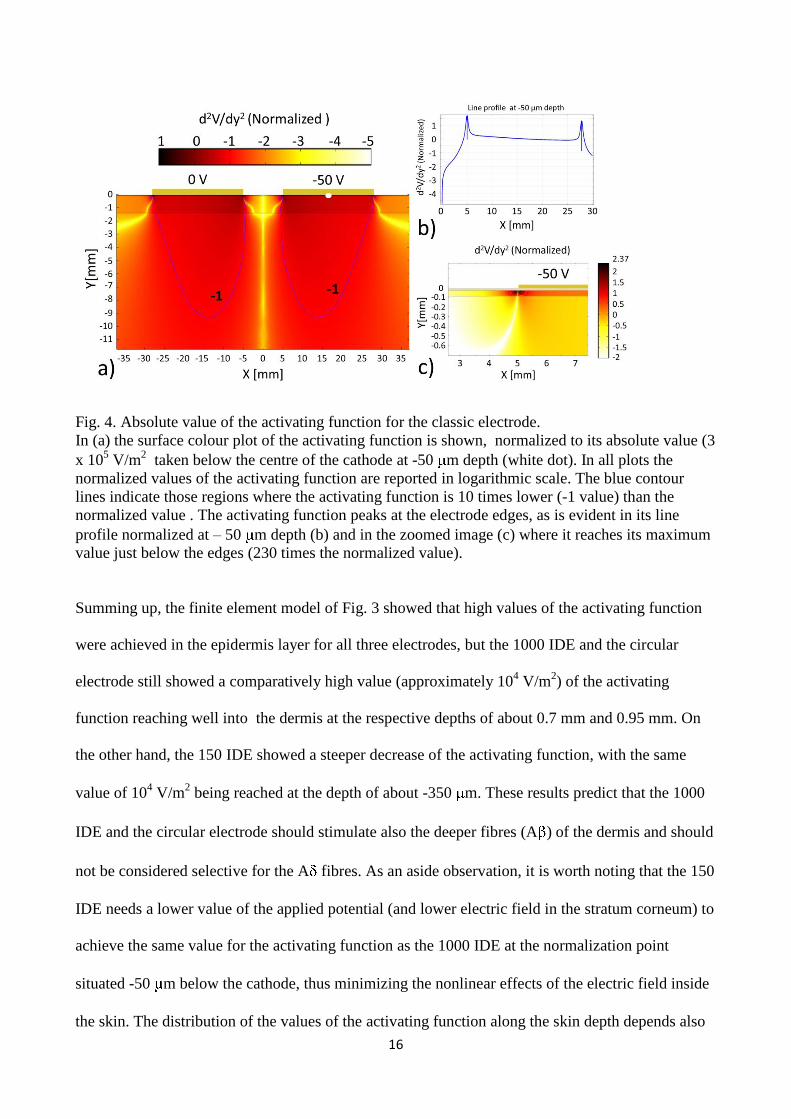
Fig. 4. Absolute value of the activating function for the classic electrode.
In (a) the surface colour plot of the activating function is shown, normalized to its absolute value (3
x 105 V/m
2 taken below the centre of the cathode at -50 m depth (white dot). In all plots the
normalized values of the activating function are reported in logarithmic scale. The blue contour
lines indicate those regions where the activating function is 10 times lower (-1 value) than the
normalized value . The activating function peaks at the electrode edges, as is evident in its line
profile normalized at – 50 m depth (b) and in the zoomed image (c) where it reaches its maximum
value just below the edges (230 times the normalized value).
Summing up, the finite element model of Fig. 3 showed that high values of the activating function
were achieved in the epidermis layer for all three electrodes, but the 1000 IDE and the circular
electrode still showed a comparatively high value (approximately 104 V/m
2) of the activating
function reaching well into the dermis at the respective depths of about 0.7 mm and 0.95 mm. On
the other hand, the 150 IDE showed a steeper decrease of the activating function, with the same
value of 104 V/m
2 being reached at the depth of about -350 m. These results predict that the 1000
IDE and the circular electrode should stimulate also the deeper fibres (A ) of the dermis and should
not be considered selective for the A fibres. As an aside observation, it is worth noting that the 150
IDE needs a lower value of the applied potential (and lower electric field in the stratum corneum) to
achieve the same value for the activating function as the 1000 IDE at the normalization point
situated -50 m below the cathode, thus minimizing the nonlinear effects of the electric field inside
the skin. The distribution of the values of the activating function along the skin depth depends also
17
on the values of the conductivity of each layer and their reciprocal ratio (the potential drop is
divided by the layers) as well on their anisotropy. Stimulation efficiency and selectivity of each
electrode may be modified if changes in the induced electric field take place following variations in
tissue conductivities during stimulation, as may happen where electroporation takes place. For this
reason, monitoring current and voltage during stimulation with any electrode, in order to assess
impedance, would be strongly advisable.
3.2 Results of experiments
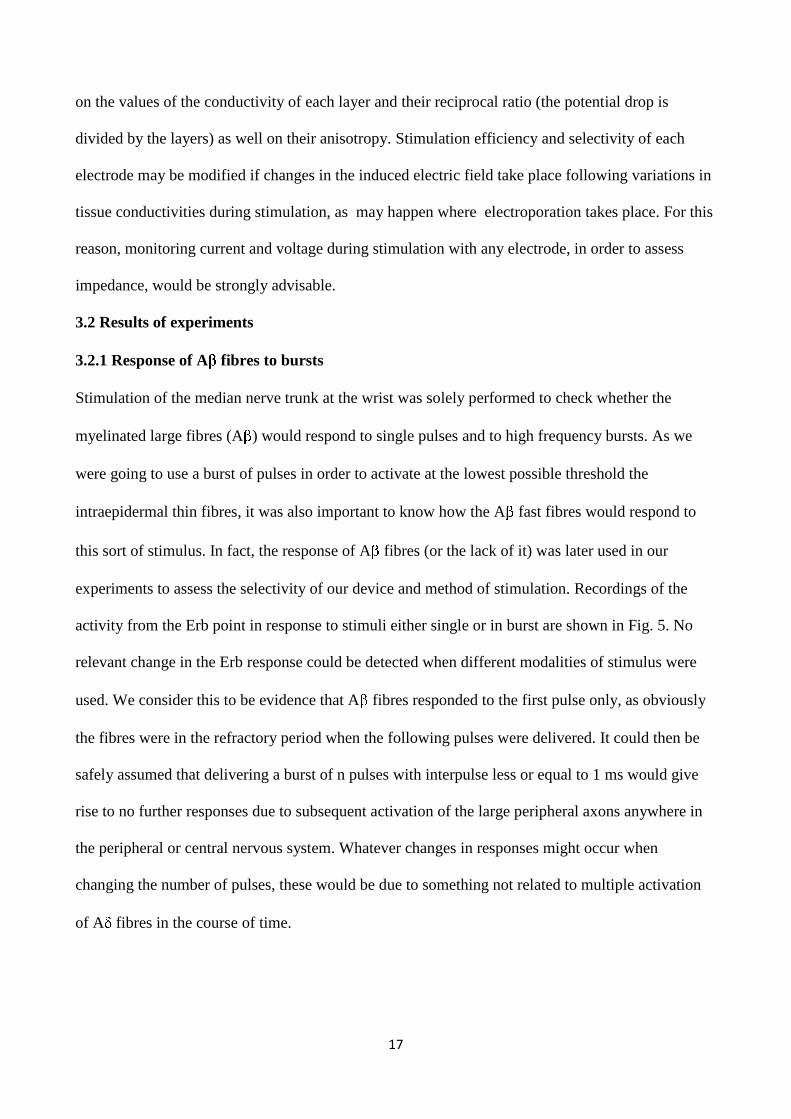
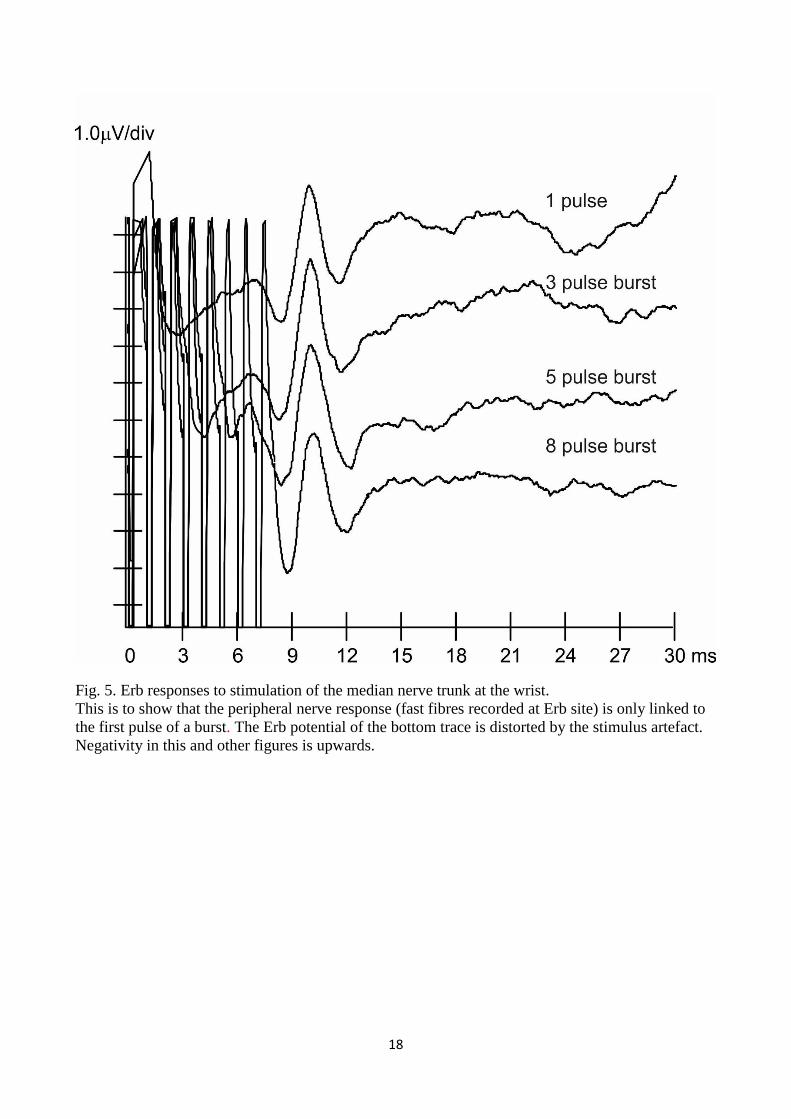
3.2.1 Response of A fibres to bursts
Stimulation of the median nerve trunk at the wrist was solely performed to check whether the
myelinated large fibres (A ) would respond to single pulses and to high frequency bursts. As we
were going to use a burst of pulses in order to activate at the lowest possible threshold the
intraepidermal thin fibres, it was also important to know how the A fast fibres would respond to
this sort of stimulus. In fact, the response of A fibres (or the lack of it) was later used in our
experiments to assess the selectivity of our device and method of stimulation. Recordings of the
activity from the Erb point in response to stimuli either single or in burst are shown in Fig. 5. No
relevant change in the Erb response could be detected when different modalities of stimulus were
used. We consider this to be evidence that A fibres responded to the first pulse only, as obviously
the fibres were in the refractory period when the following pulses were delivered. It could then be
safely assumed that delivering a burst of n pulses with interpulse less or equal to 1 ms would give
rise to no further responses due to subsequent activation of the large peripheral axons anywhere in
the peripheral or central nervous system. Whatever changes in responses might occur when
changing the number of pulses, these would be due to something not related to multiple activation
of A fibres in the course of time.
18
Fig. 5. Erb responses to stimulation of the median nerve trunk at the wrist.
This is to show that the peripheral nerve response (fast fibres recorded at Erb site) is only linked to
the first pulse of a burst. The Erb potential of the bottom trace is distorted by the stimulus artefact.
Negativity in this and other figures is upwards.

19
3.2.2 Evoked potentials after A stimulation of the hand dorsum skin.
Compound action potentials recorded from the Erb site and from the scalp (C3’/C4’-Fz) after
stimulation of the hand dorsum skin with the 1000 IDE are shown in Fig. 6. The aim of this
experiment was to demonstrate that the activity of A afferents from this site (the same site that will
later be used for selective stimulation of A fibres with the 150 IDE) could be recorded as SEPs. In
order to average a sufficient number of responses (approximately 500), repetitive stimuli at the rate
of 0.7/s were delivered. A small negative response could be recorded at the Erb site with latency of
10.6 ± 0.7 ms, and amplitude (from baseline to negative peak) of 0.92 ± 0.48 V. From C4’-Fz a
small negative-positive component could be observed (marked as N20 in Fig. 6 because of its
reputed similarity to the median nerve SEP component) with peak latencies of 23.7 ± 1.8 ms
(amplitude from baseline 0.38 ± 0.24 V) and 26.4 ± 2.5 ms (interpeak amplitude 0.82 ± 0.36 V).
It was followed by a second, larger negative-positive wave, peaking at 27.7 ± 2.2 ms and at 32.9
±2.61 ms (interpeak amplitude 3.8 ± 1.8 V). The general shape and latencies of these components
resembled the classic W shape that can be observed in traditional recordings of somatosensory
evoked potentials (SEPs) from the C4’/C3’-Fz derivations after stimulation of the upper limb.

20
Fig. 6. 1000 IDE on hand dorsum, with 5 pulse burst.
This is to show that stimulation of cutaneous large afferent fibres with 1000 IDE gives rise to
recordable, though very small, responses at the Erb point and to early/medium latency cortical
responses.
3.2.3 Scalp evoked potentials after repetitive stimulation with 1000 IDE and 150 IDE.
With this experiment we compared the effect of stimulation with 1000 IDE versus 150 IDE on
responses from the sensorimotor primary area (Fig. 7), by using bursts of 10 pulses, delivered at
constant repetition rate of 0.7/s. The aim of the experiment was to demonstrate that while the 1000
IDE would evoke early SEP components as already described in paragraph 3.3.2, the use of 150
IDE would not. Our recordings confirmed this hypothesis, as can be seen in the lower set of traces
of Fig. 7 depicting the response to 1000 IDE, where the early and medium latency typical SEP
components are clearly shown (only N20 is labelled here), albeit with very small amplitude.

21
Conversely, the only responses obtained from the 150 IDE are in the late range, the first of them a
negative peak at the mean latency of 91.4 ± 12.0 ms, similar to the well known LEP or PREP N1.
Its amplitude was 2.4 ± 1.5 V, well below the usual amplitude of LEPs (Treede et al., 2003) and
PREPs (Katsarava et al., 2006; Perchet et al., 2012). The reason for such behaviour is very likely to
be found in the rate of stimulation, which was too fast and constant to be able to elicit large late
components.
It can be observed that a similar late wave is recorded after stimulation with the 1000 IDE (lower
traces of Fig. 7), marked as SEP N1. Such a component could not be seen in our previous C4’-Fz
recordings with 5 pulse burst shown in Fig. 6 (lower traces), probably because the combination of
high repetition rate and shorter burst did not reach the necessary perceptual significance.

22
Fig. 7. Cortical evoked potentials after fast stimulation rate.
Recordings from C4’-Fz derivation after fast, repetitive stimulation with 150 IDE (upper traces) and
1000 IDE (lower traces) electrodes are shown here. The lower traces show early/medium latency
waves preceding the late component seen at 100ms. The upper traces only show a late wave
peaking at 100ms.
3.2.4 Scalp evoked potentials after random stimulation with 150 IDE
Large late responses were recorded at Cz-Auc and C3’/C4’-Fz, similar to those seen in LEPs and
PREPs, but no early components could be seen (Fig. 8). From Cz-Auc derivation, the first reliable
wave that could be seen had positive polarity, with mean latency of 89.7 ± 17.2 ms, and amplitude
of 8.7 ± 2.8 V as measured from baseline. It was followed by a larger, negative peak at 122.4 ±
11.5 ms (labelled N1) and a positive peak at 175.4 ± 23.7 ms (labelled P2). Peak to peak amplitude
of the latter complex was 35.8 ± 9.6 V. Derivation C3’/C4’-Fz yielded a first negative peak at
mean latency of 75.7 ± 13.8 ms (labelled N1) and amplitude from baseline of 13.2 ± 6.3 V. A

23
much larger negative peak at 105.8 ± 13.8 ms (labelled N2) and a positive one at 162.6 ± 25.6 ms
(labelled P2) followed on, with interpeak amplitude of 41.5 ± 18.7 V.
Fig. 8. Cortical evoked potentials after random stimulation with 150 IDE.
Average of 20 responses per trace. Painful perception was graded 4-5. Stimulus artefact is not
visible, as the traces have been processed off line with the LabView © Butterworth filter function,
set as 1st order 0.1-500 Hz bandpass.
3.2.5. N1 in different conditions.
Among the late waves, N1 seems to be the most constantly recorded component in our experiments.
It may be worthwhile to compare N1 latency and amplitude between responses obtained with 1000
and 150 IDE, the latter both in repetitive and random modality. Fig. 9 illustrates what can be found.
When using repetitive stimulation, latency of N1 was significantly (p = 0.015) shorter in the case of
150 IDE than 1000 IDE, with a mean difference of 9.5 ms. But there was no significant amplitude
difference between the two electrodes in this condition. A comparison between random slow
stimulation versus repetitve fast stimulation, always using 150 IDE, shows that in the former

24
condition N1 occurred 15.6 ms earlier, but not significantly (p = 0.18). Its amplitude, on the other
hand was far larger in slow random modality, with a very significant (p = 0.00003) difference of
10.9 V.
Fig.9. The N1 component.
This is to show latencies in ms and amplitudes in V of the cortical component N1 recorded at
C3’/C4’-Fz in various conditions of stimulation. Random slow stimulation yields a larger N1 than
the fast repetitive modality, obviously suggesting that a quick habituation process takes place.
4 Discussion
4.1 Computer simulations and electrode design
In theory, selective activation of the nociceptive afferents by an electric field could be achieved by
limiting its diffusion through the skin, so that the related activating function for unmyelinated fibres
(Rattay, 1986) was sufficient to depolarize the thin fibres within 50-100 m from the surface (i.e.
25
the epidermal layer, only populated by the unmyelinated free nerve endings), but would not
significantly affect the deeply situated, large myelinated fibres. So, the circular electrode previously
introduced by Katsarava et al. (Katsarava et al., 2006) might be suitable to elicit activity in the free
nerve endings in a tiny region of the epidermis. But this effect could only take place at the electrode
edges, as demonstrated by our simulation, where the number of activated fibres would be too small
to evoke any recordable response. In order to recruit larger numbers of fibres the only option is to
increase the stimulus strength, but this would result in a deeper spread of the electric field, together
with the related activating function, and a consequent loss in selectivity. In fact, the concentric
electrode has not been found to be selective enough when seeking cortical evoked responses
(Perchet et al., 2012), but of course it has been hypothesized that at very small stimulus strengths
sufficient selectivity could be accomplished (Mouraux et al., 2010). Analysis of computer
simulations suggested that one primary objective should be the increase of edge covered area, so
that a large number of free nerve endings are affected, without the need to increase stimulus
strength. A further goal should be the reduction of distance between conductors linked to opposite
poles, which could help in keeping the activating function as superficial as possible. The design of
our 150 IDE meets these two needs as it is based upon a micropatterned modular unit that could be
repeated as many times as needed to cover a given area, without altering the interconductor distance
and therefore not affecting the field depth.
The electrode thus offers a practical solution to increase the number of borders, while maintaining
at the same time a simple scheme for the electric connections.
4.2 The stimulus: burst of pulses
It is imperative that in order to limit the spread of the electric field we should use not only a suitable
electrode geometry, like the proposed micropattern, but also keep the stimulus strength at a
minimum, approaching as much as possible the threshold for A fibres. According to the strength
duration curve, the minimum strength of stimulus needed to start an action potential is linked to the
stimulus duration: the longer the stimulus the less the strength needed. However increasing duration

26
above a certain limit, does not bring any relevant decrease of the necessary stimulus strength.
Although excitability thresholds vary considerably according to the experimental conditions, we
know that chronaxie values for A fibres are in the range of 1ms (Mengel et al., 1993), and the time
constant for the same group has been reported between 5 and 15 ms (Hodgkin, 1948). Therefore we
thought that a duration of 10 ms could ensure the lowest possible strength needed to activate those
fibres. Commercial stimulators usually do not deliver stimuli of such duration without heavy
distortion of the square waveform, with unpredictable effect upon the excitable membrane.
However, a train of short pulses could easily be delivered without distortion, and its overall effect
could be the same as a single longer pulse, provided the inter-pulse period is kept short enough. The
absolute refractory period of the large myelinated fibres is reported in a review to be approximately
0.5-1ms, and relative refractory period between 3 and 4 ms (Burke et al., 2001), so pulses following
the first one at 1ms interval should not be able to generate an action potential even on the fastest
fibres. Our recordings after stimulation of the median nerve were aimed at demonstrating such a
hypothesis, which was duly confirmed.
4.3 The evoked potentials
It is noteworthy that the technique of late evoked potentials has usually been applied to pain
research with no attention at all to early or medium latency components. This was due to the notion
that pain afferents would be too slow and desynchronized to be recorded peripherally. At the same
time the elicited cortical activity would be spread over wide areas of cortex involving a large
number of synapses. So nothing could be expected to be seen before 80-100 ms after the stimulus.
Whatever the technique, since the first attempts with tooth electrical stimulation, then laser heat
pulses, and eventually fast contact heat devices, the resulting response has always been in the
latency and spatial distribution range of the endogenous event related potentials and was strongly
linked to attention (Oken, 1997). Investigations about PREPs after electric stimulation with
concentric electrodes, either surface or intradermal, followed suit. Usually, the very settings of the
recording system (number of averages, bandpass and sampling rate), when tuned to late responses,
27
prevent the recording of fast components. To our knowledge, no attempt has ever been made to
assess whether early and medium components were present in the cortical evoked responses
generated by electric stimulation via allegedly selective electrodes.
There is little doubt that, besides the many advantages of the electric pulses over caloric stimuli in
activating the nerve endings, there is the possibility by the former of being delivered at high rates
and for a long time without risk of tissue damage or modification of tissue background temperature.
In our experiments such features were exploited in order to obtain very low noise averages, which
showed low amplitude early and medium latency components, when using the 1000 IDE
unselective electrode for stimulation. This approach had not been used before, and we consider it to
be the most reliable non-invasive method so far used to provide evidence that the two types of
electrodes (150 IDE and 1000 IDE) activate different populations of fibres.
The late components that we recorded from the scalp after stimulation with the 150 IDE were best
seen when a slow, random rate of stimulus delivery was used. Latencies obtained by us in this
modality were shorter than those described by other authors with lasers, but also shorter than those
reported with electric stimulation through concentric electrodes. When comparing latencies and
amplitudes of the late waves N1, N2 and P2, one should always keep in mind that these are
cognitive potentials with a very high degree of inter- and intra-subject variability, and that the
importance of attention is paramount (Iannetti et al., 2008). Their aspecific nature has long been
known and they cannot be considered as an objective representation either of the qualitative or
quantitative intrinsic properties of a stimulus (Mouraux and Iannetti, 2009). Furthermore, the
comparisons shown in Fig. 9 about N1 support the idea that even in the same setting latencies and
amplitudes may not be directly related to the type of activated fibres, but rather to modality of
stimulation. For such reasons, it is no wonder that latencies detected in one laboratory may not
perfectly overlap those found elsewhere and with different methods.
A comment over the cortical responses by C fibre stimulation is due here. Such long latency, ultra-
late responses are best seen after temperature controlled laser stimulation (Magerl et al., 1999), and

28
are usually inhibited if A co-activation is performed. Whilst there is little doubt that the activating
function arising from our stimuli could excite nerve free endings pertaining to A and C fibres, we
had no chance to perform a selective stimulation of C fibre nerve endings. For this reason, no
attempt was made to record ultra-late cortical responses (the 1000 ms epoch time after stimulus
would have been too short to clearly visualize such responses). It is also important to note that the
aim of our work was to demonstrate that the 150 IDE could selectively activate intraepidermal free
endings and our efforts were focused on a neurophysiological demonstration of this feature versus
unselective activation of Aβ fibres by 1000 IDE. This meant that an accurate analysis of early and
middle latency responses had to be performed, leaving comparison between late and ultra-late
responses to a future chapter of the research.
Despite their lack of objectivity, the late evoked potentials are so far the only available instrumental
method to investigate pain afferents. On condition, of course, that the stimulus is of a nociceptive
nature, and that no significant numbers of non nociceptive afferents are stimulated. We propose the
150 IDE as an instrument to achieve such selective stimulation.
5 Conclusions
In contrast to previous electrodes, with small stimulating surfaces but great distances between
opposite poles, our electrode is characterized by a micropattern that can be repeated as many times
as it is convenient, with tiny gaps between opposite poles. This design assures that the spread of
electric field remains the same independently from the extent of stimulated area. At the same time,
the estimate amount of activated intraepidermal free nerve endings, per surface unit, is 25 times that
of other electrodes based upon concentric design. The scalp recorded evoked potentials
demonstrated the selectivity and efficiency of our electrode, which we now believe will be suitable
for practical and reliable use in laboratories of clinical neurophysiology.

29
6 Bibliography
Burke, D., Kiernan, M.C., Bostock, H., 2001. Excitability of human axons Clin. Neurophysiol 112,
1575–1585.
Grill, W.M., 1999. Modeling the effects of electric fields on nerve fibers: influence of tissue
electrical properties. IEEE Trans. Biomed. Eng. 46, 918–928. doi:10.1109/10.184700
Hodgkin, A.L., 1948. The local electric changes associated with repetitive action in a non-
medullated axon. J. Physiol. 107, 165–181. doi:citeulike-article-id:2252626
Iannetti, G.D., Hughes, N.P., Lee, M.C., Mouraux, A., 2008. Determinants of laser-evoked EEG
Responses : Pain Perception or Stimulus Saliency ? 815–828. doi:10.1152/jn.00097.2008.
Inui, K., Kakigi, R., 2012. Pain perception in humans: use of intraepidermal electrical stimulation.
J. Neurol. Neurosurg. Psychiatry 83, 551–556. doi:10.1136/jnnp-2011-301484
Katsarava, Z., Ayzenberg, I., Sack, F., Limmroth, V., Diener, H.C., Kaube, H., 2006. A novel
method of eliciting pain-related potentials by transcutaneous electrical stimulation. Headache
46, 1511–1517. doi:10.1111/j.1526-4610.2006.00446.x
Leandri, M., Saturno, M., Spadavecchia, L., Iannetti, G.D., Cruccu, G., Truini, a, 2006.
Measurement of skin temperature after infrared laser stimulation. Neurophysiol. Clin. 36, 207–
18. doi:10.1016/j.neucli.2006.08.004
Magerl, W., Ali, Z., Ellrich, J., Meyer, R.A., Treede, R.D., 1999. C- and A delta-fiber components
of heat-evoked cerebral potentials in healthy human subjects. Pain 82, 127–137.
Mengel, M.K.C., Jyvasjarvi, E., Kniffki, K.-D., 1993. Identification and characterisation of afferent
periodontal A fibres in the cat. J. Physiol. 464, 393–405.
Mørch, C.D., Hennings, K., Andersen, O.K., 2011. Estimating nerve excitation thresholds to
cutaneous electrical stimulation by finite element modeling combined with a stochastic
branching nerve fiber model. Med. Biol. Eng. Comput. 49, 385–395. doi:10.1007/s11517-010-
0725-8
Mouraux, A., Iannetti, G.D., Plaghki, L., 2010. Low intensity intra-epidermal electrical stimulation
can activate A -nociceptors selectively. Pain 150, 199–207. doi:10.1016/j.pain.2010.04.026
Mouraux, A., Iannetti, G.D., 2009. Nociceptive laser-evoked brain potentials do not reflect
nociceptive-specific neural activity. J. Neurophysiol. 101, 3258–69.
doi:10.1152/jn.91181.2008
Oken, B.S., 1997. Endogenous event-related potentials, in: Chiappa, K.-H.- (Ed.), Evoked
Potentials in Clinical Medicine. Lippincott-Raven Paublishers, Philadelphia, pp. 529–563.
Perchet, C., Frot, M., Charmarty, A., Flores, C., Mazza, S., Magnin, M., Garcia-Larrea, L., 2012.
Do we activate specifically somatosensory thin fibres with the concentric planar electrode? A
scalp and intracranial EEG study. Pain 153, 1244–1252. doi:10.1016/j.pain.2012.03.004
Rattay, F., 1986. Analysis of models for external stimulation of axons. IEEE Trans. Biomed. Eng.
BME-33, 974–977. doi:10.1109/TBME.1986.325670
Treede, R.D., Lorenz, J., Baumgärtner, U., 2003. Clinical usefulness of laser-evoked potentials.
Neurophysiol. Clin. 33, 303–314. doi:10.1016/j.neucli.2003.10.009
Treede, R.D., Meyer, R.A., Raja, S.N., Campbell, J.N., 1995. Evidence for two different heat
30
transduction mechanisms in nociceptive primary afferents innervating monkey skin. J Physiol
483 ( Pt 3, 747–758.
Acknowledgements: the authors are grateful to Prof. Claudia Spadavecchia, from the Vetsuisse
Faculty, University of Bern, who spent her sabbatical at the laboratory of the Interuniversity Centre
for Pain Neurophysiology and took part to some of the experiments.
Funding
This research did not receive any specific grant from funding agencies in the public, commercial, or
not-for-profit sectors. All costs were covered by institutional funding from the Interuniversity
Centre for Pain Neurophysiology (CIND) and the Physics Department of the University of Genova.
Declaration of Interest
The micropatterned 150 IDE is the object of a patent registration, joint property of the University of
Genova and the Italian National Research Council (CNR). The authors M. Leandri, L. Pellegrino
and A. Siri, as inventors, may receive a share of profits in case of commercialization and they
declare a potential conflict of interest. L. Marinelli has no conflict of interest.
31
Highlights
A new surface electrode for selective stimulation of nociceptive afferents is presented.
The electrode is characterized by a micropattern with 150 μm gaps covering large areas
without loss of selectivity.
Only late SEP responses can be recorded with our electrode.
Conversely, with a wider gap electrode, early and medium SEP components can be
recorded.
Lack of early and medium SEP components show selectivity of our electrode, which is an
alternative to laser stimulation.