microeconomics i 44715 (1396-97 1st term) - group 1
TRANSCRIPT

Microeconomics IIntroduction
S. Farshad Fatemi
Introduction
PreliminaryDefinitions
CompetitiveMarkets; Demandand Supply
Review
Microeconomics I44715 (1396-97 1st Term) - Group 1
Introduction
Dr. S. Farshad Fatemi
Graduate School of Management and EconomicsSharif University of Technology
Fall 2017
1 / 26

Microeconomics IIntroduction
S. Farshad Fatemi
Introduction
PreliminaryDefinitions
CompetitiveMarkets; Demandand Supply
Review
Introduction
Microeconomics is a collection of models studying the behaviorof units called economic agents. Microeconomic modelsinvestigate assumptions about economic agents’ activities andabout interactions between them.
What is an economic agent?
The economic agent decides what action to take through aprocess in which he
1- Asks himself ”What is desirable?”2- Asks himself ”What is feasible?”3- Chooses the most desirable from among the feasible
alternatives.
This deliberation process is what is called rational choice.
Economics is defined by Jacob Viner as
Economics is What Economists Do!
2 / 26

Microeconomics IIntroduction
S. Farshad Fatemi
Introduction
PreliminaryDefinitions
CompetitiveMarkets; Demandand Supply
Review
Introduction
- Criminal Recidivism after Prison and Electronic Monitoring; Journal ofPolitical Economy (JPE); Feb 2013
- Early Life Health Interventions and Academic Achievement; AmericanEconomic Review (AER); Aug 2013
- India’s Missing Girls: Biology, Customs, and Economic Development;Oxford Review of Economics
- Intergenerational Occupational Mobility in Great Britain and the UnitedStates since 1850; AER; Jun 2013
- Limited Life Expectancy, Human Capital and Health Investments; AER;Aug 2013
- On the Living Arrangements of Elderly Widows; International EconomicReview.
- One Chance in a Million: Altruism and the Bone Marrow Registry; AER.
- Rational Adversaries: Evidence form Randomised Trials in One DayCricket; Economic Journal.
- Spousal Control and Intra-household Decision Making: An ExperimentalStudy in the Philippines?; AER.
- When does a firm disclose product information?; Rand Journal ofEconomics; 2012
- When Should Sellers Use Auctions?; AER (AER); Aug 2013
3 / 26

Microeconomics IIntroduction
S. Farshad Fatemi
Introduction
PreliminaryDefinitions
CompetitiveMarkets; Demandand Supply
Review
Preliminary DefinitionsGNP & GDP
National income is the sum of the incomes of all its citizens.
World income is the sum of all countries’ income, or the sum ofthe incomes earned by all the people in the world.
Income distribution tells us how income is divided betweendifferent groups or individuals.
Income per person indicates the average standard of living.
The Income indexes are:
- Gross Domestic Product (GDP)- Gross National Product (GNP)
4 / 26
Microeconomics IIntroduction
S. Farshad Fatemi
Introduction
PreliminaryDefinitions
CompetitiveMarkets; Demandand Supply
Review
Preliminary DefinitionsOpportunity Cost / PPF
Opportunity CostA crucial concept in economic analysis; The quantity of other goodsthat must be sacrificed to obtain another unit of a good.
Production Possibility Frontier (PPF)For each level of the output of one good, the production possibilityfrontier shows the maximum amount of the other good that can beproduced.
5 / 26

Microeconomics IIntroduction
S. Farshad Fatemi
Introduction
PreliminaryDefinitions
CompetitiveMarkets; Demandand Supply
Review
Preliminary DefinitionsPPF
Then, the opportunity cost of one unit of food is 2 units of film. Orthe opportunity cost of one unit of film is 1
2 unit of food.
6 / 26

Microeconomics IIntroduction
S. Farshad Fatemi
Introduction
PreliminaryDefinitions
CompetitiveMarkets; Demandand Supply
Review
Preliminary DefinitionsPPF
Note:
The frontier shows the maximum combinations of output thatthe economy can produce using all available resources.
The frontier displays a trade-off.
Points above the frontier need more inputs than the economyhas available.
Points inside the frontier are inefficient.
The PPF shows the points at which society is producingefficiently.
7 / 26

Microeconomics IIntroduction
S. Farshad Fatemi
Introduction
PreliminaryDefinitions
CompetitiveMarkets; Demandand Supply
Review
Preliminary DefinitionsMarket
MarketA shorthand expression for the process by which ...
households’ decisions about consumption of alternative goods,
firms’ decisions about what and how to produce,
and workers’ decisions about how much and for whom to work
... are reconciled by adjustment of prices
Then Each market has two sides:
Demand and
Supply.
In each market we might be interested in studying Equilibrium andWelfare criteria.
8 / 26

Microeconomics IIntroduction
S. Farshad Fatemi
Introduction
PreliminaryDefinitions
CompetitiveMarkets; Demandand Supply
Review
Preliminary DefinitionsMarket
Different societies take different stands on how much they rely onmarket mechanism to allocate resources
Command economy
Mixed economy
Free market
9 / 26

Microeconomics IIntroduction
S. Farshad Fatemi
Introduction
PreliminaryDefinitions
CompetitiveMarkets; Demandand Supply
Review
Preliminary DefinitionsMarket / Micro vs Macro
Adam Smith argued that an invisible hand would allocateresources efficiently.
Modern economies are mixed, relying mainly on the market butwith government intervention. The optimal level of interventionis debated.
Micro- v Macro- Economics
Microeconomics offers a detailed treatment of individualeconomic decisions about particular commodities (consumertheory, supplier theory, cost analysis, market structure, ...).
Macroeconomics emphasizes on the interactions in the economyas a whole (economic growth, inflation, unemployment, ...).
10 / 26

Microeconomics IIntroduction
S. Farshad Fatemi
Introduction
PreliminaryDefinitions
CompetitiveMarkets; Demandand Supply
Review
Preliminary Definitions
Other Basic Concepts
Theory (Model)
Test
Data (time series, cross section, and panel data)
Index
Price index
Inflation
Nominal and Real values
Exchange rate
Purchasing Power Parity (PPP)
”Other things equal”
11 / 26
Microeconomics IIntroduction
S. Farshad Fatemi
Introduction
PreliminaryDefinitions
CompetitiveMarkets; Demandand Supply
Review
Preliminary DefinitionsExample
A Simple Example of an Economic Model
To organize our thinking we need a simplified picture of realityfocusing on key elements
Quantity of bus journeys demanded = f(prices, income,preferences, season, ...)
From the variables which one should/can we keep and whichone should/can be ignored?
The answer to this question comes from our theory.
Econometrics helps us confront economic theory with empiricalreality using statistical techniques.
Evidence may allow us to reject a theory or accumulate supportfor it.
12 / 26

Microeconomics IIntroduction
S. Farshad Fatemi
Introduction
PreliminaryDefinitions
CompetitiveMarkets; Demandand Supply
Review
Competitive Markets; Demand and Supply
MarketA set of arrangements (mechanism) by which buyers and sellers arein contact to exchange goods or services
DemandThe quantity of a good, buyers wish to purchase at each conceivableprice
SupplyThe quantity of a good, sellers wish to sell at each conceivable price
Equilibrium pricePrice at which quantity supplied = quantity demanded
13 / 26

Microeconomics IIntroduction
S. Farshad Fatemi
Introduction
PreliminaryDefinitions
CompetitiveMarkets; Demandand Supply
Review
Competitive Markets; Demand and SupplyDemand
Demand
The Demand curve shows the relation between price andquantity demanded, holding other things constant.”Other things” include:
the price of related goodsconsumer incomesconsumer preferences
Changes in these other things affect the position of (shift) thedemand curve.
14 / 26

Microeconomics IIntroduction
S. Farshad Fatemi
Introduction
PreliminaryDefinitions
CompetitiveMarkets; Demandand Supply
Review
Competitive Markets; Demand and SupplySupply
Supply
The Supply curve shows the relation between price and quantitysupplied holding other things constant.”Other things” include:
technologyinput costsgovernment regulations
Changes in these other things affect the position of (shift) thesupply curve.
15 / 26
Microeconomics IIntroduction
S. Farshad Fatemi
Introduction
PreliminaryDefinitions
CompetitiveMarkets; Demandand Supply
Review
Competitive Markets; Demand and SupplyMarket Equilibrium
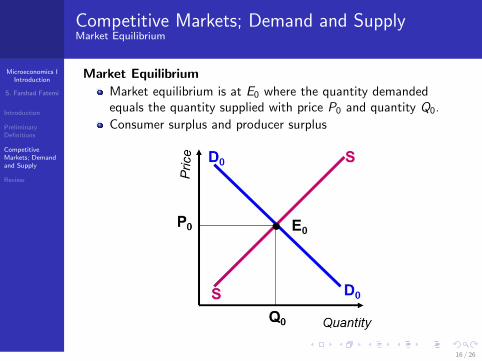
Market Equilibrium
Market equilibrium is at E0 where the quantity demandedequals the quantity supplied with price P0 and quantity Q0.
Consumer surplus and producer surplus
16 / 26

Microeconomics IIntroduction
S. Farshad Fatemi
Introduction
PreliminaryDefinitions
CompetitiveMarkets; Demandand Supply
Review
Competitive Markets; Demand and Supply
If price were above P0 there would be excess supply; producerswish to supply more than consumers wish to purchaseIf price were below P0 there would be excess demand;consumers wish to purchase more than producers wish tosupply.
17 / 26

Microeconomics IIntroduction
S. Farshad Fatemi
Introduction
PreliminaryDefinitions
CompetitiveMarkets; Demandand Supply
Review
Competitive Markets; Demand and SupplyDemand Curve (a closer look)
Demand Curve (a closer look)
How does the demand curve shift if:
Consumer income increasesConsumer taste changesThe price of another (related) good changes
Substitutes
If two goods are substitutes a price increase for one good increasesthe demand for the other. e.g. tea & coffee. travel by bus & travelby metro.
Complements
If two goods are complements a price increase for one gooddecreases the demand for the other. e.g. tea & sugar, petrol & car.
18 / 26

Microeconomics IIntroduction
S. Farshad Fatemi
Introduction
PreliminaryDefinitions
CompetitiveMarkets; Demandand Supply
Review
Competitive Markets; Demand and SupplyDemand Curve (a closer look)
If the price of a substitute good decreases: less will be demanded ateach price. The demand curve shifts from D0D0 to D1D1.
If price stayed at P0 there would have been excess supply. So themarket moves to a new equilibrium at E1.
19 / 26

Microeconomics IIntroduction
S. Farshad Fatemi
Introduction
PreliminaryDefinitions
CompetitiveMarkets; Demandand Supply
Review
Competitive Markets; Demand and SupplyDemand Curve (a closer look)
There are two ways in which demand may increase:
1) A movement along the demand curve from A to B
- represents consumer reaction to a price change
- could follow a supply shift
20 / 26
Microeconomics IIntroduction
S. Farshad Fatemi
Introduction
PreliminaryDefinitions
CompetitiveMarkets; Demandand Supply
Review
Competitive Markets; Demand and SupplyDemand Curve (a closer look)
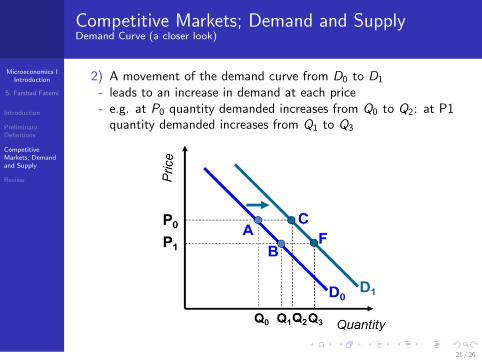
2) A movement of the demand curve from D0 to D1
- leads to an increase in demand at each price- e.g. at P0 quantity demanded increases from Q0 to Q2: at P1
quantity demanded increases from Q1 to Q3
21 / 26
Microeconomics IIntroduction
S. Farshad Fatemi
Introduction
PreliminaryDefinitions
CompetitiveMarkets; Demandand Supply
Review
Competitive Markets; Demand and SupplySupply Curve(a closer look)
Supply Curve (a closer look)
How does the supply curve shift (or change) if:
Production costs increases
Technology improves
Government regulation changes
22 / 26

Microeconomics IIntroduction
S. Farshad Fatemi
Introduction
PreliminaryDefinitions
CompetitiveMarkets; Demandand Supply
Review
Competitive Markets; Demand and SupplySupply Curve(a closer look)
Suppose safety regulations are tightened, increasing producers’costsThe supply curve shifts to S1S1
If the price stays at P0, there would be excess demandSo the market moves to a new equilibrium at E2
23 / 26

Microeconomics IIntroduction
S. Farshad Fatemi
Introduction
PreliminaryDefinitions
CompetitiveMarkets; Demandand Supply
Review
Competitive Markets; Demand and SupplySupply Curve(a closer look)
Suppose for some reason (disastrous harvest) the supply curveshifts to SSGovernment may try to protect the poor, setting a price ceilingat P1 which is below P0, the equilibrium price level and theresult is excess demandRATIONING is needed to cope with the resulting excess demandIs the allocation efficient?What happens to the consumer and supplier surplus?
24 / 26
Microeconomics IIntroduction
S. Farshad Fatemi
Introduction
PreliminaryDefinitions
CompetitiveMarkets; Demandand Supply
Review
Competitive Markets; Demand and Supply
Note
In practice, we cannot plot ex-ante demand curves and supplycurves. So we use historical data and the supposition that theobserved values are equilibrium ones
Since other things are often not constant, some detective workis required. This is where our theory becomes useful.
25 / 26
Microeconomics IIntroduction
S. Farshad Fatemi
Introduction
PreliminaryDefinitions
CompetitiveMarkets; Demandand Supply
Review
Review
The market:
Decides how much of a good should be produced,
by finding the price at which the quantity demanded equals thequantity supplied
Tells us for whom the goods are produced,
meaning those consumers willing to pay at least the equilibriumprice
Determines what goods are being produced:
there may be goods for which no consumer is prepared to pay aprice at which firms would be willing to supply
26 / 26