microbiological control in thin film composite ... -...
TRANSCRIPT
1
MICROBIOLOGICAL CONTROL IN THIN FILM COMPOSITE MEMBRANE SYSTEMS USING A HIGH PURITY
CHLORINE DIOXIDE SOLUTION
John Zupanovich, ChemTreat, Inc., 5640 Cox Road, Glen Allen, VA Email: [email protected] Phone: 804-935-2000
David Bishop, ChemTreat, Inc., Glen Allen, VA Andrew Doak, ChemTreat, Inc., Glen Allen, VA
Michael Duff, Covanta Energy of Lee County Fort Myers, FL
Abstract
Controlling microbiological growth is a primary issue facing industrial reverse osmosis systems. This problem is magnified in systems using reclaimed or tertiary treated waste water as the makeup source. Changes in federal, state and local environmental regulations have significantly increased the number of plants with limited or restricted access to high quality municipal or well water sources. Plants faced with these restrictions have been mandated to utilize available waste waters for many in-plant water requirements. Microbiological control in municipal, commercial and industrial water systems such as drinking water, plant process water and cooling water is accomplished by employing either oxidizing or non-oxidizing chemistries. These methods are generally effective for a variety of bacteria, fungi and algae if applied correctly. Considerations to system design, metallurgy, temperature, pH, residence time, organic loading, discharge restrictions, etc must all be considered. In addition, the microbiocide must be added in sufficient dosage to kill the target organisms, provide a chemical residual to maintain control and be introduced at a frequency and duration that will be effective and economical. Controlling microbiological growth in reverse osmosis systems has proven more challenging then treating other industrial water systems. The polymer structures comprising the membrane material are susceptible to degradation by strong halogen based oxidants such as chlorine and bromine. In addition, the nonoxidizing chemistries commonly used cooling water systems have shown potential to foul membrane surfaces or require long contact times and high dosages to be effective. The control of microbiological growth on reverse osmosis membranes is particularly problematic with the prominence of biofilms. The presence of biofilms on and inside of membranes causes numerous associated problems with system operation. A biofilm can increase cross membrane pressure, trap particulates that normally would be expelled with the reject flow, reduces the amount of membrane surface area available, increases the frequency of cleanings and provides protection for bacteria allowing the population to thrive.

2
Halogens are seldom used for direct contact with membranes because of the resulting oxidative damage. They are usually employed ahead of the machine to try and sterilize the feedwater entering the membranes. Any free residual is chemically removed prior to the cartridge filters. This technique is marginally effective. Non-oxidizing biocides are generally not used in these applications. Unlike the strong oxidizers that cause cell walls to lyse non-oxidizers normally function as systemic toxins. These require long contact times to disrupt certain metabolic functions and kill the bacteria. The characteristics of the polysaccharides that comprise most biofilms render most non-oxidizers marginally effective. Solubility and dispersion issues within or beneath the biofilm can easily compromise efficacy. Compounding these issues is the fact that if the organisms are killed, the biofilm remains in place and continues to cause issues with operation and performance. It also provides a safe haven and habitat for future growth. Chlorine dioxide has been used for microbiological control in reverse osmosis systems with marginal success reported in the literature. Because chlorine dioxide is a gas and is unstable in its concentrated form, its utilization has been limited to onsite generation and diffusion into water. Since it is a strong oxidant, there has been concern that damage to the polymer structure of the membrane would result from its use. While such damage has been reported, there is little scientific data evaluating the short or long term effects that chlorine dioxide has on polyamide structures found in thin film composite membranes. There are numerous ways to generate chlorine dioxide. Unfortunately, most result in the formation of by-products or the carryover of un-reacted precursors such as chlorate, chlorite or chlorine gas. All of these compounds are known to be aggressive to the polymer structures of TFC membranes. This paper describes the use of a high purity chlorine dioxide solution used to effectively control microbiological growth on tubular microfilters and brackish water reverse osmosis membranes in a utility plant that utilizes tertiary treated municipal waste water as the feedwater source. The chlorine dioxide used was a high purity solution devoid of the normal byproducts and un-reacted oxidants found in conventionally generated material. The evaluation covers nearly 18 months of continuous use. Several dosage levels were employed and membrane system operation and performance monitored. Detailed membrane autopsies were performed to determine their condition and try and identify any damage attributed to the treatment. Supplementing the field evaluation were laboratory studies with a variety of commercially available membrane polymers. These tests studied the long exposure of the polymer sheets to the high purity chlorine dioxide solution.
Introduction
Microbiological fouling in municipal, commercial and industrial membrane systems is universally prevalent and directly impacts performance over time. Cleaning frequency can increase in systems where there is little or no microbiological control employed to remove biofilms. The effective removal of such growth during a cleaning operation is directly related to

3
the complexity and abundance of the fouling present. Conventionally employed treatments and cleanings have historically been marginally effective. Chlorine dioxide is a strong oxidizer that can effectively control microbiological fouling and can increase runtimes between cleanings. Past research has demonstrated the efficacy of chlorine dioxide on biofouling. While there have been some studies on the impact of chlorine dioxide on thin film polyamide membrane polymers, much of this information has been biased by the presence of strong oxidizing byproducts in the chlorine dioxide solutions. This paper combines laboratory research and a full-scale case study in a power plant system that demonstrates the long-term effects of exposure to a high purity chlorine dioxide solution.
Biofilm
Biofilms are present in nearly every wetted natural or human designed system. In commercial, industrial and municipal water systems these biofilms can be problematic. They impede heat transfer, accelerate deposition, induce corrosion and alter the water flow rate and pressure drop in pipelines, process equipment and water storage tanks. Biofilms develop when a free floating microorganism adheres to a surface and then secretes a protective polysaccharide matrix (slime) layer. The slime layer protects the biofilm community by trapping nutrients from the water, and by shielding it from biocides. Biofilms have been extensively studied and found to be far more intricate and complex than initially thought. They are comprised of a very diverse assortment of organisms embedded in the protective polysaccharide matrix that function with remarkably well coordinated interactions within the community. Recent studies have indicate that these organisms make a transformation from free floating forms to a sessile form based on environmental conditions and chemical signals that turn on genetic and cell regulatory mechanisms. In essence, these microbes change their phenotype. These changes allow different organisms to coexist within the confines of the biofilm. It also makes microbiological control very difficult since you are not addressing just planktonic microorganisms in an aqueous solution but rather a combination of free floating as well as an adherent complex heterogeneous colony of microorganisms embedded in a protective polysaccharide sheath. It is also known that there can be wide differences between the chemical, physical and organismic composition of biofilms for different locations. These complexities make controlling their proliferation more difficult. In reverse osmosis systems biofilm growth is especially problematic. Because of their small size bacteria can easily enter the space between the membrane sheets. Once established, the bacteria driven biofilm grows rapidly. The accumulation of biofilm material can block or restrict flow to portions of the membrane. This results in high flow in some areas and low flow with reduced turbulence in other areas. Both conditions make cleaning the membrane of biofilm and trapped solids extremely difficult.

4
Plant Description
The Covanta Lee County, Florida facility has two refuse fired high pressure boilers with at combined output of 57 megawatts. The plant uses tertiary treated water supplied by the City of Fort Myers Waste Water Treatment Plant. A typical analysis is shown in table 1. The reclaimed water enters the plant where it is piped to a storage tank. Here further chlorination is possible. Due to the large tank volume a recirculation pump is used to provide enhanced internal circulation for increased halogen contact time when added. From the storage tank the water is pumped to a clarifier followed by dual media filters (4) and then to a clear well. The majority of this water is used as cooling tower makeup. A smaller volume is pumped to a bank of microfilters (2). When plant startups occur the clarifier is by-passed and a takeoff from the main plant supply line serves as cooling tower makeup. Also at startup the chlorinated water in the main storage tank is passed through two (2) activated carbon filter beds to dechlorinate and then through the microfilters. Out of the microfilters the water passes through a series of woven micron sized cartridge filters then through two (2) reverse osmosis systems. These are two stage single pass designs that are known as the cleanup RO’s. These units each have a 3x2 configuration with 4 membranes per pressure vessel. A typical water balance for each unit would be 62 gpm feedwater, 46 gpm recovery and 16 gpm reject. This yields a nominal 72 percent recovery. Influent pH is 8.4 and the temperature varies from the mid 70’s to the low 90’s. Permeate from the cleanup RO’s is collected in a tank and then pumped through a second single pass RO and then on to the boiler ion exchange system. Both of these cleanup RO systems run continuously, 24/7, regardless of boiler feedwater demand. Storage tank overflow for both microfilters and RO’s is collected and reused as cooling tower makeup.
Table 1. Plant Influent Water Analysis
Analysis Concentration
pH 7.4 Conductivity, µmhos 5,715
M-Alkalinity, mg/L as CaCO3 380 Calcium, mg/L as CaCO3 91
Magnesium, mg/L as CaCO3 32 Iron, mg/L as Fe 0.28
Copper, mg/L as Cu 0.05 Zinc, mg/L as Zn <0.01
Sodium, mg/L as Na 1,074 Potassium, mg/L as K 83 Chloride, mg/L as Cl 893 Sulfate, mg/L as SO4 1,499 Nitrate, mg/L as NO3 7.2
Ortho-Phosphate, mg/L as PO4 <5.0 Silica, mg/L as SiO2 17
Ammonia, mg/L as NH3 4 Total Organic Carbon, mg/L as TOC 22

5
Operating Problems
The raw water supplied to the plant arrives with a very small free chlorine residual. Additional halogen in the form of sodium hypochlorite has been introduced to the storage tank intermittently. The efficacy of this practice has proven less than ideal due to flow characteristics in the tank and widely varying halogen demand of the water. The composition of the reclaimed water is highly conducive to microbiological growth in both the cooling tower and the boiler pretreatment system. Microbiological control in the open circulating cooling tower uses sodium hypochlorite. Because of the demand a considerable quantity of bleach is required to maintain minimum microbiological growth. The water diverted to the pretreatment system is dechlorinated in the clarifier from the high pH or during startup conditions in the activated carbon beds and results in all membrane and filter components being subject to microbiological growth and associated biofouling. The microfilters are first in line see the effects of no biocidal treatment. The primary task of the microfilters, with a nominal pore size of 0.1 to 10 microns is to reduce suspended solids, colloids, macromolecules and bacteria. Without the presence of microbiological treatment the microfilters develop a significant biofilm on the polymer surface. Compounding this deposition is the entrapment of suspended solids that may carryover from dual media filters. The result was rapid fouling and elevated pressure differential. In addition to the microfilters, the cartridge filters and the cleanup RO’s membranes have also experienced serious biofouling issues. Normal operation was plagued with heavy slime growth that triggered high pressure differential alarms. These conditions resulted in short operating cycles and high backwash water volumes and frequency for the microfilters, frequent cartridge filter element replacement and excessive cleanings of the RO’s. The cartridge filters in service were 5 micron nominal and were changed on average every 12 to 14 days. The RO membranes were sent offsite for cleaning on a schedule of approximately every 2 to 3 weeks. The membranes never returned to their previous performance output. The membranes that the demin and cleanup RO’s employ are Dow FilmTec BW30-365FR. Since the cleanup RO membranes are exposed to such harsh service conditions with the tertiary water, the membranes are first used in the demin RO’s and then after 12 to 14 of service, they are transferred to the cleanup RO’s. The membranes have historically lasted 3 to 4 months in the cleanup RO’s.
Treatment Description
Over the years different non-halogen treatment approaches have been tried to control the microbiological growth issues in reverse osmosis systems. Our experience with them indicates that they are only marginally effective at microbiological growth and biofilm formation. Part of the problem is the biocidal mechanism behind these chemicals and also their intermittent use. The non-oxidizing treatments, being organic in composition, have also carried a steep price making continuous treatment even less suitable.

6
After lengthy discussions with plant personnel, it was decided to forgo the predictable results with conventional reverse osmosis microbiocides and try chlorine dioxide. Chlorine dioxide has been shown to provide excellent performance at biofilm control. There are numerous published references of chlorine dioxide usage in membrane systems. Some address microbiological control1 2 or cleaning and sterilizing3 4 5 6 7 8of reverse osmosis systems while others address membrane compatibility issues9. In most cases the efficacy of the chlorine dioxide chemistry in degrading biofilms is unquestionable. However, concerns arise relative to the damage or potential damage that chlorine dioxide may inflict on the membranes polymeric integrity. This has been shown to be a major issue in the past when consideration was given to using chlorine dioxide in RO systems. It was not clear if the damage to the membranes was due directly to chlorine dioxide or by-products that came with the onsite generation. With those concerns noted the decision was made to pursue an evaluation with a high purity chlorine dioxide product. Making this decision easier was the fact that the membranes currently in service were approximately 2 years old and replacement was imminent. At the start of treatment Unit 1’s membranes had been in service several months before those in Unit 2. This would give us additional information on the impact of the chlorine dioxide on membranes with longer service. The chlorine dioxide applied to this membrane system differs from those noted in previous published reports. The product, designated CL3000, is not generated on site by combining precursors. Instead it is commercially manufactured as a liquid solution containing a nominal 3,000 ppm of chlorine dioxide expressed as ClO2. The process used to make the solution is a patented method using thermally stable solid sodium chlorite and gaseous chlorine. The reaction produces only trace levels of ionic chlorite, ionic chlorate and molecular chlorine10 11. The general chemical reaction for generating the high purity chlorine dioxide used in this application is:
2NaClO2(solid) + Cl2(gaseous) → 2ClO2(gaseous) + NaCl(solid)
1 Pitochelli, A.R., Mainz, Eric L. and Griffith, David B., (2005), “Continuous Chlorine Dioxide Use to Prevent
Biofilm Formation on RO Membranes” Vulcan UltraPure Water, May/June. 2 Dimotsis, George, (2011), “Field Trial Experience Using Chlorine Dioxide as a Cleaner for Biofilm Control in an
RO Application”, IWC. 3 Firicano, F. (2005) “Selective Micro®Clean Chlorine Dioxide. Filmtec and Hydranautics TFC RO Membrane
Compatibility Test,” July 6. 4 Hydranautics (2004) “Potential Use of ClO2 as a Disinfectant for Polyamide RO/NF Membranes” September. 5 Siemens Water Technologies (2009) “Literature Review of the Effects of ClO2 on RO Membranes,” Applications
Bulletin, AB 85.272-18 UA. 6 Wise, Brian, Marker, Laurie, Mueller, Paul, (2004) “Effectiveness of Chlorine Dioxide in Sanitizing Thin-film
Membrane Systems,” GE Osmonics, Ultrapure Water, September. 7 Bohner, H. F., and Bradley, R. L., (1991) “Corrosivity of Chlorine Dioxide Used as Sanitizer in Ultrafiltration
Systems,” Journal of Dairy Science. 8 Glater, J., Zachariah, M.R., McCray, S.B., and McCuthan, J.W. (1983), Elsevier Science Publishers. 9 Hach, “Chlorine Dioxide, LR (0 to 1.00 mg/L) for Wastewater, Method 8065,” DR/2010 Spectrophotometer
Procedures Manual. 10 White, Geo. Clifford (1998) “Handbook of Chlorination and Alternative Disinfectants” Fourth Edition, Wiley-
Interscience. 11 CDG Environmental, LLC (2009), “Transport, Handling, and Application of CDG3000™ For Commercial and
Industrial Applications,” August.

7
The chemistry and properties of chlorine dioxide are well known as are the numerous commercially viable manufacturing processes. Those topics are thoroughly documented in the literature and are outside the context of this paper. However, a few relevant characteristics of chlorine dioxide are worth noting here. Chlorine dioxide (ClO2) is a gas at room temperature with a high water solubility. It does not hydrolyze in water. As a rule it is generated on site and dissolved into water to form a very dilute solution. This avoids the issues associated with handling and storing unstable ClO2 gas. Chlorine dioxide is a selective oxidant that does not chlorinate. As to its oxidative strength it ranks lowest among oxidants commonly used in industrial and municipal water and wastewater treatment. The low oxidation-reduction potential (ORP) is only half the story. The total oxidative capacity of chlorine dioxide is much higher than most other oxidants allowing lower dosages to achieve the same endpoint. Table 2 shows the comparison of the ORP values for halogens and ozone10. What makes chlorine dioxide a very appealing candidate for biofilm control in reverse osmosis systems is its selective oxidative characteristics. When considering tertiary wastewater as the source of feedwater to such systems this trait has even more appeal.
Table 2. Oxidation-Reduction Potentials (Eo) at 25°C for Halogens
Reaction Potential in Volts (Eo)
O3 + 2H- 2e = O2 +H2O 2.07 HOCl + H+ +2e = Cl- + H2O 1.49
Cl2 + 2e = 2Cl- 1.36 HOBr + H+ = 2e = Br- + H2O 1.33 O3 + H2O + 2e = O2+ 2OH- 1.24
ClO2 + e = ClO2- 1.15
Br2 + 2e = 2Br 1.07 ClO2 (aq) + e + ClO2
- 0.95 OCl- + H2O + 2e = Cl- + 2OH- 0.90 OBr- + H2O + 2e = Br-+ 2OH- 0.70
ChemTreat CL3000 Treatment
The following chronologically details the treatment of the plants membrane systems with the CL3000 product. As the program progressed, variations in temperature, water quality, demand and observations in performance dictated that modifications in dosage, feed location and system components be made. The initial feed of the CL3000 solution began on October 30, 2009. The chemical was added ahead of the 5µ cartridge filters of the cleanup RO’s to yield 33 ppm product or 0.1 ppm as ClO2 in the feedwater and dosed once each shift for one (1) hour. The actual chemical addition rate was based on demand studies of the feedwater. As noted previously, impurities in this product

8
are low. At the 0.1 ppm ClO2 there is 0.000017 ppm (0.017 ppb) free chlorine and 0.00038 ppm (0.38 ppb) of ionic chlorite. Improved pressure drop across the cartridge filters and slowing of first stage pressure differentials were noticed within a few days. Both cleanup RO units showed similar beneficial results. The treatment protocol continued for two months with the differential pressure rising and falling with the thrice daily chemical additions. The inlet feed pressure increased at a much slower rate as well. On January 2, 2010, the decision was made to investigate if moving the CL3000 feed point to the inlet of the microfilters would improve their performance. The resulting move improved operation of the microfilters by reducing the pressure drop across the filters during operating cycles. While the once per shift application showed significant benefits, controlling the microbiological growth was limited by the dosage and available contact time. It was decided that the intermittent feed would be changed to continuous feed at the same product concentration level. Continuous addition was initiated on February 5, 2010, at the 33 ppm product concentration yielding 0.1 ppm as ClO2 in the feedwater. From this point on the dosage was set based on the flow rate of the feedwater to the microfilters. Within 48 hours of chemical addition, the gradually increasing pressure differentials leveled off and began to show a decrease. The inlet feed pressure dropped significantly as well. At the normal 14 day cartridge filter change out, it was observed that the typical brownish red slime that coated the elements was noticeably faded in color and slime content drastically reduced. With the microfilters running at design backwash intervals, the cleanup RO cartridge filters noticeably less fouled and the primary feed pressure and differential pressures all lower we chose to operate with a continuous feed. In the spring of 2010, the 5µ cartridge filters were replaced with nominal 1µ cartridge filters. The improved operation and lack of biofouling allowed for this change to a smaller pore size filter. Currently these components are changed every 8 weeks, a significant improvement in run length, particulate size removal and cost savings. On June, 2010 the dosage level for the CL3000 was increased to 66 ppm yielding a 0.2 ppm as ClO2 feedwater concentration. This elevation in demand was driven by the increase in water temperature that aided in the proliferation of bacteria and associated biofilm. The increased dosage resulted in a drastic drop in differential pressures in both units. A further increase in dosage to 83 ppm of CL3000 giving 0.25 ppm as ClO2 was made to satisfy an increased demand on July 11, 2010. This dosage was held for approximately 3 weeks. The dosage was reduced to 66 ppm and maintained until October 21, 2010. At that point the water temperature and demand were significantly lower. The dosage remained constant until March 23, 2011 when warm water temperatures and demand returned to the cycle. Depending on temperature and demand the dosage has oscillated between 33 and 83 ppm as CL3000. Tables 3 and 4 are graphs showing the RO inlet feed pressure for Unit 1 and Unit 2, respectively. As noted previously, Unit 1 had membranes that had more time in service. This is indicated by the initially higher inlet feed pressure shown in table 3.
9
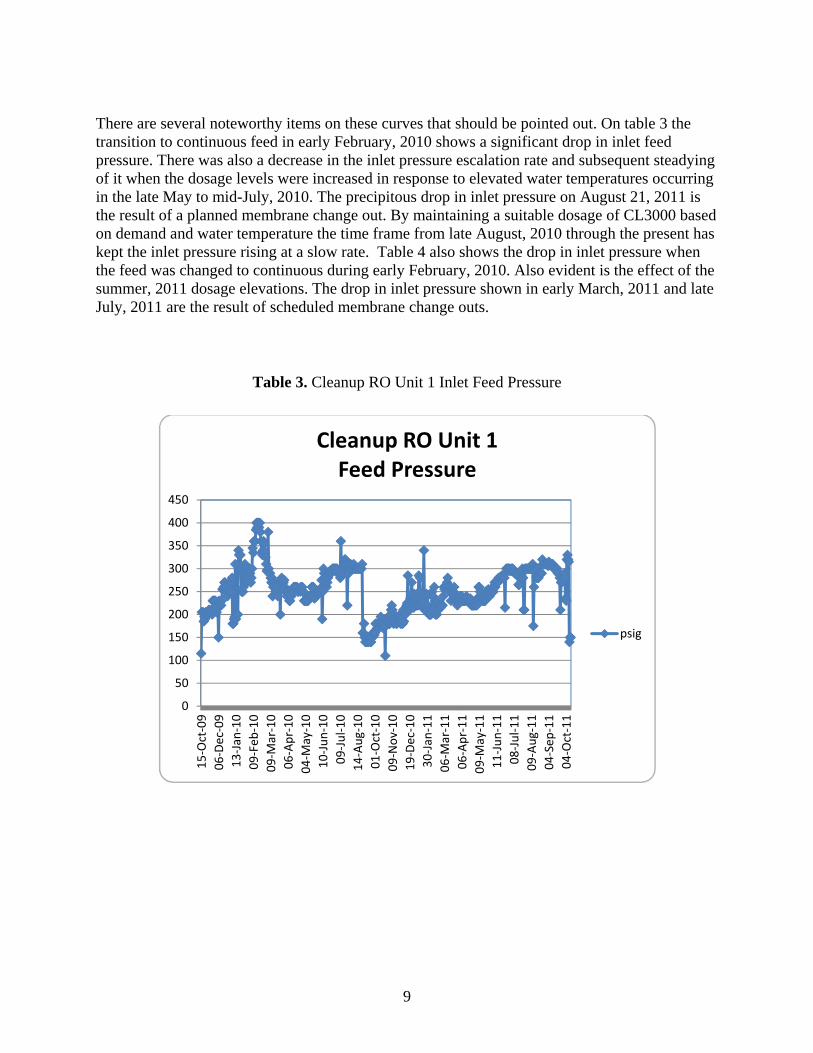
There are several noteworthy items on these curves that should be pointed out. On table 3 the transition to continuous feed in early February, 2010 shows a significant drop in inlet feed pressure. There was also a decrease in the inlet pressure escalation rate and subsequent steadying of it when the dosage levels were increased in response to elevated water temperatures occurring in the late May to mid-July, 2010. The precipitous drop in inlet pressure on August 21, 2011 is the result of a planned membrane change out. By maintaining a suitable dosage of CL3000 based on demand and water temperature the time frame from late August, 2010 through the present has kept the inlet pressure rising at a slow rate. Table 4 also shows the drop in inlet pressure when the feed was changed to continuous during early February, 2010. Also evident is the effect of the summer, 2011 dosage elevations. The drop in inlet pressure shown in early March, 2011 and late July, 2011 are the result of scheduled membrane change outs.
Table 3. Cleanup RO Unit 1 Inlet Feed Pressure
0
50
100
150
200
250
300
350
400
450
15‐Oct‐09
06‐Dec‐09
13‐Jan
‐10
09‐Feb
‐10
09‐M
ar‐10
06‐Apr‐10
04‐M
ay‐10
10‐Jun‐10
09‐Jul‐10
14‐Aug‐10
01‐Oct‐10
09‐Nov‐10
19‐Dec‐10
30‐Jan
‐11
06‐M
ar‐11
06‐Apr‐11
09‐M
ay‐11
11‐Jun‐11
08‐Jul‐11
09‐Aug‐11
04‐Sep
‐11
04‐Oct‐11
Cleanup RO Unit 1Feed Pressure
psig

10
Table 4. Cleanup RO Unit 2 Inlet Feed Pressure
Laboratory Testing: Experimental
While the plant application of CL3000 showed highly beneficial results to both the microfilters and RO systems we were constantly evaluating the RO effluent quality for changes that may indicate oxidative damage to the membrane material. We had observed no deviation in effluent quality including silica and salt passage levels after approximately 12 months of CL3000 addition. While performance of the cleanup RO’s and permeate quality were promising, we wanted to ensure that the membranes were in fact undamaged by continuous feed of the chlorine dioxide. In addition to effluent quality monitoring, the ideal method to determine if chemical and or physical damage had been done to the membranes would be to conduct an autopsy. We wanted to look at a membrane that would have seen the highest dosage of chlorine dioxide for the longest duration. Unfortunately, barring an unscheduled plant outage it would be many months until we could get the chance to pull and autopsy a membrane.
As an alternative, until a membrane became available, we developed a series of laboratory tests to expose new membrane material to the CL3000 product at high dosages and for extended periods in an effort to accelerate any damaging effects. Following exposure, salt passage test were run as were Fujiwara and scanning electron microscopy in an effort to determine oxidative and physical damage.
0
50
100
150
200
250
300
350
400
45015‐Oct‐09
07‐Dec‐09
12‐Jan
‐10
16‐Feb
‐10
25‐M
ar‐10
01‐M
ay‐10
12‐Jun‐10
19‐Jul‐10
27‐Aug‐10
25‐Sep
‐10
01‐Nov‐10
09‐Dec‐10
16‐Jan
‐11
25‐Feb
‐11
13‐Apr‐11
18‐M
ay‐11
22‐Jun‐11
03‐Aug‐11
13‐Sep
‐11
Cleanup RO Unit 2Feed Pressure
psig

11
Two membrane types were used during the laboratory testing, Dow FilmTec BW30-365 and Hydranautics CPA3. Samples of the polymeric sheets of each type were obtained directly from the manufacturers. These two membranes are widely used in the power industry for the production of high purity water for boiler feedwater.
A 2,000 ppm NaCl stock solution was made for the purpose of testing coupon sections of each membrane for salt rejection and salt passage. The test conditions used were: 250 psig inlet pressure, 15 percent recovery and a solution pH of 6.0 at 65°F. A control coupon was used as a reference for comparison to the coupons exposed to the CL3000 chlorine dioxide solution. The high purity chlorine dioxide solution was assayed each day to ensure accurate concentration and exposure time. The chlorine dioxide test solution was analyzed using the Hach chlorophenol red method. With this standard method “Chlorine Dioxide (ClO2) is determined by its combination with chlorophenol red indicator at pH 5.2 to form a colorless complex. The net effect is bleaching of the color in an amount proportional to the chlorine dioxide concentration. The method is specific for ClO2 and is unreactive to other active chlorine or moderate oxidizing compounds.”9 Once the assay was established, an aliquot of 15 ppm as active ClO2 was dosed in deionized water to form the test solution. The coupons were exposed to the test solution for 24 hours. At the end of each 24 hour exposure period the assay was rerun and the determined values used to calculate the ppm/hrs of exposure time. The exposed coupons were then retested using the 2,000 ppm NaCl solution for salt rejection and salt passage at the end of each 24 hour exposure time. A feed water and permeate analysis were collected following each post-exposure test. These analyses were used to evaluate membrane performance. After each exposure period the salt rejection and salt passage were calculated for the effect of chlorine dioxide on the membranes.
Laboratory Testing: Results
The laboratory performance testing results did not show any increase in salt passage following the exposure of the membrane materials to the chlorine dioxide solution. These conclusions are based on three parameters of permeate quality: conductivity, sodium passage and chloride passage. During each test run the residual chlorine dioxide decreased over the exposure time. The initial 24 hour exposure period saw the most significant decrease. The subsequent test showed much smaller losses. This behavior was observed for both membrane types. These losses are likely due to chemical interaction with the free amine sites left on the membrane surfaces. These sites are generally deactivated by the initial exposure to the feedwater constituents. Therefore, once a membrane has been in service for short period these sites will become neutralized and will have a diminishing effect on chlorine dioxide. The best practice for the safe application of chlorine dioxide for the prevention of microbiological fouling would be to allow a short “break in” time for the membranes to establish baseline performance prior to the application of chlorine dioxide.

12
Membrane samples exposed to feedwater flow prior to chlorine dioxide exposure did not demonstrate the same chlorine dioxide residual loss. The water analyses derived during the coupon exposure testing is shown in tables 5, 6, and 7. The average percent rejection is based on the conductivity and sodium and chloride concentrations in the permeate relative to the feed water. Initial chlorine dioxide concentrations were based on making a fresh exposure solution after each 24 hour period. The final concentration was measured at the end of each exposure period. The assumption was made that the decomposition of the chlorine dioxide concentration is a linear function. Based on these criteria the total exposure time was calculated. The cumulative exposure time is shown in the bottom row of each analysis. These represent an estimated 800–1,000 ppm per hour. This protocol was based on the RO units in the case study running 24 hours per day for a year at 0.1 ppm active ClO2. As noted previously, this dosage level was demonstrated to be effective at controlling microbiological growth, extending run times between cleanings, reducing maintenance time for membrane change out and ensuring permeate quality meets the plant requirements.
Table 5. Laboratory Salt Passage/Rejection Data
0–24 hrs Feed Control BW30-365 CPA3
pH 5.7 5.9 5.8 6.7 Conductivity 3,741.0 85.0 64.0 78.0
Sodium 736.0 11.0 8.6 8.8 Chloride 1,100.0 25.0 21.0 19.0
Avg. % Rejection X 98.1 98.6 98.5 Initial ClO2 conc., ppm X X 15.0 15.0 Final ClO2 conc., ppm X X 4.2 7.1
Total exposure time, ppm/hr X X 240.0 276.3
Table 6. Laboratory Salt Passage/Rejection Data
24–48 hrs Feed Control BW30-365 CPA3 pH 6.8 5.8 5.8 6.1 Conductivity 4,000.0 91.0 47.0 41.0 Sodium 819.0 15.0 6.1 4.4 Chloride 1,332.0 29.0 14.0 11.0 Avg. % Rejection X 98.1 99.1 99.2 Initial ClO2 conc., ppm X X 15.0 15.0 Final ClO2 conc., ppm X X 12.1 11.8 Total exposure time, ppm/hr X X 578.8 611.3
13
Table 7. Laboratory Salt Passage/Rejection Data
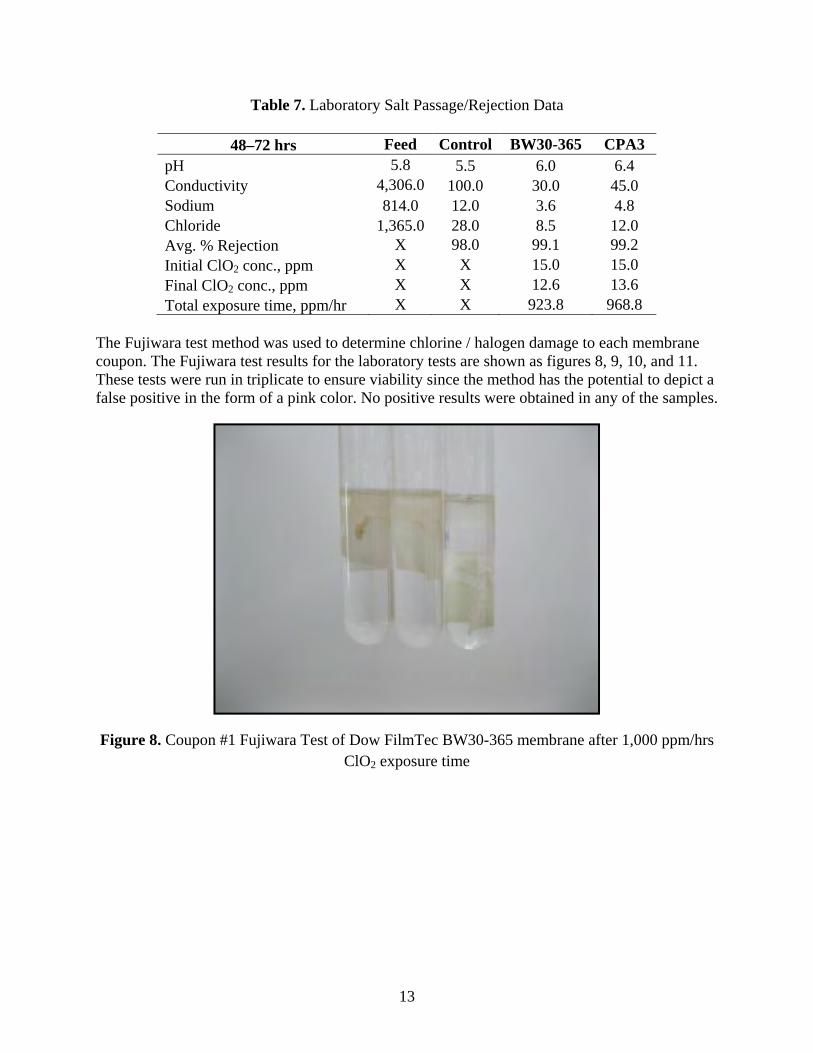
48–72 hrs Feed Control BW30-365 CPA3 pH 5.8 5.5 6.0 6.4 Conductivity 4,306.0 100.0 30.0 45.0 Sodium 814.0 12.0 3.6 4.8 Chloride 1,365.0 28.0 8.5 12.0 Avg. % Rejection X 98.0 99.1 99.2 Initial ClO2 conc., ppm X X 15.0 15.0 Final ClO2 conc., ppm X X 12.6 13.6 Total exposure time, ppm/hr X X 923.8 968.8
The Fujiwara test method was used to determine chlorine / halogen damage to each membrane coupon. The Fujiwara test results for the laboratory tests are shown as figures 8, 9, 10, and 11. These tests were run in triplicate to ensure viability since the method has the potential to depict a false positive in the form of a pink color. No positive results were obtained in any of the samples.
Figure 8. Coupon #1 Fujiwara Test of Dow FilmTec BW30-365 membrane after 1,000 ppm/hrs ClO2 exposure time

14
Figure 9. Coupon #2 Fujiwara Test of Dow FilmTec BW30-365 membrane after 1,000 ppm/hrs ClO2 exposure time
Figure 10. Coupon #3 Fujiwara Test of Dow FilmTec BW30-365 membrane after 1,000 ppm/hrs ClO2 exposure time
15
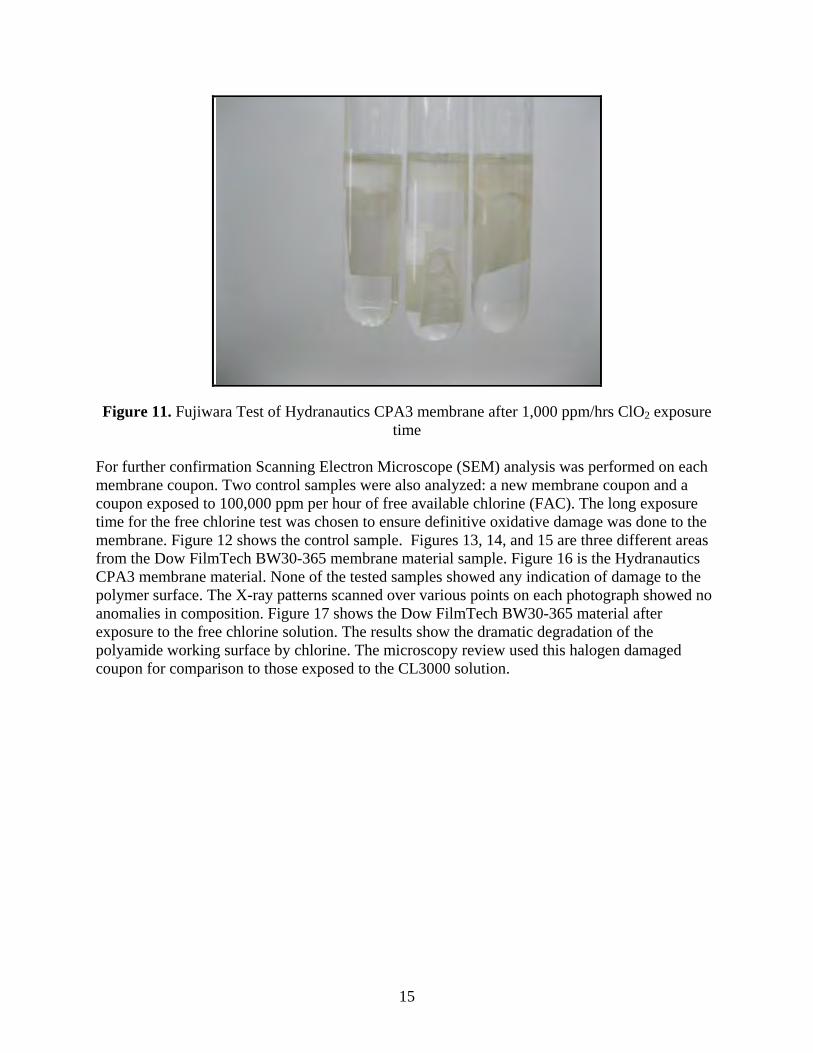
Figure 11. Fujiwara Test of Hydranautics CPA3 membrane after 1,000 ppm/hrs ClO2 exposure
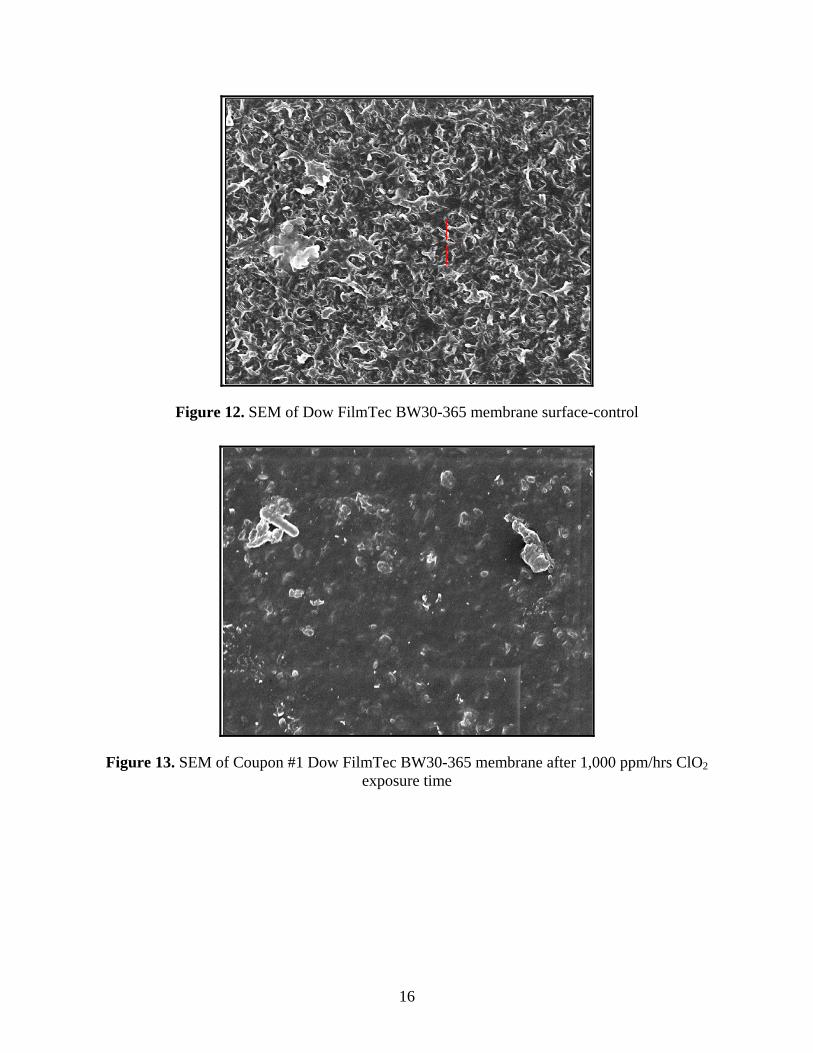
time For further confirmation Scanning Electron Microscope (SEM) analysis was performed on each membrane coupon. Two control samples were also analyzed: a new membrane coupon and a coupon exposed to 100,000 ppm per hour of free available chlorine (FAC). The long exposure time for the free chlorine test was chosen to ensure definitive oxidative damage was done to the membrane. Figure 12 shows the control sample. Figures 13, 14, and 15 are three different areas from the Dow FilmTech BW30-365 membrane material sample. Figure 16 is the Hydranautics CPA3 membrane material. None of the tested samples showed any indication of damage to the polymer surface. The X-ray patterns scanned over various points on each photograph showed no anomalies in composition. Figure 17 shows the Dow FilmTech BW30-365 material after exposure to the free chlorine solution. The results show the dramatic degradation of the polyamide working surface by chlorine. The microscopy review used this halogen damaged coupon for comparison to those exposed to the CL3000 solution.
16
Figure 12. SEM of Dow FilmTec BW30-365 membrane surface-control
Figure 13. SEM of Coupon #1 Dow FilmTec BW30-365 membrane after 1,000 ppm/hrs ClO2 exposure time

17
Figure 14. SEM of Coupon #2 Dow FilmTec BW30-365 membrane after 1,000 ppm/hrs ClO2 exposure time
Figure 15. SEM of Coupon #3 Dow FilmTec BW30-365 membrane after 1,000 ppm/hrs ClO2
exposure time

18
Figure 16. SEM of Hydranautics CPA3 membrane after 1,000 ppm/hrs ClO2 exposure time
Figure 17. SEM of Dow FilmTec BW30-365 membrane after 100,000 ppm/hrs chlorine exposure time
Membrane Analysis During a scheduled plant outage in May and June, 2011 we were able to pull a membrane from the Unit 2 cleanup RO. The membrane obtained had seen at least 2.25 years of continuous service that included approximately 15 months of continuous exposure to 0.1 to 0.25 mg/L of ClO2. A complete autopsy was performed that included visual inspection, Fujiwara test for

19
oxidation damage, deposit analysis, salt passage testing and scanning electron microscopy of the polymer surface. The results of the Fujiwara test and the SEM image of the membrane surface are shown in figures 18 and 19, respectively. No detectible damage to the membrane was observed by either method. In addition, the salt rejection/passage testing showed the rejection rate was still in 98+ percent range after the in service period.
Figure 18. Fujiwara Test of Unit 2 Dow FilmTec BW30-365 membrane after 15 months in service with continuous ClO2 exposure
Figure 19. SEM of Unit 2 Dow FilmTec BW30-365 membrane after 15 months in service with continuous ClO2 exposure

20
Once the membrane was dismantled, the individual membrane sheets showed the effect of uncontrolled microbiological growth that formed prior to treatment. The biofilm matrix easily penetrated two-thirds of the length of the membrane. While the CL3000 treatment can effectively mitigate the presence of live organisms in this matrix, the actual polysaccharide material and entrapped particulates cannot be effectively removed even by extensive cleaning. The interned slime layer devoid of bacteria continues to affect the flow rate of water and turbulence across segments of the membrane as well as the pressure across the membrane. The importance of having an effective microbiological control program in place from the start and maintaining it cannot be overstated.
Summary Controlling microbiological growth in reverse osmosis systems has proven challenging. Changes in federal, state and local environmental regulations have significantly increased the number of plants with limited or restricted access to high quality municipal or well water sources. Plants faced with these restrictions have been mandated to utilize available waste waters for many in-plant water requirements. This restriction has magnified microbiological control issues in membrane systems utilizing these reclaimed or tertiary treated waste waters as the makeup source. The application of a high purity chlorine dioxide solution (CL3000) has been demonstrated to be an effective treatment to control biofilm formation in RO and microfilter membrane systems using tertiary water. Effective control was achieved using dosage levels of from 0.1 to 0.25 ppm as ClO2. Adjustments to the dosage will likely be required as chemical demand and temperatures vary. The data developed during the accelerated laboratory tests showed no physical damage to the membrane and no adverse affect on salt passage/rejection over unexposed conditions using the high purity CL3000 chlorine dioxide solution. Monitoring of permeate samples during the first 15 months of the CL3000 application has shown no reduction or degradation in permeate quality. The detailed autopsy of the membrane exposed to 15 months of continuous high purity chlorine dioxide at 0.1 to 0.25 ppm as ClO2 showed no oxidative or physical degradation to the membrane. The current plant application of the CL3000 product has showed no adverse impact to permeate quality after 26 months of continuous feed at residuals of 0.1 to 0.25 ppm as ClO2. Periodic testing for chlorine dioxide around the system showed wide variation in the presence or absence of the molecule and the concentration. This was attributed to the fluctuating demand of the influent water.

21
The use of high purity chlorine dioxide solution, CL3000, is now a standard treatment for the plants membrane systems.
Acknowledgement The authors would like to thank Chris Luallen, Auxiliary Engineer and Verle Allen Fred, III, Auxiliary Engineer for their assistance in setup, monitoring, and maintenance of the chemical feed system. Their observations and input on many aspects of this project greatly added in the success of this application.