microarray analysis of brassinosteroid-regulated … · microarray analysis of...
TRANSCRIPT
Microarray Analysis of Brassinosteroid-RegulatedGenes in Arabidopsis
Hideki Goda, Yukihisa Shimada*, Tadao Asami, Shozo Fujioka, and Shigeo Yoshida
Plant Science Center and Plant Functions Laboratory, RIKEN, 2–1 Hirosawa, Wako-shi,Saitama 351–0198, Japan
Brassinosteroids (BRs) are steroidal plant hormones that are essential for growth and development. Although insights intothe functions of BRs have been provided by recent studies of biosynthesis and sensitivity mutants, the mode of action of BRsis poorly understood. With the use of DNA microarray analysis, we identified BR-regulated genes in the wild type (WT;Columbia) of Arabidopsis and in the BR-deficient mutant, det2. BR-regulated genes generally responded more potently inthe det2 mutant than in the WT, and they showed only limited response in a BR-insensitive mutant, bri1. A small group ofgenes showed stronger responses in the WT than in the det2. Exposure of plants to brassinolide and brassinazole, which isa specific inhibitor of BR biosynthesis, elicited opposite effects on gene expression of the identified genes. The list ofBR-regulated genes is constituted of transcription factor genes including the phytochrome-interacting factor 3, auxin-relatedgenes, P450 genes, and genes implicated in cell elongation and cell wall organization. The results presented here providecomprehensive view of the physiological functions of BRs using BR-regulated genes as molecular markers. The list ofBR-regulated genes will be useful in the characterization of new mutants and new growth-regulating compounds that areassociated with BR function.
Exogenous application of brassinosteroids (BRs) atnanomolar to micromolar concentrations to plantsinduces a wide range of physiological effects, includ-ing promotion of cell elongation and division, trac-heary element differentiation, gravitropic tissuebending, ethylene biosynthesis, and stress resistanceas well as retardation of abscission (Mandava, 1988;Clouse and Sasse, 1998; Sasse, 1999). BR-deficient or-insensitive mutants of Arabidopsis, pea (Pisum sati-vum), or tomato (Lycopersicon esculentum) exhibitpleiotropic phenotypes such as dwarfism, dark greenleaves, reduced fertility, prolonged life span, andabnormal skotomorphogenesis (Szekeres and Koncz,1998; Clouse and Feldmann, 1999; Mussig and Alt-mann, 1999; Bishop and Yokota, 2001). Recent molec-ular studies thus have indicated that promotion ofcell expansion and regulation of photomorphogenicresponses are among the most important roles ofBRs. The mechanisms by which BRs exert these ac-tions, however, are poorly understood. This studyaddresses both of these issues.
The expression of several genes has been shown tobe regulated by BRs, especially within relativelyshort periods after BR treatment (Xu et al., 1995, 1996;Szekeres et al., 1996; Goetz et al., 2000; Hu et al., 2000;Mussig et al., 2000; Jiang and Clouse, 2001). To gaininsight into the mechanism of BR action at the mo-lecular level, we have now screened for genes inArabidopsis that respond relatively rapidly to BR
exposure. We exposed a BR-deficient mutant, det2, orwild type (WT) to either 10 nm brassinolide (BL) ormock treatment and then used a highly reproducibleoligonucleotide-based array, the Arabidopsis Ge-nome Array (Affymetrix, Santa Clara, CA; Lockhartand Winzeler, 2000) to compare the abundance oftranscripts corresponding to �8,000 genes betweenthe two treatment groups. Our results represent themost comprehensive study to date of the BR-regulated genes.
RESULTS AND DISCUSSION
Identification of BR-Regulated Genes in the det2Mutant and WT
We exposed the BR-deficient mutant, det2, to either10 nm BL or a mock treatment for both 15 min and 3 hand then compared the abundance of �8,000 genetranscripts between the two treatment groups usingthe Affymetrix Arabidopsis Genome Array. Hybrid-ization was performed with biotin-labeled cRNAsamples prepared from different plant samples inthree independent experiments. The fold change (FC)values, which represent ratios of hybridizationsignals (the average differences [AvDf]) betweenmock- and BL-treated plants, were calculated usingMicroarray Suite software (Affymetrix). Down-regulated genes (Table I) and up-regulated genes(Table II) are listed with their FC values, which wereobtained with or without signal amplification usingan anti-streptavidin antibody. No genes respondedin a reproducible manner to a 15-min BR treatment.
A single GeneChip experiment, for example for the3-h exposure experiment, revealed that 1,009 of 8,300
* Corresponding author; e-mail [email protected];fax 81– 48 – 462– 4674.
Article, publication date, and citation information can be foundat www.plantphysiol.org/cgi/doi/10.1104/pp.011254.
Plant Physiology, November 2002, Vol. 130, pp. 1319–1334, www.plantphysiol.org © 2002 American Society of Plant Biologists 1319 www.plantphysiol.orgon June 28, 2018 - Published by Downloaded from Copyright © 2002 American Society of Plant Biologists. All rights reserved.

Table I. Genes down-regulated by BRs in the det2 mutant
When genes have names on publications or on database, we adopted their names. Otherwise, we designated genes from BRD1 to BRD12.Amplified and No-Amp., Before and after signal amplification with antibody, respectively.
Gene Name Accession No. Function or Comment AffymetrixNo.
det2 WT
Amplified No-Amp. Amplified No-Amp.
FC � SE FC � SE FC � SE FC � SE
DWF4/CYP90B1 AF044216 BR biosynthesis (P450) 13870_at �7.5 � 0.76 �3.4 � 0.29 �2.8 � 0.40 �1.8 � 0.10CPD/CYP90A1 X87367 BR biosynthesis (P450) 16042_s_at �2.5 � 0.66 �3.7 � 0.37 �4.0 � 1.30 �4.0 � 0.40ROT3/CYP90C1 AB008097 Leaf polar elongation
(P450)16535_s_at �4.5 � 0.45 �3.8 � 0.17 �2.1 � 0.10 �2.3 � 0.05
CYP71B3 D78602 Expression in olderleaves (P450)
17039_at �2.6 � 0.20 �2.3 � 0.49 �2.3 � 0.80 �1.3 � 0.25
PIF3 AF100166 PIF3 14630_s_at �2.1 � 0.07 �2.1 � 0.09 �1.1 � 0.05 �0.1 � 1.05NIA1/NR1 X13434 Nitrate reductase
(cytokinin-regulatedtype)
14240_s_at �3.0 � 0.62 �4.0 � 0.32 �4.2 � 0.15 �4.6 � 0.05
XTR7 U43489 Putative xyloglucanendotransglycosylase
15178_s_at �3.1 � 0.46 �3.5 � 0.55 �1.7 � 0.05 �1.5 � 0.00
AAP3 X77499 Amino acid transporter(His uptakecomplement)
12372_at �4.5 � 0.59 �4.5 � 0.99 �2.0 � 0.10 �2.1 � 0.05
AAP4 X77500 Amino acid transporter(His uptakecomplement)
16522_at �2.3 � 0.12 �2.4 � 0.35 �1.7 � 0.10 �2.0 � 0.05
AtKUP1 AF029876 High-affinity potassiumtransporter
16119_s_at �6.5 � 0.56 �6.3 � 0.50 �2.3 � 0.00 �2.2 � 0.30
AKT2 U40154 Potassium channel 16163_s_at �4.4 � 0.71 �2.6 � 0.23 �2.5 � 0.10 �1.7 � 0.00AtNAS1 AB021934 Nicotianamine synthase 20547_at �3.3 � 0.12 �3.3 � 0.31 �2.2 � 0.20 �2.3 � 0.25AtmybL2 Z68157 Leaf-specific myb-related
protein20362_at �2.9 � 0.42 �2.5 � 0.33 �2.1 � 0.70 �1.9 � 0.55
Athb-5 X67033 Athb family Leu-zipperprotein
20389_at �2.4 � 0.12 �2.2 � 0.31 �2.4 � 0.25 �2.1 � 0.00
MS2-likeprotein
X99923 Fatty acyl CoA reductasehomolog
19177_at �2.9 � 0.43 �3.3 � 0.35 �8.7 � 2.60 �4.6 � 2.10
CYP78A6 AC006418/F13A10.19 P450 monooxygenase 18190_at �7.3 � 0.73 �2.9 � 0.59 �3.7 � 0.50 �1.5 � 0.30CYP81H1 Z99707/C7A10.50 P450 monooxygenase 20271_at �3.5 � 0.18 �3.1 � 0.59 �2.6 � 0.00 �1.5 � 0.35CYP710A AC004481/F13P17.32 P450 monooxygenase 14856_at �4.1 � 0.20 �4.4 � 0.50 �3.9 � 0.05 �3.4 � 0.60CYP96A1 AC002391/T20D16.19 P450 monooxygenase 19281_i_at �3.2 � 0.12 �2.5 � 0.65 �2.0 � 0.40 �1.9 � 0.55CYP96A9 AL078620/F23D16.110 P450 monooxygenase 19730_at �2.5 � 0.23 �2.2 � 0.38 �1.5 � 0.00 �1.6 � 0.00PAP1/IAA26 AF088281 IAA gene family/putative
phytochrome-associated protein
16078_at �3.4 � 0.49 �2.7 � 0.07 �2.6 � 0.20 �2.7 � 0.25
iaglu U81293 Putative indole-3-acetate�-D-glucosyltransferase
16603_s_at �3.1 � 0.42 �2.9 � 0.24 �1.3 � 0.20 �1.4 � 0.15
PIN7 AF087820 Putative auxin effluxcarrier protein
17576_at �2.2 � 0.06 �2.2 � 0.17 �1.7 � 0.00 �1.6 � 0.00
MYB55 AF176000 MYB-like gene 17977_at �5.0 � 0.37 �4.5 � 1.00 �3.7 � 0.95 �2.4 � 0.05BRD1 AL049746/T23J7.130 Aldose 1-epimerase like
protein12998_at �2.5 � 0.20 �2.3 � 0.38 �2.0 � 0.00 �1.7 � 0.10
BRD2 AC006836/F19B11.20 Putative sulfotransferase 19127_at �2.5 � 0.29 �2.5 � 0.29 �2.0 � 0.10 �2.2 � 0.35BRD3 AL049171/T25K17.30 Putative caffeoyl-CoA
O-methyltransferase19348_at �2.3 � 0.25 �2.3 � 0.26 �1.2 � 0.05 0.0 � 1.15
BRD4 AL035528/F18A5.290 Leu-rich repeat protein 14110_i_at �4.0 � 0.35 �1.9 � 0.38 �2.0 � 0.10 �1.3 � 0.10BRD5/SAUR36a AC002387/F4L23.28 Auxin-inducible SAUR
gene homolog14448_at �4.4 � 0.85 �2.9 � 0.70 �3.0 � 0.20 �1.7 � 0.25
BRD6 AL049659/T29H11.120 Putative DNA-bindingprotein (BTB domain)
19977_at �4.1 � 0.47 �3.8 � 0.50 �2.1 � 0.30 �2.3 � 0.50
BRD7 AC002335/T01O24.18 MYB-like gene 18780_at �4.2 � 0.82 �2.7 � 0.15 �2.2 � 0.45 �1.2 � 0.05BRD8 AC007659/T14P1.14 GATA-type zinc finger
protein13168_i_at �2.2 � 0.13 �2.2 � 0.06 �1.6 � 0.05 �1.7 � 0.35
BRD9 Z99708/C7A10.580 Unknown 19221_at �3.2 � 0.15 �3.1 � 0.23 �2.4 � 0.40 �2.4 � 0.15BRD10 AL035605/F19F18.30 Unknown 19398_at �2.9 � 0.18 �2.9 � 0.15 �2.2 � 0.05 �2.3 � 0.10BRD11 AC006224/MFL8.8 Unknown 20174_at �5.2 � 0.27 �4.2 � 0.46 �3.6 � 0.45 �2.4 � 0.15BRD12 AC003033/T21L14.19 Unknown 19889_at �2.6 � 0.22 �2.5 � 0.28 �0.1 � 1.35 �0.1 � 1.15
a Gene name for SAUR36 is from Hagen and Guilfoyle (2002).
Goda et al.
1320 Plant Physiol. Vol. 130, 2002 www.plantphysiol.orgon June 28, 2018 - Published by Downloaded from Copyright © 2002 American Society of Plant Biologists. All rights reserved.

Table II. Genes up-regulated by BRs
When genes have names on publications or on database, we adopted their names. Otherwise, we designated genes from BRU2 to BRU43.Ampified and No-Amp., Before and after signal amplification with antibody, respectively.
Gene Name Accession No. Function or CommentAffymetrix
No.
det2 WT
Amplified No-Amp. Amplified No-Amp.
FC � SE FC � SE FC � SE FC � SE
IAA3/SHY2 U18406 Auxin-inducible nuclearprotein/suppressor of phyB
13301_at 2.4 � 0.42 2.7 � 0.29 1.3 � 0.10 1.3 � 0.10
IAA5 U18407 Auxin-inducible nuclear protein 13660_i_at 16.8 � 4.64 7.8 � 1.02 3.3 � 0.35 1.8 � 0.00SAUR-AC1/�15
S70188 Small auxin up RNA fromArabidopsis Columbia
12608_i_at 9.9 � 0.55 9.6 � 1.22 3.3 � 0.00 3.7 � 0.25
IAA19 U49075 Member of IAA gene family/IAA1binding protein
13296_at 3.1 � 0.25 2.9 � 0.15 1.8 � 0.00 2.1 � 0.20
BAS1/CYP72B1 AC003105/F18A8.8 Activation-tagged suppressor of phyB 12543_at 3.8 � 0.27 4.2 � 1.16 2.7 � 0.05 3.1 � 0.00TCH2 AF026473 Touch-induced gene 2/calmodulin-
related protein18300_at 2.5 � 0.19 2.7 � 0.24 1.9 � 0.15 1.8 � 0.05
TCH4 AF051338 Touch-induced gene 4/xyloglucanendotransglycosylase
16620_s_at 8.8 � 0.81 16.8 � 4.62 6.5 � 0.35 8.2 � 0.75
XTR6 U43488 Xyloglucan endotransglycosylase-related protein 6
17533_s_at 9.0 � 1.10 5.7 � 0.96 5.5 � 0.45 1.4 � 2.50
MSS3 AC004450/F14B2.23 Suppressor of snf4/calmodulin-likeprotein (EF-hand)
20689_at 3.2 � 0.35 3.8 � 0.58 1.6 � 0.15 1.8 � 0.25
ZAT7 X98676 Zinc finger protein 15778_at 4.2 � 0.47 2.0 � 0.15 1.4 � 0.15 0.1 � 1.20ATPA2 X99952 Root-specific peroxidase 12356_at 4.0 � 2.09 3.0 � 0.43 1.4 � 0.20 1.7 � 0.40KCS1 AF053345 Fatty acid elongase 3-ketoacyl-CoA
synthase 117961_at 2.7 � 0.28 3.0 � 0.29 1.3 � 0.05 1.3 � 0.10
OPR1 U92460 12-Oxophytodienoate reductase(jasmonate biosynthesis)
18253_s_at 2.0 � 0.03 2.1 � 0.03 1.4 � 0.10 1.4 � 0.10
AtPMEpcrB AF033206 Pectin methylesterase homolog 19267_s_at 4.1 � 0.32 4.4 � 0.46 3.3 � 0.15 3.5 � 0.10ATP24a Y11788 Peroxidase 18946_at 2.3 � 0.15 2.4 � 0.30 0.0 � 1.05 1.1 � 0.05CYP94C1 AC005824/F15K20.21 P450 monooxygenase 19288_at 10.1 � 3.32 4.0 � 0.97 2.0 � 0.20 1.7 � 0.25CYP86A2 AF013293/A_IG005I10.21 P450 monooxygenase 17966_at 2.0 � 0.09 2.2 � 0.15 1.3 � 0.00 1.3 � 0.00BRU2/SAUR-25
AL035528/F18A5.180 Auxin-inducible SAUR gene family 13395_at 5.3 � 0.63 2.6 � 0.38 1.6 � 0.05 1.6 � 0.50
BRU3/SAUR-9 AL022373/T19K4.240 Auxin-inducible SAUR gene family 12947_at 9.0 � 0.21 9.2 � 0.65 4.9 � 0.35 4.9 � 0.20BRU4/SAUR16 AL035656/T9A14.140 Auxin-inducible SAUR gene family 13322_at 5.8 � 0.68 6.5 � 1.00 2.2 � 0.05 2.5 � 0.30BRU5/SAUR-10
AC006201/T27K22.12 Auxin-inducible SAUR gene family 13781_at 3.0 � 0.66 3.0 � 0.06 1.6 � 0.15 1.7 � 0.20
BRU6/GH3-2a AL035601/F6G17.40 Auxin-inducible GH3 gene family 13565_at 2.3 � 0.17 2.2 � 0.15 1.3 � 0.05 1.8 � 0.35BRU7/GH3-10
AC005275/F4C21.36 Auxin-inducible GH3 gene family 13812_at 2.2 � 0.21 2.3 � 0.15 1.7 � 0.20 1.8 � 0.40
BRU8 AC004512/T8F5.9 Putative xyloglucanendotransglycosylase (TCH4homolog)
17960_at 7.7 � 0.48 8.0 � 0.43 2.1 � 0.35 2.0 � 0.30
BRU9 AC007067/T10O24.17 Putative endoxyloglucan transferase(EXGT-A3 homolog)
19490_at 22.0 � 9.17 10.9 � 2.54 5.2 � 0.10 3.7 � 0.00
AtExp8 AC002336/T2P4.4 Putative expansin (expansin2-homolog)
19660_at 3.3 � 0.57 3.7 � 0.57 1.3 � 0.05 1.3 � 0.05
BRU11 AL035539/F22I13.170 Putative expansin (pollen allergenprotein homolog)
19976_at 6.2 � 0.42 7.2 � 0.92 2.0 � 0.00 2.1 � 0.10
BRU12 AC005169/F6F22.19 Putative extensin with Leu-rich repeat(LRX1 homolog)
18525_at 3.3 � 0.09 2.4 � 0.45 1.3 � 0.20 �0.1 � 1.10
BRU13 AC005698/T3P18.1 Putative extensin with Leu-rich repeat(LRX1 homolog)
18998_at 2.2 � 0.15 2.3 � 0.29 2.0 � 0.40 2.0 � 0.50
BRU14 AL049608/T9E8.80 Putative extensin with Leu-rich repeat(LRX1 homolog)
20537_at 2.8 � 0.15 3.1 � 0.15 1.6 � 0.00 1.8 � 0.00
BRU15 AC003027/F21M11.20 Putative arabinogalactan protein(fasciclin-domain)
16438_at 0.6 � 0.80 2.2 � 0.10 1.6 � 0.10 1.7 � 0.10
BRU16 AL035601/F6GT17.100 Putative arabinogalactan protein 14947_at 1.5 � 0.28 2.5 � 0.18 1.8 � 0.00 1.8 � 0.00BRU17 AF060874 Putative arabinogalactan protein
(AtAGP4 homolog)15107_s_at 1.7 � 0.37 2.4 � 0.24 1.5 � 0.00 1.5 � 0.00
BRU18 AF069298/T14P8.14 Putative pectinesterase 14612_at 4.0 � 0.18 4.2 � 0.26 3.3 � 0.40 3.6 � 0.55
(Table continues on following page.)
GeneChip Analysis of Brassinosteroid
Plant Physiol. Vol. 130, 2002 1321 www.plantphysiol.orgon June 28, 2018 - Published by Downloaded from Copyright © 2002 American Society of Plant Biologists. All rights reserved.

genes (12%) were up- or down-regulated by BL, asdefined by a more than 2-fold difference in the FCvalues (before or after signal amplification). We usedabsolute call and difference call values calculated bythe Microarray Suite software to exclude false-positivesignals that resulted from cross-hybridization or noise.Taking into account these two parameters, 655 of 1,009genes (65%) were excluded from the list for this ex-periment. Genes that were reproducibly regulated byBL in three independent experiments were compiledinto a final list of 59 up-regulated genes and 36 genesdown-regulated genes (Tables I and II). On the otherhand, we also processed raw signal data (AvDf) fromtriplicate GeneChip analysis using Welch’s approxi-mate t test. This analysis identified 155 BL-regulatedgenes (as defined by more than 2-fold difference in themean AvDf values) at a significance level of P � 0.05.Given that 84 of these 155 genes were included in thelist of 95 BL-regulated genes that were identified inour initial analysis, we consider that our threshold isreliable and more stringent than the conventional ap-proach based on Welch’s approximate t test.
We also exposed a WT plant to either 10 nm BL ora mock treatment for 3 h and then compared theabundance of transcripts between the two treatmentgroups using the Affymetrix GeneChips. Fifty-onegenes were identified as the BR-regulated genes inthe WT. Fifteen of these identified as novel BR-regulated loci, because they did not appear in theBR-regulated genes in Table I or II. Interestingly, allof these genes were down-regulated by BL, and thesegenes generally showed milder responses to BL inthe det2 mutant background than in the WT back-ground (Table III). The signal log ratio values, whichrepresent ratios of hybridization signals (AvDf val-ues) between mock- and BL-treated plants on a logscale (base 2), were calculated using Microarray Suitesoftware. A signal log ratio of 1, for example, indi-cates a 2-fold increase in the transcript level and �1indicates a 2-fold decrease. The signal log ratio val-ues from the WT experiments were plotted againstthose from the det2 mutant experiments for all of thegenes listed in Tables I to III (Fig. 1A). In general,most of the genes responded to BL similarly in the
Table II. (Continued from previous page.)
Gene Name Accession No. Function or CommentAffymetrix
No.
det2 WT
Amplified No-Amp. Amplified No-Amp.
FC � SE FC � SE FC � SE FC � SE
BRU19 AL022580/T5K18.200 Putative pectinacetylesterase 19905_at 3.0 � 0.28 3.6 � 0.73 2.5 � 0.45 3.3 � 0.95BRU20 AC004077/T31E10.15 Endo-1,4-�-xylanase homolog 15271_at 2.7 � 0.17 2.9 � 0.12 1.5 � 0.05 1.6 � 0.10BRU21 AL030978/M4122.170 Ca2�-binding protein homolog 15431_at 3.1 � 0.25 3.6 � 0.49 2.3 � 0.10 2.2 � 0.00BRU22 AL022198/F6I18.90 Putative calmodulin-binding protein 19857_at 2.7 � 0.20 2.7 � 0.17 1.7 � 0.10 2.0 � 0.20BRU23 AC005970/T6P5.14 Putative protein kinase 14030_at 2.2 � 0.10 2.4 � 0.33 1.5 � 0.15 1.7 � 0.15BRU24 AC002339/T11A7.8 Putative receptor kinase (CLV1
homolog)14112_at 3.4 � 0.90 2.4 � 0.32 1.7 � 0.25 1.8 � 0.10
BRU25 AC004238/F19I3.16 Leu-rich repeat domain 12251_at 4.5 � 0.67 4.7 � 0.72 3.5 � 0.85 2.6 � 0.25BRU26 AC002354/F6P23.7 NAM/NAC gene homolog 13806_at 2.9 � 0.44 3.0 � 0.70 1.8 � 0.30 1.6 � 0.05BRU27 AC006533/F20M17.23 Ethylene-Regulated protein ER33
homolog15403_s_at 3.7 � 0.25 3.8 � 0.29 1.9 � 0.15 2.1 � 0.20
BRU28 AF128396/T3H13.3 Phosphate-induced gene phl-1homolog
14077_at 3.2 � 0.35 5.8 � 0.29 3.6 � 0.30 3.5 � 0.30
BRU29 AL021711/F13C5.140 Pro-rich protein (APG) homolog(GDSL-motif)
16434_at 2.8 � 0.15 3.0 � 0.03 2.4 � 0.40 2.4 � 0.35
BRU30 AL035353/F16A16.110 Pro-rich protein (APG) homolog(GDSL-motif)
17196_at 3.9 � 0.38 4.7 � 0.48 1.9 � 0.20 2.3 � 0.25
BRU31 AC005917/F3P11.22 Pollen-specific protein (SF21)homolog
15892_at 2.4 � 0.18 2.7 � 0.32 1.8 � 0.15 1.8 � 0.25
BRU32 AC005679/F9K20.9 Carrot (Daucus carota) EP1 homolog 17440_i_at 2.7 � 0.32 3.2 � 0.55 1.6 � 0.20 1.6 � 0.25BRU33 AC007060/T5I8.14 Phosphatidylinositol/phosphatidyl-
choline transfer protein homolog12046_at 3.6 � 0.34 3.8 � 0.25 1.9 � 0.10 1.9 � 0.15
BRU34 AP007269/A_IG002N01.14 Unknown 12953_at 3.1 � 0.35 3.3 � 0.49 1.6 � 0.05 1.8 � 0.05BRU35 AC005169/F6F22.17 Unknown 13916_at 2.2 � 0.12 3.6 � 0.20 3.6 � 0.20 3.8 � 0.45BRU36 AC005106/T25N20.6 Unknown 14913_at 3.7 � 0.34 3.4 � 0.47 0.1 � 1.05 0.0 � 1.10BRU37 AL049481/T5L19.20 Unknown 14951_at 2.6 � 0.26 2.8 � 0.32 2.0 � 0.10 2.2 � 0.20BRU38 AC002535/T30B22.26 Unknown 19880_at 2.6 � 0.15 2.9 � 0.25 1.6 � 0.20 1.6 � 0.10BRU39 AC007138/T7B11.21 Unknown 19992_at 3.0 � 0.21 3.4 � 0.32 1.6 � 0.10 1.6 � 0.05BRU40 AL022224/F1C12.90 Unknown 12027_at 2.8 � 0.32 2.5 � 0.54 1.2 � 0.05 0.0 � 1.05BRU41 AC000348/T7N9.22 Unknown 14443_at 2.1 � 0.17 2.1 � 0.12 1.8 � 0.20 2.0 � 0.25BRU42 AC006921/F2H17.17 Unknown 18885_at 2.0 � 0.12 2.1 � 0.12 2.0 � 0.00 2.2 � 0.10BRU43 AC004521/F411.31 Unknown 12584_at 2.1 � 0.15 2.8 � 0.57 1.4 � 0.10 1.5 � 0.45
a Gene names for SAUR and GH3 genes are from Hagen and Guilfoyle (2002).
Goda et al.
1322 Plant Physiol. Vol. 130, 2002 www.plantphysiol.orgon June 28, 2018 - Published by Downloaded from Copyright © 2002 American Society of Plant Biologists. All rights reserved.
WT and det2 mutant, although some genes re-sponded poorly in the WT. The correlation coefficientfor the WT and det2 experiments was 0.908, whichindicates a strong positive correlation between theWT and det2 experiments. The inclination of the re-gression line in Figure 1A is 0.59. We therefore con-clude that BR-regulated genes generally respond toBL in a similar fashion in the WT and det2 but that thedet2 response to BL is more sensitive than that of theWT. We speculate that the det2 mutant has a strongerresponse to exogenous BL than WT, because the det2mutant accumulates lower levels of endogenous BRs(Fujioka et al., 1997).
Analysis of BR Response in the bri1 Mutant
It has been shown that BRI1 is a critical componentof the BR receptor (Wang et al., 2001). We haveexamined the effect of BR on a bri1-5 mutant, a weakmutant allele of BR-insensitive 1 (Noguchi et al.,1999). The bri1-5 seedlings were exposed to either 10nm BL or a mock treatment for 3 h, and transcriptabundance was analyzed using the Affymetrix Gene-Chip. Only three genes were identified to respondto BR in bri1-5 mutant, namely DWF4/CYP90B1,AtKUP1, and MS2-like genes. These genes are amongthe genes with the strongest response in the det2 andWT plants (Table I). All three genes showed weakerresponses in the bri1 than in det2 background (datanot shown). The signal log ratio values of the bri1experiments were plotted against those of the det2experiments for all the genes listed in Tables I to III
(Fig. 1B). In the bri1 mutant, most of the genes re-sponded to BL in a similar fashion to those in the det2mutant. The correlation coefficient for the bri1 anddet2 experiments is 0.697, indicating a positive corre-lation between the bri1 and det2 experiments. Theinclination of the regression line in Figure 1B is 0.19.These results indicate that BR-regulated genes gen-erally respond to BL similarly in the bri1 and det2, butthe responses in bri1 are weaker than those in det2 forall BR-regulated genes. This observation providesgood evidence that the BL responses of the geneslisted in Tables I to III are dependent on the BRI1 gene.However, this dose not necessarily mean that thelisted genes are all regulated via a BRI1-dependent-signaling pathway. It may be the case that the bri1mutant is less sensitive to exogenously applied BRs,because the bri1 mutant accumulates enormousamounts of endogenous BRs, i.e. BL, castasterone, andtyphasterol (Noguchi et al., 1999). Hu et al. (2000)suggested the existence of a BRI1-independent-signaling pathway. Moreover, there are several bri1homologs in the Arabidopsis genome. However, theexistence of a BRI1-independent-signaling pathwayhas yet to be verified.
Evaluation of Effects of Brassinazole (Brz), aBR-Specific Biosynthesis Inhibitor
Brz, a synthetic chemical developed in our labora-tory, is a triazole-type BR biosynthesis inhibitor thatinduces dwarfism (Asami and Yoshida, 1999). Weanalyzed BR-regulated genes to evaluate the effects
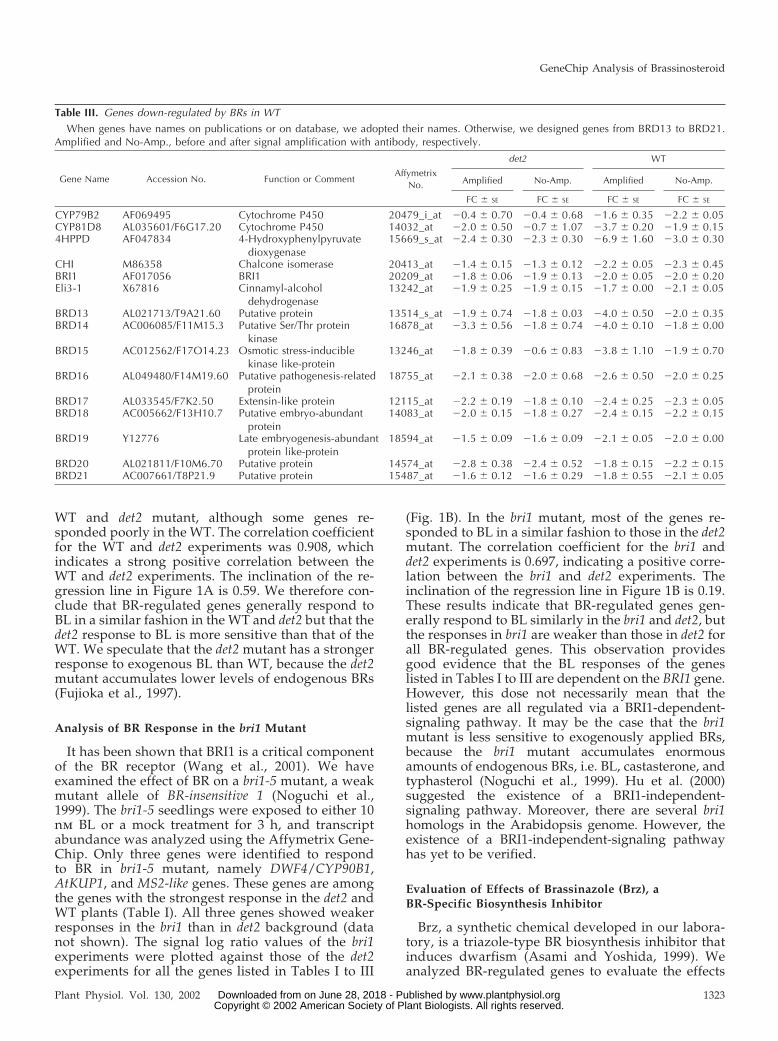
Table III. Genes down-regulated by BRs in WT
When genes have names on publications or on database, we adopted their names. Otherwise, we designed genes from BRD13 to BRD21.Amplified and No-Amp., before and after signal amplification with antibody, respectively.
Gene Name Accession No. Function or CommentAffymetrix
No.
det2 WT
Amplified No-Amp. Amplified No-Amp.
FC � SE FC � SE FC � SE FC � SE
CYP79B2 AF069495 Cytochrome P450 20479_i_at �0.4 � 0.70 �0.4 � 0.68 �1.6 � 0.35 �2.2 � 0.05CYP81D8 AL035601/F6G17.20 Cytochrome P450 14032_at �2.0 � 0.50 �0.7 � 1.07 �3.7 � 0.20 �1.9 � 0.154HPPD AF047834 4-Hydroxyphenylpyruvate
dioxygenase15669_s_at �2.4 � 0.30 �2.3 � 0.30 �6.9 � 1.60 �3.0 � 0.30
CHI M86358 Chalcone isomerase 20413_at �1.4 � 0.15 �1.3 � 0.12 �2.2 � 0.05 �2.3 � 0.45BRI1 AF017056 BRI1 20209_at �1.8 � 0.06 �1.9 � 0.13 �2.0 � 0.05 �2.0 � 0.20Eli3-1 X67816 Cinnamyl-alcohol
dehydrogenase13242_at �1.9 � 0.25 �1.9 � 0.15 �1.7 � 0.00 �2.1 � 0.05
BRD13 AL021713/T9A21.60 Putative protein 13514_s_at �1.9 � 0.74 �1.8 � 0.03 �4.0 � 0.50 �2.0 � 0.35BRD14 AC006085/F11M15.3 Putative Ser/Thr protein
kinase16878_at �3.3 � 0.56 �1.8 � 0.74 �4.0 � 0.10 �1.8 � 0.00
BRD15 AC012562/F17O14.23 Osmotic stress-induciblekinase like-protein
13246_at �1.8 � 0.39 �0.6 � 0.83 �3.8 � 1.10 �1.9 � 0.70
BRD16 AL049480/F14M19.60 Putative pathogenesis-relatedprotein
18755_at �2.1 � 0.38 �2.0 � 0.68 �2.6 � 0.50 �2.0 � 0.25
BRD17 AL033545/F7K2.50 Extensin-like protein 12115_at �2.2 � 0.19 �1.8 � 0.10 �2.4 � 0.25 �2.3 � 0.05BRD18 AC005662/F13H10.7 Putative embryo-abundant
protein14083_at �2.0 � 0.15 �1.8 � 0.27 �2.4 � 0.15 �2.2 � 0.15
BRD19 Y12776 Late embryogenesis-abundantprotein like-protein
18594_at �1.5 � 0.09 �1.6 � 0.09 �2.1 � 0.05 �2.0 � 0.00
BRD20 AL021811/F10M6.70 Putative protein 14574_at �2.8 � 0.38 �2.4 � 0.52 �1.8 � 0.15 �2.2 � 0.15BRD21 AC007661/T8P21.9 Putative protein 15487_at �1.6 � 0.12 �1.6 � 0.29 �1.8 � 0.55 �2.1 � 0.05
GeneChip Analysis of Brassinosteroid
Plant Physiol. Vol. 130, 2002 1323 www.plantphysiol.orgon June 28, 2018 - Published by Downloaded from Copyright © 2002 American Society of Plant Biologists. All rights reserved.

of newly developed Brz, Brz220 (Sekimata et al.,2002), which has the strongest and the most specificeffects on Arabidopsis among the Brz inhibitors (ourunpublished data). WT seedlings were exposed toeither 3 � 10�6 m Brz or a mock treatment for 3 h, andthe abundance of transcripts was compared usingGeneChip. The signal log ratio values from the Brzexperiments were plotted against the BL experimentsfor all genes (Fig. 2A) or for BR-regulated genes listedin Tables I and II (Fig. 2D). The correlation coefficientfor the Brz and BL experiments was �0.004 for allgenes (n � 8,000), indicating that there was no sig-nificant correlation between the BL and Brz treat-ments. On the other hand, a correlation coefficient of
�0.793 was calculated for the BR-regulated genes,suggesting a strong inverse correlation between theBL and Brz treatments. These observations indicatethat our list of BR-regulated genes presented here isuseful to evaluate new mutants as well as newgrowth-regulating compounds that are related to BRfunction. Our observations contrarily suggest that ashort (3 h) and moderate concentration (3 � 10�6 m)of Brz treatment decreased the levels of endogenousactive BRs within 3 h. This observation, together withour previous observation that Brz selectively inter-acts with a putative BR 22-hydroxylase (DWF4;Asami et al., 2001), also suggests rapid depletion ofthe BR-precursor pool, i.e. the BR precursors aremetabolized to BL and/or degraded to the inactiveform during the 3-h treatment of Brz.
Modulation of the PIF3 (Phytochrome-InteractingFactor 3) Gene
Given that they are fixed in space, plants haveevolved highly flexible programs to adapt to thechanging environment. Light is one of the most im-portant environmental signals regulating the pro-grams of growth and development. Although inter-actions between light and hormonal signals havebeen studied extensively (von Arnim and Deng, 1996;Fankhauser and Chory, 1997; Kraepiel and Miginiac,1997), the molecular mechanisms that underlie con-nectivity between the respective signaling pathwaysremain unclear. In addition, plant hormones have beenwidely regarded as signaling molecules that act down-stream of light signal. BR-deficient or -insensitive mu-tants and plants treated with Brz, which is an inhibitorof BR biosynthesis, exhibit abnormal skotomorpho-genesis or dark green leaves when grown in light(Fankhauser and Chory, 1997; Szekeres and Koncz,1998; Asami and Yoshida, 1999; Clouse and Feld-mann, 1999; Mussig and Altmann, 1999; Nagata et al.,2000). These observations have led to the proposal thatlight might alter either the concentration of BRs or theresponsivity of cells to these steroids (Fankhauser andChory, 1997; Kraepiel and Miginiac, 1997).
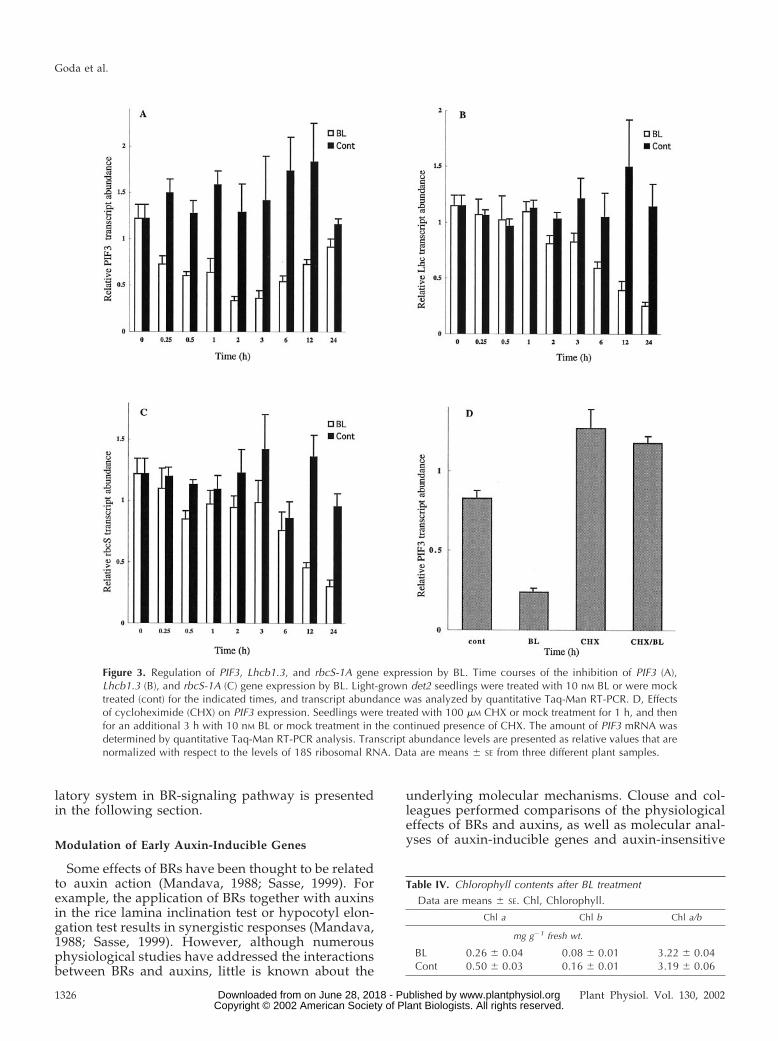
Our microarray analysis has now demonstratedthat BL down-regulates the gene for PIF3 (Table I), awell-characterized transcription factor that functionsat the upstream end of the light-signaling pathway(Ni et al., 1998). PIF3 is a basic helix-loop-helix pro-tein that is localized to the nucleus and both interactswith the biologically active-type photoreceptors, Pfrs(Ni et al., 1999; Fairchild et al., 2000; Zhu et al., 2000),and binds to light-regulated promoters through theG-box sequence motif (CACGTG; Friedrichsen et al.,2000; Martinez-Garcia et al., 2000). Quantitative re-verse transcription (RT)-PCR analysis revealed thatrepression of PIF3 expression was apparent within 15min after BL treatment, and the expression was re-duced by two-thirds within 2 to 3 h (Fig. 3A). Dose-response analysis revealed that inhibition of PIF3
Figure 1. Comparison of BL treatment on the WT, bri1, and det2seedlings with the use of GeneChip. A, The distribution of the signallog ratio values for WT (y axis) and det2 (x axis) are shown for theBR-regulated genes, listed in Tables I to III. B, The distribution ofsignal log ratio values for bri1 (y axis) and det2 (x axis) are shown forthe BR-regulated genes, listed in Tables I to III. The signal log ratiorepresents the ratio of hybridization signals between BL- and mock-treated samples using a log (base 2) scale. A signal log ratio of 1represents a gene that shows a 2-fold increase in expression by BLtreatment; a signal log ratio of �1 represents a gene that shows a2-fold reduction by BL treatment.
Goda et al.
1324 Plant Physiol. Vol. 130, 2002 www.plantphysiol.orgon June 28, 2018 - Published by Downloaded from Copyright © 2002 American Society of Plant Biologists. All rights reserved.

expression by BL was apparent at 0.1 nm BL and wasmaximal at 100 nm BL (data not shown), indicatingthat BL regulates the expression of this gene at phys-iological concentrations.
On the basis of these observations, we examinedthe effects of BL on the abundance of transcriptsderived from Lhcb1.3 (Jansson, 1999) and rbcS-1A(Krebbers et al., 1998), which encode light-harvestingchlorophyll a/b-binding protein (Lhc) and the smallsubunit of ribulose-1,5-bisphosphate carboxylase(rbcS), respectively. The promoter regions of bothLhcb1.3 and rbcS-1A contain G-box sequence motifs,which bind to PIF3 protein. The expression of each ofthese genes was repressed by BL treatment after a lagperiod of approximately 1 h; transcript levels werereduced by about two-thirds after 24 h (Fig. 3, B andC), at which time the chlorophyll content of BL-treated plants was about one-half that of mock-treated plants, without a significant change in thechlorophyll a/b ratio (Table IV). The relative tempo-ral patterns of the expression profiles of PIF3 andLhcb1.3 coincided with those of regulatory genes andtheir putative output genes in former microarraystudies (e.g. Seki et al., 2001; Tepperman et al., 2001).Because light-induced expression of Lhcb1.3 (CAB3)was reduced in plants expressing PIF3 antisenseRNA (Ni et al., 1998), our results suggest that theBL-induced repression of Lhcb1.3 expression is medi-ated, at least in part, by the effect of this BR on PIF3expression. Our data also suggest that BRs modulatethe light-regulated plant development by affectingPIF3 expression. In other words, BRs may act asregulators of the light-signaling pathway, in addition
to or rather than functioning as downstream media-tors of light signal transduction. On the other hand, ithas been controversial whether BR-induced photo-morphogenic responses, such as de-etiolation anddark green leaves, are secondary effects of the re-tarded cell elongation in BR-deficient plants (Bishopand Yokota, 2001). It is noteworthy that repression ofPIF3 gene is apparent in 15 min of BR treatment. Thespeed of this response is similar to that of BR-biosynthetic genes and quicker than that of genesimplicated in cell elongation or cell wall organization(discussed below).
To determine whether the down-regulation of PIF3by BL is dependent on de novo protein synthesis, weexamined the effect of CHX, an inhibitor of cytosolicprotein synthesis. The amount of PIF3 mRNA wasunexpectedly moderately increased by treatment ofplants with 100 �m CHX for 1 h (Fig. 3D). Further-more, in plants exposed to CHX, PIF3 expression didnot respond to subsequent treatment with BL. Theseresults suggest that CHX might prevent the de novosynthesis of a short-lived repressor of PIF3 expres-sion that acts at the transcriptional or posttranscrip-tional level. The results further suggest that BL mightfunction upstream of this putative repressor. Recentstudies have indicated the importance of short-livedrepressors, whose degradation is mediated by theubiquitin system (Estelle, 2001; Schwechheimer andDeng, 2001). Early auxin-inducible genes have beensuggested to be regulated by the ubiquitin-mediatedsystem (Gray and Estelle, 2000; Leyser, 2001; Ramoset al., 2001). The possible involvement of such regu-
Figure 2. Comparison of BL and Brz treatmentwith the use of GeneChip experiment. The dis-tribution of signal log ratio values for treatmentswith BL (y axis) and Brz (x axis) are shown. A, Allof the genes (�8,000) on the GeneChip areplotted. B, Genes that are induced or reducedmore than 2-fold in a single GeneChip experi-ment are plotted. C, Genes that are induced orreduced more than 2-fold in two of the threeGeneChip experiments are plotted. D, The BR-regulated genes (induced or reduced more than2-fold in three GeneChip experiments, listed inTables I and II) are plotted. The signal log ratiorepresents the ratios of hybridization signals us-ing a log (base 2) scale. A signal log ratio of 1represents a gene whose expression is increased2-fold by treatment with either BL or Brz, and asignal log ratio of �1 represents a gene whoseexpression is reduced 2-fold by treatment witheither BL or Brz.
GeneChip Analysis of Brassinosteroid
Plant Physiol. Vol. 130, 2002 1325 www.plantphysiol.orgon June 28, 2018 - Published by Downloaded from Copyright © 2002 American Society of Plant Biologists. All rights reserved.
latory system in BR-signaling pathway is presentedin the following section.
Modulation of Early Auxin-Inducible Genes
Some effects of BRs have been thought to be relatedto auxin action (Mandava, 1988; Sasse, 1999). Forexample, the application of BRs together with auxinsin the rice lamina inclination test or hypocotyl elon-gation test results in synergistic responses (Mandava,1988; Sasse, 1999). However, although numerousphysiological studies have addressed the interactionsbetween BRs and auxins, little is known about the
underlying molecular mechanisms. Clouse and col-leagues performed comparisons of the physiologicaleffects of BRs and auxins, as well as molecular anal-yses of auxin-inducible genes and auxin-insensitive
Table IV. Chlorophyll contents after BL treatment
Data are means � SE. Chl, Chlorophyll.
Chl a Chl b Chl a/b
mg g�1 fresh wt.
BL 0.26 � 0.04 0.08 � 0.01 3.22 � 0.04Cont 0.50 � 0.03 0.16 � 0.01 3.19 � 0.06
Figure 3. Regulation of PIF3, Lhcb1.3, and rbcS-1A gene expression by BL. Time courses of the inhibition of PIF3 (A),Lhcb1.3 (B), and rbcS-1A (C) gene expression by BL. Light-grown det2 seedlings were treated with 10 nM BL or were mocktreated (cont) for the indicated times, and transcript abundance was analyzed by quantitative Taq-Man RT-PCR. D, Effectsof cycloheximide (CHX) on PIF3 expression. Seedlings were treated with 100 �M CHX or mock treatment for 1 h, and thenfor an additional 3 h with 10 nM BL or mock treatment in the continued presence of CHX. The amount of PIF3 mRNA wasdetermined by quantitative Taq-Man RT-PCR analysis. Transcript abundance levels are presented as relative values that arenormalized with respect to the levels of 18S ribosomal RNA. Data are means � SE from three different plant samples.
Goda et al.
1326 Plant Physiol. Vol. 130, 2002 www.plantphysiol.orgon June 28, 2018 - Published by Downloaded from Copyright © 2002 American Society of Plant Biologists. All rights reserved.
mutants in soybean (Glycine max) and tomato. Theyconcluded that the promotion of cell elongation byBRs is not likely mediated by the auxin-signalingpathway (Clouse et al., 1992, 1993; Zurek et al., 1994).On the other hand, our comprehensive microarrayanalysis, which encompasses most of the knownauxin-inducible genes and various homologs of thesegenes, revealed a marked overlap in the BR- andauxin-signaling pathways in Arabidopsis.
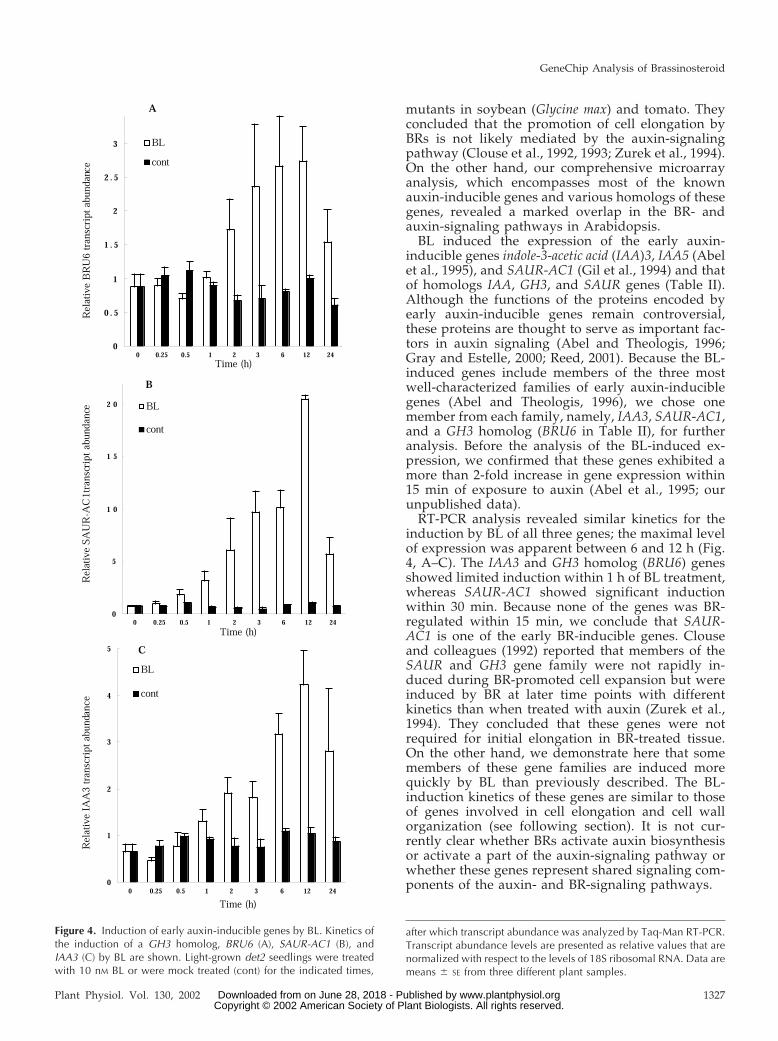
BL induced the expression of the early auxin-inducible genes indole-3-acetic acid (IAA)3, IAA5 (Abelet al., 1995), and SAUR-AC1 (Gil et al., 1994) and thatof homologs IAA, GH3, and SAUR genes (Table II).Although the functions of the proteins encoded byearly auxin-inducible genes remain controversial,these proteins are thought to serve as important fac-tors in auxin signaling (Abel and Theologis, 1996;Gray and Estelle, 2000; Reed, 2001). Because the BL-induced genes include members of the three mostwell-characterized families of early auxin-induciblegenes (Abel and Theologis, 1996), we chose onemember from each family, namely, IAA3, SAUR-AC1,and a GH3 homolog (BRU6 in Table II), for furtheranalysis. Before the analysis of the BL-induced ex-pression, we confirmed that these genes exhibited amore than 2-fold increase in gene expression within15 min of exposure to auxin (Abel et al., 1995; ourunpublished data).
RT-PCR analysis revealed similar kinetics for theinduction by BL of all three genes; the maximal levelof expression was apparent between 6 and 12 h (Fig.4, A–C). The IAA3 and GH3 homolog (BRU6) genesshowed limited induction within 1 h of BL treatment,whereas SAUR-AC1 showed significant inductionwithin 30 min. Because none of the genes was BR-regulated within 15 min, we conclude that SAUR-AC1 is one of the early BR-inducible genes. Clouseand colleagues (1992) reported that members of theSAUR and GH3 gene family were not rapidly in-duced during BR-promoted cell expansion but wereinduced by BR at later time points with differentkinetics than when treated with auxin (Zurek et al.,1994). They concluded that these genes were notrequired for initial elongation in BR-treated tissue.On the other hand, we demonstrate here that somemembers of these gene families are induced morequickly by BL than previously described. The BL-induction kinetics of these genes are similar to thoseof genes involved in cell elongation and cell wallorganization (see following section). It is not cur-rently clear whether BRs activate auxin biosynthesisor activate a part of the auxin-signaling pathway orwhether these genes represent shared signaling com-ponents of the auxin- and BR-signaling pathways.
Figure 4. Induction of early auxin-inducible genes by BL. Kinetics ofthe induction of a GH3 homolog, BRU6 (A), SAUR-AC1 (B), andIAA3 (C) by BL are shown. Light-grown det2 seedlings were treatedwith 10 nM BL or were mock treated (cont) for the indicated times,
after which transcript abundance was analyzed by Taq-Man RT-PCR.Transcript abundance levels are presented as relative values that arenormalized with respect to the levels of 18S ribosomal RNA. Data aremeans � SE from three different plant samples.
GeneChip Analysis of Brassinosteroid
Plant Physiol. Vol. 130, 2002 1327 www.plantphysiol.orgon June 28, 2018 - Published by Downloaded from Copyright © 2002 American Society of Plant Biologists. All rights reserved.

In contrast to the BL induction of some early auxin-inducible genes, none of the late auxin-induciblegenes is significantly induced by BL within the 3-htreatment period, even though a number of probesfor such genes are present on the Arabidopsis Ge-nome Array. It remains to be determined whetherlonger exposure to BRs results in the activation oflate auxin-inducible genes. On the other hand, nei-ther IAA1 nor IAA2, both of which are early auxin-inducible genes (Abel et al., 1995), was induced byexposure of Arabidopsis to BL for 3 h. The expressionof PAP1/IAA26 and a SAUR homolog (BRD5), bothof which are homologs of auxin-inducible genes, wasrepressed by BL treatment (Table I); the responses ofthese genes to auxin have not been known. Theseobservations indicate that members of the IAA, GH3,and SAUR gene families can be classified into at leastfour groups: (a) those that are induced specifically byauxin (such as IAA1 and IAA2); (b) those that areinduced both by auxin and by BRs (IAA3, IAA5); (c)those that are induced by BRs, but not by auxins(GH3 homolog [BRU7; auxin-insensitive data notshown]); and (d) those that are repressed by BRs(PAP1, SAUR homolog [BRD5]). Further analysis isneeded to enable classification of members of theauxin-inducible gene families, depending on theirdose- or time-dependent responses to auxin and BRs.Such classification should provide insight into func-tions of these genes, and it will further extend under-standing involvement of these genes in the regulationof growth and development, including photomorpho-genesis (Reed, 2001). Functional characterization ofthese genes should also provide insights into the func-tional divergence between auxins and BRs.
Control of Cell Elongation and Cell Wall Organization
Microarray analysis revealed that BL induces theexpression of various genes implicated in cell elon-gation or cell wall organization (Table II). As far aswe are aware, this list contains the largest number ofgenes in this class shown to be regulated by a singlesignaling molecule. Most of these genes have notpreviously been shown to be under the control of anyhormone. We chose three of the genes for furtheranalysis of their induction kinetics: TCH4, which en-codes xyloglucan endotransglycosylase (XET; Xu etal., 1995); a putative expansin gene (AtExp8) thatis highly homologous to ZmExp2 (Im et al., 2000);and KCS1, which encodes a fatty acid elongase3-ketoacyl-CoA synthase that functions in wax biosyn-thesis (Todd et al., 1999). RT-PCR analysis revealedthat the induction of these three genes was apparent
Figure 5. BL induction of genes that are implicated in cell elongationor cell wall organization. Kinetics of induction by BL of TCH4 (A), aputative expansin gene AtExp8 (B), and KCS1 (C) are shown. Light-grown det2 seedlings were treated with 10 nM BL or were mock
treated (cont) for the indicated times, after which transcript abun-dance was analyzed by Taq-Man RT-PCR. Transcript abundancelevels are presented as relative values that are normalized withrespect to the levels of 18S ribosomal RNA. Data are shown asmeans � SE from three different plant samples.
Goda et al.
1328 Plant Physiol. Vol. 130, 2002 www.plantphysiol.orgon June 28, 2018 - Published by Downloaded from Copyright © 2002 American Society of Plant Biologists. All rights reserved.

after a lag period of 30 min to 1 h, with maximalexpression observed between 6 and 12 h (Fig. 5, A–C).The kinetics of induction of these genes were thussimilar to those of BL-induced expression of the earlyauxin-inducible genes (Fig. 4) and to those of BR-induced cell elongation (Sasse, 1999), i.e. the lag pe-riod for the response to BRs is generally longer thanthat for responses to auxins. The lag period of BL-induced TCH4 expression was similar to that demon-strated previously (Xu et al., 1995).
On the other hand, the expression of XTR7, a mem-ber of the XET/XTH gene family, was down-regulated by BL (Table I), whereas the expression ofthis gene was previously shown to be independent ofBR and auxin regulation (Xu et al., 1996). We demon-strated that BL reduced the abundance of XTR7 tran-scripts in a dose-dependent manner between 10�10
and 10�5 m by RT-PCR, but 10�6 m auxin increased thelevels of XTR7 transcripts (data not shown). Our ob-servations thus suggest the existence of multiple BR-signaling pathways that regulate XET/XTH genefamily: One regulates the TCH4 gene in the mannerobserved for auxin induction, and the other regulatesthe XTR7 gene in a manner that is opposite to thatobserved with auxin. These observations pave theway for the exploration of the complex interactionsbetween auxin- and BR-signaling pathways.
P450s and BR Metabolic Enzymes
In contrast to animals and yeast, plants possess alarge family of P450 genes that contribute to thesynthesis of secondary metabolites. The Arabidopsisgenome thus contains nearly 300 P450 genes (Arabi-dopsis Genome Initiative, 2000). Recent studies intothe specific functions of the proteins encoded bythese genes have revealed that they are involved inthe biosynthesis of a number of signaling moleculesin plants. CYP85A (Bishop et al., 1999; Shimada et al.,2001), CYP90A (Szekeres et al., 1996), and CYP90B(Choe et al., 1998) participate in BR biosynthesis,CYP701A3 (Helliwell et al., 1998) and CYP88A3(Helliwell et al., 2001) in gibberellin (GA) biosynthe-sis, and CYP79B2 (Hull et al., 2000) and CYP83B1(Barlier et al., 2000; Bak et al., 2001) in auxin metab-olism. It is important to know how BRs regulate P450genes because it will help elucidate signaling net-work cross-talk between BRs and other signalingmolecules. Furthermore, the oxygenation steps in theBR biosynthetic pathway, which are probably cata-lyzed by P450 enzymes, have yet to be characterized.Using the DNA array analysis, we examined theeffects of BL on the expression of P450 genes, includ-ing those that contribute to BR metabolic pathways.Many P450 genes were regulated by BL (Fig. 6A).Such information will be useful in the future charac-terization of their specific functions. BL represses theexpression of CYP79B2 and CYP81D8 (Table III). TheCYP79B2 has shown to convert Trp to indole-3-
acetaldoxime, the first step of Trp-independent IAAbiosynthesis. We have recently identified that theCYP81D8 is the only auxin-inducible P450 gene by thecomprehensive screening of early auxin-induciblegenes using DNA microarray (S. Sawa and our un-published data). These P450 genes may account for thephysiological interactions between auxin and BRs.
Among P450 genes, a cluster consisting of theCYP85 and CYP90 families attracted our interest.Three members of these families have been shown tocontribute to BR biosynthesis, and we found that theexpression of the clustered genes was all repressedby BL treatment (Fig. 6, B–F). The gene cluster in-cluded ROT3/CYP90C, which functions in polar cellelongation in leaf cells (Kim et al., 1998), andCYP90D, a novel P450 gene (the full-length sequenceof which has determined and has been submitted toGenBank; accession no. AB066286). These data sug-gest that all of the genes in the cluster encode BR-related enzymes. The observation that BL repressesthe expression of several BR biosynthetic genes indi-cates that the BR biosynthetic pathway is subject tofeedback regulation at multiple points to ensure ho-meostasis of endogenous BRs. The rate of repressionof CPD gene in Figure 4B was slower than that de-scribed in a previous report (Mathur et al., 1998),probably because of the low concentration of BL usedin our experiments. On the other hand, our microar-ray experiments revealed that the expression of genesfor enzymes that function upstream in the pathwayof BR biosynthesis, including DWF7/STE1 (Choe etal., 1999), DIM/DWF1 (Klahre et al., 1998), and DET2(Li et al., 1996), was not significantly affected by BLtreatment (data not shown). The results indicate thatthe genes encoding upper step enzymes are less likelyto be regulated by BL in a feedback regulatory man-ner. Furthermore, we observed that BAS1/CYP72B1,which encodes a repressor of a phyB mutant, wasinduced by BL treatment (Fig. 6G). AlthoughCYP72B1 has been shown to catalyze C26 hydroxy-lation of BL (Neff et al., 1999), its physiological func-tion is not fully understood. Our results imply thatthe expression of this gene was induced to promotethe catabolism of the exogenously applied BL.
CONCLUSIONS
Very recently, three independent groups reportedmicroarray analysis of BR-regulated genes (Hu et al.,2001; Mussig et al., 2002; Yin et al., 2002). The pre-sented list of BR-regulated genes have significantdifferences with each other. Such differences may beattributable to different experimental conditions, butfurther studies may be required to account for thediscrepancy. We present here the largest list of theBR-regulated genes, which may provide comprehen-sive view of the physiological functions of BRs usingBR-regulated genes as molecular markers. P450genes and transcription factor genes predominated
GeneChip Analysis of Brassinosteroid
Plant Physiol. Vol. 130, 2002 1329 www.plantphysiol.orgon June 28, 2018 - Published by Downloaded from Copyright © 2002 American Society of Plant Biologists. All rights reserved.

Figure 6. (Legend appears on facing page.)
Goda et al.
1330 Plant Physiol. Vol. 130, 2002 www.plantphysiol.orgon June 28, 2018 - Published by Downloaded from Copyright © 2002 American Society of Plant Biologists. All rights reserved.

among down-regulated genes (Fig. 7A). Auxin-related genes and genes that are implicated in cellelongation or cell wall organization predominatedamong up-regulated genes (Fig. 7B). We focusedsome of these genes for further characterization (Figs.3–6). We did not discuss all of the genes shown to beregulated by BL in our microarray analysis (Tables Iand II). These additional genes also provide insightinto the actions of BRs and their underlying mecha-nisms. For example, the microarray results suggestpossible mechanisms through which BRs interactwith auxin. The expression of PIN7, a homolog of thePIN1 and PIN2 genes for putative auxin-efflux carrierproteins (Galweiler et al., 1998; Muller et al., 1998),was repressed by BL treatment, suggesting that BLmight control auxin efflux. The expression of iaglu,which encodes a putative indole-3-acetate �-d-glucosyltransferase, was also repressed by BL, sug-gesting that BL might regulate auxin metabolism. BRsignaling also appears to exhibit cross-talk with thatof other plant hormones, including jasmonic acid(OPR1 in Table II; Biesgen and Weiler, 1999) and anunidentified ligand of a putative receptor kinase(BRU23 in Table II). Some of the remaining genesencoded proteins with Leu-rich repeats that lackedkinase domains, either with or without an extensin-like domain (Tables I and II). Genes that potentiallyrelated to signaling molecules, such as calmodulin-related proteins and their putative binding proteins,were regulated by BL (Tables I and II). Finally, BLcontrolled the expression of genes potentially regu-lating cell elongation, such as a K� channel, a K�
transporter, and other transporters (Table I). BRs ex-ert a wide variety of effects on both growth anddevelopment in plants. It is likely that many BR-regulated genes, presented here, contribute to thesepleiotropic effects. Further analysis of the functionsof these genes will provide insights into BR activitiesand will facilitate the understanding functions of thesteroidal hormone in plants.
MATERIALS AND METHODS
Plant Materials and Growth Conditions
Arabidopsis ecotype Columbia was used as WT in this study. The Ara-bidopsis mutant det2-1 (Chory et al., 1991) was used as BR-deficient mutant.Seedlings were grown for 7 d at 22°C under continuous light in one-half-strength Murashige and Skoog (1962) liquid medium (Invitrogen, Carlsbad,CA) supplemented with 1.5% (w/v) Suc. The seedlings were then treatedwith 10 nm BL or mock-treated with dimethyl sulfoxide (final concentration,0.1%, v/v), after which they were immediately frozen in liquid nitrogen andstored at �80°C until RNA isolation.
DNA Microarray Analysis
Total RNA was isolated from seedlings by the acid-guanidinium-phenol-chloroform method (Sambrook et al., 1989). Polyadenylated RNA was pu-rified with the Oligotex-dT30 kit (Roche Diagnostics, Indianapolis) andconverted into double-stranded cDNA with the use of a Super Script ChoicecDNA Synthesis kit (Invitrogen) and with an oligo(dT)24 primer containinga T7 polymerase promoter site at its 3� end (Amersham Biosciences AB,Uppsala). Biotin-labeled cRNA was generated from the double-strandedcDNA using the BioArray High Yield RNA transcript labeling kit (EnzoDiagnostics, New York) and was then purified with the use of the RNeasyRNA purification kit (Qiagen USA, Valencia, CA). Each cRNA sample (20�g) was fragmented by incubation for 35 min at 94°C in fragmentationbuffer (40 mm Tris-acetate [pH 8.1], 100 mm potassium acetate, and 30 mmmagnesium acetate). The hybridization mixture comprised 15 �g of frag-mented cRNA in 300 �L of a solution containing 100 mm MES, 1 m [Na�],20 mm EDTA, 0.01% (v/v) Tween 20, 0.1 mg mL�1 herring sperm DNA, 0.5mg mL�1 acetylated bovine serum albumin, and control cRNA (EukaryoticHybridization Control Kit, Affymetrix). Portions (200 �L) of each mixturewere subjected to hybridization with the Arabidopsis Genome Array (Af-fymetrix) for 16 h at 45°C with rotation at 60 rpm. Each array was thenwashed consecutively with non-stringent wash buffer (6� SSPE [Sambrooket al., 1989], 0.01% [v/v] Tween 20, and 0.005% [v/v] Antifoam) andstringent wash buffer (100 mm MES, 0.1 m [Na�], and 0.01% [w/v] Tween20). Hybridization complexes were then detected by consecutive exposureto phycoerythrin-streptavidin (Molecular Probes, Eugene, OR), biotinylatedantibodies to streptavidin (Vector Laboratories, Burlingame, CA), andphycoerythrin-streptavidin, after which each array was washed again withnon-stringent wash buffer. All washing and staining procedures were per-formed with a Fluidics Station 400 (Affymetrix). The array was scanned bya confocal microscope scanner (HP Genome Array Scanner, Affymetrix) at awavelength of 570 nm.
DNA microarray technology is developing continually, but technicalproblems, such as a narrow signal dynamic range and aberrant detection ofcross-hybridization or noise, remain to be resolved. We used the followingmethods to solve these problems. We chose GeneChip system (Affymetrix)as a DNA microarray system. The protocols for data analysis of the Gene-Chip system and the issues of sensitivity and quantitation have been de-scribed previously (Lockhart et al., 1996). In brief, each gene is represented
Figure 6. Regulation of P450 genes by BL. A, Phylogenetic relationships among BR-regulated and other P450 genes. Proteinswhose genes were shown to be up- or down-regulated by BL are indicated in bold and underlined, respectively (Tables I andII). BR6ox (Arabidopsis, CYP85A, AB035868), CPD (Arabidopsis, CYP90A, X87367), ROT3 (Arabidopsis, CYP90C,AB008097), DWF4 (Arabidopsis, CYP90B, AF044216), and CYP90D (Arabidopsis, AB066286) belong to the CYP85 orCYP90 families. CYP72B1 (Arabidopsis, BAS1, AC003105) is a suppressor of the phyB mutant. CYP88A3 (Arabidopsis,AtKAO1, AF318500) and CYP701A3 (Arabidopsis, GA3, AF047720) participate in GA biosynthesis. CYP83B1 (Arabidopsis,D78598) and CYP79B2 (Arabidopsis, AF069495) participate in auxin metabolism. The genes for CYP73A1 (Helianthus sp.,cinnamate 4-hydroxylase, Z17369) and CYP75A1 (Petunia sp., flavonoid-3�, 5�-hydroxylase, D14588) were the first P450genes to be identified functionally in higher plants and belong to the higher plant-specific group A of P450 genes. Theaccession numbers of the other P450 family members are D30718 (CYP8) and M93133 (CYP7A1). Kinetics of regulation ofthe CPD (B), DWF4 (C), BR6ox (D), ROT3 (E), CYP90D (F), CYP72, CYP85, CYP90, and BAS1 (G) genes by BL are shown.Light-grown det2 seedlings were treated with 10 nM BL or were mock treated (cont) for the indicated times, after whichtranscript abundance was analyzed by Taq-Man RT-PCR. Transcript abundance levels are presented as relative values thatare normalized with respect to the levels of 18S ribosomal RNA. Data are shown as means � SE from three different plantsamples.
GeneChip Analysis of Brassinosteroid
Plant Physiol. Vol. 130, 2002 1331 www.plantphysiol.orgon June 28, 2018 - Published by Downloaded from Copyright © 2002 American Society of Plant Biologists. All rights reserved.

on the array as a set of 16 oligonucleotide probes that match the sequence ofthe gene exactly. The specificity of hybridization is verified by inclusion onthe array of the same set of probes each with a single-nucleotide mismatchin the center of its sequence. The difference between the hybridization signalobtained with the matching set of probes and that obtained with the mis-matched probes is proportional to the abundance of the correspondingtranscript and is calculated as the AvDf value. Analysis of absolute anddifferential gene expression was performed with the GeneChip software,Microarray Suite (v4.0, Affymetrix). AvDf values of highly abundant tran-scripts that are obtained with the standard GeneChip protocol are fre-quently affected by signal saturation when antibody amplification is used.To achieve a higher signal dynamic range, we scanned each chip before andafter signal amplification using an anti-streptavidin antibody. Each chip wasnormalized relative to the sum of the AvDf values, and then each gene wascompared between the control and BL-treated samples. Genes that were up-or down-regulated as reflected by a more than 2-fold difference in theirAvDf values and were assigned to an “increase” or “decrease” in thedifference call of the comparison analysis by Microarray Suite were identi-fied. Furthermore, genes with an “absent” value in the absolute call ofbaseline data and with a decrease value in the difference call were excludedfrom the list. Genes with an absent value in the absolute call of experimentaldata and with an increase value in the difference call were conversely alsoexcluded from the list. To ensure the reproducibility of results, we per-formed three independent experiments with different plant samples, andgenes that showed the same responses in all three experiments were clas-sified as genes regulated by BR (Tables I–III). The BR6ox and CYP90D geneswere identified with the use of Arabidopsis GEM1 microarrays (IncyteSystems, Palo Alto, CA) containing 7,942 cDNA clones.
Taq-Man RT-PCR Analysis
Total RNAs were isolated as described above and then treated withDNase I. They were then converted to cDNAs using a Super Script first-strand synthesis system (Invitrogen). Quantitative RT-PCR was performedwith the use of real-time Taq-Man technology (Holland et al., 1991) and asequence detector (model 7700, Applied Biosystems, Foster City, CA). Gene-specific primers and Taq-Man probes (Table V) were used to analyzetranscript abundance. The 18S ribosomal RNA was analyzed as an internalcontrol and was used to normalize the values for transcript abundance. Weperformed three independent experiments with different plant samples.Each experiment was normalized relative to the median of the experiment,and then means and ses of three experiments were calculated.
Sequence Analysis
DNA sequences were determined with an automated DNA sequencer(model 373A DNA Sequencing System, Applied Biosystems). Nucleotide
Figure 7. Frequencies of up-regulated and down-regulated genes. A,Distribution of BR-down-regulated genes that are listed in Table I. B,Distribution of BR-up-regulated genes that are listed in Table II. TheBR-regulated genes are classified into the functional categories basedon their established or putative functions.
Table V. Primers and TaqMan probes used for RT-PCR
Gene Name Forward Primer Sequence Reverse Primer Sequence TaqMan Probe Sequence
CPD CCCAAACCACTTCAAAGATGCT GGGCCTGTCGTTACCGAGTT TCTGCCATCTCCAAGGGTTGAAAGTGCDWF4 GTGATCTCAGCCGTACATTTGGA CACGTCGAAAAACTACCACTTCCT CAGCAAAACAACGGAGCGTCATCGROT3 ATTGGCGCGTTCCTCAGAT CAAGACGCCAAAGTGAGAACAA CTCACCTCAAAGACCGGATCACTCGAGABR6ox TGGCCAATCTTTGGCGAA TCCCGTATCGGAGTCTTTGGT ACCGAGTTTCTCAAACAAGGCCCCAACCYP90D CTCATTACCCTTGCCGTCAAA CAGCTTCATGTTTTCTTCCGTTAG CCTCTCTGATTCTCCTGCTGCCCTCAATBAS1 TTGGCTTCATACCGTTTGGC TTACAGCGAGTGTCAATTTGGC CGGAGTTCGTACATGCATTGGTCAGAATCLhcb1.3 GGAGCTCAAGAACGGAAGATTG GGTTCTCTATCGGTCCCTTACCA TGGATTCTTCGTTCAAGCCATCGTCArbcS1A GCTCTCTTCCGCTACTATGGTTG AAGGCAGCGGAGGACTTAAGT TCAGGCCACTATGGTCGCTCCTTTCATCH4 CAAGAACATGGAGTCTCTAGGCACT GTGAAAGGAGCTTTAGACCAATCG ACTCGAGTCTTTGGAACGCTGATGATTGGPIF3 TCAGGCTCACCAAAGCTAAGC CACACCAGCTCCACAACTTCA AATCTGCTCAAGACAGGAACCCTTCTCCACGH3 homolog (BRU6) CGTATATCCAACGGCGATTGT CCAGCAGATGTTCCTGAGCTT TCTTCTCACCCCATCACCGAGTTTCTCASAUR-AC1 GAGGATTCATGGCGGTCTATG GTTAAGCCGCCCATTGGAT TGGTGCCGGTTTCATACTTAAACCAGCCTIAA3 AGCCTAAACCTTTGGCTTCTGA GGTGATTGGATGCTCATTGGT CTTGCACGTACATATGAACATCTCCCATGGXTR7 TCGACGAGTTTGACCTCACTTG GTCCAGCGACAAAGACAGCATA ACCACAGAGGCAAAATCTTCAACGGAGGAtExp8 CAACCATCACCGTCACAGCTA TGAAGAGGAGGATTGCACCAA AAACTTTTGCCCACCTAACCCTGGCCTKCS1 GCTCAAATACGTGAAGCTTGGA CAGCACGGTTCCGGTTAAA CAACTCTTGCAACGTGACCACCATTCTCT18S ribosomal RNA CGGCTACCACATCCAAGGAA GCTGGAATTACCGCGGCT TGCTGGCACCAGACTTGCCCTC
Goda et al.
1332 Plant Physiol. Vol. 130, 2002 www.plantphysiol.orgon June 28, 2018 - Published by Downloaded from Copyright © 2002 American Society of Plant Biologists. All rights reserved.

sequences were compiled and analyzed with GENETYX-Mac software (Soft-ware Development Co. Ltd., Tokyo). The BLAST program (Altschul et al.,1990) was used to search for entries of homologous sequences in the DNAdata bank of Japan. The ClustalW program on the server at DNA data bankof Japan was used to align amino acid sequences and to derive phylogeneticrelations based on the neighbor-joining method (Saitou and Nei, 1987).
Determination of Chlorophyll Content
Acetone was added to the seedlings to bring the final concentration to80%. After homogenization, the solution was centrifuged at 10,000g for 5min, and chlorophyll was determined according to the method of Arnon(1949). Chlorophyll contents were normalized with respect to the freshweight of the seedlings.
ACKNOWLEDGMENTS
We thank Drs. Joanne Chory and Kenneth A. Feldmann for providingmutants, Dr. Kiyotaka Okada for careful reading of the manuscript, Naru-masa Miyauchi for technical assistance with quantitative RT-PCR and othermolecular biological analyses, and Katsuhiko Sekimata for assistance withBrz preparation.
Received July 13, 2002; returned for revision August 4, 2002; acceptedAugust 6, 2002.
LITERATURE CITED
Abel S, Nguyen MD, Theologis A (1995) The PS-IAA4/5-like family ofearly auxin-inducible mRNAs in Arabidopsis thaliana. J Mol Biol 251:533–549
Abel S, Theologis A (1996) Early genes and auxin action. Plant Physiol 111:9–17
Altschul SF, Gish W, Miller W, Myers EW, Lipman DJ (1990) Basic localalignment search tool. J Mol Biol 215: 403–410
Arabidopsis Genome Initiative (2000) Analysis of the genome sequence ofthe flowering plant Arabidopsis thaliana. Nature 408: 796–815
Arnon DI (1949) Copper enzymes in isolated chloroplasts: polyphenol-oxidase in Beta vulgaris. Plant Physiol 24: 1–15
Asami T, Mizutani M, Fujioka S, Goda H, Min YK, Shimada Y, Nakano T,Takatsuto S, Matsuyama T, Nagata N et al. (2001) Selective interaction oftriazole derivatives with DWF4, a cytochrome P450 monooxygenase ofthe brassinosteroid biosynthetic pathway, correlates with brassinosteroiddeficiency in planta. J Biol Chem 276: 25687–25691
Asami T, Yoshida S (1999) Brassinosteroid biosynthesis inhibitors. TrendsPlant Sci 4: 348–353
Bak S, Tax FE, Feldmann KA, Galbraith DW, Feyereisen R (2001)CYP83B1, a cytochrome P450 at the metabolic branch paint in auxin andindole glucosinolate biosynthesis in Arabidopsis. Plant Cell 13: 101–111
Barlier I, Kowalczyk M, Marchant A, Ljung K, Bhalerao R, Bennett M,Sandberg G, Bellini C (2000) The SUR2 gene of Arabidopsis thalianaencodes the cytochrome P450CYP83B1, a modulator of auxin homeosta-sis. Proc Natl Acad Sci USA 97: 14819–14824
Biesgen C, Weiler EW (1999) Structure and regulation of OPR1 and OPR2,two closely related genes encoding 12-oxophytodienoic acid-10,11-reductases from Arabidopsis thaliana. Planta 208: 155–165
Bishop GJ, Nomura T, Yokota T, Harrison K, Noguchi T, Fujioka S,Takatsuto S, Jones JD, Kamiya Y (1999) The tomato DWARF enzymecatalyses C-6 oxidation in brassinosteroid biosynthesis. Proc Natl AcadSci USA 96: 1761–1766
Bishop GJ, Yokota T (2001) Plants steroid hormones, brassinosteroids:current highlights of molecular aspects on their synthesis/metabolism,transport, perception and response. Plant Cell Physiol 42: 114–120
Choe S, Dilkes BP, Fujioka S, Takatsuto S, Sakurai A, Feldmann KA(1998) The DWF4 gene of Arabidopsis encodes a cytochrome P450 thatmediates multiple 22a-hydroxylation steps in brassinosteroid biosynthe-sis. Plant Cell 10: 231–243
Choe S, Noguchi T, Fujioka S, Takatsuto S, Tissier CP, Gregory BD, RossAS, Tanaka A, Yoshida S, Tax FE et al. (1999) The Arabidopsis dwf7/ste1 mutant is defective in the �7 sterol C-5 desaturation step leading tobrassinosteroid biosynthesis. Plant Cell 11: 207–221
Chory J, Nagpal P, Peto CA (1991) Phenotypic and genetic analysis of Det2,a new mutant that affects light-regulated seedling development in Ara-bidopsis. Plant Cell 3: 445–459
Clouse SD, Feldmann KA (1999) Molecular genetics of brassinosteroidaction. In A Sakurai, T Yokota, S Clouse, eds, Brassinosteroids: SteroidalPlant Hormones. Springer-Verlag, Tokyo, pp 163–190
Clouse SD, Hall AF, Langford M, McMorris TC, Baker ME (1993) Physi-ological and molecular effects of brassinosteroids on Arabidopsis thaliana.J Plant Growth Regul 12: 61–66
Clouse SD, Sasse JM (1998) Brassinosteroids: essential regulators of plantgrowth and development. Annu Rev Plant Physiol Plant Mol Biol 49:427–451
Clouse SD, Zurek DM, McMorris TC, Baker ME (1992) Effect of brassino-lide on gene expression in elongating soybean epicotyls. Plant Physiol100: 1377–1383
Estelle M (2001) Proteases and cellular regulation in plants. Curr Opin PlantBiol 4: 254–260
Fairchild CD, Schumaker MA, Quail PH (2000) HFR1 encodes an atypicalbHLH protein that acts in phytochrome A signal transduction. Genes Dev14: 2377–2391
Fankhauser C, Chory J (1997) Light control of plant development. AnnuRev Cell Dev Biol 13: 203–229
Friedrichsen DM, Joazeiro CAP, Li JM, Hunter T, Chory J (2000)Brassinosteroid-insensitive-1 is a ubiquitously expressed leucine-rich re-peat receptor serine/threonine kinase. Plant Physiol 123: 1247–1255
Fujioka S, Li JM, Choi YH, Seto H, Takatsuto S, Noguchi T, Watanabe T,Kuriyama H, Yokota T, Chory J et al. (1997) The Arabidopsis deeti-olated2 mutant is blocked early in brassinosteroid biosynthesis. PlantCell 9: 1951–1962
Galweiler L, Guan CH, Muller A, Wisman E, Mendgen K, Yephremov A,Palme K (1998) Regulation of polar auxin transport by AtPIN1 in Ara-bidopsis vascular tissue. Science 282: 2226–2230
Gil P, Liu Y, Orbovic V, Verkamp E, Poff KL, Green PJ (1994) Character-ization of the auxin-inducible Saur-Ac1 gene for use as a molecular-genetic tool in Arabidopsis. Plant Physiol 104: 777–784
Goetz M, Godt DE, Roitsch T (2000) Tissue-specific induction of the mRNAfor an extracellular invertase isoenzyme of tomato by brassinosteroidssuggests a role for steroid hormones in assimilate partitioning. Plant J 22:515–522
Gray WM, Estelle M (2000) Function of the ubiquitin-proteasome pathwayin auxin response. Trends Biochem Sci 25: 133–138
Hagen G, Guilfoyle T (2002) Auxin-responsive gene expression: genes,promoters and regulatory factors. Plant Mol Biol 49: 373–385
Helliwell CA, Chandler PM, Poole A, Dennis ES, Peacock WJ (2001) TheCYP88A cytochrome P450, ent-kaurenoic acid oxidase, catalyzes threesteps of the gibberellin biosynthesis pathway. Proc Natl Acad Sci USA 98:2065–2070
Helliwell CA, Sheldon CC, Olive MR, Walker AR, Zeevaart JAD, PeacockWJ, Dennis ES (1998) Cloning of the Arabidopsis ent-kaurene oxidasegene GA3. Proc Natl Acad Sci USA 95: 9019–9024
Holland PM, Abramson RD, Watson R, Gelfand DH (1991) Detection ofspecific polymerase chain-reaction product by utilizing the 5�33� exo-nuclease activity of thermus aquaticus DNA polymerase. Proc Natl AcadSci USA 88: 7276–7280
Hu YX, Bao F, Li JY (2000) Promotive effect of brassinosteroids on celldivision involves a distinct CycD3-induction pathway in Arabidopsis.Plant J 24: 693–701
Hu YX, Wang ZK, Wang YH, Bao F, Li N, Peng ZH, Li JY (2001) Identifi-cation of brassinosteroid responsive genes in Arabidopsis by cDNAarray. Sci China Ser C Life Sci 44: 637–643
Hull AK, Vij R, Celenza JL (2000) Arabidopsis cytochrome P450s thatcatalyze the first step of tryptophan-dependent indole-3-acetic acid bio-synthesis. Proc Natl Acad Sci USA 97: 2379–2384
Im KH, Cosgrove DT, Jones AM (2000) Subcellular localization of expansinmRNA in xylem cells. Plant Physiol 123: 463–470
Jansson S (1999) A guide to the Lhc genes and their relatives in Arabidopsis.Trends Plant Sci 4: 236–240
Jiang JR, Clouse SD (2001) Expression of a plant gene with sequencesimilarity to animal TGF-beta receptor interacting protein is regulated bybrassinosteroids and required for normal plant development. Plant J 26:35–45
Kim GT, Tsukaya H, Uchimiya H (1998) The ROTUNDIFOLIA3 gene ofArabidopsis thaliana encodes a new member of the cytochrome P-450
GeneChip Analysis of Brassinosteroid
Plant Physiol. Vol. 130, 2002 1333 www.plantphysiol.orgon June 28, 2018 - Published by Downloaded from Copyright © 2002 American Society of Plant Biologists. All rights reserved.
family that is required for the regulated polar elongation of leaf cells.Genes Dev 12: 2381–2391
Klahre U, Noguchi T, Fujioka S, Takatsuto S, Yokota T, Nomura T,Yoshida S, Chua NH (1998) The Arabidopsis DIMINUTO/DWARF1gene encodes a protein involved in steroid synthesis. Plant Cell 10:1677–1690
Kraepiel Y, Miginiac E (1997) Photomorphogenesis and phytohormones.Plant Cell Environ 20: 807–812
Krebbers E, Seurinck J, Herdies L, Cashmore AR, Timko MP (1998) Fourgenes in two diverged subfamilies encode the ribulose-1,5-bisphosphatecarboxylase small subunit polypeptides of Arabidopsis thaliana. Plant MolBiol 11: 745–759
Leyser O (2001) Auxin signalling: the beginning, the middle and the end.Curr Opin Plant Biol 4: 382–386
Li J, Nagpal P, Vitart V, McMorris TC, Chory J (1996) A role for brassi-nosteroids in light-dependent development of Arabidopsis. Science 272:398–401
Lockhart DJ, Dong HL, Byrne MC, Follettie MT, Gallo MV, Chee MS,Mittmann M, Wang CW, Kobayashi M, Horton H et al. (1996) Expres-sion monitoring by hybridization to high-density oligonucleotide arrays.Nat Biotechnol 14: 1675–1680
Lockhart DJ, Winzeler EA (2000) Genomics, gene expression and DNAarrays. Nature 405: 827–836
Mandava NB (1988) Plant growth-promoting brassinosteroids. Annu RevPlant Physiol Plant Mol Biol 39: 23–52
Martinez-Garcia JF, Huq E, Quail PH (2000) Direct targeting of light signalsto a promoter element-bound transcription factor. Science 288: 859–863
Mathur J, Molnar G, Fujioka S, Takatsuto S, Sakurai A, Yokota T, AdamG, Voigt B, Nagy F, Maas C et al. (1998) Transcription of the ArabidopsisCPD gene, encoding a steroidogenic cytochrome P450, is negativelycontrolled by brassinosteroids. Plant J 14: 593–602
Muller A, Guan CH, Galweiler L, Tanzler P, Huijser P, Marchant A, ParryG, Bennett M, Wisman E, Palme K (1998) AtPIN2 defines a locus ofArabidopsis for root gravitropism control. EMBO J 17: 6903–6911
Murashige T, Skoog F (1962) A revised medium for rapid growth andbioassay with tobacco tissue cultures. Physiol Plant 15: 473–498
Mussig C, Altmann T (1999) Physiology and molecular mode of action ofbrassinosteroids. Plant Physiol Biochem 37: 363–372
Mussig C, Biesgen C, Lisso J, Uwer U, Weiler EW, Altmann T (2000) Anovel stress-inducible 12-oxophytodienoate reductase from Arabidopsisthaliana provides a potential link between brassinosteroid-action andjasmonic-acid synthesis. J Plant Physiol 157: 143–152
Mussig C, Fischer S, Altmann T (2002) Brassinosteroid-regulated geneexpression. Plant Physiol 129: 1241–1251
Nagata N, Min YK, Nakano T, Asami T, Yoshida S (2000) Treatment ofdark-grown Arabidopsis thaliana with a brassinosteroid-biosynthesis in-hibitor, brassinazole, induces some characteristics of light-grown plants.Planta 211: 781–790
Neff MM, Nguyen SM, Malancharuvil EJ, Fujioka S, Noguchi T, Seto H,Tsubuki M, Honda T, Takatsuto S, Yoshida S et al. (1999) BAS1: a generegulating brassinosteroid levels and light responsiveness in Arabidop-sis. Proc Natl Acad Sci USA 96: 15316–15323
Ni M, Tepperman JM, Quail PH (1998) PIF3, a phytochrome-interactingfactor necessary for normal photoinduced signal transduction, is a novelbasic helix-loop-helix protein. Cell 95: 657–667
Ni M, Tepperman JM, Quail PH (1999) Binding of phytochrome B to itsnuclear signalling partner PIF3 is reversibly induced by light. Nature 400:781–784
Noguchi T, Fujioka S, Choe S, Takatsuto S, Yoshida S, Yuan H, FeldmannKA, Tax FE (1999) Brassinosteroid-insensitive dwarf mutants of Arabi-dopsis accumulate brassinosteroids. Plant Physiol 121: 743–752
Ramos JA, Zenser N, Leyser O, Callis J (2001) Rapid degradation ofauxin/indole acetic acid proteins requires conserved amino acids ofdomain II and is proteasome dependent. Plant Cell 13: 2349–2360
Reed JW (2001) Roles and activities of Aux/IAA proteins in Arabidopsis.Trends Plant Sci 6: 420–425
Saitou N, Nei M (1987) The neighbor-joining method: a new method forreconstructing phylogenetic trees. Mol Biol Evol 4: 406–425
Sambrook J, Fritsch EF, Maniatis T (1989) Molecular Cloning: A LaboratoryManual, Ed 2. Cold Spring Harbor Laboratory Press, Cold Spring Harbor,NY
Sasse J (1999) Physiological actions of brassinosteroids. In A Sakurai, TYokota, SD Clouse, eds, Brassinosteroids: Steroidal Plant Hormones.Springer-Verlag, Tokyo, pp 137–161
Schwechheimer C, Deng XW (2001) COP9 signalosome revisited: a novelmediator of protein degradation. Trends Cell Biol 11: 420–426
Seki M, Narusaka M, Abe H, Kasuga M, Yamaguchi-Shinozaki K, Car-ninci P, Hayashizaki Y, Shinozaki K (2001) Monitoring the expressionpattern of 1,300 Arabidopsis genes under drought and cold stresses byusing a full-length cDNA microarray. Plant Cell 13: 61–72
Sekimata K, Han SY, Yoneyama K, Takeuchi Y, Yoshida S, Asami T (2002)A specific and potent inhibitor of brassinosteroid biosynthesis possessinga dioxolane ring. J Agric Food Chem 50: 3486–3490
Shimada Y, Fujioka S, Miyauchi N, Kushiro M, Takatsuto S, Nomura T,Yokota T, Kamiya Y, Bishop GJ, Yoshida S (2001) Brassinosteroid-6-oxidases from Arabidopsis and tomato catalyze multiple C-6 oxidationsin brassinosteroid biosynthesis. Plant Physiol 126: 770–779
Szekeres M, Koncz C (1998) Biochemical and genetic analysis of brassino-steroid metabolism and function in Arabidopsis. Plant Physiol Biochem36: 145–155
Szekeres M, Nemeth K, KonczKalman Z, Mathur J, Kauschmann A, Alt-mann T, Redei GP, Nagy F, Schell J, Koncz C (1996) Brassinosteroidsrescue the deficiency of CYP90, a cytochrome P450, controlling cellelongation and de-etiolation in Arabidopsis. Cell 85: 171–182
Tepperman JM, Zhu T, Chang HS, Wang X, Quail PH (2001) Multipletranscription-factor genes are early targets of phytochrome A signaling.Proc Natl Acad Sci USA 98: 9437–9442
Todd J, Post-Beittenmiller D, Jaworski JG (1999) KCS1 encodes a fatty acidelongase 3-ketoacyl-CoA synthase affecting wax biosynthesis in Arabi-dopsis thaliana. Plant J 17: 119–130
von Arnim A, Deng XW (1996) Light control of seedling development.Annu Rev Plant Physiol Plant Mol Biol 47: 215–243
Wang ZY, Seto H, Fujioka S, Yoshida S, Chory J (2002) BRI1 is a criticalcomponent of a plasma-membrane receptor for plant steroids. Nature410: 380–383
Xu W, Campbell P, Vargheese AK, Braam J (1996) The Arabidopsis XET-related gene family: environmental and hormonal regulation of expres-sion. Plant J 9: 879–889
Xu W, Purugganan MM, Polisensky DH, Antosiewicz DM, Fry SC, BraamJ (1995) Arabidopsis Tch4, regulated by hormones and the environment,encodes a xyloglucan endotransglycosylase. Plant Cell 7: 1555–1567
Yin YH, Wang ZY, Mora-Garcia S, Li JM, Yoshida S, Asami T, Chory J(2002) BES1 accumulates in the nucleus in response to brassinosteroids toregulate gene expression and promote stem elongation. Cell 109: 181–191
Zhu YX, Tepperman JM, Fairchild CD, Quail PH (2000) Phytochrome Bbinds with greater apparent affinity than phytochrome A to the basichelix-loop-helix factor PIF3 in a reaction requiring the PAS domain ofPIF3. Proc Natl Acad Sci USA 97: 13419–13424
Zurek DM, Rayle DL, McMorris TC, Clouse SD (1994) Investigation of gene-expression, growth-kinetics, and wall extensibility during brassinosteroid-regulated stem elongation. Plant Physiol 104: 505–513
Goda et al.
1334 Plant Physiol. Vol. 130, 2002 www.plantphysiol.orgon June 28, 2018 - Published by Downloaded from Copyright © 2002 American Society of Plant Biologists. All rights reserved.