micro tells macro: predicting the popularity of micro
TRANSCRIPT
Micro Tells Macro: Predicting the Popularity ofMicro-Videos via a Transductive Model
Jingyuan Chen†, Xuemeng Song‡,†∗
, Liqiang Nie‡,†, Xiang Wang†, Hanwang Zhang†, Tat-Seng Chua†
† National University of Singapore, ‡ Shandong University{jingyuanchen91, sxmustc, nieliqiang, xiangwang.nus, hanwangzhang}@gmail.com,
ABSTRACTMicro-videos, a new form of user generated contents(UGCs), are gaining increasing enthusiasm. Popular micro-videos have enormous commercial potential in many ways,such as online marketing and brand tracking. In fact, thepopularity prediction of traditional UGCs including tweets,web images, and long videos, has achieved good theoreticalunderpinnings and great practical success. However, littleresearch has thus far been conducted to predict thepopularity of the bite-sized videos. This task is non-trivial due to three reasons: 1) micro-videos are shortin duration and of low quality; 2) they can be describedby multiple heterogeneous channels, spanning from social,visual, acoustic to textual modalities; and 3) there areno available benchmark dataset and discriminant featuresthat are suitable for this task. Towards this end, wepresent a transductive multi-modal learning model. Theproposed model is designed to find the optimal latentcommon space, unifying and preserving information fromdifferent modalities, whereby micro-videos can be betterrepresented. This latent space can be used to alleviatethe information insufficiency problem caused by the briefnature of micro-videos. In addition, we built a benchmarkdataset and extracted a rich set of popularity-orientedfeatures to characterize the popular micro-videos. Extensiveexperiments have demonstrated the effectiveness of theproposed model. As a side contribution, we have released thedataset, codes and parameters to facilitate other researchers.
KeywordsMicro-Videos; Popularity Prediction; Multi-View Learning
1. INTRODUCTIONThe last couple of years have witnessed the unprecedented
growth of smart mobile devices, enabling users to recordlife stories vividly with short videos and then instantly
∗Xuemeng Song is the corresponding author.
Permission to make digital or hard copies of all or part of this work for personal orclassroom use is granted without fee provided that copies are not made or distributedfor profit or commercial advantage and that copies bear this notice and the full citationon the first page. Copyrights for components of this work owned by others thanACM must be honored. Abstracting with credit is permitted. To copy otherwise, orrepublish, to post on servers or to redistribute to lists, requires prior specific permissionand/or a fee. Request permissions from [email protected].
MM ’16, October 15-19, 2016, Amsterdam, Netherlandsc⃝ 2016 ACM. ISBN 978-1-4503-3603-1/16/10. . . $15.00
DOI: http://dx.doi.org/10.1145/2964284.2964314
upload them to social media websites, such as Snapchat1
and Vine2. Since micro-videos, acting more like ‘live actionphotographs’, are usually short in length, they need littlebandwidth and hence gain tremendous user enthusiasm.The limits regarding the maximum length of micro-videoson Snapchat and Vine, are set as 10 and 6 seconds,respectively. Considering Vine as an example, its videolength distribution over our collected 303, 242 Vine videosis illustrated in Figure 1. Micro-videos, representing a newform of user generated contents (UGCs), can be viewed,discussed and even reposted by users once they are uploaded,which leads to their rapid rise. It is reported that Vine hit1.5 billion daily loops3 in 20154 and Snapchat hit 7 billiondaily views in 20165. As a video messaging platform, it ishard to crawl micro-videos from Snapchat. Hence, we focuson Vine here, which can be gathered more easily for research.
Interestingly, among the tremendous volume of micro-videos, some popular ones will be widely viewed and spreadby users, while many only gain little attention. Thisphenomena is similar to many existing social media sites,such as Twitter6. For example, the micro-video aboutthe explosion that interrupted during the France-Germanysoccer match in 2015 has been successfully looped byover 330 million times. Obviously, if we can identify thehot and popular micro-videos in advance, it will benefitmany applications, such as online marketing and networkreservation. Regarding online marketing, the accurate earlyprediction of popular micro-videos can facilitate companies’planning of advertising campaigns and thus maximizingtheir revenues. For network service providers, they cantimely reserve adequate distributed storage and bandwidthfor popular ones, based on the prediction. Therefore, it ishighly desirable to develop an effective scheme to accuratelypredict the popularity of micro-videos.
However, the popularity prediction of micro-videos isnon-trivial due to the following challenges. First ofall, due to the short duration of micro-videos, eachmodality can only provide limited information, the so-called modality limitation. Fortunately, micro-videos alwaysinvolve multiple modalities, namely, social, visual, acoustic
1https://snapchat.com.
2https://vine.co.
3Loops refer to the times a micro-video has been viewed.
4http://blog.vine.co.
5http://goo.gl/YYnBbd.
6https://twitter.com.

Figure 1: Duration distribution over our collected303, 242 micro-videos.
and textual7 modalities. In a sense, these modalities are co-related rather than independent and essentially characterizethe same micro-videos. Therefore, the major challengelies on how to effectively fuse micro-videos’ heterogeneousclues from multiple modalities [31, 30, 36]. The mostnaive strategies are early fusion and late fusion [27]. They,however, fail to account for the relatedness among multiplemodalities. Therefore, it is important to take modalityrelatedness into consideration. Secondly, due to certainexternal factors, such as camera shaking and lightingcondition, some modalities of the micro-videos, such asvisual or acoustic ones, may be of poor quality, whichis another kind of modality limitation. Hence, learningdirectly from the original feature spaces of modalities,which was adopted by most multi-modal learning methodsmay be imprecise. Consequently, to improve the learningperformance, how to compensate the noisy modality withreliable ones poses a crucial challenge for us. The lastchallenge we are facing is the lack of benchmark dataset tosupport our research. We found that both the contents andsocial influence of micro-video publishers would account fortheir popularity. As far as we know, the only available micro-video dataset [24] does not contain the important textualand social modalities and is lack of popularity indicators asthe ground truth, which makes it unsuitable for our research.It is thus necessary to build a comprehensive micro-videodataset and further extract a rich set of discriminant featuresto enhance the learning performance.To address the aforementioned challenges, we present
a novel Transductive Multi-modAL Learning approach,TMALL for short, to predicting the popularity of micro-videos. As illustrated in Figure 2, we first crawl arepresentative micro-video dataset from Vine and developa rich set of popularity-oriented features from multi-modalities. We then perform multi-modal learning topredict the popularity of micro-videos, which seamlesslytakes the modality relatedness and modality limitationinto account by utilizing a common space shared by allmodalities. We assume that there exists an optimal commonspace, which maintains the original intrinsic characteristicsof micro-videos in the original spaces. In the light of this, allmodalities are forced to be correlated. Meanwhile, micro-videos with different popularity can be better separatedin such optimal common space, as compared to that ofeach single modality. In a sense, we alleviate the modalitylimitation problem. Extensive experiments on this real-world dataset have well-validated our work.Our main contributions can be summarized in threefold:
7Micro-videos are usually associated with certain textual data, such
as video descriptions given by the video owners.
• We approached the popularity prediction of micro-videos by proposing a TMALL model, which is ableto simultaneously model the modality relatedness andhandle the modality limitations by introducing acommon space shared among all modalities. Moreover,we have derived its closed-form solution rigorously.
• We developed a rich set of popularity-orientedfeatures from multiple modalities to comprehensivelycharacterize the popular micro-videos. Apart fromnumerical results, we also provided several deepinsights based on the experimental results.
• We constructed a large-scale micro-video dataset,comprising of 303, 242 micro-videos, 98, 166 users and120, 324 following relationships. We have released ourcompiled dataset, codes and parameters8 to facilitateother researchers to repeat our experiments and verifytheir proposed approaches.
The remainder of this paper is structured as follows. Section2 reviews the related work. Data preparation is introducedin Section 3. Sections 4 and 5 detail the proposed TMALLmodel and the feature extraction, respectively. Section 6presents the experimental results and analysis, followed byour concluding remarks in Section 7.
2. RELATED WORKPopularity predication and multi-view learning are both
related to this work.
2.1 Popularity PredictionDue to its enormous commercial potential, popularity
prediction of UGCs has attracted great attention from boththe industry and academia [12, 20, 5, 29, 11]. Hong et al.[12] explored the popularity prediction of tweets, which ismeasured by the number of future retweets, by introducinga rich set of features, such as topological features, temporalfeatures and meta features. Beyond the text popularityprediction, McParlane et al. [20] focused on the popularityof images. They extracted some sophisticated features andcast the task of image popularity prediction as a problemof binary classification, where the given image would beclassified as popular or not. Later, Cappallo et al. [5]proposed a latent ranking method for the image popularityprediction solely based on the visual content. The proposedmethod was evaluated on several image datasets collectedfrom micro-blogging and photo-sharing websites. Althoughhuge success has been achieved by these approaches, limitedefforts have thus far been dedicated to the problem of videopopularity prediction, where multiple modalities coexist.Noting this gap, Trzcinski et al. [29] shifted from imagesto videos, and studied the problem of video popularityprediction utilizing both the visual clues and the earlypopularity pattern of the video once it is released. However,this approach suffered from two limitations. First, theproposed approach can only work on videos that have beenpublished over a certain period. Second, the authors onlyused the traditional machine learning method—SupportVector Regression (SVR), which failed to make full use of therelationship among modalities. As a complement, we aim totimely predict the popularity of a given micro-video evenbefore it get published by proposing a novel multi-modallearning scheme.8The dataset can be accessible via http://acmmm2016.wix.com/
micro-videos.

Figure 2: Micro-video popularity prediction via our proposed TMALL model.
2.2 Multi-View LearningTo deal with data containing multiple modalities, multi-
view learning is a highly feasible paradigm. Multi-viewlearning is designed to improve the learning performanceby introducing a function to model each view and jointlyoptimizing all functions. Existing work follows this linecan be roughly classified into two categories: co-trainingand subspace learning. Co-training algorithms usuallytrain separate learners on distinct views, which are thenimposed to be consistent across views. Sindhwani et. al.[26] introduced a co-regularization framework for multi-view semi-supervised learning, as an extension of supervisedregularization algorithms. Noticing that corruption mayexist among different views, Christoudias et al. [7]proposed an approach for multi-view learning taking theview disagreement into consideration. In contrast, subspacelearning approaches hold the general assumption thatdifferent views are generated from a latent view. Chaudhuriet al. [6] first employed canonical correlation analysis (CCA)to learn an efficient subspace, on which traditional machinelearning algorithms can be applied. Gao et al. [9] laterintroduced a novel multi-view subspace clustering method,which is able to simultaneously perform clustering on thesubspace of each view and guarantee the consistency amongmultiple views by a common clustering structure.Overall, compelling success has been achieved by multi-
view learning models on various problems, such ascategorization [26, 28], clustering [6, 9] and multimediaretrieval [18, 19]. However, to the best of our knowledge,limited efforts have been dedicated to applying multi-viewlearning in the context of micro-video popularity prediction,which is the major concern of our work.
3. DATA COLLECTIONThis section details the dataset setup, which covers the
crawling strategy, and ground truth construction.
3.1 Crawling StrategyOur micro-video dataset was crawled from one of the most
prominent micro-video sharing social networks, Vine. Besidethe historical uploaded micro-videos, Vine also archivesusers’ profiles and their social connections.In particular, we first randomly selected 10 active Vine
users from Rankzoo9, which provides the top 1, 000 active
9https://rankzoo.com.
users on Vine, as the seed users. We then adopted thebreadth-first crawling strategy to expand the seed usersby crawling their followers. Considering that these seedusers may have millions of followers, we practically onlyretained the first 1, 000 returned followers for each seeduser to improve the crawling efficiency. After three layersof crawling, we harvested a densely connected user setconsisting of 98, 166 users as well as 120, 324 followingrelationships among users. For each user, his/her briefprofile was crawled, containing full name, description,location, follower count, followee count, like count, postcount and loop count of all post videos. Besides, wealso collected the timeline (the micro-video posting history,including the repostings from others.) of each user betweenJuly 1st and October 1st, 2015. Finally, we obtained 1.6million video postings, including a total number of 303, 242unique micro-videos with a total duration of 499.8 hours.
3.2 Ground Truth ConstructionWe employed four popularity-related indicators, namely,
the number of comments (n comments), the number of likes(n likes), the number of reposts (n reposts), and the numberof loops/views (n loops) to measure the popularity of micro-videos. Figure 3 illustrates the proportion of micro-videosregarding each of the four indicators in our dataset. It isnoticed that the distributions of them are different, andeach of them measure one aspect of the popularity. In orderto comprehensively and precisely measure the popularity ofeach micro-video, yi, we linearly fuse all the four indicators:
yi =(n reposts+ n comments+ n likes+ n loops)
4. (1)
4. OUR PROPOSED TMALL MODEL
4.1 NotationWe first declare several notations. We employ bold capital
letters (e.g., X) and bold lowercase letters (e.g., x) to denotematrices and vectors, respectively. We use non-bold letters(e.g., x) to represent scalars, and Greek letters (e.g., β) asparameters. If not clarified, all vectors are in column form.
Without loss of generality, suppose we have N labeledsamples and M unlabeled samples with K > 2 modalities.It is worth noting that the unlabeled samples also serveas testing samples. Zk stands for the number of featuresgenerated from the k-th modality. Then the k-th modalitycan be represented as Xk ∈ R(N+M)×Zk . The popularity of

Figure 3: Distribution of the number of comments,likes, reposts and loops of micro-videos in ourdataset.
all the videos are denoted by y = {y1, y2, · · · , yN}T ∈ RN .Let f = {f1, f2, · · · , fN , fN+1, fN+2, · · · , fN+M}T ∈ RN+M
stand for the predicted results regarding popularity for allsamples, including the labeled and unlabeled ones. Weaim to jointly learn the common space X0 ∈ R(N+M)×Z0
shared by multiple modalities and the popularity for the Munlabeled micro-videos.Our proposed model targets at reasoning from observed
training micro-videos to testing ones. Such predictionbelongs to transductive learning, in which both labeledsamples as well as unlabeled samples are available fortraining. It hence obtains better performance. In contrast,inductive model is reasoning from observed training cases togeneral rules, which are then applied to the test cases.
4.2 Problem FormulationIt is apparent that different modalities may contribute
distinctive and complementary information about micro-videos. For example, textual modality gives us hints aboutthe topics of the given micro-video; acoustic and visualmodalities may respectively convey location and situation ofmicro-videos, and user modality demonstrates the influenceof the micro-video publisher. These clues jointly contributeto the popularity of a micro-video. Obviously, due to thenoise and information insufficiency of each modality, it maybe suboptimal to conduct learning directly from each singlemodality separately. In contrast, we assume that thereexists an optimal latent space, in which micro-videos can bebetter described. Moreover, the optimal latent space shouldmaintain the original intrinsic characteristics conveyed bymulti-modalities of the given micro-videos. Therefore,we penalize the disagreement of the normalized Laplacianmatrix between the latent space and each modality. Inparticular, we formalize this assumption as follows. LetSk ∈ R(N+M)×(N+M) be the similarity matrix10, which iscomputed by the Gaussian similarity function as follows,
Sk(i, j) =
exp(−
∥∥∥∥xik − xj
k
∥∥∥∥2
2σ2k
), if i = j;
0 , if i = j.
(2)
where xik and xj
k are the micro-video pairs in the k-thmodality space. Thereinto, the radius parameter σk issimply set as the median of the Euclidean distances overall video pairs in the k-th modality. We then derive thecorresponding normalized Laplacian matrix as follows,
L(Sk) = I−D− 1
2k SkD
− 12
k , (3)
10To facilitate the illustration, k ranges from 0 to K.
where I is a (N +M)× (N +M) identity matrix and Dk ∈R(N+M)×(N+M) is the diagonal degree matrix, whose (u, u)-th entry is the sum of the u-th row of Sk. Since Sk(i, j) > 0,we can derive that tr(L(Sk)) > 0. We thus can formulatethe disagreement penalty between the latent space and theoriginal modalities as,
K∑k=1
∥ 1
tr(L(S0))L(S0)−
1
tr(L(Sk))L(Sk) ∥2F , (4)
where tr(A) is the trace of matrix A and∥∥·∥∥
Fdenotes
the Frobenius norm of matrix. In addition, inspired by[32], considering that similar micro-videos attempt to havesimilar popularity in the latent common space, we adopt thefollowing regularizer,
1
2
N+M∑m=1
N+M∑n=1
( f(xm0 )√
D0(xm0 )
− f(xn0 )√
D0(xn0 )
)2
S0(m,n)
= fTL(S0)f . (5)
Based upon these formulations, we can define the lossfunction that measures the empirical error on the trainingsamples. As reported in [22], the squared loss usually yieldsgood performance as other complex ones. We thus adopt thesquared loss in our algorithm for simplicity and efficiency.In particular, since we do not have the labels for testingsamples, we only consider the squared loss regarding the Nunlabeled samples to guarantee the learning performance.We ultimately reach our objective function as,
minf ,L(S0)
N∑i=1
(yi − fi)2 + µfTL(S0)f
+ λ
K∑k=1
∥ 1
tr(L(S0))L(S0)−
1
tr(L(Sk))L(Sk) ∥2F , (6)
where λ and µ are both nonnegative regularizationparameters. To be more specific, λ penalizes thedisagreement among the latent space and modalities, and µencourages that similar popularity will be assigned to similarmicro-videos.
4.3 Alternative OptimizationTo simplify the representation, we first define that,
L =1
tr(L(S0))L(S0),
Lk =1
tr(L(Sk))L(Sk).
(7)
Therefore, the objective function can be transformed to,
minf
N∑i=1
(yi − fi)2 + λ
K∑k=1
∥∥L− Lk
∥∥2
F+ µfT Lf ,
subject to tr(L(S0)) = 1. (8)
Furthermore, to optimize L more efficiently, inspired by theproperty that tr(Lk) = 1, we let,
L(S0) =
K∑k=1
βkLk, subject to
K∑k=1
βk = 1. (9)

Consequently, we have,
L =1
tr(L(S0))L(S0) =
K∑k=1
βkLk,
subject toK∑
k=1
βk = 1. (10)
Interestingly, we find that βk can be treated as the co-related degree between the latent common space and eachmodality. It is worth noting that we do not impose theconstraint of β ≥ 0, since we want to keep both positiveand negative co-relations. A positive coefficient indicatesthe positive correlation between the modality space and thelatent common space, while a negative coefficient reflects thenegative correlation, which may be due to the noisy data ofthe modality. The larger the βk is, the higher correlationbetween the latent space and the k-th modality will be. Inthe end, the final objective function can be written as,
minf ,β
N∑i=1
(yi − fi)2 + λ
K∑k=1
∥∥∑Ki=1 βiLi − Lk
∥∥2
F+
µfTK∑
k=1
βkLkf + θ∥∥β∥∥2
, subject to eTβ = 1, (11)
where β = [β1, β2, · · · , βK ]T ∈ RK and e = [1, 1, · · · , 1]T ∈RK . θ is the regularization parameter, introduced to avoidthe overfitting problem. We denote the objective functionof Eqn.(11) as Γ. We adopt the alternating optimizationstrategy to solve the two variables f and β in Γ. Inparticular, we optimize one variable while fixing the otherone in each iteration. We keep this iterative procedure untilthe Γ converges.
4.3.1 Computing βj with f fixedWe first fix f and transform the objective function Γ as,
minβ
λ
K∑k=1
N+M∑t=1
∥∥∥M(t)β − l(t)k
∥∥∥2
F+ µgTβ + θ
∥∥β∥∥2,
subject to eTβ = 1, (12)
where g = [fT L1f , fT L2f , · · · , fT LKf ]T ∈ RK , M(t) =
[l(t)1 , l
(t)2 , · · · , l(t)K ] ∈ R(N+M)×K and l
(t)k ∈ RN+M denotes
the t-th column of Lk. For simplicity, we replace l(t)K with
l(t)k eTβ, as eTβ = 1. With the help of Lagrangian, Γ canbe rewritten as follows.
minβ
λ
K∑k=1
N+M∑t=1
∥∥∥(M(t) − l(t)k eT )β
∥∥∥2
F+ µgTβ + δ(1− eTβ)
+ θ∥∥β∥∥2
, (13)
where δ is a nonnegative Lagrange multiplier. Takingderivative of Eqn.(13) with respect to β, we have,
∂Γ
∂β= Hβ + µg − δe, (14)
where,
H = 2[(
λ
K∑k=1
N+M∑t=1
(M(t) − l(t)k eT )T (M(t) − l
(t)k eT )
)+ θI
],
(15)
and I is a K ×K identity matrix. Setting Eqn.(14) to zero,we have,
β = H−1(δe− µg). (16)
Substituting Eqn.(16) into eTβ = 1, we have,δ =
1 + µeTH−1g
eTH−1e,
β = H−1[e+ µeTH−1ge
eTH−1e− µg
].
(17)
According to the definition of positive-definite matrix, His always positive definite and hence invertible. Therefore,H−1 is also positive definite, which ensures eTH−1e > 0.
4.3.2 Computing f with βj fixedWith fixed βj , taking derivative of Γ with respect to fi,
where 1 ≤ i ≤ N , we have,
∂Γ
∂fi= 2(fi − yi) + 2µ
N+M∑j=1
L(i, j)fj . (18)
We then take derivative of the Γ with respect to fi, whereN + 1 ≤ i ≤ N +M . We reach,
∂Γ
∂fi= 2µ
N+M∑j=1
L(i, j)fj . (19)
In a vector-wise form, we restate the solution of f as follows,
f = G−1y, (20)
whereG = I+µ∑K
k=1 βkLk, y = {y1, y2, · · · , yN , 0, 0, · · · , 0}and I ∈ R(N+M)×(N+M) is defined as follows,
I(i, j) =
{1 if i = j, and 1 ≤ i ≤ N,
0 otherwise.(21)
5. FEATURE EXTRACTIONIt is apparent that both the publisher influence and
content influence contribute to the popularity of UGCs.In particular, we characterized the publisher influence viathe social modality, and the content influence via visual,acoustic and textual modalities. For content influence,we first examined the popular micro-videos in our datasetand propose three common characteristics of online micro-videos. For each characteristic, we then explained theinsights, and transformed it into a set of features forvideo representation. Finally, we developed a rich set ofpopularity-oriented features from each modality.
5.1 ObservationsUniversal Appeal. The subjects of widely popular
micro-videos cannot be something that can only beappreciated by a small group of people. Therefore, the topicsand objects contained in micro-videos should be somethingcommon so that to be interpreted the same way acrosspeople and cultures. To capture this characteristic, weextracted Sentence2Vector feature from the textual modalityand deep object feature from the visual one.
Emotional Content. People are naturally drawn tothings that arouse their emotions. Micro-videos showingfunny animals or lovely babies make people feel urge to

share them to express the same emotions. As a result, micro-videos that are highly emotional are more likely to be shared.Therefore, we extracted textual sentiment, visual sentimentfeatures for each video as well as several acoustic features,which is widely used in emotion recognition in music [33].High Quality and Aesthetic Design. When people
share information on social networks, people are actuallyshowing a little piece of themselves to their audience.Therefore, high quality and aesthetic design of the content,which could reflect the taste of people, is another importantcharacteristic of popular micro-videos. Color histogram,aesthetic feature and visual quality feature were thusextracted to encode such characteristic. In addition, theacoustic features we extracted are frequently used in musicmodeling, which could help to detect music in the audiotrack of micro-videos [17].
5.2 Social ModalityIt is intuitive that micro-videos posted by users, who has
more followers or has a verified account, are more likely tobe propagated, and thus tend to receive a higher numberof audiences. To characterize the influence of micro-videopublishers, we developed the following publisher-centricfeatures for micro-videos.
• Follower/Followee Count. The number of followersand followees of the given micro-video publisher.
• Loop Count. The total number of loops received byall the posts of the publisher.
• Post Count. The number of posts generated by thepublisher.
• Twitter Verification. A binary value indicatingwhether the publisher has been verified by Twitter11.
5.3 Visual ModalityDue to the short-length of micro-videos, the visual content
is usually highly related to a single theme, which enablesus to only employ a few key frames to represent the wholemicro-video. Inspired by this, we extracted the visualfeatures from certain key frames. The mean pooling wasperformed across all the key frames to create a fixed-lengthvector representation of each micro-video.
5.3.1 Color HistogramIt has been found that most basic visual features (i.e.,
intensity and the mean value of different color channels inHSV space) except color histogram, have little correlationwith popularity [15]. Color histogram has outstandingcorrelation due to the fact that striking colors tend to catchusers’ eyes. Therefore, we only extracted color histogramas the basic visual feature to characterize popular micro-videos. To reduce the size of color space, we grouped thecolor space into 50 distinct colors, which results in a 50-Dvector for each frame.
5.3.2 Object FeaturesIt has been studied that popular UGCs are strongly
correlated with the objects contained in the videos [10]. Webelieve that the presence of certain objects affect micro-videos’ popularity. For example, micro-videos with ‘cute
11A Vine account can be verified by Twitter, if it is linked to a verified
Twitter account.
dogs’ or ‘beautiful girls’ are more likely to be popularthan those with ‘desks’ and ‘stones’. We thus employedthe deep convolutional neural networks (CNNs) [16], apowerful model for image recognition problems [35], todetect objects in micro-videos. Specifically, we applied thewell-trained AlexNet DNN provided by the Caffe softwarepackage [13] to the input key frames. The output of thefc7 layer and the final 1, 000-way softmax layer in AlexNetis a probability distribution over the 1, 000 class labelspredefined in ImageNet. We treat them as our featurerepresentation of each frame. In the end, a mean poolingwas performed over the frames to generate a single 4, 096-Dvector and 1, 000-D vector for each micro-video.
5.3.3 SentiBank FeaturesWe performed the sentiment analysis of the visual
modality due to that the sentiment of UGCs has beenproven to be strongly correlated with their popularity [10].In particular, we extracted the visual sentiment featuresbased on the deep CNNs model which was trained on theSentiBank dataset[4]. SentiBank contains 2, 089 conceptsand each of them invokes specific sentiments such as ‘cutegirls’ and ‘funny animals’. Therefore, after mean poolingamong keyframes, each micro-video is represented by a2, 089-D vector.
5.3.4 Aesthetic FeaturesAesthetic features are a set of handful selected features
related to the principles of the nature and appreciation ofbeauty, which have been studied and found to be effectivein popularity prediction [8]. Intuitively, micro-videos thatare objectively aesthetic are more likely to be popular. Weemployed the released tool12 [3] to extract the followingaesthetic features: a) dark channel feature; b) luminosityfeature; c) s3 sharpness; d) symmetry; e) low depth of field;f) white balance; g) colorfulness; h) color harmony, and i)eye sensitivity, at 3× 3 grids over each key frame. We thencalculated: a) normalized area of dominant object; and b)normalized distances of centroid of dominant objects withrespect to four stress points at frame level. In the end, weobtained 149-D aesthetic features for each micro-video.
5.3.5 Visual Quality Assessment FeaturesIt is important that the visual quality of popular contents
are maintained at an acceptable level, given rising consumerexpectations of the quality of multimedia content deliveredto them [25]. In particular, we employed the released tool13
to extract the micro-videos quality features based on themotion and spatio-temporal information, which have beenproven to correlate highly with human visual judgments ofquality. This results in a 46-D features.
5.4 Acoustic ModalityAcoustic modality usually works as an important
complement to visual modality in many video-related tasks,such as video classification [34]. In fact, audio channelsembedded in the micro-videos may also contribute tothe popularity of micro-videos to a large extent. Forexample, the audio channel may indicate the quality of agiven micro-video and convey rich background informationabout the emotion as well as the scene contained in the
12http://www.ee.columbia.edu/˜subh/Software.php.
13http://live.ece.utexas.edu/.

micro-video, which significantly affects the popularity of amicro-video. The acoustic information is especially usefulfor the cases where the visual features could not carryenough information. Therefore, we adopted the followingwidely-used acoustic features, i.e., Mel-Frequency CepstralCoefficients (MFCC) [17] and Audio-Six (i.e., EnergyEntropy, Signal Energy, Zero Crossing Rate, SpectralRolloff, Spectral Centroid, and Spectral Flux [33]). Thesefeatures are frequently used in different audio-related tasks,such as emotion detection and music recognition. We finallyobtained a 36-D acoustic feature vector for each micro-video.
5.5 Textual ModalityMicro-videos are usually associated with textual modality
in the form of descriptions, such as “when Leo finally getsthe Oscar” and “Puppy dog dreams”, which may preciselysummarize the micro-videos. Such summarization maydepict the topics and sentiment information regarding themicro-videos, which has been proven to be of significance inonline article popularity prediction [2].
5.5.1 Sentence2VectorWe found that the popular micro-videos are sometimes
related to the topics of the textual descriptions. Thisobservation propels us to conduct content analysis overthe textual descriptions of micro-videos. Considering theshort-length of descriptions, to perform content analysis,we employed the state-of-the-art textual feature extractiontool Sentence2Vector14, which was developed on the basis ofwork embedding algorithm Word2Vector [21]. In this way,we extracted 100-D features for video descriptions.
5.5.2 Textual SentimentWe also analyze the sentiments over texts, which has been
proven to play an important role in popularity prediction[1]. With the help of the Sentiment Analysis tool inStanford CoreNLP tools15, we assigned each micro-video asentiment score ranging from 0 to 4 and they correspond tovery negative, negative, neutral, positive, and very positive,respectively.
6. EXPERIMENTIn this section, we conducted extensive experiments to
comparatively verify our model.
6.1 Experiment SettingsThe remaining experiments were conducted over a cluster
of 50 servers equipped with Intel Xeon(2x) CPU E5-2620v3 at 2.40 GHz on 64 GB RAM, 24 cores and 64-bit Linuxoperating system. Regarding the deep feature extraction,we deployed Caffe framework [13] on a server equipped witha NVIDIA Titan Z GPU. The experimental results reportedin this paper were based on 10-fold cross-validation. In eachround of the 10-fold cross-validation, we split our datasetinto two chunks: 90% of the micro-videos were used fortraining, 10% were used for testing. We report performancein terms of normalised Mean Square Error (nMSE) [22]between the predicted popularity and the actual popularity.The nMSE is an estimator of the overall deviations between
14https://github.com/klb3713/sentence2vec.
15http://stanfordnlp.github.io/CoreNLP/.
predicted and measured values. It is defined as,
nMSE =
∑i=1 (pi − ri)
2∑i=1 r
2i
, (22)
where pi is the predicted value and ri is the target value inground truth.
We have three key parameters as shown in Eqn.(8). Theoptimal values of these parameters were carefully tuned withthe training data in each of the 10 fold. We employedthe grid search strategy to obtain the optimal parametersbetween 10−5 to 102 with small but adaptive step sizes.In particular, the step sizes were 0.00001, 0.0001, 0.001,0.01, 0.1, 1 and 10 for the range of [0.00001,0.0001],[0.0001,0.001], [0.001,0.01], [0.01,0.1], [0.1,1], [1,10] and[10,100], respectively. The parameters corresponding to thebest nMSE were used to report the final results. For othercompared systems, the procedures to tune the parametersare analogous to ensure the fair comparison. Consideringone fold as an example, we observed that our model reachedthe optimal performance at λ = 1, µ = 0.01 and θ = 100.
6.2 On Model ComparisonTo demonstrate the effectiveness of our proposed TMALL
model, we carried out experiments with several state-of-the-art multi-view learning approaches:
• Early Fusion. The first baseline concatenates thefeatures extracted from the four modalities intoa single joint feature vector, on which traditionalmachine learning models can be applied. In this work,we adopted the widely used regression model—SVR,and implemented it with the help of scikit-learn [23].
• Late Fusion. The second baseline first separatelypredicts the popularity of micro-videos from eachmodality via SVR model, and then linearly integratesthem to obtain the final results.
• regMVMT. The third baseline is the regularizedmulti-view learning model [37]. This model onlyregulates the relationships among different viewswithin the original space.
• MSNL. The fourth one is the multiple social networklearning (MSNL) model proposed in [27]. This modeltakes the source confidence and source consistency intoconsideration.
• MvDA. The fifth baseline is a multi-view discriminantanalysis (MvDA) model [14], which aims to learn asingle unified discriminant common space for multipleviews by jointly optimizing multiple view-specifictransforms, one for each view. The model exploits boththe intra-view and inter-view correlations.
Table 1 shows the performance comparison amongdifferent models. From this table, we have the followingobservations: 1) TMALL outperforms the Early Fusionand Late Fusion. Regarding the Early Fusion, featuresextracted from various sources may not fall into the samesemantic space. Simply appending all features actuallybrings in a certain amount of noise and ambiguity. Besides,Early Fusion may lead to the curse of dimensionality sincethe final feature vector would be of very high dimension.For the Late Fusion, the fused result however might notbe reasonably accurate due to two reasons. First, a singlemodality might not be sufficiently descriptive to represent

Table 1: Performance comparison between ourproposed TMALL model and several state-of-the-art baselines in terms of nMSE.
Methods nMSE p-value
Early Fusion 59.931 ± 41.09 9.91E-04Late Fusion 8.461 ± 5.34 3.25E-03regMVMT 1.058 ± 0.05 1.88E-03MSNL 1.098 ± 0.13 1.42E-02MvDA 0.982 ± 7.00E-03 9.91E-04TMALL 0.979 ± 9.42E-03 –
the complex semantics of the videos. Separate resultswould be thus suboptimal and the integration may notresult in a desired outcome. Second, it is labor-intensiveto tune the fusion weights for different modalities. Evenworse, the optimal parameters for one application cannot bedirectly applied to another one. 2) TMALL achieves betterperformance, as compared with regMVMT and MSNL. Thiscould be explained that linking different modalities via aunified latent space is better than imposing disagreementpenalty directly over original spaces. 3) The less satisfactoryperformance of MvDA indicates that it is necessary toexplore the consistency among different modalities whenbuilding the latent space. And 4) as compared to the multi-view learning baselines, such as regMVMT, MSNL, andMvDA, our model stably demonstrates its advantage. Thissignals that the proposed transductive models can achievehigher performance than inductive models under the sameexperimental settings. This can be explained by the factthat TMALL leverages the knowledge of testing samples.Moreover, we performed the paired t-test between
TMALL and each baseline on 10-fold cross validation. Wefound that all the p-values are much smaller than 0.05, whichshows that the performance improvements of our proposedmodel over other baselines are statistically significant.
6.3 On Modality ComparisonTo verify the effectiveness of multi-modal integration,
we also conducted experiments over different modalitycombinations of the four modalities. Table 2 summarizesthe multi-modal analysis and the paired t-test results. It isobvious that the more modalities we incorporated, the betterperformance we can obtain. This implies the complementaryrelationships rather than mutual conflicting relationshipsamong the different modalities. Moreover, we found thatremoving features from any of these four modalities suffersfrom a decrease in performance. In a sense, this isconsensus with the old saying “two heads are better thanone”. Additionally, as the performance obtained fromdifferent combinations are not the same, this validates thatincorporating β which controls the confidence of differentmodalities is reasonable. Interestingly, we observed that thecombination without social modality obtains the worst resultwhich indicates that the social modality plays a pivotal rolein micro-video propagation, as compared to visual, textualor acoustic modality. This also validates that the featuresdeveloped from social modality are much discriminative,even though they are with low-dimensions. On the otherhand, the textual modality contributes the least among allmodalities, as the performance of our model without textualmodality still achieves good performance. This may be
Table 2: Performance comparison among differentmodality combinations with respect to nMSE. Wedenote T, V, A and S as textual, visual, acousticand social modality, respectively.
View combinations nMSE p-value
T+V+A 0.996 ± 4.20E-03 2.62E-05T+A+S 0.982 ± 4.27E-03 2.59E-05T+V+S 0.982 ± 4.13E-03 3.05E-04V+A+S 0.981 ± 5.16E-03 2.16E-05
T+V+A+S 0.979 ± 9.42E-03 –
Table 3: Performance comparison among differentvisual features with respect to nMSE.
Features nMSE p-valueColor Histogram 0.996 ± 6.88E-03 1.94E-04Object Feature 0.994 ± 6.71E-03 2.47E-04Visual Sentiment 0.994 ± 6.72E-03 2.49E-04Aesthetic Feature 0.984 ± 6.95E-03 4.44E-01
ALL 0.979 ± 9.42E-03 –
caused by the sparse textual description, which is usuallygiven in one short sentence.
6.4 On Visual Feature ComparisonTo further examine the discriminative visual features we
extracted, we conducted experiments over different kinds ofvisual features using TMALL. We also performed significanttest to validate the advantage of combining multiplefeatures. Table 3 comparatively shows the performance ofTMALL in terms of different visual feature configurations.It can be seen that the object, visual sentiment and aestheticfeatures achieve similar improvement in performance, ascompared to color histogram features. This reveals thatmicro-videos’ popularity is better reflected by their content,sentiment and design, including what objects they contain,which emotion they convey and what design standards theyfollow. This is highly consistent with our oberservationsand also implies that micro-videos which aim to gain highpopularity need to be well designed and considered morefrom the visual content.
6.5 Illustrative ExamplesTo gain the insights of the influential factors in the task
of popularity prediction of micro-videos, we comparativelyillustrate a few representative examples in Figure 4. Fromthis figure, we have the following observations: 1) Figure4(a) shows three micro-video pairs. Each of the three micro-video pairs describes the similar semantics, i.e., animals,football game and sunset, respectively, but they werepublished by different users. The publishers of the videosin top row are much more famous than those of the bottom.We found that the corresponding popularity of micro-videosin the second row are much lower than those in the firstrow, although they have no significant difference from theperspective of video contents, which clearly justifies theimportance of social modality. 2) Figure 4(b) illustratesthree micro-video pairs, where each pair of micro-videoswere published by the same user. However, the micro-videosin the first row achieve much higher popularity than thosein the second row, which demonstrates that the contentsof micro-videos also contribute to their popularity. In
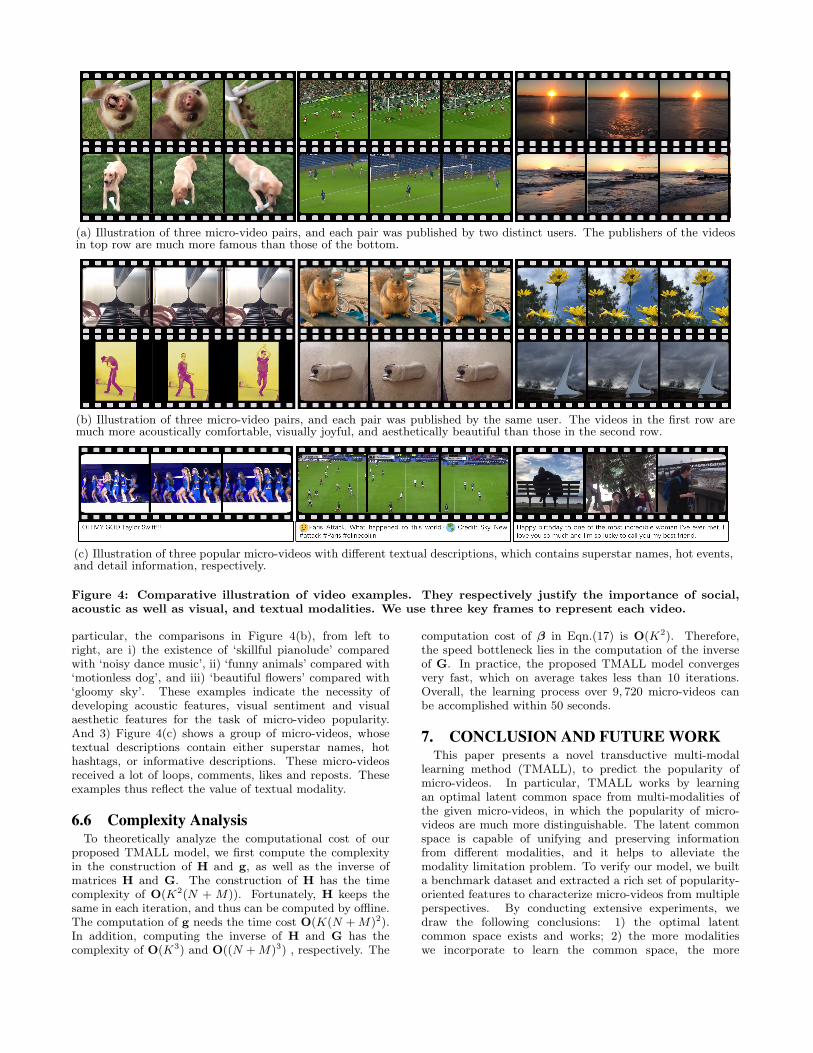
(a) Illustration of three micro-video pairs, and each pair was published by two distinct users. The publishers of the videosin top row are much more famous than those of the bottom.
(b) Illustration of three micro-video pairs, and each pair was published by the same user. The videos in the first row aremuch more acoustically comfortable, visually joyful, and aesthetically beautiful than those in the second row.
(c) Illustration of three popular micro-videos with different textual descriptions, which contains superstar names, hot events,and detail information, respectively.
Figure 4: Comparative illustration of video examples. They respectively justify the importance of social,acoustic as well as visual, and textual modalities. We use three key frames to represent each video.
particular, the comparisons in Figure 4(b), from left toright, are i) the existence of ‘skillful pianolude’ comparedwith ‘noisy dance music’, ii) ‘funny animals’ compared with‘motionless dog’, and iii) ‘beautiful flowers’ compared with‘gloomy sky’. These examples indicate the necessity ofdeveloping acoustic features, visual sentiment and visualaesthetic features for the task of micro-video popularity.And 3) Figure 4(c) shows a group of micro-videos, whosetextual descriptions contain either superstar names, hothashtags, or informative descriptions. These micro-videosreceived a lot of loops, comments, likes and reposts. Theseexamples thus reflect the value of textual modality.
6.6 Complexity AnalysisTo theoretically analyze the computational cost of our
proposed TMALL model, we first compute the complexityin the construction of H and g, as well as the inverse ofmatrices H and G. The construction of H has the timecomplexity of O(K2(N + M)). Fortunately, H keeps thesame in each iteration, and thus can be computed by offline.The computation of g needs the time cost O(K(N +M)2).In addition, computing the inverse of H and G has thecomplexity of O(K3) and O((N +M)3) , respectively. The
computation cost of β in Eqn.(17) is O(K2). Therefore,the speed bottleneck lies in the computation of the inverseof G. In practice, the proposed TMALL model convergesvery fast, which on average takes less than 10 iterations.Overall, the learning process over 9, 720 micro-videos canbe accomplished within 50 seconds.
7. CONCLUSION AND FUTURE WORKThis paper presents a novel transductive multi-modal
learning method (TMALL), to predict the popularity ofmicro-videos. In particular, TMALL works by learningan optimal latent common space from multi-modalities ofthe given micro-videos, in which the popularity of micro-videos are much more distinguishable. The latent commonspace is capable of unifying and preserving informationfrom different modalities, and it helps to alleviate themodality limitation problem. To verify our model, we builta benchmark dataset and extracted a rich set of popularity-oriented features to characterize micro-videos from multipleperspectives. By conducting extensive experiments, wedraw the following conclusions: 1) the optimal latentcommon space exists and works; 2) the more modalitieswe incorporate to learn the common space, the more

discriminant it is; and 3) the features extracted to describethe social and content influence are representative. As a sideresearch contribution, we have released the dataset, codesand parameters to facilitate other researchers. In the future,we plan to incorporate the cross-domain knowledge, such asthe hot topics on Twitter, to enhance the performance ofpopularity prediction.
8. ACKNOWLEDGMENTSThis research is supported by the National Research
Foundation, Prime Minister’s Office, Singapore under itsIRC@SG Funding Initiative.
9. REFERENCES[1] J. Berger. Arousal increases social transmission of information.
Psychological science, 22(7):891–893, 2011.
[2] J. Berger and K. L. Milkman. What makes online contentviral? Journal of Marketing Research, 49(2):192–205, 2012.
[3] S. Bhattacharya, B. Nojavanasghari, T. Chen, D. Liu, S.-F.Chang, and M. Shah. Towards a comprehensive computationalmodel foraesthetic assessment of videos. In Proceedings of theACM Multimedia Conference, pages 361–364. ACM, 2013.
[4] D. Borth, R. Ji, T. Chen, T. M. Breuel, and S. Chang.Large-scale visual sentiment ontology and detectors usingadjective noun pairs. In Proceedings of the ACM MultimediaConference, pages 223–232. ACM, 2013.
[5] S. Cappallo, T. Mensink, and C. G. M. Snoek. Latent factors ofvisual popularity prediction. In Proceedings of the ACM onInternational Conference on Multimedia Retrieval, pages195–202. ACM, 2015.
[6] K. Chaudhuri, S. M. Kakade, K. Livescu, and K. Sridharan.Multi-view clustering via canonical correlation analysis. InProceedings of the International Conference on MachineLearning, pages 129–136. ACM, 2009.
[7] C. M. Christoudias, R. Urtasun, and T. Darrell. Multi-viewlearning in the presence of view disagreement. CoRR,abs/1206.3242, 2012.
[8] S. Dhar, V. Ordonez, and T. L. Berg. High level describableattributes for predicting aesthetics and interestingness. InProceedings of the IEEE Conference on Computer Vision andPattern Recognition, pages 1657–1664. IEEE, 2011.
[9] H. Gao, F. Nie, X. Li, and H. Huang. Multi-view subspaceclustering. In IEEE International Conference on ComputerVision, pages 4238–4246. IEEE, 2015.
[10] F. Gelli, T. Uricchio, M. Bertini, A. D. Bimbo, and S. Chang.Image popularity prediction in social media using sentimentand context features. In Proceedings of the ACM MultimediaConference, pages 907–910. ACM, 2015.
[11] X. He, M. Gao, M. Kan, Y. Liu, and K. Sugiyama. Predictingthe popularity of web 2.0 items based on user comments. InProceedings of the International ACM SIGIR Conference onResearch and Development in Information Retrieval, pages233–242. ACM, 2014.
[12] L. Hong, O. Dan, and B. D. Davison. Predicting popularmessages in twitter. In Proceedings of the ACM InternationalConference on World Wide Web, pages 57–58. ACM, 2011.
[13] Y. Jia, E. Shelhamer, J. Donahue, S. Karayev, J. Long, R. B.Girshick, S. Guadarrama, and T. Darrell. Caffe: Convolutionalarchitecture for fast feature embedding. In Proceedings of theACM Multimedia Conference, pages 675–678. ACM, 2014.
[14] M. Kan, S. Shan, H. Zhang, S. Lao, and X. Chen. Multi-viewdiscriminant analysis. IEEE Transactions on Pattern Analysisand Machine Intelligence, 38(1):188–194, 2016.
[15] A. Khosla, A. D. Sarma, and R. Hamid. What makes an imagepopular? In Proceedings of the ACM InternationalConference on World Wide Web, pages 867–876, 2014.
[16] A. Krizhevsky, I. Sutskever, and G. E. Hinton. Imagenetclassification with deep convolutional neural networks. InProceedings of the Annual Conference on Neural InformationProcessing Systems, pages 1106–1114. NIPS Foundation, 2012.
[17] Z. Li, J. Wang, J. Cai, Z. Duan, H. Wang, and Y. Wang.Non-reference audio quality assessment for online live musicrecordings. In Proceedings of the ACM MultimediaConference, pages 63–72. ACM, 2013.
[18] A. Liu, W. Nie, Y. Gao, and Y. Su. Multi-modal clique-graphmatching for view-based 3d model retrieval. IEEETransactions on Image Processing, 25(5):2103–2116, 2016.
[19] A. Liu, Z. Wang, W. Nie, and Y. Su. Graph-basedcharacteristic view set extraction and matching for 3d modelretrieval. Information Sciences, 320:429–442, 2015.
[20] P. J. McParlane, Y. Moshfeghi, and J. M. Jose. ”nobody comeshere anymore, it’s too crowded”; predicting image popularity onflickr. In Proceedings of the ACM International Conferenceon Multimedia Retrieval, page 385. ACM, 2014.
[21] T. Mikolov, I. Sutskever, K. Chen, G. S. Corrado, and J. Dean.Distributed representations of words and phrases and theircompositionality. In Proceedings of the Annual Conference onNeural Information Processing Systems, pages 3111–3119.NIPS Foundation, 2013.
[22] L. Nie, L. Zhang, Y. Yang, M. Wang, R. Hong, and T.-S. Chua.Beyond doctors: future health prediction from multimedia andmultimodal observations. In Proceedings of the ACMMultimedia Conference, pages 591–600. ACM, 2015.
[23] F. Pedregosa, G. Varoquaux, A. Gramfort, V. Michel,B. Thirion, O. Grisel, M. Blondel, P. Prettenhofer, R. Weiss,V. Dubourg, J. Vanderplas, A. Passos, D. Cournapeau,M. Brucher, M. Perrot, and E. Duchesnay. Scikit-learn:Machine learning in Python. Journal of Machine LearningResearch, 12:2825–2830, 2011.
[24] M. Redi, N. O’Hare, R. Schifanella, M. Trevisiol, andA. Jaimes. 6 seconds of sound and vision: Creativity inmicro-videos. In Proceedings of the IEEE Conference onComputer Vision and Pattern Recognition, pages 4272–4279.IEEE, 2014.
[25] M. A. Saad, A. C. Bovik, and C. Charrier. Blind prediction ofnatural video quality. IEEE Transactions on ImageProcessing, 23(3):1352–1365, 2014.
[26] V. Sindhwani, P. Niyogi, and M. Belkin. A co-regularizationapproach to semi-supervised learning with multiple views. InProceedings of the International Conference on MachineLearning, pages 74–79. ACM, 2005.
[27] X. Song, L. Nie, L. Zhang, M. Akbari, and T. Chua. Multiplesocial network learning and its application in volunteerismtendency prediction. In Proceedings of the International ACMSIGIR Conference on Research and Development inInformation Retrieval, pages 213–222, 2015.
[28] X. Song, L. Nie, L. Zhang, M. Liu, and T. Chua. Interestinference via structure-constrained multi-source multi-tasklearning. In Proceedings of the International Joint Conferenceon Artificial Intelligence, pages 2371–2377. AAAI Press, 2015.
[29] T. Trzcinski and P. Rokita. Predicting popularity of onlinevideos using support vector regression. CoRR, abs/1510.06223,2015.
[30] M. Wang, X. Hua, R. Hong, J. Tang, G. Qi, and Y. Song.Unified video annotation via multigraph learning. IEEETransactions on Circuits and Systems for Video Technology,19(5):733–746, 2009.
[31] M. Wang, H. Li, D. Tao, K. Lu, and X. Wu. Multimodalgraph-based reranking for web image search. IEEETransactions on Image Processing, 21(11):4649–4661, 2012.
[32] M. Wang, X. Liu, and X. Wu. Visual classification by
1-hypergraph modeling. IEEE Transactions on Knowledgeand Data Engineering, 27(9):2564–2574, 2015.
[33] B. Wu, E. Zhong, A. Horner, and Q. Yang. Music emotionrecognition by multi-label multi-layer multi-instance multi-viewlearning. In Proceedings of the ACM Multimedia Conference,pages 117–126. ACM, 2014.
[34] Z. Wu, Y. Jiang, J. Wang, J. Pu, and X. Xue. Exploringinter-feature and inter-class relationships with deep neuralnetworks for video classification. In Proceedings of the ACMMultimedia Conference, pages 167–176. ACM, 2014.
[35] H. Zhang, X. Shang, W. Yang, H. Xu, H. Luan, and T. Chua.Online collaborative learning for open-vocabulary visualclassifiers. In Proceedings of the IEEE Conference onComputer Vision and Pattern Recognition. IEEE, 2016.
[36] H. Zhang, M. Wang, R. Hong, and T. Chua. Play and rewind:optimizing binary representations of videos by self-supervisedtemporal hashing. In Proceedings of the ACM MultimediaConference. ACM, 2016.
[37] J. Zhang and J. Huan. Inductive multi-task learning withmultiple view data. In Proceedings of the ACM SIGKDDInternational Conference on Knowledge Discovery and DataMining, pages 543–551. ACM, 2012.