micro markets lift vending industry s revenue to $20.9...
TRANSCRIPT

ince the industry started recovering from the Great Recession, there has been a
new business model emerging. Dur-ing the hard years, it became appar-ent to many operators it was time to gain operating efficiencies and better control costs. This has led to a steady increase in the investment in vending management systems (VMS) as a way for operators to manage their busi-nesses more effectively. In 2015, oper-ators using VMS report it has helped increase same store sales, cut unprof-itable accounts, cut labor and vehi-cles costs, increase product variety, all while maintaining or increasing sales and profits. Cashless payment acceptance is also being adopted at a faster rate. It has increased sales in many locations, according to opera-tor comments. In part due to this strengthening of business practices, the aggregate revenue for the industry has grown nearly 4 percent in the past year to reach $20.9 billion, the high-est it has been in 6 years.
In addition to vending technology, micro markets have been invigorating revenues. Thanks to the open shop-ping experience with new products and broader appeal, micro markets are driving interest by workplaces and consumers. Both are requesting this type of solution from operators at an increasing pace. Micro markets have also brought new equipment providers, new smaller location solu-tions, and additional product sup-pliers to the industry. In 2015, the percentage of revenue associated with micro markets rose to a record-break-ing 10.2 percent of the total, making it
S
Chart 2: OperatOr sales
SizeRevenue Range
% of 2015 opeRatoRS
pRojected 2015 SaleS
% of 2015 SaleS
Small under $1M 50.5% $1.77B 8%
Medium $1M - $4.9M 26.6% 5.81B 28%
large $5M - $9.9M 9.1% 5.27B 25%
extra large $10M + 13.8% 8.06B 39%
BIL
LIO
NS
OF
DO
LL
AR
S 23.21
19.31 19.69 20.17 20.9022.54 22.05
19.85 19.25 18.96
0
5
10
15
20
25
2015201420132012201120102009200820072006
Chart 1: industry revenue in billiOns, 10-year review
annual repOrt S t a t e o f t h e i n d u S t r y
industry revenue tO $20.9 billiOn
Micro MarketS
lift vending
vending machines still remain a core business asset, but revenues are growing from more effective business management tools and expanding service opportunities.
By Emily Refermat, Editor
22 Automatic Merchandiser VendingMarketWatch.com June/July 2016
33%
28.3%
9%15.9%
58%55.8%
No
chan
geR
educ
edA
dded
Other
Management
Administration
Warehouse
Repair
Delivery
Sales17.6%
36.2%
28%
10.5%26.6%
18.8%
50%
11.7%
23.4%
13.4%
26.6%
N/A
9.6%
61.7%
Other
Management
Administration
Warehouse
Repair
Delivery
Sales 17.5%12%
30.1%44%
8.7%24%
13.6%32%
17.5%44%
11.7%28%
N/A0%
Chart 3a: Machines by lOcatiOn
●Manufacturing
● Offices
●Hotels/motels
●Restaurants, bars, clubs
●Retail sites
●Hospitals, nursing homes
●Universities, colleges
●Elementary, middle, high schools
●Military bases
●Correctional facilities
● Other
Chart 3B: nuMber Of lOcatiOns served in 2015 cOMpared tO 2014
●Increase
● Remained the same
●Decreased
Chart 4: staffing changes, 2-year review●2014 ●2015
Chart 4C: areas where staff was reduced, 2-year review ●2014 ●2015
Chart 4B: areas where staff was added, 2-year review●2014 ●2015
9.6%
9.7%
8.7%
5.6% 4.7%
10%
6.8%
7.3%6.6%
13.1%
18.4%
2015
9.6%
9.7%
8.7%
10%
6.8% 13.1%
18.4%5.6%4.7%
7.3%6.6%
9.6%
9.7%
8.7%
10%
6.8% 13.1%
18.4%5.6%4.7%
7.3%
6.6%
2015
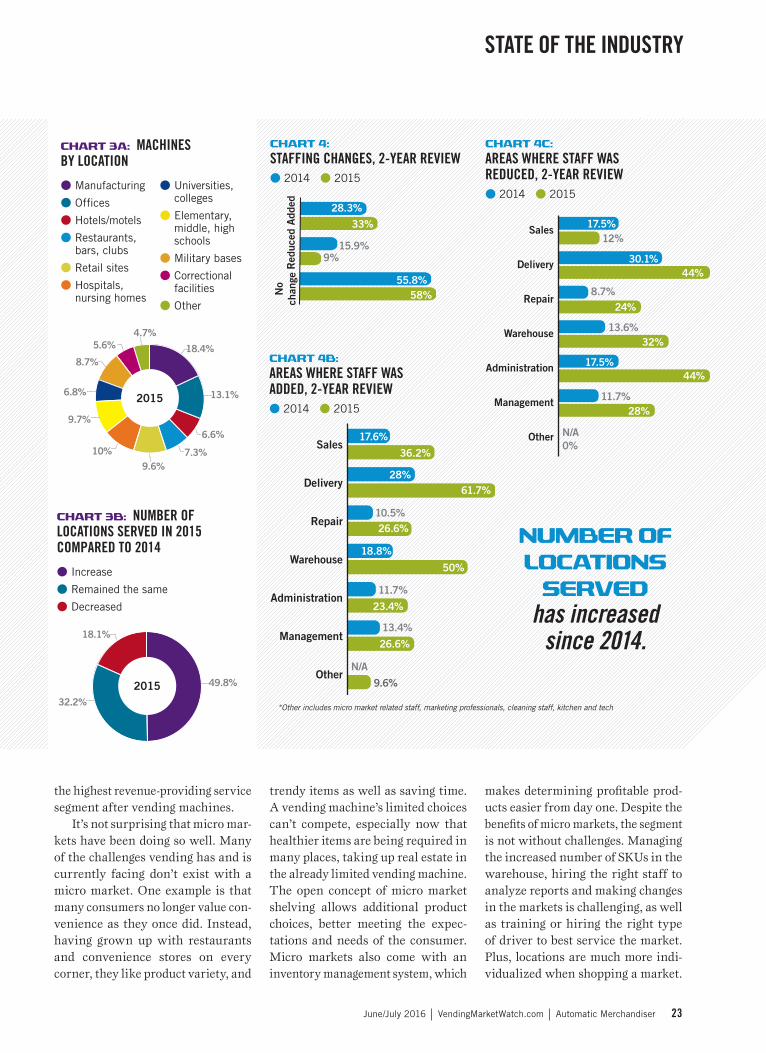
the highest revenue-providing service segment after vending machines.
It’s not surprising that micro mar-kets have been doing so well. Many of the challenges vending has and is currently facing don’t exist with a micro market. One example is that many consumers no longer value con-venience as they once did. Instead, having grown up with restaurants and convenience stores on every corner, they like product variety, and
trendy items as well as saving time. A vending machine’s limited choices can’t compete, especially now that healthier items are being required in many places, taking up real estate in the already limited vending machine. The open concept of micro market shelving allows additional product choices, better meeting the expec-tations and needs of the consumer. Micro markets also come with an inventory management system, which
makes determining profitable prod-ucts easier from day one. Despite the benefits of micro markets, the segment is not without challenges. Managing the increased number of SKUs in the warehouse, hiring the right staff to analyze reports and making changes in the markets is challenging, as well as training or hiring the right type of driver to best service the market. Plus, locations are much more indi-vidualized when shopping a market.
32.2%
18.1%
49.8%
2015
32.2%
49.8%
18.1%
201532.2%
49.8%
18.1%
2015
NumBer of LoCatioNS
Served has increased
since 2014.
*Other includes micro market related staff, marketing professionals, cleaning staff, kitchen and tech
June/July 2016 VendingMarketWatch.com Automatic Merchandiser 23
State of the induStry

stantial increase, despite still only representing 8.7 percent of the total serviced locations. Operators report economies increasing, many slowly, but businesses are hiring, leading to additional services and sales.
Non business and industry sites, such as restaurants, hospitals and correctional facilities have seen more service from operators as well. Even schools, which initially suffered due to the U.S. Department of Agriculture rules about what products could be sold in school vending machines, has rebounded. New products that meet guidelines have been introduced to the vending channel, which has allowed operators to successfully serve this niche. Some of the new products are a result of suppliers no longer keep-ing certain products available only in vending or only in retail channels in a siloed sales model as well as new product entrants. It has resulted in a
Chart 7: segMents where prices were raisedpRoduct 2015candy/snacks/confections 28.4%ocS 8.1ice cream 6.1Sundries/toiletries 2.9Milk 5.5vended food 12.6Bulk vending 1.6Hot beverages 5.2condoms 0.4Bottled water (not single-serve) 3.3Music 0.1cooperative service vending 0.4cigarettes 0.8cold drinks 21.3Manual foodservice 3.0
in 2015, which would support the theory there are a greater number of vending, micro market, and office coffee service customers now, than in 2014. One area that has been added is military bases which showed a sub-
The same product doesn’t work every-where, keeping it from being a one size fits all type of service solution.
acquisitions remain fairly constantWhile the number of operations that divested or acquired business in 2015 shrank a little, the percentages stayed pretty consistent with prior years. Just less than a quarter of operators reported acquiring companies last year (see chart 6). Many of these acquisitions appear to be smaller operations. The percentage of opera-tions making under $1 Million in rev-enue each year dropped by 1 percent in 2015 (see chart 2). Mid-size and large operations grew. The number of extra-large operations declined. Com-ments suggest that pricing challenges among very competitive regions as well as those that are not utilizing technology are struggling.
In 2015 there was a shift in some of the locations operators served. Manufacturing and offices remain very important, but vending opera-tors are diversifying their location mix which makes those percentages shrink due to the total percentage of 100 (chart 3). In actual numbers, it is unlikely these locations are decreas-ing. In chart 3B, nearly half of opera-tors report servicing more locations
Chart 5: strategies fOr handling higher cOsts, 2-year reviewpRoduct 2014* 2015*Raised prices 61.6% 82.4%absorbed extra cost 38.8 56.7eliminated unprofitable account 28.2 44.0Rearranged routes 24.8 37.0Reduced service frequency 22.6 36.6lowered commissions 20.0 28.2Reduced equipment in accounts 13.6 18.3Switched to using more cost-efficient vehicles 7.6 15.5Rearranged job responsibilities 10.2 13.7postponed parts or equipment buys 9.4 13.4Reduced product variety 6.8 9.2Reduced company travel 5.6 6.7postponed equipment repairs 3.8 4.9adjusted compensation/benefits 4.6 3.5* Includes multiple mentions
4.7%6.9%
4.2%3.9%4.3%
14.1%16.9%17.7%
16.1%12.5%
5.9%3.6%4%
3.6%5.4%D
ives
ted
Acq
uire
dB
oth
acqu
ired
and
dive
sted
Nei
ther
acq
uire
dno
r di
vest
ed 75.3%72.7%74.1%74.6%
79.6%
Chart 6: acquired Or divested business, 5-year review ●2011 ●2012 ●2013 ●2014 ●2015
NearLy 3 out of 10
operators raised candy & snack prices.
24 Automatic Merchandiser VendingMarketWatch.com June/July 2016
State of the induStry

greater variety of healthier products available to operators today, although more are still needed with longer shelf lives and broader consumer appeal.
technology combats rising costsThe cost of doing business is ever increasing. The vending industry is
Chart 9B: if yes, which services?pRoduct 2015*ocS 14.6%Water service 12.5Bulk 4.2catering 8.3Manual feeding/cafeterias 5.2delivery of products to locations that are not vending locations
11.5
direct shipping of product via courier to locations
2.1
Retail store 1.0Micro markets 51.0pantry service 14.6other 18.8* Includes multiple mentions
Chart 9a: expanded intO new services, 5-year review●2011 ●2012 ●2013 ●2014 ●2015
31.1%31.4%
23.4%33.1%
66.9%
68.9%68.6%
76.6%
71.1%
28.9%
No
Yes
No
Yes31.1%31.4%
23.4%33.1%
66.9%
68.9%68.6%
76.6%
71.1%
28.9%
Chart 8B: thOse whO reduced prOduct variety, reduced in the fOllOwing areas:pRoduct 2015*candy/snacks/confections 34.4%ocS 3.8ice cream 3.8vended food 7.1Hot beverage 2.7cold drinks 14.8Sundries/toiletries 1.1Bottled water (not single serve) 1.6Milk 1.1condoms 1.1Music 1.6cigarettes 0.6other – fresh pastries, music, condoms, cigarettes
2.2
* Includes multiple mentions
Chart 8a: adJusted prOduct Mix tO reduce deliveries, 5-year review●2011 ●2012 ●2013 ●2014 ●2015
No
Yes
51.8%37.8%
34.3%36.7%35.9%
48.2%62.2%
65.7%63.3%64.1%
No
Yes
51.8%37.8%
34.3%36.7%
35.9%
48.2%62.2%
65.7%63.3%64.1%
64% kept the same product mix in 2015 as the year before.
no exception. Operators have raised prices at a greater level in 2015, than in the previous year, and over half of them have absorbed cost increases as well (see chart 5). Taking better con-trol of the vending business and man-aging it more effectively, is another solution operators are using to handle
the increased cost of doing business. More than a third eliminated unprof-itable accounts, rearranged routes and reduced service frequency. Much of this was done with VMS.
In 2015, operators were asked if they utilized a VMS; 54 percent said yes. When looking at the operators that
June/July 2016 VendingMarketWatch.com Automatic Merchandiser 25
State of the induStry

Chart 10a: technOlOgy upgrades, 2-year cOMparisOn% of machines equipped with the following: 2014 2015credit/debit card & mobile payment readers & telemetry 11% 15%Mobile-onlY (no credit or debit cards) payment n/a <1%video screens n/a <1%QR codes for mobile app n/a <1%
Chart 10C: hOw wOuld yOu rate the fOllOwing technOlOgy On a scale Of 1 (i dOn’t really like it Or use it) tO 5 (great investMent - rOi)
Chart 10B: dO yOu utilize a vending ManageMent systeM Or vMs?●No ●Yes
46% 54%
2015
46% 54%201546% 54%2015
QR code on machine
Cashless payment
Warehouse pick to light system
LED lights
Video screens
Remote monitoring
Prekitting
Vending Management System 3.1
2.9
2.82.0
3.3
2.3
3.6
2.0
Total machine base estimates: 4,518,000 for 2015
reported increased revenues in 2015, the percentage rose to 62.6 percent. For operators that reported a decrease in their revenue for 2015, only 32.1 per-cent used a VMS. Using a system to manage vending data seems to help operators stay in the black. Many commented on technology innova-tions saying “it helped me learn my business better and grow our overall sales within locations” as well as “it has been a huge positive.” Those opera-tors embracing VMS are also looking at other systems such as business intel-ligence software, e-commerce, ware-house picking solutions, customer relation management (CRM) tools and more, suggesting a more modern, innovative future for automated retail.
boost in cashless vendingThe number of vending machines that accept credit and debit cards has hit 15 percent, the highest on record (see chart 10). Not just the percentage, but the actual number of cashless readers has also increased, because in 2015
the approximate number of vending machines dropped to 4.5 million, down from around 5 million, pre-dominantly to the addition of micro markets. Operators adding cashless payment acceptance tend to comment that it has produced a sales lift. It ben-efits the operators’ bottom line, but also increases customer satisfaction.
Many operators use two-tier pric-ing now that it is available, to cover the fees charged for taking credit cards. Despite this movement towards a more cashless vending experience, the majority of vending machines still only accept cash or coins — a statistic that puts the vending industry at a disadvantage compared to its com-petitors for the consumer snack and daytime meal dollar.
While there has been conflicting information about how the Europay,
MasterCard and Visa (EMV) or chip cards will affect vending, this is not a top critical issue for operators, who are working with processors to man-age any fees they have experienced.
Micro markets change the landscapeAt an all-time high were operators reporting micro markets as the pri-mary driver of their positive bottom lines. Yet, the percentage of opera-tors that offer micro markets is less than 50 percent (see Micro Market Breakout). Roughly a third of micro market operators have 50 micro market locations, or less. The aver-age is 13, although that number is misleading. Operators usually try a couple markets, and if the concept works for them, jump into the seg-ment quickly, placing micro markets
miCro marketS was again THE new service to try in 2015.
1 2 3 4 5
26 Automatic Merchandiser VendingMarketWatch.com June/July 2016
State of the induStry

2013
2.9%
33.3%
5.4%
40%
5.1%1.4%
8.6%
2014
35.9%
6.5%
5.2%
37.7%
7.7%
1.9%1%2.9%
1.2%
2015
38%
7.1%
3.8%0.4%
40.4%
7.1%
1.9%
0.2% 1%
40% 33.3%
6.5%5.2%1.2%
37.7% 35.9%
7.7%
1.9%1%2.9%
7.1%3.8%0.2%
40.4% 38%
7.1%
1%0.4%1.9%
2015
2014
2013
8.6%5.1%
1.4%
5.4%
2.9%3.2%
40%
33.3%
6.5%5.2%
1.2%
37.7%
35.9%
7.7%
1.9%
1%
2.9%
7.1%3.8%0.2%
40.4%
38%
7.1%
1%0.4%
1.9%
2015
2014
2013
8.6%
5.1%
1.4%
5.4%
2.9%
3.2%
2013
2.9%
33.3%
5.4%
40%
5.1%1.4%
8.6%
2014
35.9%
6.5%
5.2%
37.7%
7.7%
1.9%1%2.9%
1.2%
2015
38%
7.1%
3.8%0.4%
40.4%
7.1%
1.9%
0.2% 1%
40% 33.3%
6.5%5.2%1.2%
37.7% 35.9%
7.7%
1.9%1%2.9%
7.1%3.8%0.2%
40.4% 38%
7.1%
1%0.4%1.9%
2015
2014
2013
8.6%5.1%
1.4%
5.4%
2.9%3.2%
40%
33.3%
6.5%5.2%
1.2%
37.7%
35.9%
7.7%
1.9%
1%
2.9%
7.1%3.8%0.2%
40.4%
38%
7.1%
1%0.4%
1.9%
2015
2014
2013
8.6%
5.1%
1.4%
5.4%
2.9%
3.2%
Chart 11a: share Of sales by prOduct categOry, 3-year review ●Candy/snacks/
confections●Ice cream
●Sundries
●Milk
● Vended food
●Hot beverages
●Cigarettes
●Cold beverages
●Other
Chart 11B: share Of sales by service categOry, 5-year review 2011 2012 2013 2014 2015
ocS 6.4% 9% 12.8% 13.3% 6.8%Micro markets n/a 1.8 5.11 8.9 10.2Water service 28.4 17.2 11.8 1.9 2.0Manual foodservice 28.4 17.2 11.8 7.6 9.1Bulk vending n/a n/a n/a 2.0 2.3Music n/a n/a n/a 1.1 1.9games n/a n/a n/a 0.8 3.0janitorial supplies n/a n/a n/a 0.1 0.7other n/a n/a n/a 4.2 9.5vending n/a n/a n/a 60.1 54.6
fast. This produces large gaps in the number of micro markets reported, which brought down the average.
There still remains 57.3 percent of operators who are holding out, not willing to take micro markets on as a new service segment. In an attempt to discover how much micro markets are affecting operators’ success, we compared operators who reported a decrease in revenue for 2015 com-pared to 2014 to those that reported
an increase. Of those operators who reported decreased revenue in 2015, 85 percent of them did not offer micro markets. Of those that reported an increase in revenue, only 45 percent did not offer micro markets.
product category reviewCandy/snack/confections and cold beverage segments continue to make up the majority share of revenue for operators. Both saw increases in 2015
in revenue and unit sales (see chart 14). The large variety of cold bever-ages from bottled water to ready-to-drink teas and coffees has helped sales in this category remain strong, but energy drinks did the best of all the cold beverage categories.
candy/snack/confectionsAccording to sales data provided by Cantaloupe Systems and extrapolated for the entire industry, candy did
10.2% of sales revenue is
from micro markets.
June/July 2016 VendingMarketWatch.com Automatic Merchandiser 27
State of the induStry

Micro Market Breakout
MicrO Market segMent is:●Growing ●Staying the same ●Declining
average shrinkage/theft percentage
87.6% 2.3%10.1%
>7%
6%
5%
4%
3%
2%
1%
0% 5%
23%
20%
21%12%
10%
1%
8%
2015
45.1%
15.4%
33%5.5%1.1%1.1%
1.1%
2.2% 11%17.6% 11%
5.5%1.1%1.1%
1.1%
2.2%
33%
45.1%
17.6%15.4%
2015
11%
5.5%
1.1%
1.1%
1.1%
2.2%
33%
45.1%
17.6% 15.4%●Three Square Market
● 365 Retail Markets
●Avanti Markets
●Breakroom Provisions
●Microtronic US
● Smart N Go
●REVIVE
●Company Kitchen
●deOro Markets
●Other
13 Average number of micro markets
57.3%of operators who responded have 0 micro markets.
21.1%have 1-10
33.7%have less than 50
1.5%have more than 500
Customers like the concept. Word of mouth is selling
the markets!It’s become much
more of an employee engagement/
retention tool for our customers vs.
traditional vending.
It is the logical way to increase product variety, sales
and customer satisfaction.
5%
23%
20%
21%
12%
10%
1%
8%
2015 MicrO Market Manufacturer percentage Of Market share
*Total adds up to 133.1% due to
operators using multiple micro market
manufacturers
State of the induStry
28 Automatic Merchandiser VendingMarketWatch.com June/July 2016

MiniMuM lOcatiOn size where a MicrO Market is currently placed:
tOp three MicrO Market challenges:
product management – using data to eliminate stales and adjust to constantly changing consumer preferences, especially finding the time, sourcing products especially in the healthy category
theft management – getting and installing cameras, tracking theft, especially time to watch video
labor – hiring or training drivers to service micro markets, hiring staff to monitor product sales and theft as well as promotions
35.4% 19.5% 8.5%
extRa SMall – undeR 50 eMploYeeS
SMall-MediuM 50 – 200 eMploYeeS
laRge MoRe tHan 200 eMploYeeS
More than 300 employees
250-300 employees
200-250 employees
150-200 employees
100-150 employees
50-100 employees
Less than 50 employees
I don't have a micro market 19.6%
7.2%
28.9%
18.6%
11.3%
7.2%
5.2%
2.1%
More than 300 employees
250-300 employees
200-250 employees
150-200 employees
100-150 employees
50-100 employees
Less than 50 employees 7.2%
28.9%
18.6%
11.3%
7.2%
5.2%
2.1%
87.6% 2.3%10.1%
Expanding-consumer demand and direction industry is headed.
It’s a big investment and there are not as many
locations that would be a good fit.
Great concept. We get pricing plus tax
and deposit.
Limited to locations with room.
June/July 2016 VendingMarketWatch.com Automatic Merchandiser 29
State of the induStry
well, accounting for nearly 28 per-cent in annual revenues (see chart 14). Bagged candy grew the most from 2014, pushing revenues up nearly 33 percent. Chocolate candy and non chocolate candy both saw increases as well, however, the non chocolate category brought in nearly twice the amount of revenue. The only candy category to decline in 2015 was gum and mints, which lost units, if not sales revenue.
For snacks, those categorized as nutritious showed the largest increase, 31.7 percent for revenue. This growth is unsurprising as consumers are mov-ing towards certain types of healthier snacks and alternative options. Nuts and seeds also did well, as did food snacks, both growing more than 20 percent in revenue.
Despite the focus on healthy items, consumers still like indulgences, a fact supported by the revenue growth in
pastry, 19.7 percent, as well as chips 13.9 percent. Bagged snacks grew the least, but still showed a positive move-ment of 2.3 percent for revenue.
cold beverageEnergy drinks grew the most in both revenue and unit sales, according to Cantaloupe data. In both the smaller 12 ounce size as well as the larger 16 to 20 ounce size, the revenue growth was over 27 percent. The next stron-
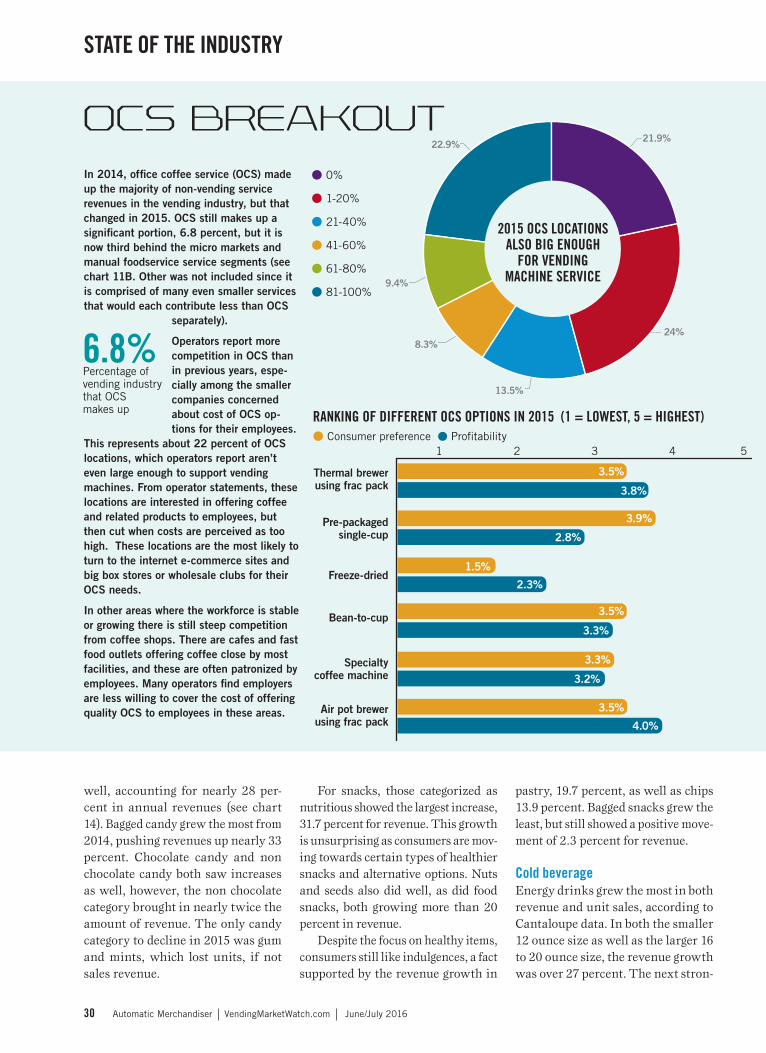
ocS Breakout in 2014, office coffee service (ocS) made up the majority of non-vending service revenues in the vending industry, but that changed in 2015. ocS still makes up a significant portion, 6.8 percent, but it is now third behind the micro markets and manual foodservice service segments (see chart 11B. other was not included since it is comprised of many even smaller services that would each contribute less than ocS
separately).
operators report more competition in ocS than in previous years, espe-cially among the smaller companies concerned about cost of ocS op-tions for their employees.
this represents about 22 percent of ocS locations, which operators report aren’t even large enough to support vending machines. from operator statements, these locations are interested in offering coffee and related products to employees, but then cut when costs are perceived as too high. these locations are the most likely to turn to the internet e-commerce sites and big box stores or wholesale clubs for their ocS needs.
in other areas where the workforce is stable or growing there is still steep competition from coffee shops. there are cafes and fast food outlets offering coffee close by most facilities, and these are often patronized by employees. Many operators find employers are less willing to cover the cost of offering quality ocS to employees in these areas.
3.5%
3.9%
1.5%
3.5%
3.3%
3.5%
3.8%
2.8%
2.3%
3.3%
3.2%
4.0%
24%
13.5%
8.3%
9.4%
22.9%21.9%
6.8% Percentage of vending industry that OCS makes up
● 0%
● 1-20%
● 21-40%
● 41-60%
● 61-80%
● 81-100%
2015 Ocs lOcatiOns alsO big enOugh
fOr vending Machine service
3.5%
3.9%
1.5%
3.5%
3.3%
3.5%
3.8%
2.8%
2.3%
3.3%
3.2%
4.0%
24%
13.5%
8.3%
9.4%
22.9%21.9%
ranking Of different Ocs OptiOns in 2015 (1 = lOwest, 5 = highest)● Consumer preference ● Profitability
1 2 3 4 5
pre-packaged single-cup
thermal brewer using frac pack
freeze-dried
Bean-to-cup
Specialty coffee machine
air pot brewer using frac pack
30 Automatic Merchandiser VendingMarketWatch.com June/July 2016
State of the induStry

gest cold beverage category was large non-carbonated drinks. This would include ready-to-drink iced teas, cof-fees, water and flavored waters.
These are similar to trends seen in the U.S. Liquid Refreshment Report released by Beverage Marketing Cor-poration. Bottled water has had an especially notable year, with volume growing by 7.9 percent. Carbonated soft drinks remain on the decline across all retail segments according to the Beverage Marketing Corporation, but this is not the case in the vend-ing industry, which saw that segment increase between 10 to 13 percent in revenues compared to the prior year.
Milk sales remain low in vend-ing machines with 47.5 percent of operators reporting that in 2015 they didn’t even offer milk. Of those that did offer milk, nearly 12 percent of operators reported increasing milk sales in 2015, which was higher than the 8.8 percent that decreased milk sales. The rest, about 31.9 percent, reported no change.
Operators diversifyIn 2015, operators continued their trend of offering additional services, beyond traditional workplace refresh-ment. More than 9 percent are uti-lizing their staff, product inventory, logistics or other business acumen to expand their businesses (11B). Opera-tors report supplying repair services for vending equipment or coffee brewers, acting as a distributor for certain brands, catering, wholesaling and subsidized product delivery via free vend vending machines among the other services contributing to their annual revenues.
challenges: preferences, hiring A primary challenge for operators is the very individualized preferences of consumers. Operators report a lack of appreciation for the service they provide. Consumers today overlook convenience, traveling to competi-
2015
36.3%
5%
6.1%
15.8%
3.5%
33.2%33.2%
6.1% 36.3%
3.5%15.8%
5%
2015
33.2%
6.1%36.3%
3.5%15.8%
5%
2015
33.2%
6.1%36.3%
3.5%
15.8%
5%
2015
Chart 13: percentage Of each type that Makes up placed vending Machines● Cold beverage
● Hot beverage
● Snack
● Food
● Combo
● Frozen only
Chart 12: prOJected sales by categOry, 5-year review in billiOns
pRoductS 2011 2012 2013* 2014 2015 % CHANGEcandy/snacks/confections
$5.57B $5.22B $6.56B $7.24B $8.0B 10%
ice cream/frozen 0.42 0.59 0.63 0.59 0.4 -32Sundries/toiletries na na na 0.20 0.1 -61Milk 0.34 0.49 0.57 0.39 0.2 -48vend food 1.14 1.38 1.69 1.30 1.5 14Hot beverages 0.98 0.89 1.00 1.05 0.8 -24cigarettes 0.11 0.33 0.28 0.25 0.0 -84cold beverages 8.23 7.34 7.88 7.61 8.4 11other 0.47 0.94 0.91 1.55 1.5 -4
SeRviceS 2011 2012 2013* 2014 2015 % CHANGEocS 1.70 2.14 2.52 2.68 1.4 -47Micro markets n/a 0.35 1.01 1.79 2.1 19Water service n/a n/a n/a n/a 0.4 6Manual foodservice 5.38 3.33 2.32 1.53 1.9 24Bulk vending 0.40 0.5 19Music 0.22 0.4 79games 0.16 0.6 293janitorial supplies 0.02 0.1 765other 1.55 2.0 22.5vending 12.12 11.4 -6* Numbers adjusted based on revised Chart 11
other services are contributing $2 billion to the
annual industry revenue.
June/July 2016 VendingMarketWatch.com Automatic Merchandiser 31
State of the induStry

tors to get the exact flavor or type of product they want. Customer loyalty is low to service, but exceptionally high to the product.
Micro markets certainly alleviate some of these challenges, but it’s not a realistic option for many locations. Operators are trying to figure out how to provide the same level of product customization for vending customers using VMS data as well as better com-municate with consumers. Operators are trying QR codes, mobile apps, video screens, social media and loy-alty cards that work at a vending machine to engage the consumer in a more positive way.
Another difficulty operators are reporting is finding and retaining ded-icated employees. Across the foodser-vice industry, especially restaurants, companies are feeling the squeeze of not having enough quality employees. Specifically in vending, micro market and OCS, operators talked about the difficulty in finding and keeping good route drivers as one of their top con-cerns. Hiring the correct employees to deal with new micro market business was a close second.
For most operators, vending is a core business that is relatively flat. Many revenue increases in vend-ing have been a result of better cost control and eliminating unprofitable locations and products, all through technology. This has moved VMS and similar business management solu-tions from good-to-have to must-have. The strongest segment in 2015 was micro markets, which represented a record percent of revenue compared to other services offered. Micro mar-kets are poised for continued growth for the foreseeable future, furthering the gap between operators that do offer it and those that don’t. As for new segments, operators are diver-sifying into many different areas, expanding offerings and the types of locations they service, all of which will continue into 2016.
Chart 14: candy/snack/cOnfectiOn Machine estiMate tOtals by categOry and subcategOry
% SaleS cHangeS 20152015
Revenue% SaleS of
totalRevenue cHange unit cHange
candY $2.2B 27.8% 10.6% 8.1%chocolate 1.4B 2.8 7.6 5.0non-chocolate 550.1M 3.9 16.7 15.7Bag candies 42.0M 0.1 32.9 19.6gum & mints 157.0M 0.3 7.3 -1.5
SnackS $5.7B 72.2% 15.3% 12.3%Bagged snacks 95.9M 1.2 2.3 2.7wafers, cookies, nuts, brownies, pretzels, fruit clusters, bagged gum, yogurt bites
chips 2.8B 35.3 13.9 11.4cookies & crackers 849.2M 10.7 6.2 4.1food snacks 87.7M 1.1 27.7 24.9cheese sticks, meat sticks, meat bites,
nutritious snacks 386.6M 4.9 31.7 26.4Bean chips, granola, fruit snacks, organic items, specialty crackers/pastries/cookies, dark chocolate, bars, dried fruit, hummus
nuts and seeds 205.3M 2.6 20.0 13.3pastry 1.3B 16.4 19.7 18.3cupcakes, coffee cake, pies, honey buns, brownies, doughnut, muffins, danish, pastries
dRinkS $8.4B 39.8% 15.9% 11.2%energy drinks 374.5M 4.5 27.4 27.5non-carbonated, 12oz 63.4M 0.8 14.3 12.9
Soda, 12oz 1.8B 21.9 10.6 4.7energy drinks, 16-20oz
135.6M 1.6 27.8 25.7
non-carbonated, 16-20oz
1.5B 18.1 25.4 22.7
Soda, 16-20oz 4.5B 53.2 13.5 10.1Source: Extrapolated from data courtesy of Cantaloupe Systems, Inc.
Methodology
the Automatic Merchandiser State of the vending industry Report is compiled from a survey sent to vending operators in Spring as well as operator interviews. the 2016 report is based on nearly 400 responses to the survey, close to a 4 percent response rate, and includes full-service as well as small-size snack and soda operators.
NutritiouS SNaCkS showed substantial gains in both
revenues and sales in 2015.
32 Automatic Merchandiser VendingMarketWatch.com June/July 2016
State of the induStry