micro-enterprises survey, 2000 - progress report
TRANSCRIPT

MICRO-ENTERPRISES SURVEY, 2000
A Progress Report
Small Business Policy Branch
Industry Canada
June 7, 2001

i
MICRO-ENTERPRISE SURVEY, 2000A Progress Report
TABLE OF CONTENTS
Page
List of Figures......................................................................................................…...iii
List of Tables...............................................................................................................iv
1. Introduction.............................................................................................................1
2. Data Collection........................................................................................................2
3. Owner Characteristics............................................................................................53.1. Gender....................................................................................................…53.2. Age (A5)......................................................................................…............63.3. Education (A10)...................................................................................…...8
3.4. Immigrant or Canadian Born (A6, A7).................................................….. 83.5. Source of Income (A8, A9, B12, B13)........................................................83.6. Willingness to Take Risk...........................................................................103.7. Motivation to Create a Micro-Enterprise (C1)...........................................103.8. Family Experience in Operating a Micro-Enterprise (A18).......................10
4. Business Characteristics.........................................................................................114.1. Longevity of the Firm (B1)........................................................................114.2. Legal Form (B2).........................................................................................124.3. Home-Based Micro-Enterprises (B6).........................................................134.4. Stage of Development (C4)........................................................................144.5. Sales Growth (D1, D2)...............................................................................144.6. Plans to Expand the Business (C5, C6, C7)...............................................154.7. Business Ownership (B8)...........................................................................184.8. How was the Business Created? (B9)........................................................19

ii
5. Business Operation Characteristics.......................................................................205.1.Market Focus (D6)..................................................................................….205.2. Division of Labour (C11)............................................................................215.3. Training Requirements (C8, C9).................................................................235.4. Sources of Business Advice (C10)..............................................................245.5. Sources of Business Financing (D10).........................................................255.6. Business Technologies (D12).....................................................................255.7. Success Factors (D9)..................................................................................26
6. Next Steps.............................................................................................................…28
References.................................................................................................................…29
Appendix-Questionnaire

iii
LIST OF FIGURES
Page
Figure 1. Distribution of Gender by Sector..................................................................................5
Figure 2. Distribution of Micro-Enterprise Operators by Age.....................................................6
Figure 3. Distribution of Age of Operators by Sector..................................................................7
Figure 4. Percentage of Operators where the Micro-Enterprise is either the Only or the Most Important Source of Income for the Household, bySector................................................................................................................................9
Figure 5. Distribution of Longevity of Firms by Sector..............................................................11
Figure 6. Percentage of Provincially & Federally Incorporated Firms, by Sector......................12
Figure 7. Distribution of Home-Based Businesses by Sector......................................................13
Figure 8. Percentage of Firms with a Maximum Continuous Growth overa 4-Year Period................................................................................................................15
Figure 9. Reasons for no Plans of Expansion..............................................................................16
Figure 10. Percentage of Firms with an Expansion Strategy.......................................................17
Figure 11. Percentage of Micro-Enterprises by Ownership Category & by Sector.....................18
Figure 12. Percentage of Firms with Markets Concentrated in the Same Community................20
Figure 13. Percentage of Business Functions Performed by: the Respondent, Employees,or not Performed at the Micro-Enterprise .......................................................................22
Figure 14. Percentage of Respondents who Stated that They RequireTraining and, When Applicable, that their Employees Require Trainingin Particular Skills............................................................................................................23
Figure 15. Percentage of Times the Source of Business Advice is Selected...............................24
Figure 16. Percentage of Firms that Used Sources of Business Financing..................................25
iv
Page
Figure 17. Percentage of Firms Using Business Technologies....................................................26
Figure 18. Factors of Success...................................................................................................…27
LIST OF TABLES
Page
Table 1. Distribution of Responses by Industry and Region,and their 95% Confidence Interval....................................................................................4

1
MICRO-ENTERPRISES SURVEY, 2000
1. Introduction
In 1998, Statistics Canada’s Business Register counted 592,981 enterprises with 1 to 4
employees. These are here called micro-enterprises. They accounted for 77% of all employer
firms in Canada. As such, micro-enterprises have significant potential to stimulate economic
growth. However, evidence on the survival, growth and development of micro-enterprises is
inconclusive.
Micro-enterprises represent the earliest stage of business development -- a stage where
the owner-founder is typically also the manager of the firm. At this stage, the management
decisions of the founder or entrepreneur, her/his intentions about the business, and his
background and aspirations are intrinsically linked with the success of the business itself.
Survival and growth is a particular challenge for micro-enterprises, more so than for
larger firms. A recent study indicated that only 1.07% of firms with fewer than 10 employees
will grow to the next size category within a decade while only 0.02% will grow to more than
100 employees (Brander et al, 1998). In comparison, 11%-12.5% of firms with more than 10
employees will grow to the next size category within the same period.
In order to improve our understanding of the factors which motivate the entrepreneur -
the owner-founder of a micro-enterprise - to expand his or her business, in the Summer of
2000, Industry Canada’s Small Business Policy Branch (SBPB), in cooperation with the Small
Business and Special Surveys Division (SBSSD) of Statistics Canada, designed a

2
questionnaire and implemented a survey of micro-enterprises. The objective of the survey was
to establish a baseline understanding of factors affecting micro-enterprise growth by profiling
both the owners’ and the firms’ characteristics.
In due course, on-going policy research focusing on micro-enterprises will enable
SBPB to develop appropriate and effective policy responses that are likely to improve the
capacity of micro-enterprises to grow and to create sustainable jobs in the global knowledge
economy.
This paper presents background on the data collection and coverage of the Micro-
Enterprises Survey 2000 and it highlights key results under three headings:
• Owner-Manager Characteristics
• Business Characteristics
• Operating Characteristics
The next phase of analysis will use an econometric model to explore the determinants of
growth of these micro-enterprises.
2. Data Collection
Between June 9 and August 25, 2000, Statistics Canada conducted a survey of 1,505
micro-enterprises across the country, using a Computer Assisted Telephone Interview (CATI)
system. The survey was administered to the majority owner/manager of the firm. The target
population consisted of businesses operating in Canada with one to four employees in 1995
and still in operation 4 years later. The survey sample consisted of firms in the following
industries: construction, finance and real estate, accommodation and other services,

3
agriculture, business services, health and social services, and retail trade. Non-profit
organizations and government offices in these sectors were excluded from the sample.
The sample was stratified such that results can be compared for businesses in different
industrial sectors and regions. The number of firms in each industry, with the applicable 1980
Standard Industrial Classification, and the number of respondents in each region are provided
in Table 1. The table also displays the associated confidence intervals.
Excluding businesses that were found to be inoperative, an overall response rate of 53%
was obtained. The response rate was particularly low in the Health and Social services sector,
at 24%; without that sector, the overall response rate would have been 59%.
Overall survey results are accurate to 3.6 percentage points (95% confidence interval).
The margin of error for the industry results ranges between 8.0% and 15.3%; by region, the
95% confidence interval ranges between 6.9% and 9.6%.

4
Table 1. Distribution of responses by industry and region, and their 95% confidence interval
A. By Industrial Sector
Industrial Sector SIC 80 Classification Number of Firms 95% ConfidenceInterval
Agriculture A01-A02 284 8.1 p.p.
Construction F40-F44 259 8.5 p.p.
Retail Trade J60-J69 243 8.0 p.p.
Finance andInsurance
K70-L76 174 11.0 p.p.
Business Services M77 231 8.3 p.p.
Health & SocialServices
P86 103 15.3 p.p.
Accommodation andOther Services
Q91 -R99 211 9.1 p.p.
Total: 1,505
B. By Region
Region Number of Firms 95% ConfidenceInterval
Atlantic 248 8.5 p.p.
Quebec 319 6.9 p.p.
Ontario 321 7.4 p.p.
Manitoba,Saskatchewan,NorthwestTerritories, Nunavut
209 9.0 p.p.
Alberta 220 8.5 p.p.
British Columbia,Yukon
188 9.6 p.p.
Total: 1,505

5
Figure 1. Distribution of Gender by Sector
0
10
20
30
40
50
60
70
80
90
100
Agricu
lture
Constr
uctio
n
Retail
Trade
Financ
e & In
suran
ce
Busin
ess S
ervice
s
Health
& S
ocial
Serv
ices
Accom
odati
on &
Othe
r Serv
ices
Per
cen
tage
of
Gen
der
Female
Male
The following sections present highlights of the survey results, including sectoral and
regional detail in so far as significant differences turned up. The question number(s) on which
the section reports is indicated in brackets next to the title. The full text of the questionnaire is in
an attachment.
3. Owner Characteristics
3.1. Gender (A4)
On average, micro-enterprises are more likely to be owned by males (77%) than females
(23%). Female participation is lowest in Business Services (13%) and Construction (15%),
highest in Accommodation and Other Services (41 % ) (Figure 1).

6
Figure 2. Distribution of Micro-Enterprise Operators by Age
2%
15%
28%
17%
38%
0%
5%
10%
15%
20%
25%
30%
35%
40%
<30 Years Old 30-39 Years Old 40-49 Years Old 50-59 Years Old >60 Years Old
3.2. Age (A5)
Few micro-enterprise owners/operators are under 30 (2%). The most common age is
40-49 (38%) and those aged 50-59 and over 60 are also well represented, with 28% and 17%
respectively (Figure 2).
The 40-49 age group is most common in all sectors except in Health and Social Services
and Finance and Insurance, where the 50-59 group dominates. Construction is notable in having
a sharp drop-off in age after 40-49 (Figure 3).

7
Figure 3. Distribution of Age of Operators by Sector
0
10
20
30
40
50
60
Agricu
lture
Constr
uctio
n
Retail
Trade
Financ
e & In
suran
ce
Busine
ss Serv
ices
Health
& S
ocial
Serv
ices
Accom
odati
on &
Othe
r Serv
ices
Per
cen
tag
e o
f O
per
ato
rs
<30 Years Old
30-39 Years Old
40-49 Years Old
50-59 Years Old
>60 Years Old

8
3.3 Education (A10)
Forty four percent of the micro-enterprise owners have a post secondary education.
Owners in Business Services and Finance and Insurance have the highest percentage of business
owners with a post-secondary education, 76% and 66% respectively.
3.4. Immigrant or Canadian Born (A6, A7)
About 19% of micro-enterprise owners are not born in Canada. In Quebec,
Manitoba/Saskatchewan and the Atlantic region less than 10% of the entrepreneurs are
immigrants. In contrast, in Ontario, Alberta and British Columbia the percentage is 30%.
At the time of the interview, approximately half of the immigrant entrepreneurs (48%)
had been in Canada for thirty years and more. Most of the immigrants in this category are
engaged in Business Services or Finance and Insurance.
A mere 3% of the micro-firm owners immigrated to Canada less than ten years ago, and
22% immigrated between 1981 and 1990. Most of the immigrants in the latter category are in
Accommodation and Other Services or Retail Trade.
3.5. Source of Income (A8, A9, B12, B13)
The micro-firm is the sole source of income for 54% of the respondents and the most
important source of income for another 26%. The rest of the operators (20%) do not consider the
business as their most important source of income.
Agriculture and Retail Trade have the highest proportion of operators who rely solely on
the business as a source of income, at 69% and 60% respectively. Business Services and

9
Figure 4. Percentage of Operators where the Micro-Enterprise is either the Only or the Most Important Source of Income for the
Household, by Sector
0
10
20
30
40
50
60
70
80
90
100
Agricu
lture
Constr
uctio
n
Retail
Trade
Financ
e & In
suran
ce
Busine
ss Serv
ices
Health
& S
ocial
Serv
ices
Accom
odati
on &
Othe
r Serv
ices
Only Source of Income Most Important Source of Income
Finance and Insurance have the lowest proportion of such operators (Figure 4).
Consistent with these results, less than 20% of the micro-enterprise owners are employed
by another business or are majority owners of other businesses.

10
3.6. Willingness to Take Risk (C3)
Thirty percent of the micro-firm owners said they were prepared to risk major personal
assets to make the business grow. Only 21% of the owners/managers in Business Services said
they would risk major personal assets, compared to 37% of the owners/managers in Agriculture.
3.7. Motivation to Create a Micro-Enterprise (C1)
Almost 1 in 2 of the micro-firm owners started their business primarily to be their own
boss. The results are approximately the same across industries, ranging from 40% for
Accommodation and Other Services and Business Services, to 55% for the construction industry.
This response is also fairly consistent across regions, ranging from 38% for Atlantic Canada to
50% for Quebec.
3.8 Family Experience in Operating a Micro-Enterprise (A18)
During their childhood years, 49% of micro-enterprise owners had a close relative, such
as a parent or sibling, who owned a business. The proportion was highest in Agriculture (84%).
By region, 70% of the entrepreneurs from the Manitoba/Saskatchewan region answered that a
close family relative owned a business during their childhood years, compared to 39% in the
Atlantic region.

11
Figure 5. Distribution of Longevity of Firms by Sector
0
10
20
30
40
50
60
70
80
Agricu
lture
Constr
uctio
n
Retail
Trade
Financ
e & In
suran
ce
Busine
ss Serv
ices
Health
& S
ocial
Serv
ices
Accom
odati
on &
Othe
r Serv
ices
<7 Years Old 7-15 Years Old >15 Years Old
4. Business Characteristics
4.1. Longevity of the Firm (B1)
Only 13% of the surveyed micro-enterprises had been in operation less than 7 years, 41%
had been in operation 7 to 15 years, and 46% more than 15 years.
Retail Trade and Accommodation and Other Services have the higher concentration of
young businesses (<7years old), at 23% and 14% respectively, while Agriculture, Finance and
Insurance and Health and Social Services have a relatively higher proportion of businesses with
longer tenure of operation(>15 years) at 71%, 57%, and 56%, respectively (Figure 5).

12
Figure 6. Percentage of Provincially and Federally Incorporated Firms, by Sector
0
10
20
30
40
50
60
70
80
90
Agriculture Construction Retail Trade Finance &Insurance
BusinessServices
Health &Social
Services
Accomodation& OtherServices
% o
f F
irm
s In
corp
ora
ted
Federally Incorporated Provincially Incorporated
4.2. Legal Form (B2)
In total, 58% of the micro firms are incorporated; of these, about one-fifth are federally
incorporated (Figure 6). The Health and Social Services sector and the Agriculture sector have
significantly low proportions of incorporated firms, 32% and 43% respectively, while in the
Finance and Insurance sector, 83% of the firms are incorporated.

13
Figure 7. Distribution of Home-Based Businesses by Sector
33%
24%
47%
36%
15%
74%81%
0
10
20
30
40
50
60
70
80
90
Agricu
lture
Constr
uctio
n
Retail
Trade
Financ
e & In
sura
nce
Busine
ss Serv
ices
Health
& S
ocial
Serv
ices
Accom
odati
on &
Othe
r Serv
ices
4.3. Home-Based Micro-Enterprises (B6)
Overall, 46% of the micro-enterprises are home-based. The proportion is highest in
Agriculture and Construction, 81% and 74% respectively. The likelihood that a business is
home-based is the lowest in Retail Trade and in Health and Social Services (Figure 7).
By region, Manitoba/Saskatchewan has the highest percentage of home based businesses
(61%) while Ontario is lowest at 38%.
14
4.4. Stage of Development (C4)
The questionnaire defined the various stages of development in a micro-enterprise and
asked respondents at what stage their company was at present. The early start-up stage was
defined as where the business is relatively young and is engaged in product development with
anticipated sales, some time in the future. A late stage start-up was said to be one where bringing
the product to market is near, and where there are some initial confirmed sales. In the survival
stage, the business is established but still not profitable. In the growth stage, the company has an
established market and is expanding. Finally, in its mature stage, there is a high degree of
stability in the firm’s market.
Almost 40% of micro-enterprises were at the mature stage at the time the survey was
conducted. Another 37% were in the growth stage. Twenty-two percent said they were in the
survival stage; this is the only stage response group where there are significant differences
between sectors: Accommodation, 33% said to be in the survival stage, compared to 9% in
Finance and Insurance.
There were too few responses in the early and late stage start-up stage to permit
distinguishing between them. In total only 3% were found to be in a start-up stage.
4.5. Sales Growth (D1, D2)
Ten percent of the firms had seen sales double or more over a 4-year period. On the other
hand, 43% saw sales grow by 20% or less and 9% had declining sales (Figure 8).
By sector, Business Services has the highest percentage of micro firms (22%) with more
than 100% sales growth over a 4-year period.

15
Figure 8. Percentage of Firms with a Maximum Continuous Growth over a 4-year Period
4%6%
14%
24%
43%
9%
0
5
10
15
20
25
30
35
40
45
50
Decreased 0%-19.99% 20%-49.99% 50%-99.99% 100%-199.99% >200%
Maximum Sales Growth over a 4-Year Period
As to sales growth expectations, 1% of the owners expected their sales to grow more than
200% over the next four years and another 7% foresaw sales growth between 100% and 200%.
Most respondents (58%) expected a sales growth between zero and less than 20%. Seven percent
of the firms expected their sales growth to decrease over the next four years.
4.6. Plans to Expand the Business (C5, C6, C7)
Thirty four percent of the micro-enterprises are planning to expand in the next two years.
The results across sectors are very similar, hovering around the national average. By region, 39%
of the owners in Ontario are planning to expand in the next two years compared to 25% in the

16
Figure 9. Reasons for No Plans of Expansion
22%
25%
26%
27%
30%
30%
49%
Lack of Growth Capital
Taxes will Become too High
Risk too High
To Avoid Loss of Control over Business
Other
Market not Growing
Content with the Way Things Are
Atlantic region.
Of the 66% of owners who had no expansion plans in the next two years, about one-half
said this was because they were content with the way things were. “Lack of Growth Capital” was
the least selected reason (Figure 9).

17
Figure 10. Percentage of Firms with an Expansion Strategy
14%
27%
42%
44%
45%
51%
55%
56%
66%
67%
74%
Seek New International Markets
Selling over the Internet
Seeking Professional Advice
Seeking Additional Financing
Expanding Advertising/Promotion
Upgrading Operations/Computer Systems
Adding New Product/Serv.
Seek New Domestic Markets
Hiring Employees
Adding New Equipment/Operating Space
Improving Existing Product/Serv.
As to the micro-enterprises with plans to expand, the most selected expansion strategy is
“improving existing products or services”, selected by 74% of the respondents. The least
selected methods of expansion were “seeking new international markets” and “selling over the
Internet”, selected, respectively, 14% and 27% of the times (Figure 10).
18
Figure 11. Percentage of Micro-Enterprises by Ownership Category and by Sector
0
10
20
30
40
50
60
70
80
Agricu
lture
Constr
uctio
n
Retail
Tra
de
Financ
e & In
sura
nce
Busine
ss S
ervic
es
Health
& S
ocial
Ser
vices
Accom
odat
ion &
Oth
er S
ervic
es
100% Ow ned 50.5%-99.9% Ow ned 50.0%-50.49% Ow ned <50% Ow ned
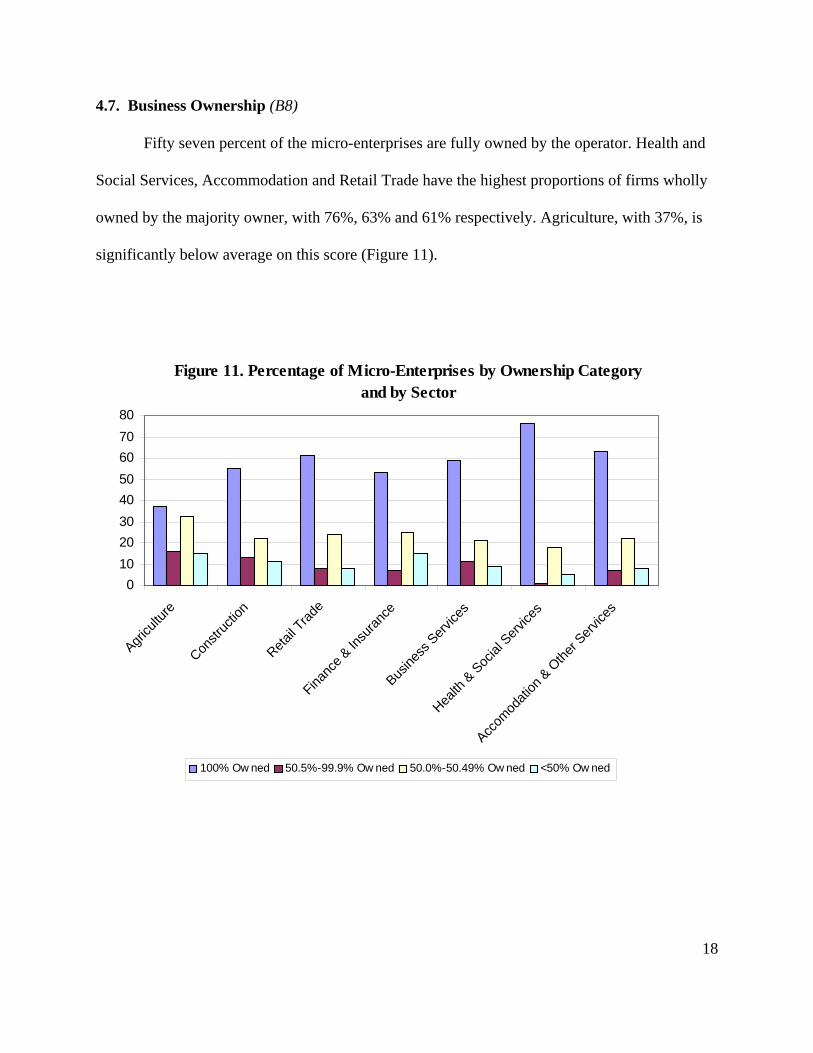
4.7. Business Ownership (B8)
Fifty seven percent of the micro-enterprises are fully owned by the operator. Health and
Social Services, Accommodation and Retail Trade have the highest proportions of firms wholly
owned by the majority owner, with 76%, 63% and 61% respectively. Agriculture, with 37%, is
significantly below average on this score (Figure 11).

19
4.8. How was the Business Created? (B9, B10, B11)
Sixty seven percent of these businesses had been started from scratch by the current
owner. A further 24% said they bought the business from someone else. This result is consistent
across industries, with the exception of the agricultural sector, where 23% said their business
was a family inheritance. By region, 17% of the businesses in Manitoba/Saskatchewan were
inherited from family members compared to only 2% in Alberta.
It is worthwhile noting that 52% of the micro-enterprise owners who did not start their
businesses from scratch had a previous relationship with the business, mainly as employees.

20
Figure 12. Percentage of Firms with Markets Concentrated in the Same Community
0
10
20
30
40
50
60
70
80
0%-19.99% 20%-39.99% 40%-59.99% >60%
Percentage of Firms' Market in the same Community
5. Business Operation Characteristics
5.1. Market Focus (D6)
Micro-enterprises are focussed on the local market. 73% of the firms have over 60% of
their market concentrated in the local community; Only 16% of the firms depend on the local
market for less than 20% of their business (Figure 12).
The main sectors with less than 20% of their market concentrated in local communities
are Agriculture and Business Services. Agriculture with such a non-local focus is mainly found
in Manitoba/Saskatchewan, while in Business Services, the main concentration of such firms is
in Ontario.

21
The outlook for future market growth in different geographic area is one of net growth.
Forty five percent of the micro-enterprise owners believe that their market percentage in the
local community will increase, 14% believe it will decrease, and 41% believe it will remain the
same. For markets outside the local community, the majority of the micro-enterprise owners
believe that their market percentage will remain the same but on the whole the perception is of
net growth.
In the Local market, Agriculture is the main sector that foresees no market growth, while
Business Services anticipates a net market growth. In the International market, the United States
and the Rest of the World, Business Services again is the main sector that foresees net market
growth while Finance and Insurance anticipates a market decline.
5.2. Division of Labour (C11)
Business functions at the micro-enterprise are mostly conducted by the owner/manager of
the firm (Figure 13). More than 50% of the operators stated that they perform each of the
following business functions: marketing (72%), product development (54%), production
operations (59%), financial operations (74%), planning, control and evaluation (84%),
innovation/technology (56%), personnel and administrative operations (77%) and day to day
operations (80%).

22
Figure 13. Percentage of Business Functions Performed by : the Respondent, Employees, Contractors or Not Performed at
the Micro-Enterprise
0
10
20
30
40
50
60
70
80
90
Mar
ketin
g
Produ
ct Dev
elopm
ent
Produ
ction
Ope
ratio
ns
Financ
ial O
pera
tions
Plannin
g, C
ontro
l & E
valua
tion
Inno
vatio
n/Tec
hnolo
gy
Perso
nnel
& Adm
inistr
ative
Ope
ratio
ns
Day to
Day
Ope
ratio
ns
Respondent Employees Contractors Not Performed

23
Figure 14. Percent of Respondents Who Stated that They Require Training and, when applicable, that their Employees Requiring
Training in Particular Skills
17%
20%
22%
23%
24%
28%
34%
13%
16%
22%
17%
10%
22%
31%
Human ResourceManagement
Spreadsheet Software
Accounting Software
Database Software
Other
Marketing Skills
Using the Internet
Respondents
Employees
5.3. Training Requirements (C8, C9)
The training mostly required by the respondents is in Internet usage. Thirty one percent
of the employers stated that they require training in this skill. Marketing skills comes in second
place with 22%.
Fifty one percent of the respondents stated that their employees require training. Thirty
four percent of these respondents stated that their employees require training in Internet usage
and 28% in marketing skills (Figure 14). Finance and Insurance and Business Services most
strongly indicated the need of their employees to be trained in Internet usage, marketing skills,
and database software.

24
Figure 15. Percentage of Times the Source of Business Advice is Selected
6%
8%
15%
20%
21%
24%
31%
34%
34%
40%
61%
Board of Directors
Government
Consultants
Business/Industry Assoc.
Lawyers
Financial Institutions
Suppliers
Family
Customers
Mentors/Friends/Associates
Accountant
5.4. Sources of Business Advice (C10)
Significant business advice was most often sought from accountants, selected by 61% of
the respondents. Least commonly sought out for advice were the government and the firm’s
Board of Directors (Figure 15).

25
Figure 16. Percentage of Firms that Used Sources of Business Financing
2%
5%
5%
11%
20%
70%
78%
Venture Capitalists
Other Sources
Private Individuals
Small Business Loans Act
Friends/Relatives
Own Savings
Banks/Trust Co./Credit Unions
5.5. Sources of Business Financing (D10)
Micro-firm owners tend to rely mostly on banks, trust companies and credit unions and
on their own savings to finance their business. Venture capitalists were the least selected as a
source of financing (Figure 16).
5.6. Business Technologies (D12)
The fax machine, personal computer and telephone messaging are the most regularly
used business technologies (Figure 17).

26
Figure 17. Percentage of Firms Using Business Technologies
9%
14%
17%
20%
34%
39%
59%
65%
72%
Call Centers
Business Website
Network Computer
Supplier Website
Internet Provider
Telephone Messaging Serv.
Personal Computer
Fax Machine
5.7. Factors of Success (D9)
More than 50% of the surveyed entrepreneurs said that each of the following factors are
vitally important in determining whether or not the business succeeds: Business skills of
employees (76%), management skills (63%), skills in using technology (61%), favourable
market conditions (80%), clear vision for the business (76%), luck (51%), planning (78%),
family/moral support (75%), good working relationships with business partners (78%), access to
financing (69%), location (67%) and favourable tax and regulatory environment (80%) (Figure
18).

27
Figure 18 . Factors of Success
51%
61%
63%
67%
69%
75%
76%
76%
78%
78%
80%
80%
Luck
Skills in Using Technology
Management Skills
Location
Access to Financing
Family/Moral Support
Business Skills of Employees
Clear Vision for the Business
Planning
Good Relationship with Business Partners
Regulatory Environment
Favorable Market Conditions

28
6. Next Steps
The literature on firm-level determinants of growth is rich and covers a wide spectrum of
issues, such as the importance of firms’ demographics or the impact of the beliefs, attitudes and
perceptions of the firm’s top management. Most previous studies of firm growth focus on the
manufacturing sector and large firms. This study focuses on micro-enterprises in sectors like
business services and retail trade.
The literature offers at least two theories for the growth of a firm: Gibrat’s law and
Jovanovic’s model. Gibrat’s law asserts that the probability of a proportionate increase in firm
size over an interval in time is the same for all firms, regardless of their size at the beginning of
the interval. Jovanovic’s model predicts disproportionate growth across firms on the basis of age,
positing an inverse relationship between firm age and growth.
As a next step, the study will investigate the relationship between firm-level employment
growth and firm age and other factors such as whether the establishment is incorporated or not
and the characteristics of the owner.

29
References:
Brander et al. 1998. “The Engine of Growth Hypothesis: On the Relationship between Firm Sizeand Employment Growth.” University of British Columbia.
Evans, D. “The Relationship between Firm Growth, Size and Age: Estimates for 100Manufacturing Industries.” Journal of Industrial Economics. Vol. 35(1987a) 567-581.
Evans, D. “Tests of Alternative Theories of Firm Growth.” Journal of Political Economy. Vol.95 (1987b) 657-674.
Jovanovic, B. “Selection and Evolution of Industry.” Econometrica. Vol.50 (1982) 649-670.
Variyam, J. & Kraybill, D. “Empirical Evidence on Determinants of Firm Growth.” EconomicsLetters. Vol.38 (1992) 31-36.
You, J.-I. “Small Firms in Economic Theory.” Cambridge Journal of Economics. Vol. 19 (1995) 441-462.

1
DRAFT 22 Final Eng Quest Renumbered2.doc (4/14/00 7:40 AM)Survey of Micro Enterprises (Sample of enterprises who had 1 to 4
employees in December 1995)
Initial Call
Hello, this is <name of interviewer> from Statistics Canada.
Have I reached <name of business>?
Confirm name of business. If you are told that company is not the same as company above, ask if thatcompany is in any way related to the company. (It could be that you have reached the company’s privateaccountant, or that the company has merged or changed names.) Find out how you can get in touch withthe right business.
May I please speak with the majority owner of <name of business>? (This is the person with the highestproportion of ownership. If there are equal partners, the survey should be filled out by the one with themost involvement in the business.) If the majority owner is an absentee owner, may I please speak to anowner who is a hands-on operator of <name of business>?
If yes, arrange to complete the interview with the person who has the highest proportion of ownership.
A1 What is your name?___________________A2 What is your position title? _______________A3 What is your phone number? _______________A4 What is your gender? ________________
Survey Introduction
Hello. This is <name of interviewer> from Statistics Canada. We are conducting a voluntary survey ofsmall businesses on behalf of Industry Canada.
The purpose of the survey is to explore the factors and issues that impact on a business’ ability to besuccessful. Industry Canada will use the information to improve its policies and services that promote andenhance small business’s capacity to grow and create sustainable jobs.
While your participation is voluntary, your assistance is essential if the results are to be accurate. Youranswers will be kept strictly confidential and used only for statistical purposes. My supervisor may listenin to evaluate the survey.

2
Section B: Details on the Ownership of the Business
First, I will ask some questions about the ownership of your business.
B1. How many years in total has <name of business> been in operation? Mark one only
Less than 7 years 7 to 15 years more than 15 years
B2. Is the business incorporated? Yes No Skip to B6
B3 Is the business federally incorporated or provincially incorporated? Federal Provincial
B4. How many years has the business been incorporated? Less than one year 1 - 2 years 3 – 4 years 5 – 6 years 7 years or more
B5 Is the business a franchise? Yes No
B6. Is this a home-based business? Yes No
B7. When you became the owner, what was the percentage distribution of ownership?_____% Yourself_____% Other family members_____% Other employees of the business or Business Partner_____% Public shareholders_____% Corporate parent_____% Total

3
B8 What is the percentage distribution of ownership of the business today? Same
_____% Yourself_____% Other family members_____% Other employees of the business_____% Public shareholders_____% Corporate parent_____% Total
B9. How did you become an owner of <name of business>?
Mark one only Started it from scratch Skip to B12 Bought it from someone else as a successful business Bought it from someone else as an unsuccessful business Inherited it from a family member Spin off from another business Other (please specify)______________________________
B10. Did you have any relationship to the business before you became an owner? For example were you acustomer, supplier or employee of the business or were you a relative of one of the previous owners?
Yes No Skip to B12
B11. What was your relationship to the business before becoming an owner? Were you a (n)…
Mark all that apply employee? customer? supplier? relative? acquaintance of one of the previous owners? other (please specify)______________________________________
B12. Are you currently employed by any business other than <name of business>? Yes No

4
B13. Are you currently a majority owner of any other businesses? Yes No
B14. In the last ten years, have you been a majority owner in any other business(es) of which you are nolonger an owner?
Yes No Skip to C1
B15. What were the main reasons why you ceased to be an owner of these businesses?
Mark all that apply Business sold to make a profit Business not profitable enough Business went bankrupt Other (please specify)__________________________________

5
Section C: Owner’s personal and business goals
I would now like to ask you about your involvement in the business and to try and identify whatgoals you have set for <name of business> and how those goals interact with your personal goals.
C1. Which of the following is the primary reason why you became a business owner? To be your own boss You could not find suitable waged employment To realize a dream To realize a better financial position To enjoy a better quality of life Other (please specify)________________________________________
For each of the following 2 statements, please indicate whether you agree, or disagree.
C2. I plan to spend significantly more time on my business so it will (hopefully) make more money. Agree Disagree
C3. I am prepared to risk my major personal assets (such as my house) if that is what it takes to make mybusiness grow.
Agree Disagree
C4. At which stage of development would you say your business is at present? (Choose only one.) EARLY START-UP stage, where your company is relatively young and is engaged in productdevelopment with anticipated sales, some time in the future. LATE-STAGE START-UP, where bringing the product to market is near and there are some initialconfirmed sales. SURVIVAL stage, where your company is established in the marketplace, but still not profitable. GROWTH stage, where your company has an established market and is expanding. MATURE stage, where there is a high-degree of stability in your market.
C5. Are you planning to expand in the next 2 years? Yes No Skip to C7

6
C6 Which of the following elements are part of the expansion strategy? (Yes or No)
Yes/No
_______ Adding a new product or service_______ Improving existing products or services_______ Seeking new domestic markets_______ Seeking new international markets_______ Selling over the internet_______ Expanding advertising and promotion_______ Adding new equipment and/or operating space_______ Upgrading operations and computer systems_______ Hiring employees_______ Seeking additional financing_______ Seeking professional advice
SKIP to C8
C7. Which of the following are reasons why you are not planning to expand in the next two years. (Yes orNo)
Yes/No
_______ Market not growing_______ Do not want to lose control over the business_______ Taxes will become too high_______ Lack of growth capital_______ Risks too high_______ Content with the way things are_______ Other, (please specify)__________________________________
C8. Do you (owner/manager) require training in any of the following skills, during the next two years?(Yes or No)
Yes/No _______ Using the Internet
_______ Marketing skills_______ Human resource management_______ Spreadsheet software_______ Database software_______ Accounting software_______ Other, (please specify)________________________

7
C9. During the next two years, which of the following skills will your employees generally require trainingin? (Yes or No)
Yes/No _______ Using the Internet
_______ Marketing skills_______ Human resource management_______ Spreadsheet software_______ Database software_______ Accounting software_______ Other, (please specify)________________________
Not applicable (N/A) Skip to C10
C10. Did you get any significant business advice during the past year from the following sources: (Yes orNo)
_____ Accountant_____ Financial Institutions_____ Business or Industry Associations_____ Mentors/Friends/Associates_____ Consultants_____ Suppliers_____ Customers_____ Family_____ Lawyers_____ Government_____ Board of directors
C11. For the eight business functions listed below, please indicate if (1) you perform them yourself, (2)your employees perform, or are (3) contracted out.
_____ Marketing_____ Product development_____ Production operations_____ Financial operations_____ Planning, control and evaluation_____ Innovation/Technology_____ Personnel and administrative operations_____ Day to day operations

8
Section D: Characteristics of the company
D1. What is the maximum amount that your sales have grown continuously over a 4- year period? (Pleaseprovide your best estimate)Mark one only
More than 200% 100% - 200% 50% - 100% 20% - 50% 0% - 20% Declined Do not know
D2. By how much do you expect your sales to grow over the next 4 years? (Please provide your bestestimate)
Mark one only More than 200% 100% - 200% 50% - 100% 20% - 50% 0% - 20% Declined Do not know
D3. How many paid employees and/or contract workers does the business currently have?_____ Contract workers_____ Part-time employees (Emps. who work less than 30 hrs. per week)_____ Full-time employees (Emps. who work equal to, or more than 30 hrs. per week)
D4. How many paid employees and/or contract workers did the business have FOUR YEARS AGO?_____ Contract workers_____ Part-time employees (Emps. who work less than 30 hrs. per week)_____ Full-time employees (Emps. who work equal to, or more than 30 hrs. per week)
D5. How many paid employees and/or contract workers do you expect to have FOUR YEARS FROMNOW?_____ Contract workers_____ Part-time employees (Emps. who work less than 30 hrs. per week)_____ Full-time employees (Emps. who work equal to, or more than 30 hrs. per week)

9
D6. Over the past twelve months, approximately what percentage of your market was from each of thefollowing geographic areas?
Area %Same Community as the businessOut of the community but in the same provinceIn other provincesUnited StatesRest of world
D7 What percentage of your sales is made over the Internet?_____ %
D8 In each of the following geographic areas, do you think your market percentage is (G) growing, or (D)declining?
Area G or DSame Community as the businessOut of the community but in the same provinceIn other provincesUnited StatesRest of world
D9. Are any of the following factors vitally important in determining whether or not your businesssucceeds? (Mark all that apply)
Factor Yes/NoBusiness skills of employeesManagement skills of employeesSkills in using technologyFavorable market conditionsClear vision for the businessLuckPlanning (strategic/business)Family/moral supportGood working relationships with business partnersAccess to financingLocationFavourable tax & regulatory environment

10
D10. Please indicate whether your business has made use of the following sources of business financing.(Yes or No)
Source of Financing Y or NBanks, trust companies and credit unionsFinancing from friends or relativesFinancing from other private individualsVenture capitalistsOwn savingsSmall Business Loans ActOther sources (please specify)
D11. Are you planning to use the following sources of business financing?
Y/N Source of Financing
_______ Banks, trust companies and credit unions_______ Financing from friends or relatives_______ Financing from other private individuals_______ Venture capitalists_______ Own savings_______ Small Business Loans Act_______ Other Sources (please specify)__________________________
D12. Which of the following business technologies do you use on a regular basis for your businessoperations?
Y/N Business Operations
_______ Telephone messaging services_______ Call Centres_______ Internet Service Providers-general (i.e. Sympatico, CompuServe, AOL)_______ Personal computers_______ Network computer (local area network)_______ Email_______ Business website – do you have your own?_______ Suppliers website_______ Fax machine

11
Section A: Information on the Business and Management Experience of the Majority Owner(respondent) of the Business
I will now need to get some basic information about you as the majority owner of <name ofbusiness>.
A5. In which of the following age ranges do you fall? Are you…
Read each category and mark one only Less than 30 years old? 30 – 39 years? 40 – 49 years? 50- 59 years? 60 years and over?
A6. Were you born in Canada or did you immigrate from another country?
Born in Canada Skip to A8 Immigrant
A7. In what year did you immigrate to Canada?_____
A8. Is <name of business> the ONLY source of income for your household? Yes Skip to A10 No
A9. Is <name of business> the MOST IMPORTANT source of income for your household? Yes No
A10. What was the highest level of education you completed?Mark one only
Did not finish high school Skip to A12 High school diploma Skip to A12 College certificate or diploma Bachelor’s degree Master’s degree PHD Other (please specify) Skip to A12___________________________________
A11. What was your main field of study at college or university?

12
(Mark as many as applicable) Business IT (Information Technology) Other (please specify)______________________
A12. Have you had any business training outside your formal education, such as workshops, or localeconomic development programs?
Yes No
A13. Prior to becoming a business owner were you ever a paid employee of another business ororganization?
Yes No Skip to A18
A14. In total, how many years did you work in full-time jobs?
None_____ Years
A15. In total, how many years did you work in part-time jobs?
None_____ Years
A16. In total, how many years did you work for employers operating in the same industry as your currentbusiness?
None_____ Years

13
A17. In these previous jobs, which of the following skills did you obtain? (Yes or No)
___ Sales and service___ Business planning___ Marketing (research or promotion)___ Financial management and accounting___ Human resource management___ Management of operations___ Information Technology___ Purchasing___ Other (please specify)______________________
A18. During your childhood years, did any close members of your family (such as your parents or siblings)own a business?
Yes No
A19. Statistics Canada has entered into a data-sharing agreement under Section 12 of the Statistics Actwith Industry Canada. All your information will be kept strictly confidential by Industry Canada and usedonly for statistical purposes. Do you agree to share the information you have provided?
Yes No
The interview is now complete. Thank you for taking the time to answer our questions. Do you have anycomments concerning the survey?