micro electric urban vehicle test...
TRANSCRIPT
Micro Electric Urban Vehicle &
Test Platform ____________________________
Final Report
Students:
Kyle Dieter Spencer Leeds
Nate Mills
Advisors:
Dr. Brian Huggins Mr. Steve Gutschlag
Thursday, May 14th, 2009

Abstract
The Micro Electric Urban Vehicle (MEUV) Test Platform project is the first phase of the Bradley
ECE Department’s electric commuting vehicle effort. This endeavor is a multi-year project to
design a commercially viable urban electric vehicle with a low carbon footprint. The goal of this
phase was to design and implement a test platform with data acquisition to analyze and
evaluate drive models, battery technologies, and electric motors. A basic drive model was
developed to predict power and energy consumption for test drives. This information was then
used to size the motor. Brushed and brushless DC-motors, as well as AC induction motors,
were researched and a separately excited DC motor capable of regenerative braking was
selected. In addition, lead-acid, nickel-metal hydride, and lithium-ion battery chemistries were
researched. However, this first phase was not intended to optimize the various technologies
for the commercial version, but to implement a practical test platform. Therefore, although it
appears lithium-ion will be the best chemistry for the commercial product, lead acid batteries
were specified for the test platform. A vehicular platform with appropriate mechanical systems
was purchased for the prototype implementation and configured to accommodate the
subsystems. Finally, a data acquisition system was developed, implemented, and test runs
were completed.
ii

Table of Contents
Abstract ii
Table of Contents iii
I. Introduction 1
A. Problem Statement 1
B. Multi-Year Project Overview 2
II. Functional Description, Requirements, and Complete System
Block Diagram 2
A. Functional Description 2
B. Functional Requirements 3
i. Platform 3
ii. Battery 3
iii. Battery Charger 3
iv. Motor 3
v. Motor Controller 3
vi. Instrumentation, Data Acquisition, and Display 3
C. Phase 1 Goals 4
D. Complete System Block Diagram 5
III. Subsystem Specifications 5
A. Platform 5
B. Battery 5
C. Battery Charger 6
D. Motor 6
E. Motor Controller 6
F. Instrumentation, Data Acquisition, and Display 6
i. Cycle Analyst 6
G. User Inputs 6
H. Disconnect Switch 7
iii µEUV
Final Report
IV. Research 7
A. Drive Model 7
B. Battery 8
C. Motor 9
V. Component Testing 10
A. Motor Modeling 10
B. Motor and Controller Testing 13
C. Controller Simulated Load Testing 16
D. Data Acquisition Testing 16
VI. Software 17
VII. Implementation and Analysis of Results 18
A. 20% Regen Setting 21
B. 80% Regen Setting 23
C. Test Run Conclusions 25
VIII. Conclusions 26
IX. Recommendations for Future Work 26
X. Applicable Standards and Related Patents 27
A. Applicable Standards 27
B. Related Patents 28
XI. References 29
Appendices
µEUV
Final Report
iii

1 µEUV
Final Report
I. Introduction
A. Problem Statement:
As energy costs and concerns for the environment rise due to the constantly increasing use of
fossil fuels, there has been a push towards alternative energy sources and products with a low
carbon footprint. Carbon emissions and the nation's dependence on dwindling fossil fuels can
be drastically reduced by shifting towards renewable energy sources for transportation. The
best way to begin solving this problem is to target the market that uses the biggest amount of
fossil fuels and is also a leading cause of carbon emissions. As seen in Figure 1, over 75% of
Americans commute to work alone. For all of these commuters, over 2 tons of metal must be
transported. A national household travel survey taken from the Bureau of Transportation
Statistics states that 91% of people commuting to work use personal vehicles, with an average
of 29 miles a day1. This is a waste of energy and a major contributing factor towards the
increasing amount of carbon emissions.
Figure 1: US Census Bureau – How Americans Get to Work2
2 µEUV
Final Report
B. Multi-Year Project Overview:
The Electrical and Computer Engineering Department at Bradley University has launched a
multi-year project to design a commercially viable urban electric vehicle with a low carbon
footprint. The vehicle will be ultra compact, lightweight, and street legal. This final vehicle will
strive to solve these issues by having:
• Zero carbon emissions with the use of a stationary battery array charged by
photovoltaic solar panels and/or wind power generators
• Speed capabilities of up to 65 mph
• Fully optimized regenerative braking
• Fully optimized battery system capable of reliable daily use while powering all additional
auxiliary systems
II. Functional Description, Requirements, and Complete System Block
Diagram
A. Functional Description:
Selecting the optimal motor and battery combination for the final version of the low carbon
footprint micro urban electric vehicle will require extensive modeling and research.
Furthermore, a sophisticated and accurate drive model will need to be developed to help
optimally size the motor and battery. The first step toward implementing the final vehicle is
the design and implementation of an appropriate test platform. This test platform is a small
electric vehicle designed to measure system performance of an electric vehicle under various
test conditions. The data acquired will allow improved models for the system components to
be developed to assist in the Phase 2 design. The test platform is a basic electric vehicle in
which a DC-motor takes the place of the internal combustion engine of an ordinary vehicle. The
motor is powered by a rechargeable battery rather than gasoline or other fossil-based fuels.
However, the stationary battery array will not be implemented for the test platform project.
Rather, a commercial battery charger will be used to charge the batteries as needed. A user
controls the speed of the vehicle by changing the voltage applied to the motor with a throttle.
Data will be read from multiple subsystems of the vehicle and displayed on a laptop computer
for viewing. This will include: Vehicle Speed, Battery Current, Battery Capacity, Controller
Temperature, Total Trip Time and Distance, and Regenerative Braking Statistics. The block
diagram of the test platform is shown in Figure 2 and additional information on the subsystems
is discussed under the Functional Specifications and System Requirements sections.

3 µEUV
Final Report
B. Functional Requirements:
i. Platform:
The test platform shall attain a maximum speed of 30 mph. This platform shall have a mass of
no more than 1800kg. The test platform shall have a minimum load capacity of 150kg to
account for a passenger and cargo. The platform shall have all necessary safety features for
test runs.
ii. Battery:
The batteries shall have a capacity to allow for multi-hour tests. The batteries shall be capable
of supplying high current for acceleration. The batteries shall be capable of absorbing high
regenerative brake current.
iii. Battery Charger:
The battery charging system shall be able to efficiently charge the batteries to full between
tests.
iv. Motor:
The motor shall be able to supply a peak power of 15hp to be able to meet the 30mph
maximum speed. The motor shall supply enough torque to reach this top speed within 10
seconds. The motor shall operate with greater than 60% efficiency and an RPM range at a
maximum load consistent with the speed and acceleration requirements. This motor shall also
be capable of regenerative braking.
v. Motor Controller:
The motor controller shall efficiently control the motor via an appropriate input throttle. The
controller shall be powered by a suitable voltage supplied by the batteries. This controller shall
also be able to log necessary data such as current, throttle position, and temperature. The
controller shall be capable of regenerative braking with the chosen motor.
vi. Instrumentation, Data Acquisition, and Display:
The data acquisition system shall measure, log, and display the following parameters: Throttle
Position, Controller Temperature, Battery Voltage, Controller Output Current, Battery Current,
Vehicle Speed, Battery Capacity, Distance Traveled, and Regenerative Braking Statistics.
The subsystem components, discussed in the Subsystems Specification section, were chosen to
meet these requirements.
4 µEUV
Final Report
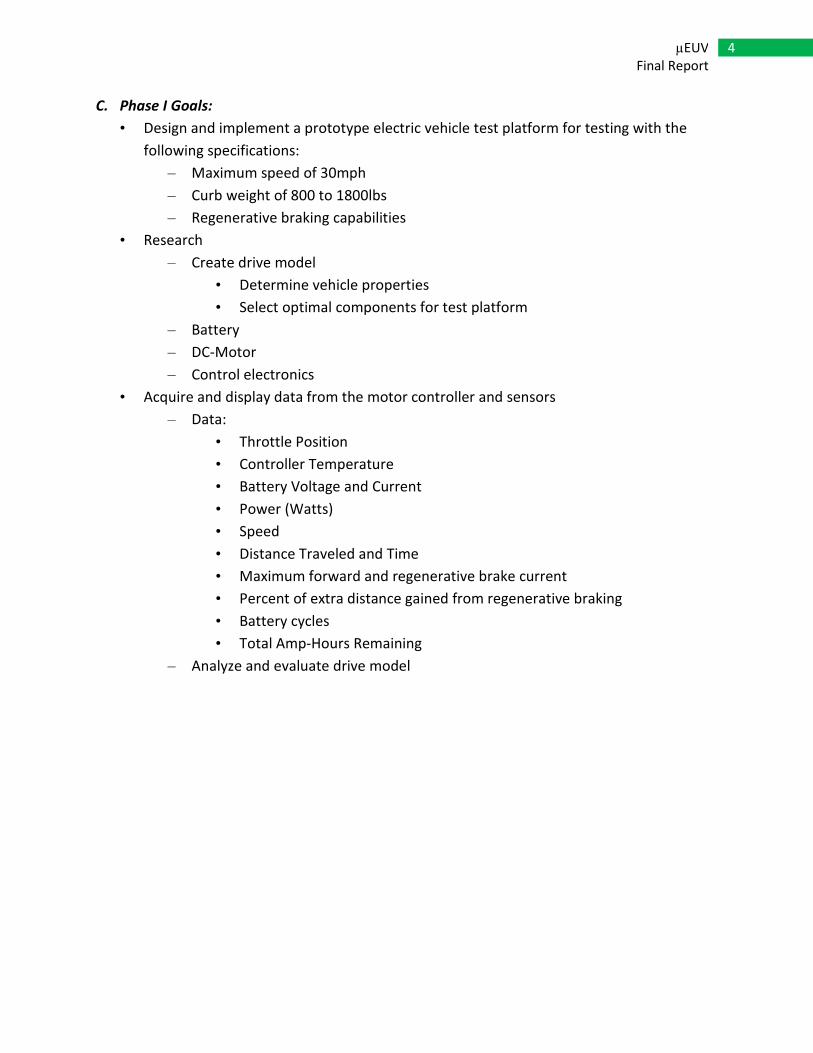
C. Phase I Goals:
• Design and implement a prototype electric vehicle test platform for testing with the
following specifications:
– Maximum speed of 30mph
– Curb weight of 800 to 1800lbs
– Regenerative braking capabilities
• Research
– Create drive model
• Determine vehicle properties
• Select optimal components for test platform
– Battery
– DC-Motor
– Control electronics
• Acquire and display data from the motor controller and sensors
– Data:
• Throttle Position
• Controller Temperature
• Battery Voltage and Current
• Power (Watts)
• Speed
• Distance Traveled and Time
• Maximum forward and regenerative brake current
• Percent of extra distance gained from regenerative braking
• Battery cycles
• Total Amp-Hours Remaining
– Analyze and evaluate drive model

5 µEUV
Final Report
D. Complete System Block Diagram:
Figure 2: Complete System Block Diagram
III. Subsystem Specifications
A. Platform:
The vehicle’s platform is an American SportWorks Vector go-kart frame. This frame has ample
space for a single passenger, laptop, and a display. The frame also has space for three 12 volt
lead-acid batteries and other electronics. The platform’s axle has the capability to be driven by
an electric motor.
B. Battery:
The battery subsystem consists of three 12 volt batteries that power the vehicle’s motor, the
motor controller electronics, and the various sensors. These batteries are connected in series
to achieve the 36 volts required for testing. The capacity of each battery is 44 amp-hours which
allows the vehicle to be used for numerous test runs. The battery chemistry is deep discharge
sealed lead-acid with a combined weight of 104.4 pounds.

6 µEUV
Final Report
C. Battery Charger:
The battery charging subsystem is a commercially available unit capable of charging the 3
batteries connected in series.
D. Motor:
The motor driving the vehicle is a D&D Separately Excited 24-48 volt DC Motor. With the motor
controller, this motor generates 8 horse-power continuous and 17 peak horse-power at 6200
RPM. These specifications provide the power to sufficiently move the complete vehicle with a
passenger and cargo up to 30 miles-per-hour for test runs. This motor is also capable of
regenerative braking.
E. Motor Controller:
The motor controller, the Alltrax DCX-600, is used to control all motor operations. The
controller utilizes a 5kΩ potentiometer as a throttle input so that the user can set the speed of
the motor. The controller also has a toggle bit to control motor direction. The controller is
powered by 36 volts from the batteries. The signal output to the motor is a pulse-width
modulated (PWM) signal with a frequency of 18.8 kHz. The controller also monitors and logs
throttle position, controller temperature, battery voltage, battery current, and output current.
The maximum continuous current of the controller is 600 amps for 2 minutes. This controller
also enables a low-power mode for the controller subsystem when the throttle is not engaged.
F. Instrumentation, Data Acquisition, and Display:
The instrumentation, data acquisition, and display subsystem collects and processes data. The
instruments used for collecting data are the Cycle Analyst and the motor controller. This data is
logged and displayed on the laptop. Each of these devices individually interfaces with the
laptop via RS-232 serial connections for data logging purposes. The laptop is powered from its
own internal battery and displays the sensor data in a usable format for driving.
i. Cycle Analyst:
The Cycle Analyst is a data acquisition system used mainly in electric bicycle and vehicle
applications. This system has the ability to display and log vehicle speed, battery voltage,
battery current, battery capacity, and regenerative braking statistics. The Cycle Analyst is
powered by 36 volts and collects current data between the batteries and motor controller via
the 500 amp shunt. The display on the Cycle Analyst is also used to view this data in real time
while driving the vehicle. This data is logged to the laptop.
G. User Inputs:
The user inputs consist of a key switch to provide vehicle security and auxiliary power for the
Cycle Analyst, an on/off button to relay power from the contactor to the controller, and a pedal
connected to a 5kΩ potentiometer to be used as a throttle.

7 µEUV
Final Report
H. Disconnect Switch:
A manual disconnect switch is included in the circuitry for safety purposes. This switch is an
emergency stop button that will disconnect power from the batteries to all vehicle subsystems.
This switch is mounted near the user for ease of access.
IV. Research
To meet the Phase 1 goals and system requirements, as well as the future vehicle goals,
research was completed for key vehicle components. The main research focus was on
developing a drive model, different battery chemistries, and electric motor types that are used
in electric vehicles. The resulting selections from this research are discussed in the following
subsections.
A. Drive Model:
A drive model was created to aid in the selection process of vehicle components. This model
consists of a series of calculations based on Newton’s laws of physics. These equations, in
conjunction with the specifications for the test platform and test runs, are also valid for the
prototype vehicle and typical urban commute. The equations, calculations, and examples are
shown in Appendix A. The input and output parameters are as follows.
Drive Model Input Specifications:
• Vehicle Curb Weight (kg)
• Trip Length (km)
• Number of Stops
• Maximum Velocity (m/s)
• Acceleration Time (s)
• Wheel Radius (m)
Drive Model Output Specifications:
• Kinetic Energy at 100%, 95%, and 80% Efficiency (kJ)
• Steady State Energy Loss at 100%, 95%, and 80% Efficiency (kJ)
• Steady State Power (kW)
• Peak Power (kW)
• Torque (N m)
• Average Wheel Speed During Acceleration (RPM)
• Motor Power (kW)

8 µEUV
Final Report
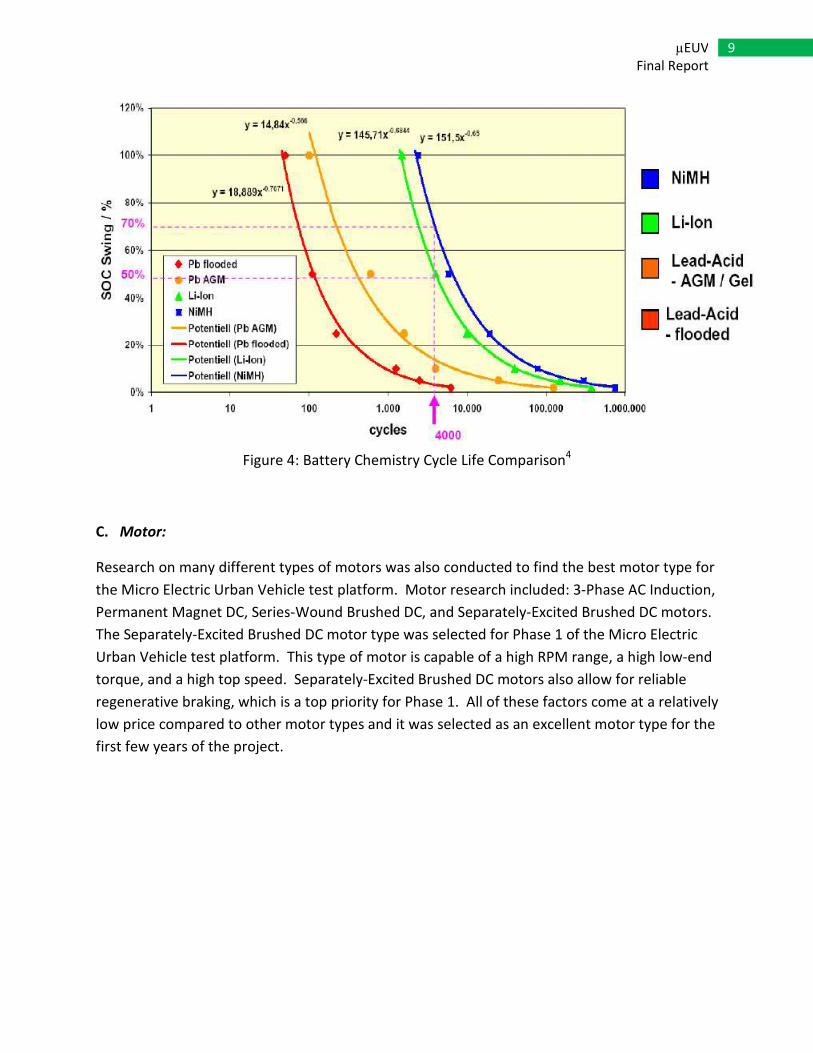
B. Battery3:
Research was conducted for three different battery chemistries that are popular in electric
vehicles today: lead-acid, nickel metal-hydride (NiMH), and lithium-ion (Li-Ion). A complete
listing of the advantages and disadvantages of each type are shown in Figure 3. For the Phase 1
test vehicle, lead-acid batteries were selected due to their cost and availability. Lead-acid is an
adequate choice for a short range test vehicle; however, the final project will need to use NiMH
or Li-Ion batteries as they both are lighter and smaller for a given capacity as well as have a
much higher number of discharge cycles. A comparison of these discharge cycles is shown in
Figure 4.
Figure 3: Battery Chemistry Comparison4
9 µEUV
Final Report
Figure 4: Battery Chemistry Cycle Life Comparison4
C. Motor:
Research on many different types of motors was also conducted to find the best motor type for
the Micro Electric Urban Vehicle test platform. Motor research included: 3-Phase AC Induction,
Permanent Magnet DC, Series-Wound Brushed DC, and Separately-Excited Brushed DC motors.
The Separately-Excited Brushed DC motor type was selected for Phase 1 of the Micro Electric
Urban Vehicle test platform. This type of motor is capable of a high RPM range, a high low-end
torque, and a high top speed. Separately-Excited Brushed DC motors also allow for reliable
regenerative braking, which is a top priority for Phase 1. All of these factors come at a relatively
low price compared to other motor types and it was selected as an excellent motor type for the
first few years of the project.
10 µEUV
Final Report
V. Component Testing
Before the entire system was implemented, both the motor and controller subsystem and the
data acquisition subsystems were tested.
A. Motor Modeling:
The motor was tested alone to get a better sense of the motor’s characteristics and to measure
parameters needed for constructing a motor model. Although this model was not directly used
in the first phase of the project, is served as a useful learning experience for the group
conducting Phase 1 and it will be used by future phases of the project. Creating a motor model
in Simulink allows future groups to simulate how much power the motor uses and then specify
a battery pack with this data. The following motor parameters were needed for the model:
Armature Resistance (Ra), Field Resistance (Rf), Torque Constant (Kt), Viscous Friction (b), and
Static Friction (TSF).
To calculate Rf, safely, a relatively small voltage of 8.93 volts was applied across the field
winding and the field winding current was measured to be 6.9 amps. Using Ohm’s Law, given in
Equation 1, the field winding resistance was calculated as 1.29 Ω.
(Equation 1)
The locked rotor test was utilized to calculate Ra. A small voltage was applied across the
armature and slowly increased until the motor shaft began to turn, then the voltage was slowly
decreased until the motor stopped turning. This was done to prevent the backwards
electromotive force. This voltage was 1.26 volts and the corresponding current was measured
to be 15.5 amps. Using Ohm’s Law, found in Equation 2, the armature resistance was
calculated as .081 Ω.
(Equation 2)
The motor was connected in a shunt configuration as shown in Figure 7 and Figure 8. This
setup was used to collect data and calculate the torque constant, which is the torque required
to overcome static friction, and the viscous friction coefficient, which is kinetic friction.
ff RIVs =
aaRIVs =

11 µEUV
Final Report
Figure 7: Schematic of shunt connected DC motor.
Figure 8: Block diagram of shunt connected DC motor.
The speed was set to half of the rated speed by supplying the motor with half of the rated
voltage of 48 volts. A second point is needed to calculate the parameters, so data was also
taken at 12 volts. Armature current (Ia) and shaft velocity (ωs) were recorded and are given in
Table 1.
Table 1: Motor Test Data Taken from the Motor Connected in a Shunt Configuration at 12 and 24 volts.
Voltage (V)
Armature
Current (A)
Shaft
Velocity
(RPM)
Shaft
Velocity
(rad/s)
Field
Current
(A)
12 6 937 98.07 6.0
24 8.1 1438 150.59 13.7
Vs Eq=Ke s
Ra
Rf
If
Ia
A2
F1F2
A1
Model # ES-10E-330 5 10 15 20
| l l l | l l l | l l l | l l l | l l l | l l l |
Ammeter
0 5 10 15 20 25 30
| l l l | l l l | l l l | l l l | l l l | l l l |
Ammeter
A B
- +
Power Supply
- - ++

12 µEUV
Final Report
The first parameter to calculate is the torque constant, KT. This is calculated by utilizing
Kirchhoff's Voltage Law for the circuit found in Figure 7. The resulting equation is shown in
Equation 3. By manipulating this equation to solve for Kt, the resulting equation is shown in
Equation 4. The solution using the data taken at 24 volts from Table 1 is shown below in
Equation 5.
(Equation3)
(Equation 4)
(Equation 5)
Next, the torque required to overcome the static friction, TSF, and the viscous friction
coefficient, b, were calculated. This was accomplished by using Newton’s second law, found in
Equation 6. Equation 6 was simultaneously solved using the data taken at 12 and 24 volts.
These simultaneous equations are shown in Equation 7 and Equation 8. The resulting
parameters are TSF = 0.906177 [N*m] and b = .000243 [(N*m)/(rad/sec)].
(Equation 6)
@12v:
(Equation 7)
@24v:
(Equation 8)
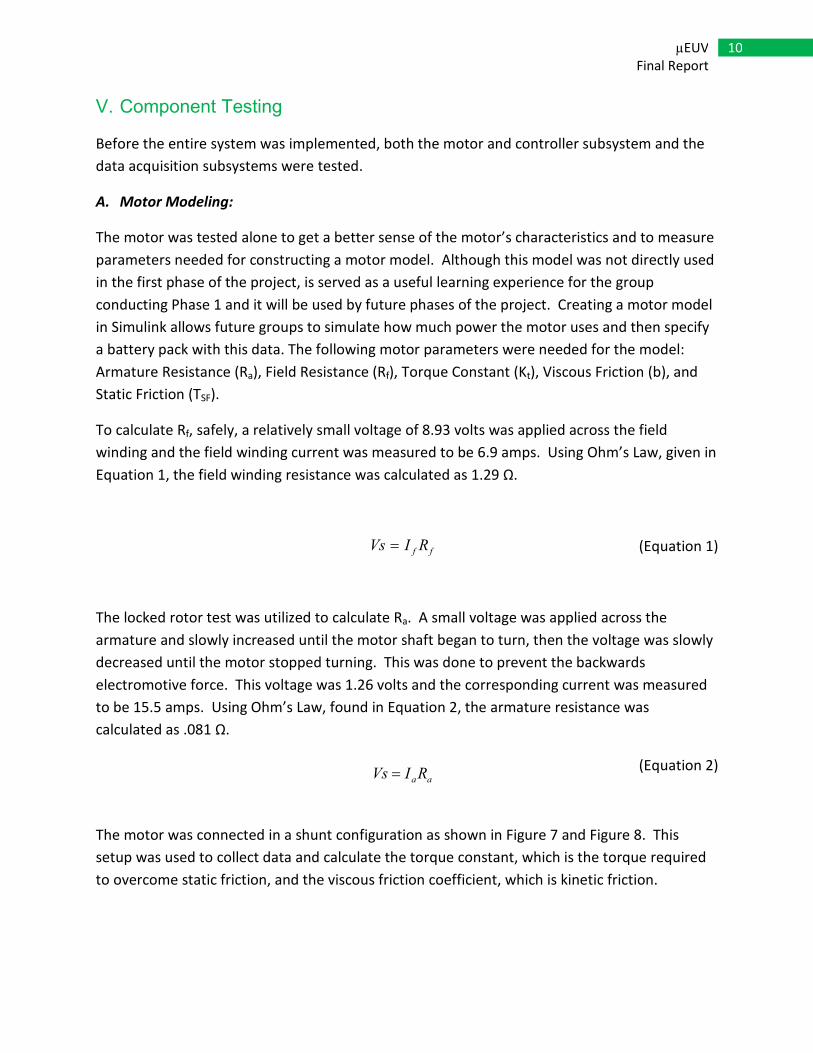
The parameters are used to generate the Simulink model shown in Figure 9. This model was
obtained from notes in EE 431, Control System Theory.
s
aaTE
RIVsKK
ω
−==
A
mN
rad
AVKT
*155.
sec/59.150
)081)(.1.8(24=
Ω−=
0=++−=++− sEaasaaas KRIVERIV ω
0*** =−−=−−=Σ sSFaTsSFdeveloped bTIKbTTtorques ωω
0)07.98)(()6)(155(. =−− bTSF
0)1438)(()1.8)(155(. =−− bTSF
13 µEUV
Final Report
Figure 9: Motor modeled in Simulink
A motor coast down test is required to calculate La and Ja. This test was unable to be performed
because the motor was already mounted to the platform and attached to the drive chain.
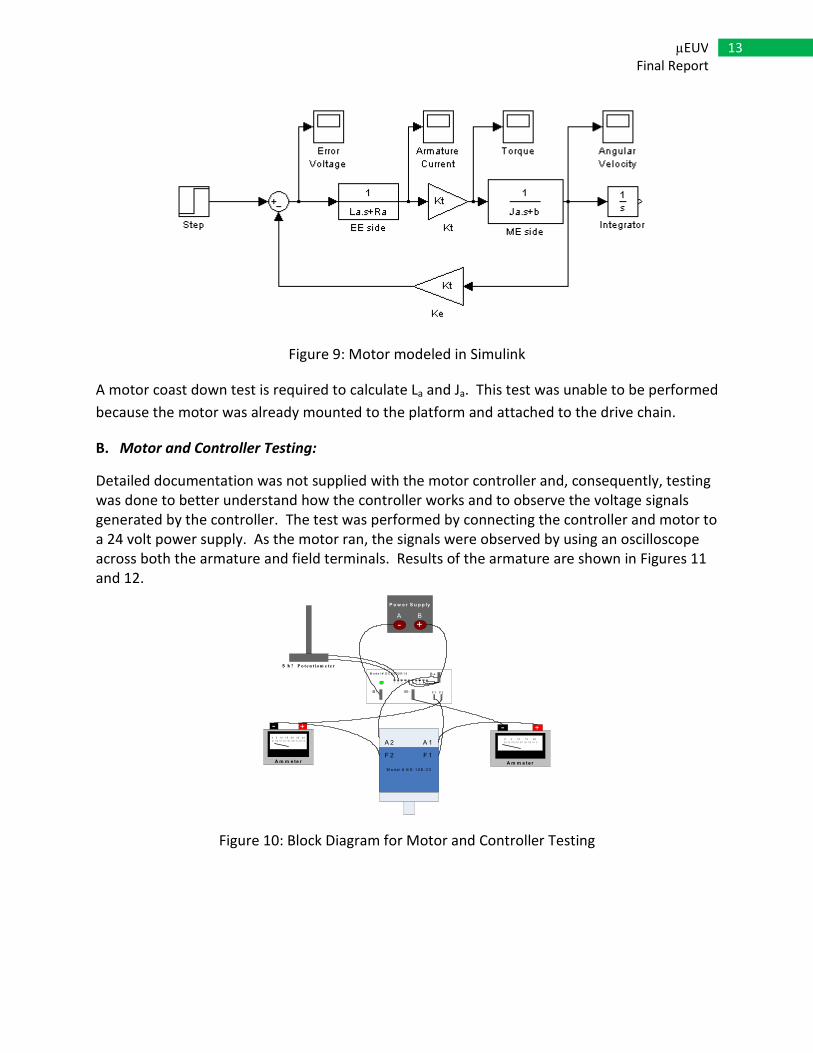
B. Motor and Controller Testing:
Detailed documentation was not supplied with the motor controller and, consequently, testing
was done to better understand how the controller works and to observe the voltage signals
generated by the controller. The test was performed by connecting the controller and motor to
a 24 volt power supply. As the motor ran, the signals were observed by using an oscilloscope
across both the armature and field terminals. Results of the armature are shown in Figures 11
and 12.
Figure 10: Block Diagram for Motor and Controller Testing
A 2
F 1F 2
A 1
M o d e l # E S -1 0 E -3 3
A B
- +
P o w e r S u p p ly
M o d e l # D C X 6 0 0R 1 4 B +
B - M - F 1 F 2
1 2 3 4 5 6 7 8 9 1 0
5 k ? P o te n t iom e te r
0 5 1 0 1 5 2 0 2 5 3 0
| l l l | l l l | l l l | l l l | l l l | l l l |
A m m e te r
- +
0 5 1 0 1 5 2 0
| l l l | l l l | l l l | l l l | l l l | l l l |
A m m e te r
- +

14 µEUV
Final Report
Figure 11: Armature Duty Cycle at 25% Throttle
Figure 12: Armature Duty Cycle at 75% Throttle
The motor controller was observed to control the motor with a PWM signal. As shown in
Figures 11 and 12, the armature duty cycles roughly matches the throttle percentage. After this
test, data was taken to observe how the controller controls the field current at different
throttle percentages. Ammeters were used to measure the armature and field current data at
24, 36, and 48 volts. An example of these results at 36 volts is shown in Table 2.
15 µEUV
Final Report
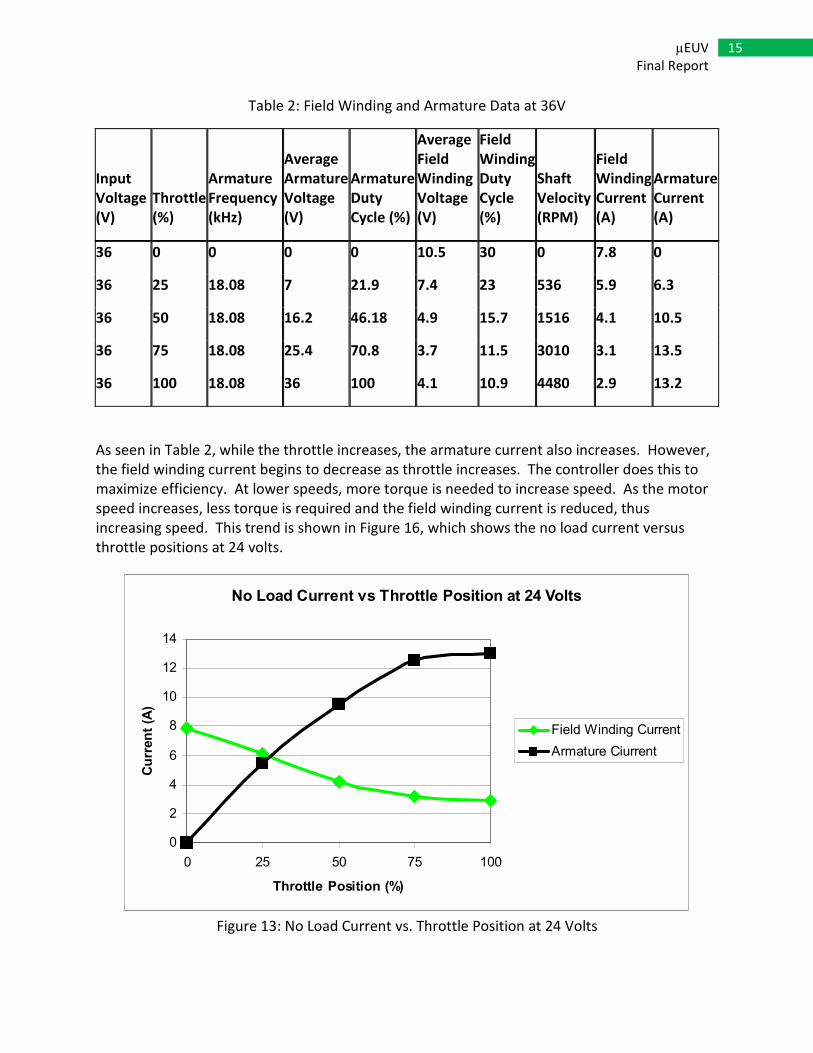
Table 2: Field Winding and Armature Data at 36V
Input
Voltage
(V)
Throttle
(%)
Armature
Frequency
(kHz)
Average
Armature
Voltage
(V)
Armature
Duty
Cycle (%)
Average
Field
Winding
Voltage
(V)
Field
Winding
Duty
Cycle
(%)
Shaft
Velocity
(RPM)
Field
Winding
Current
(A)
Armature
Current
(A)
36 0 0 0 0 10.5 30 0 7.8 0
36 25 18.08 7 21.9 7.4 23 536 5.9 6.3
36 50 18.08 16.2 46.18 4.9 15.7 1516 4.1 10.5
36 75 18.08 25.4 70.8 3.7 11.5 3010 3.1 13.5
36 100 18.08 36 100 4.1 10.9 4480 2.9 13.2
As seen in Table 2, while the throttle increases, the armature current also increases. However,
the field winding current begins to decrease as throttle increases. The controller does this to
maximize efficiency. At lower speeds, more torque is needed to increase speed. As the motor
speed increases, less torque is required and the field winding current is reduced, thus
increasing speed. This trend is shown in Figure 16, which shows the no load current versus
throttle positions at 24 volts.
No Load Current vs Throttle Position at 24 Volts
0
2
4
6
8
10
12
14
0 25 50 75 100
Throttle Position (%)
Curr
ent (A
)
Field Winding Current
Armature Ciurrent
Figure 13: No Load Current vs. Throttle Position at 24 Volts
16 µEUV
Final Report
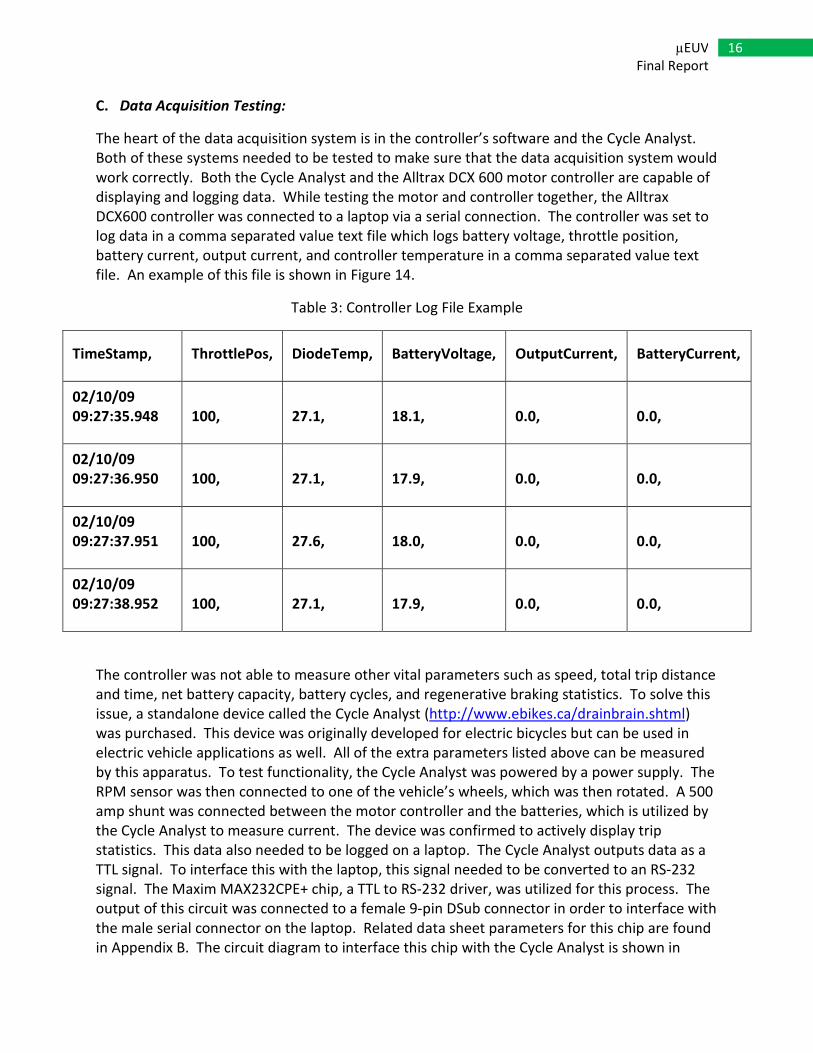
C. Data Acquisition Testing:
The heart of the data acquisition system is in the controller’s software and the Cycle Analyst.
Both of these systems needed to be tested to make sure that the data acquisition system would
work correctly. Both the Cycle Analyst and the Alltrax DCX 600 motor controller are capable of
displaying and logging data. While testing the motor and controller together, the Alltrax
DCX600 controller was connected to a laptop via a serial connection. The controller was set to
log data in a comma separated value text file which logs battery voltage, throttle position,
battery current, output current, and controller temperature in a comma separated value text
file. An example of this file is shown in Figure 14.
Table 3: Controller Log File Example
TimeStamp, ThrottlePos, DiodeTemp, BatteryVoltage, OutputCurrent, BatteryCurrent,
02/10/09
09:27:35.948 100, 27.1, 18.1, 0.0, 0.0,
02/10/09
09:27:36.950 100, 27.1, 17.9, 0.0, 0.0,
02/10/09
09:27:37.951 100, 27.6, 18.0, 0.0, 0.0,
02/10/09
09:27:38.952 100, 27.1, 17.9, 0.0, 0.0,
The controller was not able to measure other vital parameters such as speed, total trip distance
and time, net battery capacity, battery cycles, and regenerative braking statistics. To solve this
issue, a standalone device called the Cycle Analyst (http://www.ebikes.ca/drainbrain.shtml)
was purchased. This device was originally developed for electric bicycles but can be used in
electric vehicle applications as well. All of the extra parameters listed above can be measured
by this apparatus. To test functionality, the Cycle Analyst was powered by a power supply. The
RPM sensor was then connected to one of the vehicle’s wheels, which was then rotated. A 500
amp shunt was connected between the motor controller and the batteries, which is utilized by
the Cycle Analyst to measure current. The device was confirmed to actively display trip
statistics. This data also needed to be logged on a laptop. The Cycle Analyst outputs data as a
TTL signal. To interface this with the laptop, this signal needed to be converted to an RS-232
signal. The Maxim MAX232CPE+ chip, a TTL to RS-232 driver, was utilized for this process. The
output of this circuit was connected to a female 9-pin DSub connector in order to interface with
the male serial connector on the laptop. Related data sheet parameters for this chip are found
in Appendix B. The circuit diagram to interface this chip with the Cycle Analyst is shown in

17 µEUV
Final Report
Figure 14. Although this has been confirmed to be working, the Cycle Analyst’s logging
capabilities have yet to be tested in the field.
V1 = 0V2 = 5
TTL Input (From Cycle Analyst pin Tx)
RS-232 Output (To DSub Connector pin 2)
Ground (To DSub Connector pin 5)
MAX232CPE+
C1+1
V+2
C1-3
C2+4
C2-5
V-6
T2out7
R2in8
R2out9T2in10T1in11R1out12R1in13T1out14GND15Vcc16
C1
1u
C21u
C3
1u
C41u
C5
1u
0
V1
5Vdc
Ground (Cycle Analyst)
(Cycle Analyst 5V Source)
Figure 14: MAX232CPE+ Circuit Diagram
VI. Software
The Data Acquisition System includes software intended to display the information collected
from the Motor Controller and the Cycle Analyst on a Laptop for the driver during a Vehicle
Test. A flowchart for the software is shown in Appendix C, and an example of the Data
Acquisition Display is shown below in Figure 15.
Figure 15: Data Acquisition Display
18 µEUV
Final Report
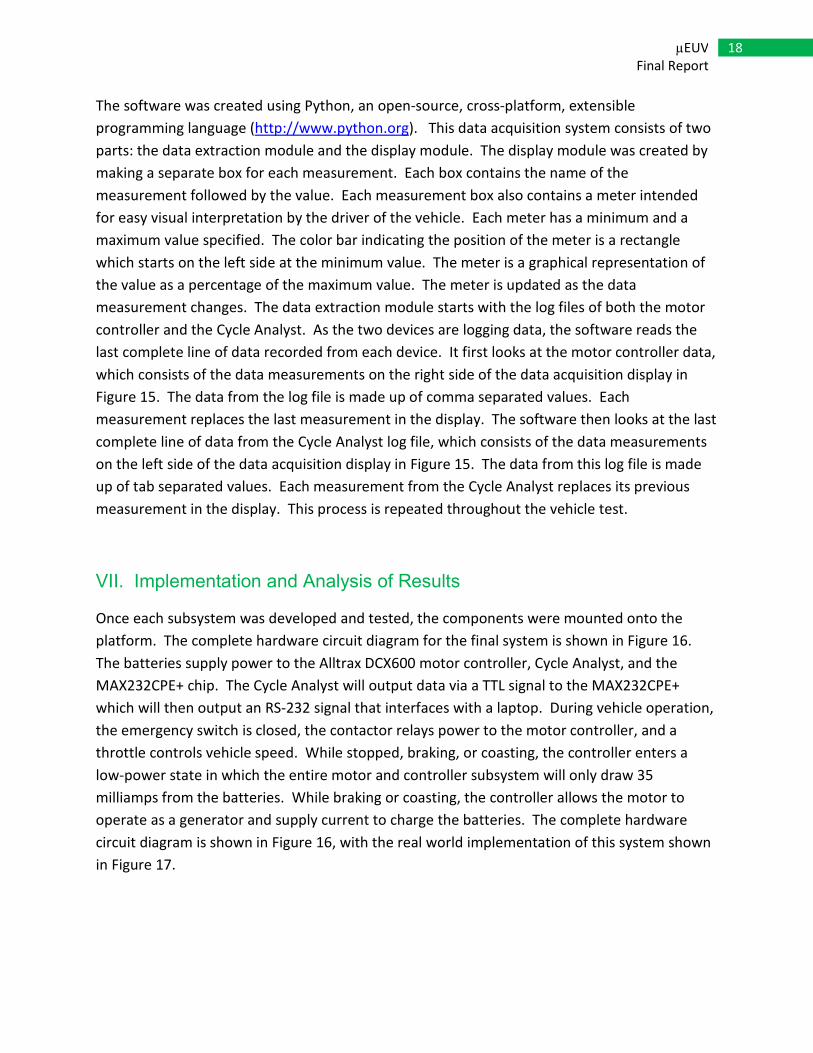
The software was created using Python, an open-source, cross-platform, extensible
programming language (http://www.python.org). This data acquisition system consists of two
parts: the data extraction module and the display module. The display module was created by
making a separate box for each measurement. Each box contains the name of the
measurement followed by the value. Each measurement box also contains a meter intended
for easy visual interpretation by the driver of the vehicle. Each meter has a minimum and a
maximum value specified. The color bar indicating the position of the meter is a rectangle
which starts on the left side at the minimum value. The meter is a graphical representation of
the value as a percentage of the maximum value. The meter is updated as the data
measurement changes. The data extraction module starts with the log files of both the motor
controller and the Cycle Analyst. As the two devices are logging data, the software reads the
last complete line of data recorded from each device. It first looks at the motor controller data,
which consists of the data measurements on the right side of the data acquisition display in
Figure 15. The data from the log file is made up of comma separated values. Each
measurement replaces the last measurement in the display. The software then looks at the last
complete line of data from the Cycle Analyst log file, which consists of the data measurements
on the left side of the data acquisition display in Figure 15. The data from this log file is made
up of tab separated values. Each measurement from the Cycle Analyst replaces its previous
measurement in the display. This process is repeated throughout the vehicle test.
VII. Implementation and Analysis of Results
Once each subsystem was developed and tested, the components were mounted onto the
platform. The complete hardware circuit diagram for the final system is shown in Figure 16.
The batteries supply power to the Alltrax DCX600 motor controller, Cycle Analyst, and the
MAX232CPE+ chip. The Cycle Analyst will output data via a TTL signal to the MAX232CPE+
which will then output an RS-232 signal that interfaces with a laptop. During vehicle operation,
the emergency switch is closed, the contactor relays power to the motor controller, and a
throttle controls vehicle speed. While stopped, braking, or coasting, the controller enters a
low-power state in which the entire motor and controller subsystem will only draw 35
milliamps from the batteries. While braking or coasting, the controller allows the motor to
operate as a generator and supply current to charge the batteries. The complete hardware
circuit diagram is shown in Figure 16, with the real world implementation of this system shown
in Figure 17.

19 µEUV
Final Report
MAX232CPE+
C1+1
V+2
C1-3
C2+4
C2-5
V-6
T2out7
R2in8
R2out9T2in10T1in11R1out12R1in13T1out14GND15Vcc16
C1
1u
C21u
C3
1u
C41u
C5
1u2
5
Batteries
36Vdc
Contactor1
Alltrax DCX 600
F1
B+
F2B-
1 2 3 4 5 6 7 9 10
M-
8
Emergency Disconnect
IN Out
Foot SwitchThrottle15K
D&D Separately Excited DC Motor
A1 A2
F2F1
200A FuseInOut
500A Shunt
InOut
Reverse
1
2
Key Switch
1
2
Cycle Analy st
5V
TxGV+
S+S-G
Female Serial Connector
Figure 16: Overall Circuit Diagram
20 µEUV
Final Report
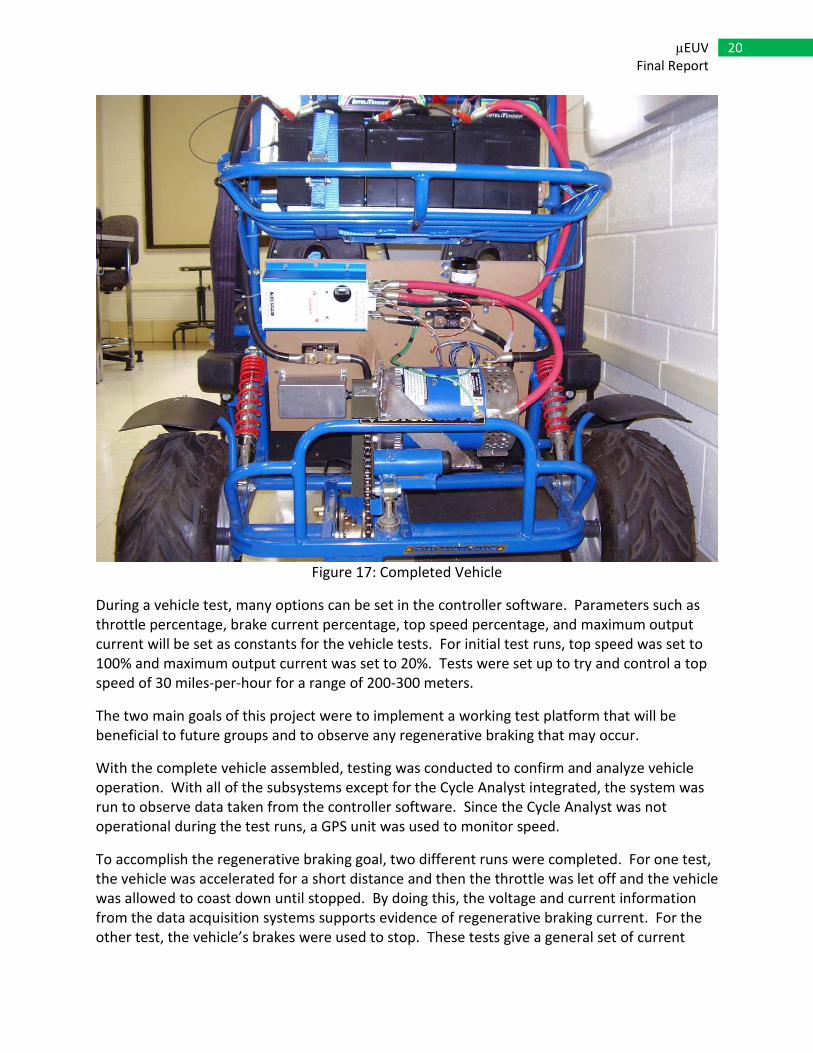
Figure 17: Completed Vehicle
During a vehicle test, many options can be set in the controller software. Parameters such as
throttle percentage, brake current percentage, top speed percentage, and maximum output
current will be set as constants for the vehicle tests. For initial test runs, top speed was set to
100% and maximum output current was set to 20%. Tests were set up to try and control a top
speed of 30 miles-per-hour for a range of 200-300 meters.
The two main goals of this project were to implement a working test platform that will be
beneficial to future groups and to observe any regenerative braking that may occur.
With the complete vehicle assembled, testing was conducted to confirm and analyze vehicle
operation. With all of the subsystems except for the Cycle Analyst integrated, the system was
run to observe data taken from the controller software. Since the Cycle Analyst was not
operational during the test runs, a GPS unit was used to monitor speed.
To accomplish the regenerative braking goal, two different runs were completed. For one test,
the vehicle was accelerated for a short distance and then the throttle was let off and the vehicle
was allowed to coast down until stopped. By doing this, the voltage and current information
from the data acquisition systems supports evidence of regenerative braking current. For the
other test, the vehicle’s brakes were used to stop. These tests give a general set of current

21 µEUV
Final Report
usage data that will help future groups specify upgraded batteries. Although a battery draining
test was not done, the vehicle ran for eight test runs without any signs of exhaustion. This met
the design goal for the vehicle to be used for testing purposes. The motor controller was able
to accurately display and log test data for further analysis. Multiple runs were done with the
controller software brake current set to both 20% and 80%. Examples of the test data collected
are shown in Figures 18 – 25.
A. 20% Regen Setting:
Run 1:
Run 1 with 20% Regen
0
50
100
150
200
250
300
350
02:05.3 02:09.6 02:13.9 02:18.2 02:22.6 02:26.9 02:31.2 02:35.5
Time
Data Throttle Position (%)
Output Current (A)
Figure 18: 20% Run 1 Throttle Position and Output Current vs. Time
Battery Voltage
0
5
10
15
20
25
30
35
40
45
02:05.3 02:09.6 02:13.9 02:18.2 02:22.6 02:26.9 02:31.2 02:35.5
Time
Voltage (V
)
Battery Voltage
Figure 19: 20% Run 1 Battery Voltage vs. Time

22 µEUV
Final Report
Run 2:
Run 2 with 20% Regen
0
50
100
150
200
250
300
350
03:32.5 03:34.3 03:36.0 03:37.7 03:39.5 03:41.2 03:42.9 03:44.6
Time
Data Throttle Position (%)
Output Current (A)
Figure 20: 20% Run 2 Throttle Position and Output Current vs. Time
Battery Voltage
0
5
10
15
20
25
30
35
40
45
03:32.5 03:34.3 03:36.0 03:37.7 03:39.5 03:41.2 03:42.9 03:44.6
Time
Voltage (V
)
Battery Voltage
Figure 21: 20% Run 2 Battery Voltage vs. Time
23 µEUV
Final Report
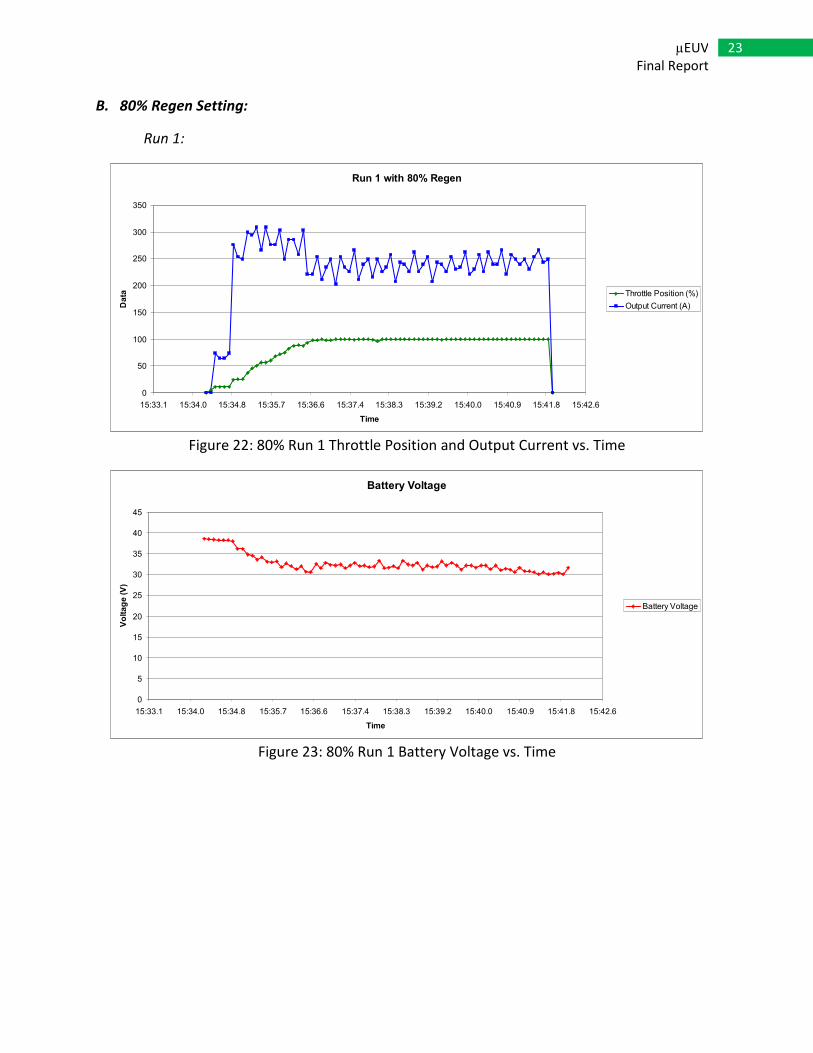
B. 80% Regen Setting:
Run 1:
Run 1 with 80% Regen
0
50
100
150
200
250
300
350
15:33.1 15:34.0 15:34.8 15:35.7 15:36.6 15:37.4 15:38.3 15:39.2 15:40.0 15:40.9 15:41.8 15:42.6
Time
Data Throttle Position (%)
Output Current (A)
Figure 22: 80% Run 1 Throttle Position and Output Current vs. Time
Battery Voltage
0
5
10
15
20
25
30
35
40
45
15:33.1 15:34.0 15:34.8 15:35.7 15:36.6 15:37.4 15:38.3 15:39.2 15:40.0 15:40.9 15:41.8 15:42.6
Time
Voltage (V
)
Battery Voltage
Figure 23: 80% Run 1 Battery Voltage vs. Time

24 µEUV
Final Report
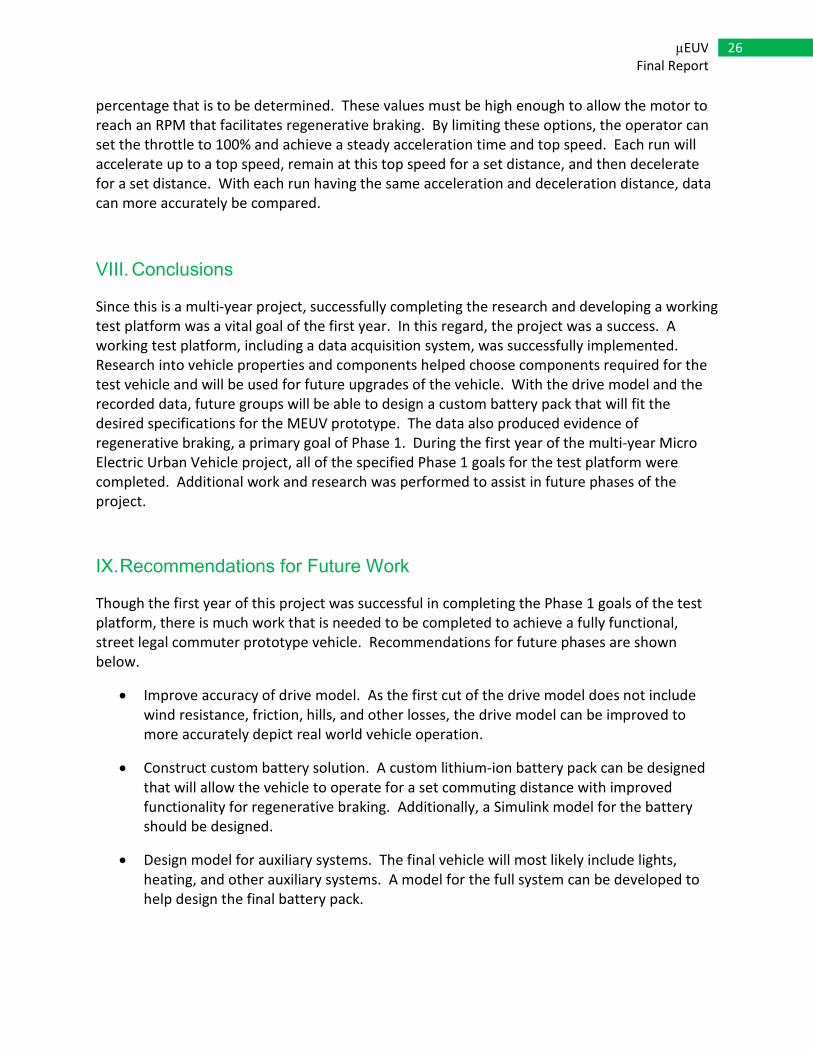
Run 2:
Run 2 with 80% Regen
0
50
100
150
200
250
300
350
19:13.4 19:17.8 19:22.1 19:26.4 19:30.7 19:35.0
Time
Data Throttle Position (%)
Output Current (A)
Figure 24: 80% Run 2 Throttle Position and Output Current vs. Time
Battery Voltage
0
5
10
15
20
25
30
35
40
45
19:13.4 19:17.8 19:22.1 19:26.4 19:30.7 19:35.0
Time
Voltage (V
)
Battery Voltage
Figure 25: 80% Run 2 Battery Voltage vs. Time
As shown in Figures 18 - 25, the accelerating test platform will draw up to approximately 300
amps for a very short period. While keeping a constant speed, the current averages to a
constant 240 amps. Voltage sag across the battery terminals is also observed during
acceleration. The minimum voltage is shown in Figure 25 as 30 volts. This is well above the
minimum cutoff voltage for the controller of 16 volts. Figures 18 and 24 show what appears to
be an absolute value of the regenerative current flowing from the motor to the batteries. This
is determined by observing how the throttle position, output current, and battery voltage
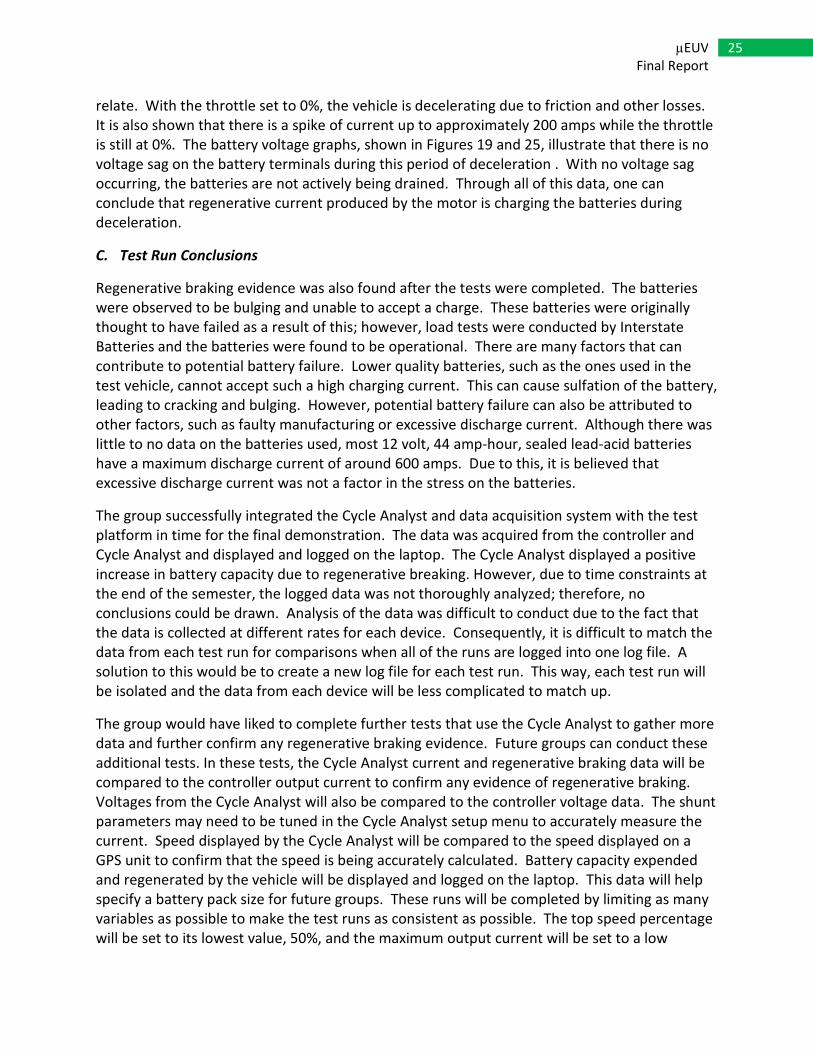
25 µEUV
Final Report
relate. With the throttle set to 0%, the vehicle is decelerating due to friction and other losses.
It is also shown that there is a spike of current up to approximately 200 amps while the throttle
is still at 0%. The battery voltage graphs, shown in Figures 19 and 25, illustrate that there is no
voltage sag on the battery terminals during this period of deceleration . With no voltage sag
occurring, the batteries are not actively being drained. Through all of this data, one can
conclude that regenerative current produced by the motor is charging the batteries during
deceleration.
C. Test Run Conclusions
Regenerative braking evidence was also found after the tests were completed. The batteries
were observed to be bulging and unable to accept a charge. These batteries were originally
thought to have failed as a result of this; however, load tests were conducted by Interstate
Batteries and the batteries were found to be operational. There are many factors that can
contribute to potential battery failure. Lower quality batteries, such as the ones used in the
test vehicle, cannot accept such a high charging current. This can cause sulfation of the battery,
leading to cracking and bulging. However, potential battery failure can also be attributed to
other factors, such as faulty manufacturing or excessive discharge current. Although there was
little to no data on the batteries used, most 12 volt, 44 amp-hour, sealed lead-acid batteries
have a maximum discharge current of around 600 amps. Due to this, it is believed that
excessive discharge current was not a factor in the stress on the batteries.
The group successfully integrated the Cycle Analyst and data acquisition system with the test
platform in time for the final demonstration. The data was acquired from the controller and
Cycle Analyst and displayed and logged on the laptop. The Cycle Analyst displayed a positive
increase in battery capacity due to regenerative breaking. However, due to time constraints at
the end of the semester, the logged data was not thoroughly analyzed; therefore, no
conclusions could be drawn. Analysis of the data was difficult to conduct due to the fact that
the data is collected at different rates for each device. Consequently, it is difficult to match the
data from each test run for comparisons when all of the runs are logged into one log file. A
solution to this would be to create a new log file for each test run. This way, each test run will
be isolated and the data from each device will be less complicated to match up.
The group would have liked to complete further tests that use the Cycle Analyst to gather more
data and further confirm any regenerative braking evidence. Future groups can conduct these
additional tests. In these tests, the Cycle Analyst current and regenerative braking data will be
compared to the controller output current to confirm any evidence of regenerative braking.
Voltages from the Cycle Analyst will also be compared to the controller voltage data. The shunt
parameters may need to be tuned in the Cycle Analyst setup menu to accurately measure the
current. Speed displayed by the Cycle Analyst will be compared to the speed displayed on a
GPS unit to confirm that the speed is being accurately calculated. Battery capacity expended
and regenerated by the vehicle will be displayed and logged on the laptop. This data will help
specify a battery pack size for future groups. These runs will be completed by limiting as many
variables as possible to make the test runs as consistent as possible. The top speed percentage
will be set to its lowest value, 50%, and the maximum output current will be set to a low
26 µEUV
Final Report
percentage that is to be determined. These values must be high enough to allow the motor to
reach an RPM that facilitates regenerative braking. By limiting these options, the operator can
set the throttle to 100% and achieve a steady acceleration time and top speed. Each run will
accelerate up to a top speed, remain at this top speed for a set distance, and then decelerate
for a set distance. With each run having the same acceleration and deceleration distance, data
can more accurately be compared.
VIII. Conclusions
Since this is a multi-year project, successfully completing the research and developing a working
test platform was a vital goal of the first year. In this regard, the project was a success. A
working test platform, including a data acquisition system, was successfully implemented.
Research into vehicle properties and components helped choose components required for the
test vehicle and will be used for future upgrades of the vehicle. With the drive model and the
recorded data, future groups will be able to design a custom battery pack that will fit the
desired specifications for the MEUV prototype. The data also produced evidence of
regenerative braking, a primary goal of Phase 1. During the first year of the multi-year Micro
Electric Urban Vehicle project, all of the specified Phase 1 goals for the test platform were
completed. Additional work and research was performed to assist in future phases of the
project.
IX. Recommendations for Future Work
Though the first year of this project was successful in completing the Phase 1 goals of the test
platform, there is much work that is needed to be completed to achieve a fully functional,
street legal commuter prototype vehicle. Recommendations for future phases are shown
below.
• Improve accuracy of drive model. As the first cut of the drive model does not include
wind resistance, friction, hills, and other losses, the drive model can be improved to
more accurately depict real world vehicle operation.
• Construct custom battery solution. A custom lithium-ion battery pack can be designed
that will allow the vehicle to operate for a set commuting distance with improved
functionality for regenerative braking. Additionally, a Simulink model for the battery
should be designed.
• Design model for auxiliary systems. The final vehicle will most likely include lights,
heating, and other auxiliary systems. A model for the full system can be developed to
help design the final battery pack.
27 µEUV
Final Report
• Design carbon emission-free charging system. The main goal of this vehicle is to be
completely carbon emission-free and as environmentally friendly as possible. To
completely remove carbon emissions, the vehicle’s batteries must not be charged using
utility power, as most of the electricity on the grid is generated by burning coal. By
designing a solar charging system, carbon emissions can be completely eliminated.
X. Applicable Standards and Related Patents
A. Applicable Standards:
i. U.S. Department of Energy – Illinois Electric Laws and Incentives5:
a. Neighborhood Vehicle Access to Roadways
Neighborhood vehicles may only be operated on streets if authorized by the local government
and where the posted speed limit is 35 miles per hour (mph) or less. Neighborhood vehicles are
allowed to cross a road or street at an intersection where the road or street has a posted speed
limit greater than 35 mph. Neighborhood vehicles are defined as self-propelled, electronically
powered, four-wheeled motor vehicles (or a self-propelled, gasoline-powered four-wheeled
motor vehicle with an engine displacement under 1,200 cubic centimeters) which are capable
of attaining in one mile a speed of more than 20 mph, but not more than 25 mph, and which
conform to federal regulations under Title 49 of the Code of Federal Regulations, Part 571.500.
(Reference 625 Illinois Compiled Statutes 5/11-1426.1)
ii. Underwriters Laboratories6:
a. Standard for Safety, Electric Vehicle (EV) Charging System Equipment, UL 2202
This Standard covers conductive and inductive charging system equipment intended to be
supplied by a branch circuit of 600 volts or less for recharging the storage batteries in over-the-
road EVs. In an inductive charging system, there is no direct metal-to-metal electrical
connection between the charger and the vehicle. Instead, electrical power is passed through an
electromagnetic field between the primary winding of a transformer, which is usually located
off board the vehicle, to the secondary winding of the transformer which is usually located on
board the vehicle. Conversely, in a conductive charging system, power is passed from the
charger to the vehicle though direct metal-to-metal contact by way of a coupler or a plug and
receptacle suitable for EV charging.
b. Standard for Safety, Personnel Protection Systems for EV Supply Circuits, UL 2231
This Standard covers devices and systems intended for use in accordance with the National
Electrical Code ® (American National Standards Institute/National Fire Protection Association
70), to reduce the risk of electric shock to the user from accessible parts, in grounded or
isolated circuits for charging EVs.
c. Standard for Safety, Plugs, Receptacles, and Couplers for EVs, UL 2251
28 µEUV
Final Report
This Standard covers plugs, receptacles, vehicle inlets, and connectors rated up to 800 amperes
and up to 600 volts ac or dc, intended for conductive connection systems, for use with EVs in
accordance with the National Electrical Code ® for either indoor or outdoor nonhazardous
locations.
iii. U.S. Department of Transportation7:
571.500 Standard No. 500; Low-speed Vehicles
571.305 Standard No. 305; Electric-powered vehicles: electrolyte spillage and electrical shock
protection.
iv. National Electric Code 2005 Edition8:
Article 625 – Electric Vehicle Charging Systems
B. Related Patents4:
Patent # Title
5,291,960 Hybrid electric vehicle regenerative braking energy recovery system
-Although patent refers to hybrid vehicles, this regenerative braking system
may also work for deep discharge batteries that are found in electric
vehicles.
5,585,209 Bipolar lead/acid batteries.
5,941,328 Electric vehicle with variable efficiency regenerative braking depending
upon battery charge state.
-As NiMH batteries must be charged at different rates depending on the
current state of charge, this patent may help with the difficulties of charging
a NiMH battery using regenerative braking.
6,037,751 Method and apparatus for charging batteries.
6,116,368 Electric vehicle with battery regeneration dependent on battery charge
state.
6,866,350 Regenerative braking on an electrical vehicle when towed.
7,455,133 Electric four-wheel drive vehicle and control unit for same.

29 µEUV
Final Report
30 µEUV
Final Report
XI. References
[1]. “National Household Travel Survey.” U.S. Department of Transportation.
http://www.bts.gov/programs/national_household_travel_survey/daily_travel
[2]. “Most of Us Still Drive to Work – Alone.” U.S. Census Bureau. Public Information Office.
June 13, 2007. http://www.census.gov/Press-
Release/www/releases/archives/american_community_survey_acs/010230.html
[3]. Buchmann, Isidor.“Battery Chemistries.” Battery University. 2003.
http://www.batteryuniversity.com/
[4]. Pesaran, Ahmad. “Battery Choices for Different Plug-in HEV Configurations”
[5]. Illinois Incentives and Laws. Alternative Fuels and Advanced Vehicles Data Center.
< http://www.afdc.energy.gov/afdc/progs/view_ind.php/IL/5994>
[6]. Electric Vehicle Components. Underwriter Laboratories.
<http://www.ul.com/global/eng/pages/offerings/services/components/electricvehicle/
evstandards/>
[7]. Code of Federal Regulations – Title 49: Transportation. U.S. Department of Transportation.
http://cfr.vlex.com/source/1098
[8]. National Electric Code 2005. National Fire Protection Association.
<http://bulk.resource.org/bsc.ca.gov/title24_part03_dice/title24_part03_page0560.pdf>
[9]. Free Patents Online. FreePatentsOnline.com. 2009.
<http://www.freepatentsonline.com/>

A-1 µEUV
Final Report
Appendix A:
Drive Model Equations:
User Selected Parameters:
• Curb Weight (kg)
• Trip Length (km)
• Stops
• Maximum Velocity (m/s)
• Acceleration Time (s)
• Wheel Radius (m)
Total Weight (kg)
150+CurbWeight (driver and load)
Average Velocity (m/s)
)1000)((
)])()()()(1[(#)]1000)([(
)1000)((
)])()()()(1[(# max21
maxmax21
max
TripLength
VTVStopsTripLength
TripLength
VTVStops accacc +−+
+
Acceleration (m/s2)
accT
Vmax
Total Kinetic Energy with % Loss (kJ)
+−
+++
1000
))(%)()([(*
)1000)((
)])()(1(#)1000)([(
1000
)]%1)(1)(#)()([(
2
max212
2
max21
LossVWeight
TripLength
TonAcceleratiStopsTripLength
LossStopsVWeight
Totalacc
Total
Steady State Energy with % Loss (kJ)
+−
1000
)])(%)()([(*
)1000)((
)])()(1(#)1000)([( 2
max212 LossVWeight
TripLength
TonAcceleratiStopsTripLength Totalacc
Steady State Power with % Loss (kW)
+−
max
2 )])()(1(#)1000)([(
)(
V
TonAcceleratiStopsTripLength
Energy
acc
SS
Peak Power (kW)

A-2 µEUV
Final Report
)1000)((
))(( 2
max
acc
total
T
VWeight
Force (N)
))(( onAcceleratiWeighttotal
Torque (N*m)
))(( sWheelRadiuForce
Peak Motor Power (kW)
)1000)(60(
))(2)(( sWheelRadiuTorque π
Wheel Speed (RPM)
))(2(
)60)(( max
sWheelRadiu
V
π

µEUV
Proposal
A-3
Drive Model Example:
Table A-1: Driving Model Example
3 6 17.9757 18 0 40 500 350
Acceleration (m/s²) Acceleration Time
(s) Average
Velocity
(m/s)
Max. Velocity
(m/s) Stops Trip Length
(km) Total Weight
(kg) Curb Weight
(kg)
0.0018225 113.35626 97.17813 89.089065 16.15626 8.07813 4.039065 81
Steady State
Power
with 5%
Loss (kW)
Total Kinetic
Energy
with 20%
Loss (kJ)
Total Kinetic
Energy
with 10%
Loss
(kJ)
Total Kinetic
Energy
with 5%
Loss (kJ)
Steady State
Energy
with 20%
Loss (kJ)
Steady State
Energy
with 10%
Loss (kJ)
Steady State
Energy
with 5%
Loss (kJ)
Kinetic
Energy
with 0%
Loss (kJ)
0.25 686.9694 26.96355 375 1500 27 0.00729 0.003645
Wheel
Radius
(m)
Avg. Wheel
Speed
(rpm)
Motor Power
(kW) Torque (N m) Force (N) Peak Power
(kW) Steady State
Power
with 20%
Loss (kW)
Steady State
Power
with 10%
Loss (kW)

B-1 µEUV
Final Report
Appendix B:
Data Sheets:
Maxim MAX232CPE+

B-2 µEUV
Final Report

C-1 µEUV
Final Report
Appendix C:
Data Acquisition Display Software Flowchart:
D-1 µEUV
Final Report
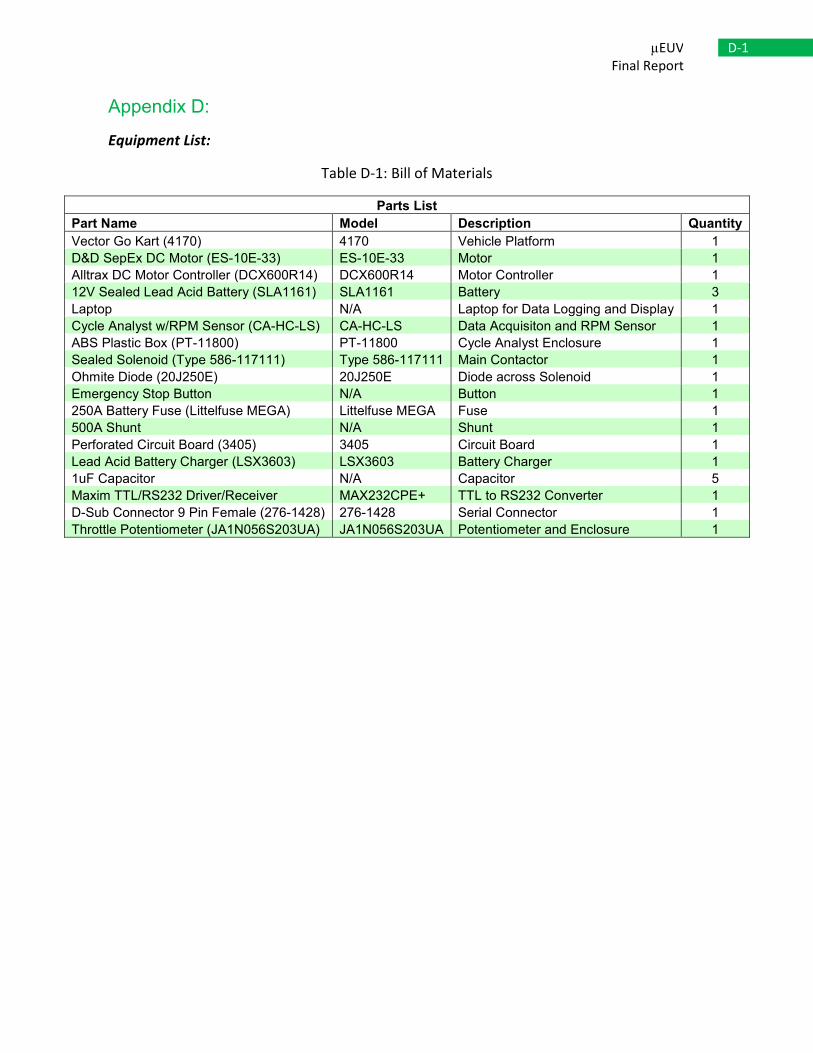
Appendix D:
Equipment List:
Table D-1: Bill of Materials
Parts List
Part Name Model Description Quantity
Vector Go Kart (4170) 4170 Vehicle Platform 1
D&D SepEx DC Motor (ES-10E-33) ES-10E-33 Motor 1
Alltrax DC Motor Controller (DCX600R14) DCX600R14 Motor Controller 1
12V Sealed Lead Acid Battery (SLA1161) SLA1161 Battery 3
Laptop N/A Laptop for Data Logging and Display 1
Cycle Analyst w/RPM Sensor (CA-HC-LS) CA-HC-LS Data Acquisiton and RPM Sensor 1
ABS Plastic Box (PT-11800) PT-11800 Cycle Analyst Enclosure 1
Sealed Solenoid (Type 586-117111) Type 586-117111 Main Contactor 1
Ohmite Diode (20J250E) 20J250E Diode across Solenoid 1
Emergency Stop Button N/A Button 1
250A Battery Fuse (Littelfuse MEGA) Littelfuse MEGA Fuse 1
500A Shunt N/A Shunt 1
Perforated Circuit Board (3405) 3405 Circuit Board 1
Lead Acid Battery Charger (LSX3603) LSX3603 Battery Charger 1
1uF Capacitor N/A Capacitor 5
Maxim TTL/RS232 Driver/Receiver MAX232CPE+ TTL to RS232 Converter 1
D-Sub Connector 9 Pin Female (276-1428) 276-1428 Serial Connector 1
Throttle Potentiometer (JA1N056S203UA) JA1N056S203UA Potentiometer and Enclosure 1

E-1 µEUV
Final Report
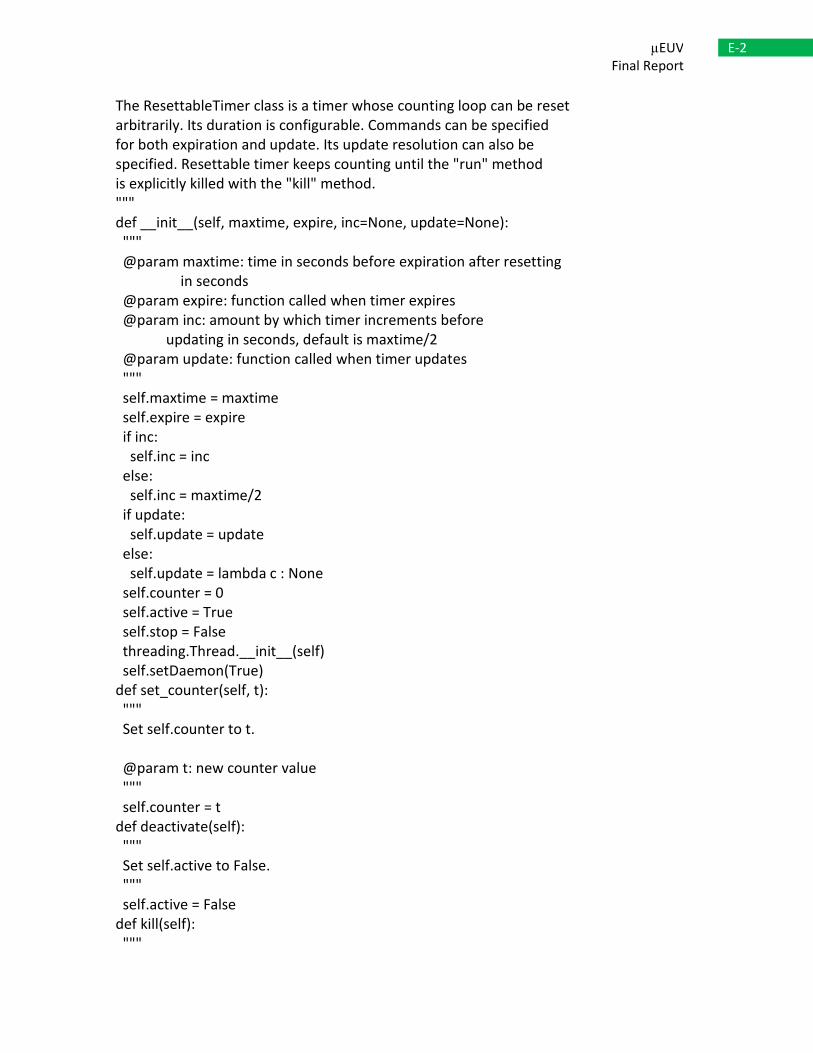
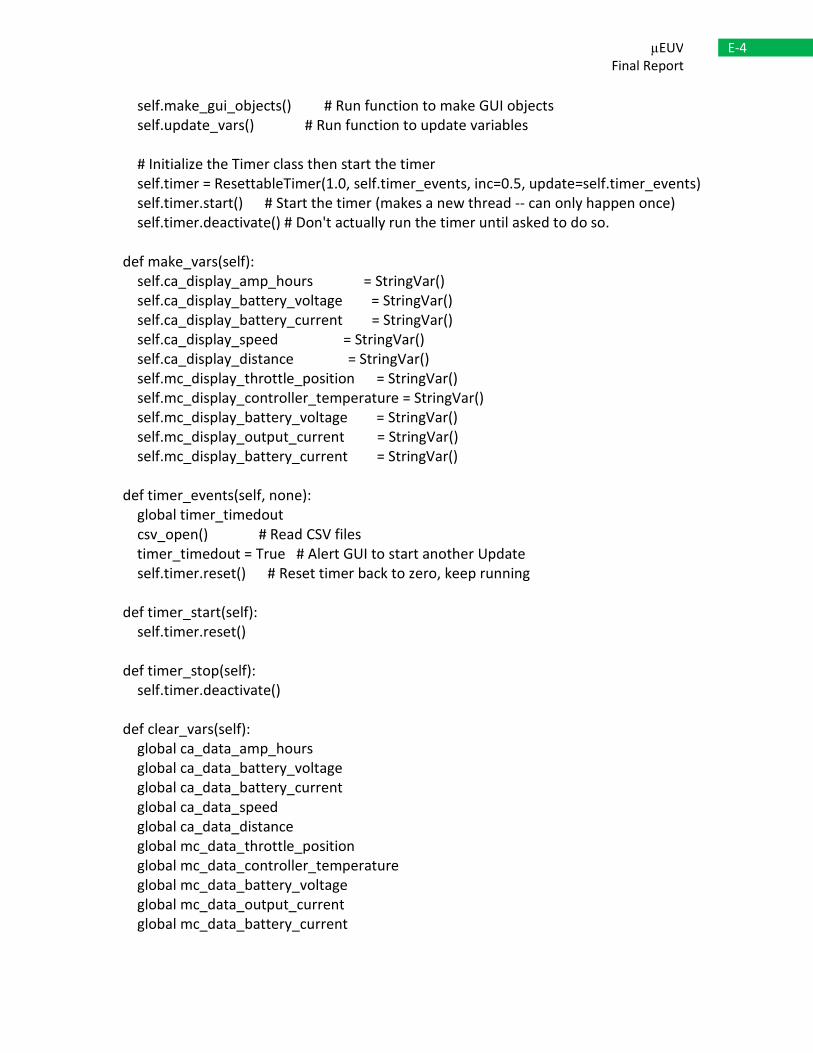
Appendix E:
Data Acquisition Display Software Code:
# Import python libraries and modules
import copy
import csv
import sys
import os
import time
import threading
from Tkinter import * # for rtTester class
# Define global string objects
ca_log_file = "cycleanalyst.csv"
mc_log_file = "controller.csv"
ca_data_amp_hours = ""
ca_data_battery_voltage = ""
ca_data_battery_current = ""
ca_data_speed = ""
ca_data_distance = ""
mc_data_throttle_position = ""
mc_data_controller_temperature = ""
mc_data_battery_voltage = ""
mc_data_output_current = ""
mc_data_battery_current = ""
mc_throttle_position_number = 0.0
mc_controller_temperature_number = 0.0
mc_battery_voltage_number = 0.0
mc_output_current_number = 0.0
mc_battery_current_number = 0.0
ca_amp_hours_number = 0.0
ca_battery_voltage_number = 0.0
ca_battery_current_number = 0.0
ca_speed_number = 0.0
ca_distance_number = 0.0
timer_timedout = True
# TIMER class provides a resettable timer
class ResettableTimer(threading.Thread):
"""
E-2 µEUV
Final Report
The ResettableTimer class is a timer whose counting loop can be reset
arbitrarily. Its duration is configurable. Commands can be specified
for both expiration and update. Its update resolution can also be
specified. Resettable timer keeps counting until the "run" method
is explicitly killed with the "kill" method.
"""
def __init__(self, maxtime, expire, inc=None, update=None):
"""
@param maxtime: time in seconds before expiration after resetting
in seconds
@param expire: function called when timer expires
@param inc: amount by which timer increments before
updating in seconds, default is maxtime/2
@param update: function called when timer updates
"""
self.maxtime = maxtime
self.expire = expire
if inc:
self.inc = inc
else:
self.inc = maxtime/2
if update:
self.update = update
else:
self.update = lambda c : None
self.counter = 0
self.active = True
self.stop = False
threading.Thread.__init__(self)
self.setDaemon(True)
def set_counter(self, t):
"""
Set self.counter to t.
@param t: new counter value
"""
self.counter = t
def deactivate(self):
"""
Set self.active to False.
"""
self.active = False
def kill(self):
"""

E-3 µEUV
Final Report
Will stop the counting loop before next update.
"""
self.stop = True
def reset(self):
"""
Fully rewinds the timer and makes the timer active, such that
the expire and update commands will be called when appropriate.
"""
self.counter = 0
self.active = True
def run(self):
"""
Run the timer loop.
"""
while True:
self.counter = 0
while self.counter < self.maxtime:
self.counter += self.inc
time.sleep(self.inc)
if self.stop:
return
if self.active:
self.update(self.counter)
if self.active:
self.expire()
self.active = True
class rtTester(Frame):
def __init__(self, master=None): # Initialization routine; runs upon instanciation
of the class
global ca_log_file
global mc_log_file
Frame.__init__(self, master) # New top-level frame w/ no master
top = self.winfo_toplevel()
top.rowconfigure(0, weight=1)
top.columnconfigure(0, weight=1)
self.grid(sticky=N+W, ipadx=10, ipady=10) # Make the frame visible on grid
print "Loading CSV file: " + mc_log_file
print "Loading CSV file: " + ca_log_file
csv_open() # Run CSV reading routine
self.make_vars() # Make new dynamic variables for use with the GUI objects
E-4 µEUV
Final Report
self.make_gui_objects() # Run function to make GUI objects
self.update_vars() # Run function to update variables
# Initialize the Timer class then start the timer
self.timer = ResettableTimer(1.0, self.timer_events, inc=0.5, update=self.timer_events)
self.timer.start() # Start the timer (makes a new thread -- can only happen once)
self.timer.deactivate() # Don't actually run the timer until asked to do so.
def make_vars(self):
self.ca_display_amp_hours = StringVar()
self.ca_display_battery_voltage = StringVar()
self.ca_display_battery_current = StringVar()
self.ca_display_speed = StringVar()
self.ca_display_distance = StringVar()
self.mc_display_throttle_position = StringVar()
self.mc_display_controller_temperature = StringVar()
self.mc_display_battery_voltage = StringVar()
self.mc_display_output_current = StringVar()
self.mc_display_battery_current = StringVar()
def timer_events(self, none):
global timer_timedout
csv_open() # Read CSV files
timer_timedout = True # Alert GUI to start another Update
self.timer.reset() # Reset timer back to zero, keep running
def timer_start(self):
self.timer.reset()
def timer_stop(self):
self.timer.deactivate()
def clear_vars(self):
global ca_data_amp_hours
global ca_data_battery_voltage
global ca_data_battery_current
global ca_data_speed
global ca_data_distance
global mc_data_throttle_position
global mc_data_controller_temperature
global mc_data_battery_voltage
global mc_data_output_current
global mc_data_battery_current

E-5 µEUV
Final Report
ca_data_amp_hours = "0.0"
ca_data_battery_voltage = "0.0"
ca_data_battery_current = "0.0"
ca_data_speed = "0.0"
ca_data_distance = "0.0"
mc_data_throttle_position = "0"
mc_data_controller_temperature = "0.0"
mc_data_battery_voltage = "0.0"
mc_data_output_current = "0.0"
mc_data_battery_current = "0.0"
self.redraw_mc_throttle_position_bar(0)
self.redraw_mc_controller_temperature_bar(0)
self.redraw_mc_battery_voltage_bar(0)
self.redraw_mc_output_current_bar(0)
self.redraw_mc_battery_current_bar(0)
self.redraw_ca_amp_hours_bar(0)
self.redraw_ca_battery_voltage_bar(0)
self.redraw_ca_battery_current_bar(0)
self.redraw_ca_speed_bar(0)
self.redraw_ca_distance_bar(0)
self.throttle_position.itemconfig (self.throttle_position_value,
text=mc_data_throttle_position)
self.controller_temperature.itemconfig (self.controller_temperature_value,
text=mc_data_controller_temperature)
self.battery_voltage.itemconfig (self.battery_voltage_value,
text=mc_data_battery_voltage)
self.output_current.itemconfig (self.output_current_value,
text=mc_data_output_current)
self.battery_current.itemconfig (self.battery_current_value,
text=mc_data_battery_current)
self.amp_hours.itemconfig (self.amp_hours_value, text=ca_data_amp_hours)
self.battery_voltage_ca.itemconfig (self.battery_voltage_ca_value,
text=ca_data_battery_voltage)
self.battery_current_ca.itemconfig (self.battery_current_ca_value,
text=ca_data_battery_current)
self.speed.itemconfig (self.speed_value, text=ca_data_speed)
self.distance.itemconfig (self.distance_value, text=ca_data_distance)
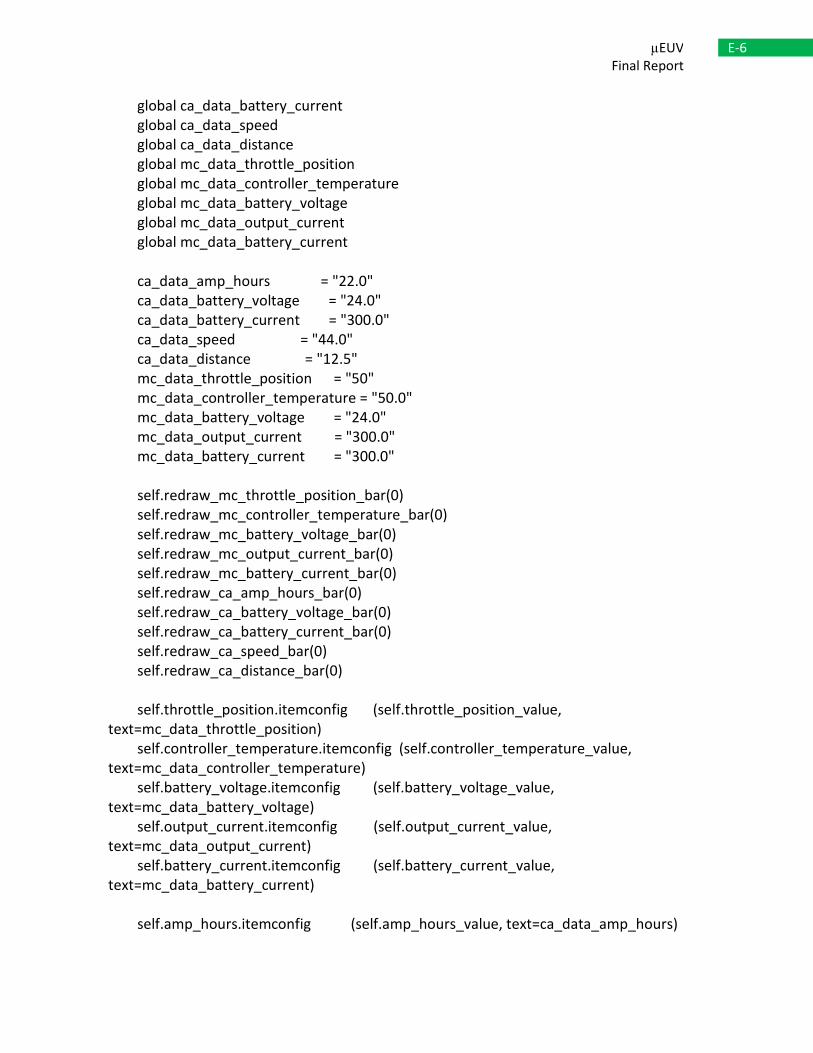
def demo_vars(self):
global ca_data_amp_hours
global ca_data_battery_voltage
E-6 µEUV
Final Report
global ca_data_battery_current
global ca_data_speed
global ca_data_distance
global mc_data_throttle_position
global mc_data_controller_temperature
global mc_data_battery_voltage
global mc_data_output_current
global mc_data_battery_current
ca_data_amp_hours = "22.0"
ca_data_battery_voltage = "24.0"
ca_data_battery_current = "300.0"
ca_data_speed = "44.0"
ca_data_distance = "12.5"
mc_data_throttle_position = "50"
mc_data_controller_temperature = "50.0"
mc_data_battery_voltage = "24.0"
mc_data_output_current = "300.0"
mc_data_battery_current = "300.0"
self.redraw_mc_throttle_position_bar(0)
self.redraw_mc_controller_temperature_bar(0)
self.redraw_mc_battery_voltage_bar(0)
self.redraw_mc_output_current_bar(0)
self.redraw_mc_battery_current_bar(0)
self.redraw_ca_amp_hours_bar(0)
self.redraw_ca_battery_voltage_bar(0)
self.redraw_ca_battery_current_bar(0)
self.redraw_ca_speed_bar(0)
self.redraw_ca_distance_bar(0)
self.throttle_position.itemconfig (self.throttle_position_value,
text=mc_data_throttle_position)
self.controller_temperature.itemconfig (self.controller_temperature_value,
text=mc_data_controller_temperature)
self.battery_voltage.itemconfig (self.battery_voltage_value,
text=mc_data_battery_voltage)
self.output_current.itemconfig (self.output_current_value,
text=mc_data_output_current)
self.battery_current.itemconfig (self.battery_current_value,
text=mc_data_battery_current)
self.amp_hours.itemconfig (self.amp_hours_value, text=ca_data_amp_hours)

E-7 µEUV
Final Report
self.battery_voltage_ca.itemconfig (self.battery_voltage_ca_value,
text=ca_data_battery_voltage)
self.battery_current_ca.itemconfig (self.battery_current_ca_value,
text=ca_data_battery_current)
self.speed.itemconfig (self.speed_value, text=ca_data_speed)
self.distance.itemconfig (self.distance_value, text=ca_data_distance)
def update_vars(self):
global ca_data_amp_hours
global ca_data_battery_voltage
global ca_data_battery_current
global ca_data_speed
global ca_data_distance
global mc_data_throttle_position
global mc_data_controller_temperature
global mc_data_battery_voltage
global mc_data_output_current
global mc_data_battery_current
global timer_timedout
# Always redraw the "idler" box to keep this function
# able to re-enter it self (cheap threading!)
self.redraw_idler(0)
if timer_timedout == True:
# Call the functions to redraw the "bars"
self.redraw_mc_throttle_position_bar(0)
self.redraw_mc_controller_temperature_bar(0)
self.redraw_mc_battery_voltage_bar(0)
self.redraw_mc_output_current_bar(0)
self.redraw_mc_battery_current_bar(0)
self.redraw_ca_amp_hours_bar(0)
self.redraw_ca_battery_voltage_bar(0)
self.redraw_ca_battery_current_bar(0)
self.redraw_ca_speed_bar(0)
self.redraw_ca_distance_bar(0)
self.throttle_position.itemconfig (self.throttle_position_value,
text=mc_data_throttle_position)
self.controller_temperature.itemconfig (self.controller_temperature_value,
text=mc_data_controller_temperature)
self.battery_voltage.itemconfig (self.battery_voltage_value,
text=mc_data_battery_voltage)

E-8 µEUV
Final Report
self.output_current.itemconfig (self.output_current_value,
text=mc_data_output_current)
self.battery_current.itemconfig (self.battery_current_value,
text=mc_data_battery_current)
self.amp_hours.itemconfig (self.amp_hours_value, text=ca_data_amp_hours)
self.battery_voltage_ca.itemconfig (self.battery_voltage_ca_value,
text=ca_data_battery_voltage)
self.battery_current_ca.itemconfig (self.battery_current_ca_value,
text=ca_data_battery_current)
self.speed.itemconfig (self.speed_value, text=ca_data_speed)
self.distance.itemconfig (self.distance_value, text=ca_data_distance)
timer_timedout = False
# Check if the GUI needs updating every 250mS
self.idler.after(250, self.update_vars) #--> Gui update speed only
def redraw_idler(self, init):
# If this is the FIRST time drawing the bar, don't try to remove it!!!
if (init==0): self.idler.grid_remove()
##== VEHICLE DISTANCE BLOCK (Cycle Analyst)
========================================
self.idler = Canvas (self, height=1, width=1)
self.idler.grid (row=5, column=7, columnspan=1)
##== THROTTLE POSITION BLOCK ========================================
def redraw_mc_throttle_position_bar(self, init):
global mc_data_throttle_position
global mc_throttle_position_number
# convert string to actual numerical value in base 10
if (mc_data_throttle_position != "" != " "):
mc_throttle_position_number = float(mc_data_throttle_position)
throttlepercent = (mc_throttle_position_number / 100.0)
xi = 37
yi = 35
yf = 50
xf = int((300 - xi) * throttlepercent)
xf = xf + 37
# If this is the FIRST time drawing the bar, don't try to remove it!!!
if (init == 0): self.throttle_position.grid_remove()
E-9 µEUV
Final Report
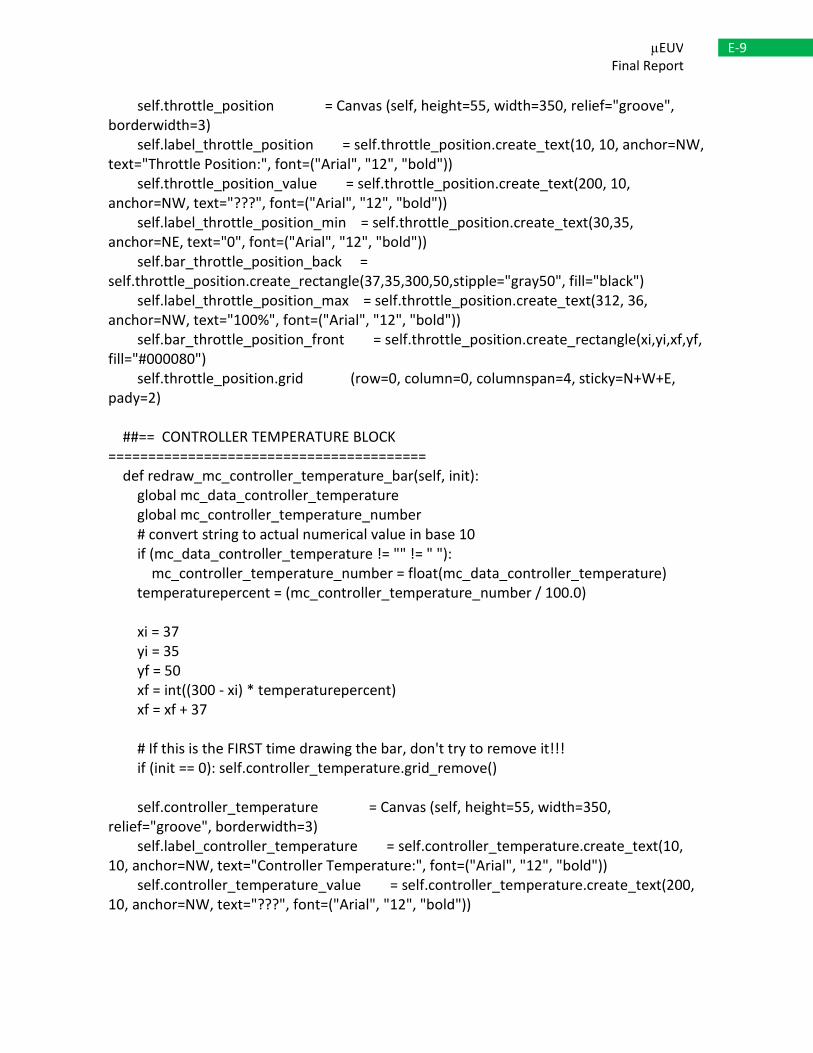
self.throttle_position = Canvas (self, height=55, width=350, relief="groove",
borderwidth=3)
self.label_throttle_position = self.throttle_position.create_text(10, 10, anchor=NW,
text="Throttle Position:", font=("Arial", "12", "bold"))
self.throttle_position_value = self.throttle_position.create_text(200, 10,
anchor=NW, text="???", font=("Arial", "12", "bold"))
self.label_throttle_position_min = self.throttle_position.create_text(30,35,
anchor=NE, text="0", font=("Arial", "12", "bold"))
self.bar_throttle_position_back =
self.throttle_position.create_rectangle(37,35,300,50,stipple="gray50", fill="black")
self.label_throttle_position_max = self.throttle_position.create_text(312, 36,
anchor=NW, text="100%", font=("Arial", "12", "bold"))
self.bar_throttle_position_front = self.throttle_position.create_rectangle(xi,yi,xf,yf,
fill="#000080")
self.throttle_position.grid (row=0, column=0, columnspan=4, sticky=N+W+E,
pady=2)
##== CONTROLLER TEMPERATURE BLOCK
========================================
def redraw_mc_controller_temperature_bar(self, init):
global mc_data_controller_temperature
global mc_controller_temperature_number
# convert string to actual numerical value in base 10
if (mc_data_controller_temperature != "" != " "):
mc_controller_temperature_number = float(mc_data_controller_temperature)
temperaturepercent = (mc_controller_temperature_number / 100.0)
xi = 37
yi = 35
yf = 50
xf = int((300 - xi) * temperaturepercent)
xf = xf + 37
# If this is the FIRST time drawing the bar, don't try to remove it!!!
if (init == 0): self.controller_temperature.grid_remove()
self.controller_temperature = Canvas (self, height=55, width=350,
relief="groove", borderwidth=3)
self.label_controller_temperature = self.controller_temperature.create_text(10,
10, anchor=NW, text="Controller Temperature:", font=("Arial", "12", "bold"))
self.controller_temperature_value = self.controller_temperature.create_text(200,
10, anchor=NW, text="???", font=("Arial", "12", "bold"))

E-10 µEUV
Final Report
self.label_controller_temperature_min =
self.controller_temperature.create_text(30,35, anchor=NE, text="0", font=("Arial", "12",
"bold"))
self.bar_controller_temperature_back =
self.controller_temperature.create_rectangle(37,35,300,50,stipple="gray50", fill="black")
self.label_controller_temperature_max =
self.controller_temperature.create_text(312, 36, anchor=NW, text="100C", font=("Arial",
"12", "bold"))
self.bar_controller_temperature_front =
self.controller_temperature.create_rectangle(xi,yi,xf,yf, fill="#804000")
self.controller_temperature.grid (row=1, column=0, columnspan=4,
sticky=N+W+E, pady=2)
##== BATTERY VOLTAGE BLOCK ========================================
def redraw_mc_battery_voltage_bar(self, init):
global mc_data_battery_voltage
global mc_battery_voltage_number
# convert string to actual numerical value in base 10
if (mc_data_battery_voltage != "" != " "):
mc_battery_voltage_number = float(mc_data_battery_voltage)
voltagepercent = (mc_battery_voltage_number / 48.0)
xi = 37
yi = 35
yf = 50
xf = int((300 - xi) * voltagepercent)
xf = xf + 37
# If this is the FIRST time drawing the bar, don't try to remove it!!!
if (init == 0): self.battery_voltage.grid_remove()
self.battery_voltage = Canvas (self, height=55, width=350, relief="groove",
borderwidth=3)
self.label_battery_voltage = self.battery_voltage.create_text(10, 10, anchor=NW,
text="Battery Voltage:", font=("Arial", "12", "bold"))
self.battery_voltage_value = self.battery_voltage.create_text(200, 10, anchor=NW,
text="???", font=("Arial", "12", "bold"))
self.label_battery_voltage_min = self.battery_voltage.create_text(30,35, anchor=NE,
text="0", font=("Arial", "12", "bold"))
self.bar_battery_voltage_back =
self.battery_voltage.create_rectangle(37,35,300,50,stipple="gray50", fill="black")
self.label_battery_voltage_max = self.battery_voltage.create_text(312, 36,
anchor=NW, text="48V", font=("Arial", "12", "bold"))
E-11 µEUV
Final Report
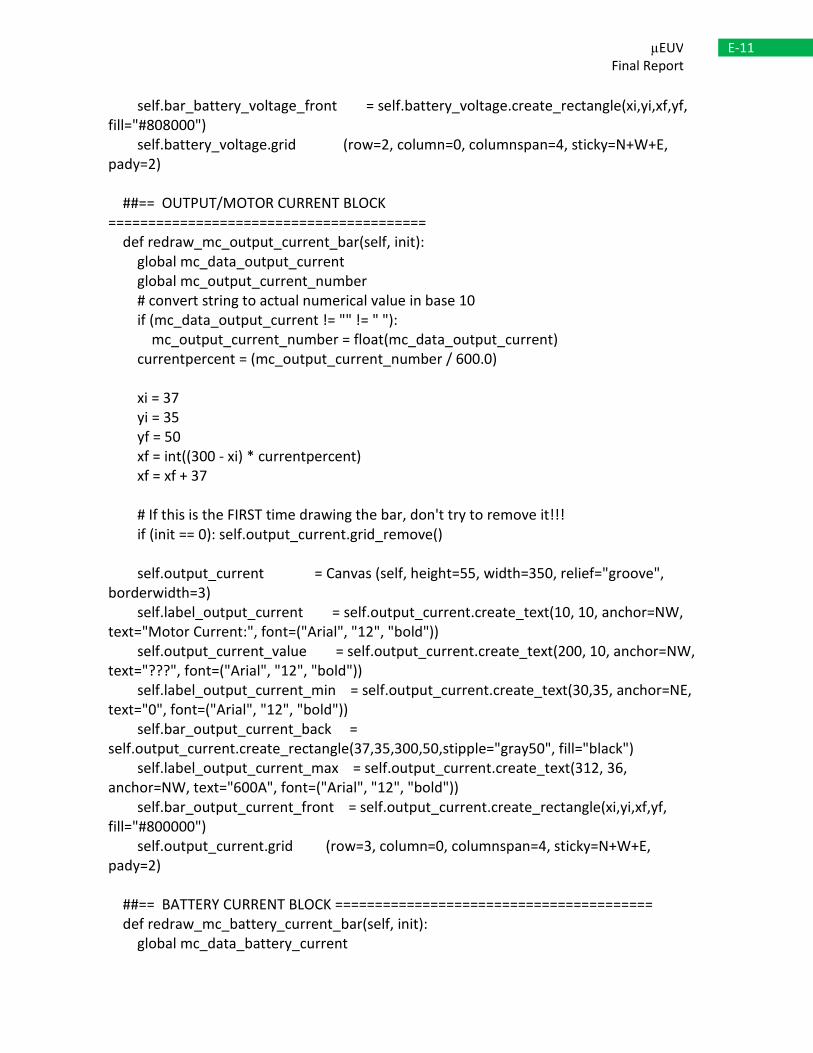
self.bar_battery_voltage_front = self.battery_voltage.create_rectangle(xi,yi,xf,yf,
fill="#808000")
self.battery_voltage.grid (row=2, column=0, columnspan=4, sticky=N+W+E,
pady=2)
##== OUTPUT/MOTOR CURRENT BLOCK
========================================
def redraw_mc_output_current_bar(self, init):
global mc_data_output_current
global mc_output_current_number
# convert string to actual numerical value in base 10
if (mc_data_output_current != "" != " "):
mc_output_current_number = float(mc_data_output_current)
currentpercent = (mc_output_current_number / 600.0)
xi = 37
yi = 35
yf = 50
xf = int((300 - xi) * currentpercent)
xf = xf + 37
# If this is the FIRST time drawing the bar, don't try to remove it!!!
if (init == 0): self.output_current.grid_remove()
self.output_current = Canvas (self, height=55, width=350, relief="groove",
borderwidth=3)
self.label_output_current = self.output_current.create_text(10, 10, anchor=NW,
text="Motor Current:", font=("Arial", "12", "bold"))
self.output_current_value = self.output_current.create_text(200, 10, anchor=NW,
text="???", font=("Arial", "12", "bold"))
self.label_output_current_min = self.output_current.create_text(30,35, anchor=NE,
text="0", font=("Arial", "12", "bold"))
self.bar_output_current_back =
self.output_current.create_rectangle(37,35,300,50,stipple="gray50", fill="black")
self.label_output_current_max = self.output_current.create_text(312, 36,
anchor=NW, text="600A", font=("Arial", "12", "bold"))
self.bar_output_current_front = self.output_current.create_rectangle(xi,yi,xf,yf,
fill="#800000")
self.output_current.grid (row=3, column=0, columnspan=4, sticky=N+W+E,
pady=2)
##== BATTERY CURRENT BLOCK ========================================
def redraw_mc_battery_current_bar(self, init):
global mc_data_battery_current
E-12 µEUV
Final Report
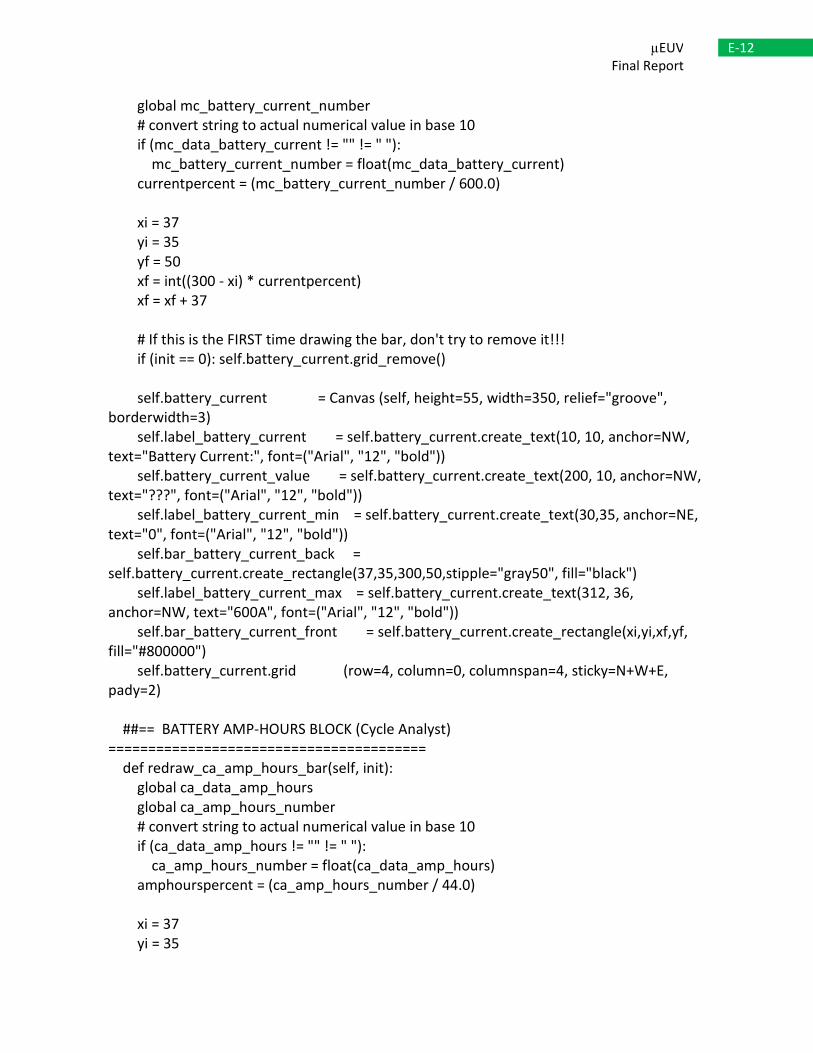
global mc_battery_current_number
# convert string to actual numerical value in base 10
if (mc_data_battery_current != "" != " "):
mc_battery_current_number = float(mc_data_battery_current)
currentpercent = (mc_battery_current_number / 600.0)
xi = 37
yi = 35
yf = 50
xf = int((300 - xi) * currentpercent)
xf = xf + 37
# If this is the FIRST time drawing the bar, don't try to remove it!!!
if (init == 0): self.battery_current.grid_remove()
self.battery_current = Canvas (self, height=55, width=350, relief="groove",
borderwidth=3)
self.label_battery_current = self.battery_current.create_text(10, 10, anchor=NW,
text="Battery Current:", font=("Arial", "12", "bold"))
self.battery_current_value = self.battery_current.create_text(200, 10, anchor=NW,
text="???", font=("Arial", "12", "bold"))
self.label_battery_current_min = self.battery_current.create_text(30,35, anchor=NE,
text="0", font=("Arial", "12", "bold"))
self.bar_battery_current_back =
self.battery_current.create_rectangle(37,35,300,50,stipple="gray50", fill="black")
self.label_battery_current_max = self.battery_current.create_text(312, 36,
anchor=NW, text="600A", font=("Arial", "12", "bold"))
self.bar_battery_current_front = self.battery_current.create_rectangle(xi,yi,xf,yf,
fill="#800000")
self.battery_current.grid (row=4, column=0, columnspan=4, sticky=N+W+E,
pady=2)
##== BATTERY AMP-HOURS BLOCK (Cycle Analyst)
========================================
def redraw_ca_amp_hours_bar(self, init):
global ca_data_amp_hours
global ca_amp_hours_number
# convert string to actual numerical value in base 10
if (ca_data_amp_hours != "" != " "):
ca_amp_hours_number = float(ca_data_amp_hours)
amphourspercent = (ca_amp_hours_number / 44.0)
xi = 37
yi = 35

E-13 µEUV
Final Report
yf = 50
xf = int((300 - xi) * amphourspercent)
xf = xf + 37
# If this is the FIRST time drawing the bar, don't try to remove it!!!
if (init == 0): self.amp_hours.grid_remove()
self.amp_hours = Canvas (self, height=55, width=360, relief="groove",
borderwidth=3)
self.label_amp_hours = self.amp_hours.create_text(10, 10, anchor=NW,
text="Battery Amp-hours:", font=("Arial", "12", "bold"))
self.amp_hours_value = self.amp_hours.create_text(200, 10, anchor=NW,
text="???", font=("Arial", "12", "bold"))
self.label_amp_hours_min = self.amp_hours.create_text(30,35, anchor=NE, text="0",
font=("Arial", "12", "bold"))
self.bar_amp_hours_back =
self.amp_hours.create_rectangle(37,35,300,50,stipple="gray50", fill="black")
self.label_amp_hours_max = self.amp_hours.create_text(312, 36, anchor=NW,
text="44Ah", font=("Arial", "12", "bold"))
self.bar_amp_hours_front = self.amp_hours.create_rectangle(xi,yi,xf,yf,
fill="#008000")
self.amp_hours.grid (row=0, column=4, columnspan=4, sticky=N+W+E, pady=2)
##== BATTERY VOLTAGE BLOCK (Cycle Analyst)
========================================
def redraw_ca_battery_voltage_bar(self, init):
global ca_data_battery_voltage
global ca_battery_voltage_number
# convert string to actual numerical value in base 10
if (ca_data_battery_voltage != "" != " "):
ca_battery_voltage_number = float(ca_data_battery_voltage)
voltagepercent = (ca_battery_voltage_number / 48.0)
xi = 37
yi = 35
yf = 50
xf = int((300 - xi) * voltagepercent)
xf = xf + 37
# If this is the FIRST time drawing the bar, don't try to remove it!!!
if (init == 0): self.battery_voltage_ca.grid_remove()
self.battery_voltage_ca = Canvas (self, height=55, width=350, relief="groove",
borderwidth=3)

E-14 µEUV
Final Report
self.label_battery_voltage_ca = self.battery_voltage_ca.create_text(10, 10,
anchor=NW, text="Battery Voltage:", font=("Arial", "12", "bold"))
self.battery_voltage_ca_value = self.battery_voltage_ca.create_text(200, 10,
anchor=NW, text="???", font=("Arial", "12", "bold"))
self.label_battery_voltage_ca_min = self.battery_voltage_ca.create_text(30,35,
anchor=NE, text="0", font=("Arial", "12", "bold"))
self.bar_battery_voltage_ca_back =
self.battery_voltage_ca.create_rectangle(37,35,300,50,stipple="gray50", fill="black")
self.label_battery_voltage_ca_max = self.battery_voltage_ca.create_text(312, 36,
anchor=NW, text="48V", font=("Arial", "12", "bold"))
self.bar_battery_voltage_ca_front =
self.battery_voltage_ca.create_rectangle(xi,yi,xf,yf, fill="#808000")
self.battery_voltage_ca.grid (row=1, column=4, columnspan=4, sticky=N+W+E,
pady=2)
##== BATTERY CURRENT BLOCK (Cycle Analyst)
========================================
def redraw_ca_battery_current_bar(self, init):
global ca_data_battery_current
global ca_battery_current_number
# convert string to actual numerical value in base 10
if (ca_data_battery_current != "" != " "):
ca_battery_current_number = float(ca_data_battery_current)
currentpercent = (ca_battery_current_number / 600.0)
xi = 37
yi = 35
yf = 50
xf = int((300 - xi) * currentpercent)
xf = xf + 37
# If this is the FIRST time drawing the bar, don't try to remove it!!!
if (init == 0): self.battery_current_ca.grid_remove()
self.battery_current_ca = Canvas (self, height=55, width=350, relief="groove",
borderwidth=3)
self.label_battery_current_ca = self.battery_current_ca.create_text(10, 10,
anchor=NW, text="Battery Current:", font=("Arial", "12", "bold"))
self.battery_current_ca_value = self.battery_current_ca.create_text(200, 10,
anchor=NW, text="???", font=("Arial", "12", "bold"))
self.label_battery_current_ca_min = self.battery_current_ca.create_text(30,35,
anchor=NE, text="0", font=("Arial", "12", "bold"))
self.bar_battery_current_ca_back =
self.battery_current_ca.create_rectangle(37,35,300,50,stipple="gray50", fill="black")

E-15 µEUV
Final Report
self.label_battery_current_ca_max = self.battery_current_ca.create_text(312, 36,
anchor=NW, text="600A", font=("Arial", "12", "bold"))
self.bar_battery_current_ca_front =
self.battery_current_ca.create_rectangle(xi,yi,xf,yf, fill="#800000")
self.battery_current_ca.grid (row=2, column=4, columnspan=4, sticky=N+W+E,
pady=2)
##== VEHICLE SPEED BLOCK (Cycle Analyst)
========================================
def redraw_ca_speed_bar(self, init):
global ca_data_speed
global ca_speed_number
# convert string to actual numerical value in base 10
if (ca_data_speed != "" != " "):
ca_speed_number = float(ca_data_speed)
speedpercent = (ca_speed_number / 88.0)
xi = 37
yi = 35
yf = 50
xf = int((300 - xi) * speedpercent)
xf = xf + 37
# If this is the FIRST time drawing the bar, don't try to remove it!!!
if (init == 0): self.speed.grid_remove()
self.speed = Canvas (self, height=55, width=350, relief="groove",
borderwidth=3)
self.label_speed = self.speed.create_text(10, 10, anchor=NW, text="Vehicle
Speed:", font=("Arial", "12", "bold"))
self.speed_value = self.speed.create_text(200, 10, anchor=NW, text="???",
font=("Arial", "12", "bold"))
self.label_speed_min = self.speed.create_text(30,35, anchor=NE, text="0",
font=("Arial", "12", "bold"))
self.bar_speed_back = self.speed.create_rectangle(37,35,300,50,stipple="gray50",
fill="black")
self.label_speed_max = self.speed.create_text(312, 36, anchor=NW, text="88mph",
font=("Arial", "12", "bold"))
self.bar_speed_front = self.speed.create_rectangle(xi,yi,xf,yf, fill="#000080")
self.speed.grid (row=3, column=4, columnspan=4, sticky=N+W+E, pady=2)
##== VEHICLE DISTANCE BLOCK (Cycle Analyst)
========================================
def redraw_ca_distance_bar(self, init):

E-16 µEUV
Final Report
global ca_data_distance
global ca_distance_number
# convert string to actual numerical value in base 10
if (ca_data_distance != "" != " "):
ca_distance_number = float(ca_data_distance)
distancepercent = (ca_distance_number / 25.0)
xi = 37
yi = 35
yf = 50
xf = int((300 - xi) * distancepercent)
xf = xf + 37
# If this is the FIRST time drawing the bar, don't try to remove it!!!
if (init == 0): self.distance.grid_remove()
self.distance = Canvas (self, height=55, width=350, relief="groove",
borderwidth=3)
self.label_distance = self.distance.create_text(10, 10, anchor=NW, text="Distance
Traveled:", font=("Arial", "12", "bold"))
self.distance_value = self.distance.create_text(200, 10, anchor=NW, text="???",
font=("Arial", "12", "bold"))
self.label_distance_min = self.distance.create_text(30,35, anchor=NE, text="0",
font=("Arial", "12", "bold"))
self.bar_distance_back =
self.distance.create_rectangle(37,35,300,50,stipple="gray50", fill="black")
self.label_distance_max = self.distance.create_text(312, 36, anchor=NW,
text="25mi", font=("Arial", "12", "bold"))
self.bar_distance_front = self.distance.create_rectangle(xi,yi,xf,yf, fill="#000080")
self.distance.grid (row=4, column=4, columnspan=4, sticky=N+W+E, pady=2)
def make_gui_objects(self):
## LEAVE IT ALONE FROM HERE --->
self.redraw_idler(1)
self.redraw_mc_throttle_position_bar(1)
self.redraw_mc_controller_temperature_bar(1)
self.redraw_mc_battery_voltage_bar(1)
self.redraw_mc_output_current_bar(1)
self.redraw_mc_battery_current_bar(1)
self.redraw_ca_amp_hours_bar(1)
self.redraw_ca_battery_voltage_bar(1)
self.redraw_ca_battery_current_bar(1)
self.redraw_ca_speed_bar(1)
self.redraw_ca_distance_bar(1)

E-17 µEUV
Final Report
##== APPLICATION CONTROL BUTTONS
============================================
self.button_start = Button (self, height=1, padx=10, pady=10, anchor=CENTER,
text="Start", foreground="#005500", activeforeground="#00CC00",
command=self.timer_start)
self.button_start.grid (row=5, column=0, sticky=W+E+N+S, padx=5, pady=3)
self.button_stop = Button (self, height=1, padx=10, pady=10, anchor=CENTER,
text="Stop", foreground="#555500", activeforeground="#AA9900",
command=self.timer_stop)
self.button_stop.grid (row=5, column=1, sticky=W+E+N+S, padx=5, pady=3)
self.button_clear = Button (self, height=1, padx=10, pady=10, anchor=CENTER,
text="Clear", foreground="#000055", activeforeground="#0000CC",
command=self.clear_vars)
self.button_clear.grid (row=5, column=2, sticky=W+E+N+S, padx=5, pady=3)
self.button_demo = Button (self, height=1, padx=10, pady=10, anchor=CENTER,
text="Demo", foreground="#000055", activeforeground="#0000CC",
command=self.demo_vars)
self.button_demo.grid (row=5, column=3, sticky=W+E+N+S, padx=5, pady=3)
self.button_exit = Button (self, height=1, padx=10, pady=10, anchor=CENTER,
text="Exit", foreground="#550000", activeforeground="#CC0000", command=quit_app)
self.button_exit.grid (row=5, column=4, sticky=W+E+N+S, padx=5, pady=3)
self.image=PhotoImage(file="meuv_icon.gif")
self.logo_image=Canvas(self, width=115, height=50)
self.logo_image.create_image(58, 5, image=self.image, anchor=NW)
self.logo_image.grid(row=5, column=5, columnspan=3, sticky=N+S+E+W)
def quit_app():
sys.exit(0) # Exit normally
def csv_open():
global ca_log_file
global mc_log_file
global ca_data_amp_hours
global ca_data_battery_voltage
global ca_data_battery_current
global ca_data_speed
global ca_data_distance
global mc_data_throttle_position
global mc_data_controller_temperature
global mc_data_battery_voltage
global mc_data_output_current
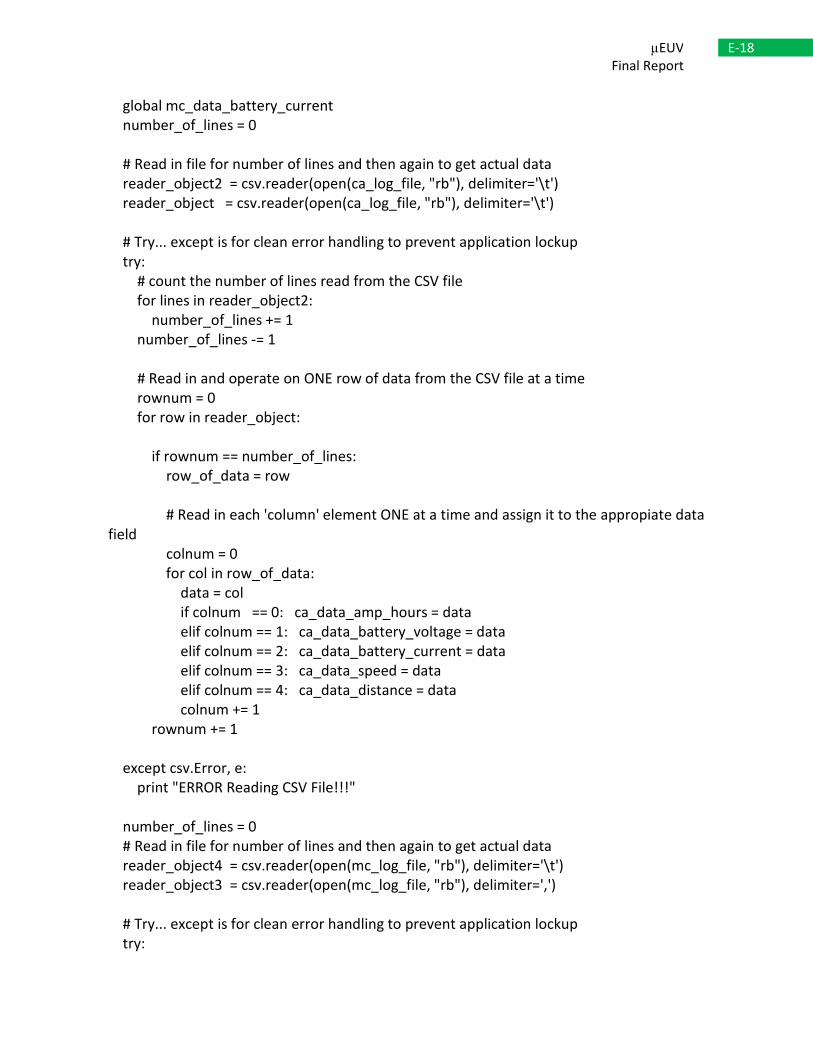
E-18 µEUV
Final Report
global mc_data_battery_current
number_of_lines = 0
# Read in file for number of lines and then again to get actual data
reader_object2 = csv.reader(open(ca_log_file, "rb"), delimiter='\t')
reader_object = csv.reader(open(ca_log_file, "rb"), delimiter='\t')
# Try... except is for clean error handling to prevent application lockup
try:
# count the number of lines read from the CSV file
for lines in reader_object2:
number_of_lines += 1
number_of_lines -= 1
# Read in and operate on ONE row of data from the CSV file at a time
rownum = 0
for row in reader_object:
if rownum == number_of_lines:
row_of_data = row
# Read in each 'column' element ONE at a time and assign it to the appropiate data
field
colnum = 0
for col in row_of_data:
data = col
if colnum == 0: ca_data_amp_hours = data
elif colnum == 1: ca_data_battery_voltage = data
elif colnum == 2: ca_data_battery_current = data
elif colnum == 3: ca_data_speed = data
elif colnum == 4: ca_data_distance = data
colnum += 1
rownum += 1
except csv.Error, e:
print "ERROR Reading CSV File!!!"
number_of_lines = 0
# Read in file for number of lines and then again to get actual data
reader_object4 = csv.reader(open(mc_log_file, "rb"), delimiter='\t')
reader_object3 = csv.reader(open(mc_log_file, "rb"), delimiter=',')
# Try... except is for clean error handling to prevent application lockup
try:
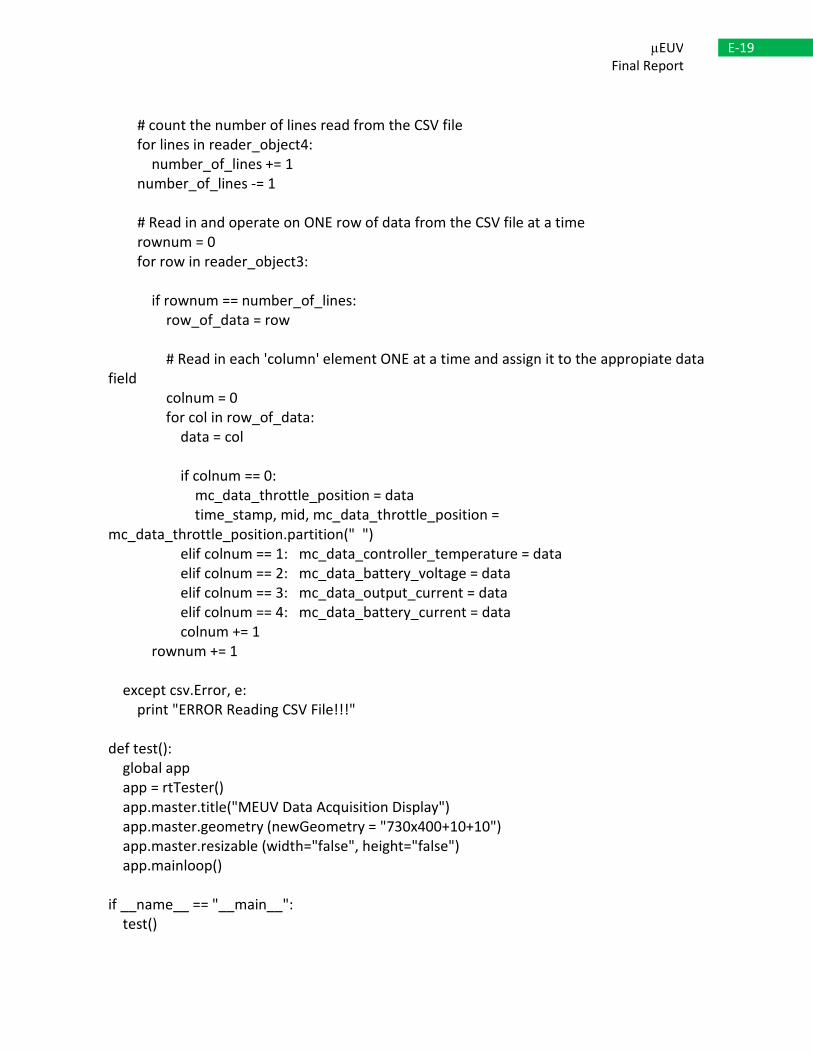
E-19 µEUV
Final Report
# count the number of lines read from the CSV file
for lines in reader_object4:
number_of_lines += 1
number_of_lines -= 1
# Read in and operate on ONE row of data from the CSV file at a time
rownum = 0
for row in reader_object3:
if rownum == number_of_lines:
row_of_data = row
# Read in each 'column' element ONE at a time and assign it to the appropiate data
field
colnum = 0
for col in row_of_data:
data = col
if colnum == 0:
mc_data_throttle_position = data
time_stamp, mid, mc_data_throttle_position =
mc_data_throttle_position.partition(" ")
elif colnum == 1: mc_data_controller_temperature = data
elif colnum == 2: mc_data_battery_voltage = data
elif colnum == 3: mc_data_output_current = data
elif colnum == 4: mc_data_battery_current = data
colnum += 1
rownum += 1
except csv.Error, e:
print "ERROR Reading CSV File!!!"
def test():
global app
app = rtTester()
app.master.title("MEUV Data Acquisition Display")
app.master.geometry (newGeometry = "730x400+10+10")
app.master.resizable (width="false", height="false")
app.mainloop()
if __name__ == "__main__":
test()