michigan’s roads crisis: study findings, conclusions and where do we go from here? best practices...
TRANSCRIPT

Michigan’s Roads Crisis: Study Findings, Conclusions and
Where Do We Go From Here?
Best Practices Conference
Rick Olson, State Representative, 55th DistrictAugust 16, 2012
Distrig
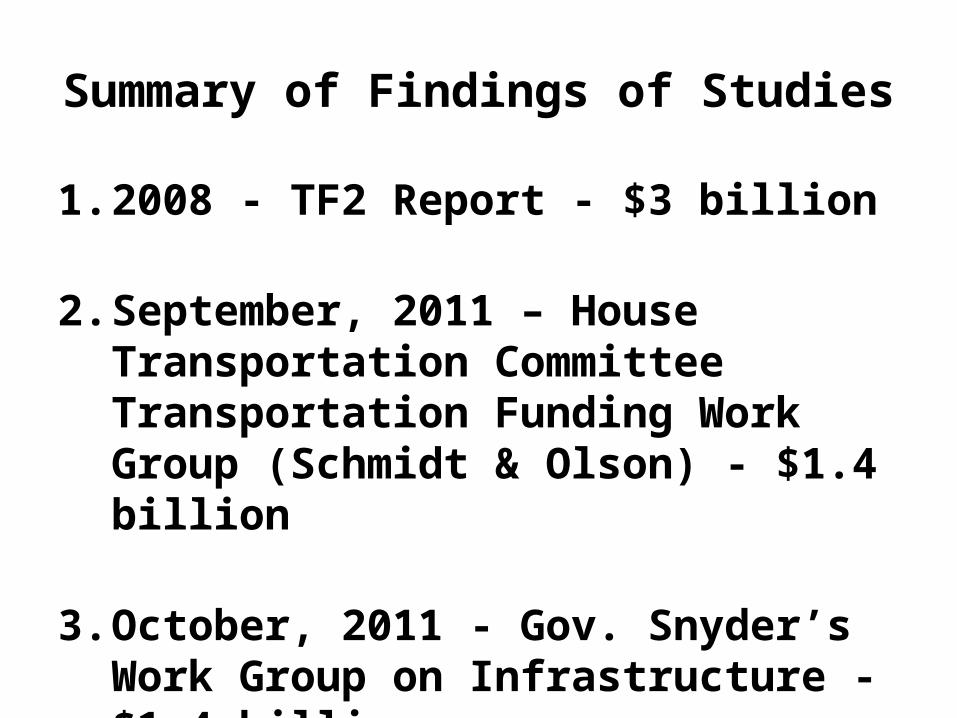
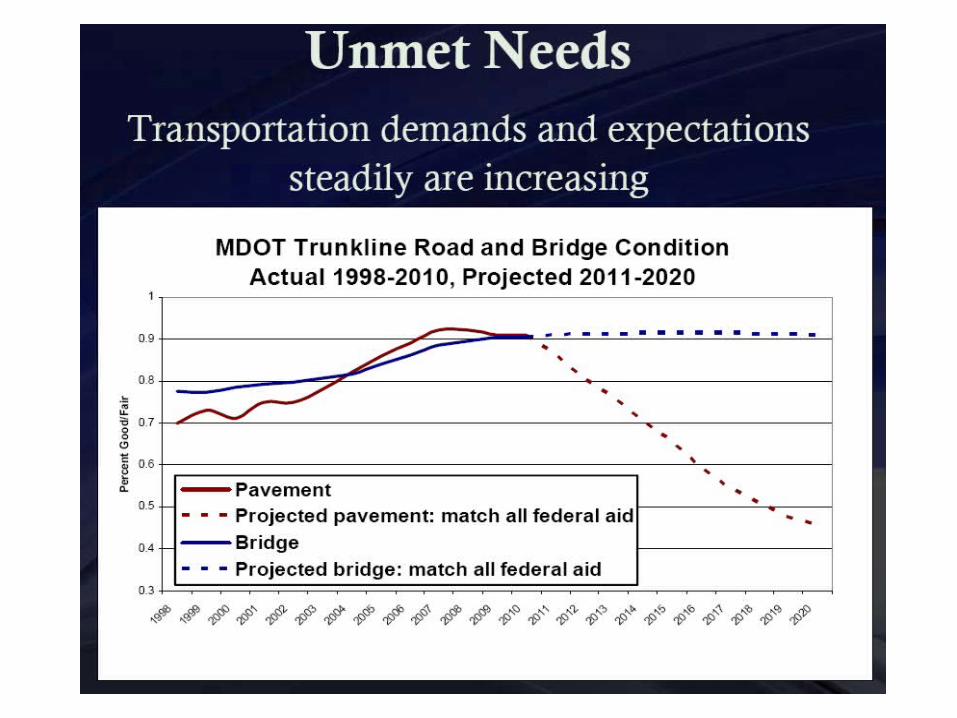
Summary of Findings of Studies
1. 2008 - TF2 Report - $3 billion
2. September, 2011 – House Transportation Committee Transportation Funding Work Group (Schmidt & Olson) - $1.4 billion
3. October, 2011 - Gov. Snyder’s Work Group on Infrastructure - $1.4 billion
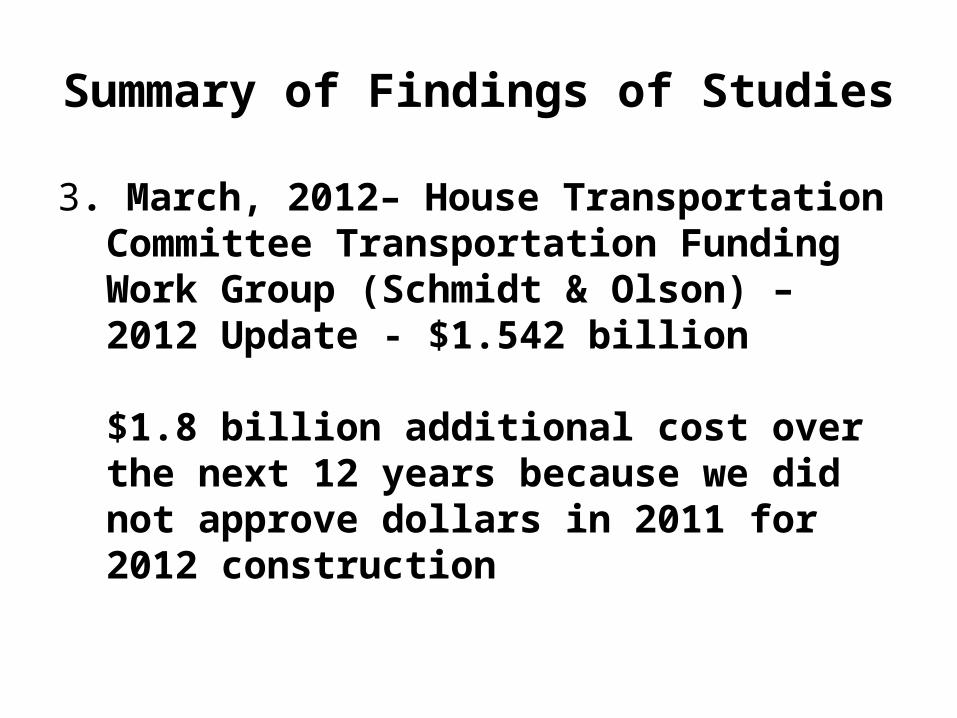
Summary of Findings of Studies
3. March, 2012– House Transportation Committee Transportation Funding Work Group (Schmidt & Olson) – 2012 Update - $1.542 billion
$1.8 billion additional cost over the next 12 years because we did not approve dollars in 2011 for 2012 construction

Good Fair Poor0
10
20
30
40
50
60
70
20
04
20
04
20
04
20
05
20
05
20
05
20
06
20
06
20
06
20
07
20
07
20
07
20
08
20
08
20
08
20
09
20
09
20
09
20
10
20
10
20
10
20
11
20
11
20
11
Pe
rce
nt
of
La
ne
Mile
s
2004-2011 Pavement Condition of Federal Aid Eligible Roads
Source: Chesbro, Transportation Asset Management Council

GOOD FAIR POOR0%
10%
20%
30%
40%
50%
60%
2008
2008
2008
2009
2009
2009
2010
2010
2010
2011
2011
2011
2008 - 2011 Pavement Condition of Non-Federal-Aid Roads%
OF
LA
NE
MIL
ES

10 9 8 7 6 5 4 3 2 10%
5%
10%
15%
20%
2011 PASERNon-Fed-Aid vs Fed-Aid
ratings
% l
an
e m
ile
s
solid bars = non-federal aid shaded bars = federal aid

Year Year
Total Funds Needed to Meet Goals
Total Additional Funding Above
Current Investment Needed to Meet and Sustain Goals Year
Total Funds Needed to Meet Goals
Total Additional Funding Above
Current Investment Needed to Meet and Sustain Goals
Increase in
Shortfall
1 2012 $2,703.13 $1,377.13 2013 $2,868 $1,542 $164.872 2013 $2,687.68 $1,361.68 2014 $2,872 $1,546 $184.323 2014 $2,691.92 $1,365.92 2015 $2,868 $1,542 $176.084 2015 $2,688.46 $1,362.46 2016 $2,949 $1,623 $260.545 2016 $2,834.30 $1,508.25 2017 $3,180 $1,854 $345.756 2017 $3,059.50 $1,733.10 2018 $3,330 $2,004 $270.907 2018 $3,202.86 $1,876.84 2019 $3,478 $2,152 $275.168 2019 $3,344.49 $2,018.61 2020 $3,643 $2,318 $299.399 2020 $3,503.72 $2,177.80 2021 $3,706 $2,379 $201.20
10 2021 $3,558.88 $2,231.77 2022 $3,861 $2,536 $304.2311 2022 $3,707.19 $2,381.76 2023 $4,058 $2,731 $349.2412 2023 $3,896.18 $2,569.40 2024 $4,250 $2,924 $354.60
2025 $4,460 $3,13412 Year Total $37,878.31 $21,964.72 Total $41,063 $25,151 $3,186.28
Less 2012 Increase Avoided by Delay $1,377.1312 Year Increase in Cost Due to Delay in Legislative Action $1,809.15
2011 Study Results 2012 Study Results
All Roads & Bridges ($ in millions)

Summary of Findings of Studies
4. $200 million, $400 million, ect. Phase In –
Better than NO additional dollars – But,
• Our average road quality actually gets worse for a few years!
• We do not reach our 95%/85% “good or fair” goals

Source: MDOT (Chesbro & Ashman)
2012 2013 2014 2015 2016 2017 2018 2019 2020 2021 2022 20230%
10%
20%
30%
40%
50%
60%
70%
80%
90%
100%
58%55% 55% 56%
58%60%
62% 64% 65% 66% 66% 65%
Forecast of Pavement ConditionAll Paved Roads
Percent Good / Fair
All Roads
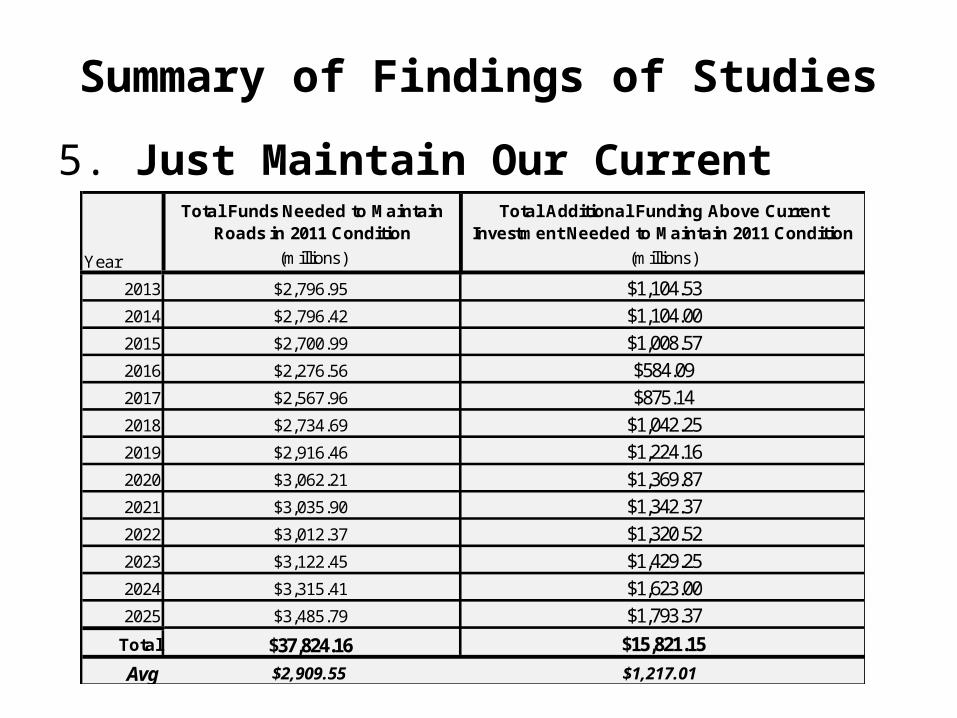
Summary of Findings of Studies5. Just Maintain Our Current Poor Quality?
Total Funds Needed to Maintain Roads in 2011 Condition
Total Additional Funding Above Current Investment Needed to Maintain 2011 Condition
(millions) (millions)
2013 $2,796.95 $1,104.53
2014 $2,796.42 $1,104.00
2015 $2,700.99 $1,008.57
2016 $2,276.56 $584.09
2017 $2,567.96 $875.14
2018 $2,734.69 $1,042.25
2019 $2,916.46 $1,224.16
2020 $3,062.21 $1,369.87
2021 $3,035.90 $1,342.37
2022 $3,012.37 $1,320.52
2023 $3,122.45 $1,429.25
2024 $3,315.41 $1,623.00
2025 $3,485.79 $1,793.37
Total $37,824.16 $15,821.15
Avg $2,909.55 $1,217.01
Year

Summary of Findings of Studies
6. March, 2012 - TRIP Report - “Where Are We Going? Current and Future Pavement and Bridge Conditions, Safety, and Congestion Levels of Michigan’s Roadways and the Impact on Michigan Households, Based on Investment Levels over the Next Decade” –
“. . . each Michigan household could save nearly $2,000 annually by 2022 if funding is increased to allow for significant improvements.”

Anderson Economic Group/Michigan Chamber Foundation
the quality of Michigan’s roads will decline rapidly if more funding is not raised for additional repairs and maintenance,
fixing the rest of the state’s deteriorating roads and bridges would create an additional 11,000 jobs,

Conclusions Reached
1. We need at least $1.542 additional funding or savings to maintain our roads and bridges and achieve the 95%/85% “good or fair condition” in the next 12 years.
Conclusions Reached
2. To avoid another $1.8 billion cost to the taxpayers caused by delay, action needs to be taken timely in 2012 to avoid missing the 2013 construction year as well.
Time is not on our side.

Conclusions Reached
3. We need to be bold in filling the funding gap in one fell swoop, as incrementalism does not achieve the goals.

Conclusions Reached
4. Doing less than the total need would expend considerable political capital and end up disappointing the taxpayers with higher costs - but no better roads.
That is, if we are to take action, we might as well achieve the goals, rather than take the potential political heat for the higher costs AND still have poor roads

Conclusions Reached
5. While it will cost motorists money in terms of higher gas taxes and vehicle registration fees, there will be offsetting savings in vehicle repairs, longer life vehicles, safety, etc.

Conclusions Reached
There are both short term job benefits and long-term benefits of creating an environment for businesses to flourish from maintaining our roads and bridges.

Thanks!
Questions?

Road Funding Package
17 Representatives
13 Senators
Bi-partisan
A number of best practices bills to get greater value for our money

Gas Tax
Convert from 19 cent per gallon to a % of wholesale price.
Immediate increase to 28.3 cents.
Parity with diesel as the 15 cent per gallon would also go to 28.3 cents.
No increase or decrease more than 1 cent per year.
Result: increase revenue over half billion dollars.
Vehicle Registration Fees
Increase vehicle registration fees an average of 67% on value based fees, and 25% on weight based fee vehicles.
Example, my car registration would go from $108 per year to $180.
Result: increase revenue over half billion dollars.
Reason for change from Governor's "example" of $120 per vehicle.

Commercial Corridor Fund
Reason: Make sure these additional user fees actually go to maintain our roads and bridges
Over time replace the current Act 51 formula to a system of distribution based more on vehicle miles traveled, i.e., the pressures put on the roads as well as the importance of the roads.
Work in progress. Our revised report will provide more information, but all road agencies need more.

Regional Transit Authority Bills
Rolling rapid transit, most likely bus rapid transit, but could incorporate other technologies.
4 corridor concept as an overlay on top of current, but could absorb others in the future
Funded by up to $1.20 per $1000 of list price vehicle registration fee, subject to super majority vote of the board and approval by the voters of the entire region
Governance: 2 from each of the 4 counties, 1 from Detroit, and one non-voting appointed by the Gov.

Timing Goals
How Much $ Needed? - September, 2011
Governor’s “Infrastructure Message” – October, 2011
Development of Proposal – January, 2012
Engagement of Interest Groups
Legislative Action – Lame Duck, 2012?