michigan's motor fuel and registration taxes€™s motor fuel and registration taxes fy 2014 -...
TRANSCRIPT

MICHIGAN’S MOTOR FUEL AND
REGISTRATION TAXES
FY 2014 - 2015
Office of Revenue and Tax Analysis
Tax Analysis Division
Michigan Department of Treasury
February 2017

MICHIGAN’S MOTOR FUEL AND REGISTRATION TAXES
FY 2014 - 2015
Office of Revenue and Tax Analysis
Tax Analysis Division
Michigan Department of Treasury
February 2017
This report was prepared by Thomas Patchak-Schuster under the direction of Howard Heideman,
Director, Tax Analysis Division, Office of Revenue and Tax Analysis. Denise T. Heidt of the
Office of Revenue Tax Analysis provided assistance. Juanita Sarles, Office of Revenue and Tax
Analysis, provided data. Kevin Spitzley of the Treasury Department Special Taxes Division and
Alicia Morrison of the Michigan Department of Transportation provided data.

i
TABLE OF CONTENTS
Page
1. INTRODUCTION 2
2. GASOLINE TAX 6
Collections and Tax Rate ............................................................................................................ 6 Fuel Economy and Prices.......................................................................................................... 10
Sales Tax ................................................................................................................................... 14 Michigan Underground Storage Tank Financial Assurance Fund ............................................ 15 Comparisons to Other States ..................................................................................................... 17
Comparisons to Other Nations .................................................................................................. 20 Comparisons to Other Fluids .................................................................................................... 21 Other Revenue .......................................................................................................................... 21
3. DIESEL FUEL TAX 23
Collections and Tax Rate .......................................................................................................... 23 Diesel Fuel Taxation ................................................................................................................. 24
International Fuel Tax Agreement (IFTA) ............................................................................... 28
4. OTHER FUEL TAXES 29
Liquefied Petroleum Gas .......................................................................................................... 29
Aviation Fuel ............................................................................................................................ 30
5. MOTOR VEHICLE REGISTRATION TAXES 31
Motor Vehicle Weight and Value Tax ...................................................................................... 31 Licenses and Permits................................................................................................................. 33
6. TRANSPORTATION FUNDS 34
Michigan Transportation Fund ................................................................................................. 34 State Trunkline Fund................................................................................................................. 34
Comprehensive Transportation Fund ........................................................................................ 34 State Aeronautics Funds ........................................................................................................... 35
7. RECENT DEVELOPMENTS 38
Motor Fuel Taxes ...................................................................................................................... 38 Sales Tax on Motor Fuels ......................................................................................................... 39 Registration Fees ....................................................................................................................... 39 Michigan Transportation Fund ................................................................................................. 40
Income Tax ............................................................................................................................... 42
8. APPENDIX 43

ii
LIST OF EXHIBITS
Exhibit Page
1 Where State Revenue Goes FY 2014-15 ....................................................................... 2
2a FY 2015 Transportation Revenues, Revenue Sources ................................................... 3
2b FY 2015 Transportation Revenues, Fund Distribution .................................................. 3
3 Motor Fuel Tax Revenue Yields FY 2014-15 ............................................................... 4
4 Motor Fuel Tax Rates .................................................................................................... 5
5 Gasoline Tax Revenue ................................................................................................... 6
6 Michigan Gasoline Statistics Selected Fiscal Years ..................................................... 8
7 Gasoline Taxes as a Percent of Total State Taxes ......................................................... 9
8 Real Gasoline Tax Revenue (Adjusted for Inflation) .................................................... 10
9a Average Fuel Economy, U.S. New Car Fleet ................................................................ 11
9b Average Fuel Economy, U.S. New Light Truck Fleet ................................................... 11
10 Fuel Efficiency, Total U.S. Passenger Car Fleet ........................................................... 12
11a Michigan Gasoline Price per Gallon .............................................................................. 13
11b Michigan Gasoline Price per Gallon (Three-Month Average) ...................................... 13
12 Michigan Underground Storage Tank Financial Assistance (MUSTFA) and Refined
Petroleum Fund (RFP) Revenues................................................................................... 16
13 State Gasoline Tax Rates ............................................................................................... 18
14 World Motor Fuel Prices and Taxes .............................................................................. 20
15 Comparative Prices for Other Fluids ............................................................................ 21
16 States With Highway Toll Roads ................................................................................... 22
17 Diesel Fuel Tax Revenue ............................................................................................... 23
18 Michigan Diesel Fuel Taxation, Diesel Powered Light Vehicles .................................. 24
19 Michigan Diesel Fuel Taxation, Michigan Intrastate Motor Carriers ............................ 25
20 Michigan Diesel Fuel Taxation, Michigan Interstate Motor Carriers
Fuel Purchased in Michigan ........................................................................................... 26

iii
Exhibit Page
21 Michigan Diesel Fuel Taxation, Interstate Motor Carriers
Fuel Purchased Outside Michigan ................................................................................. 27
22 Liquefied Petroleum Gas Tax Revenues ........................................................................ 29
23 Aviation Fuel Tax Revenues .......................................................................................... 30
24 Motor Vehicle Registration Tax .................................................................................... 31
25 Motor Vehicle Registration Tax: Amount Charged Under
Different Systems ......................................................................................................... 32
26 Michigan Transportation, License and Permits, and Miscellaneous Revenue .............. 33
27 Michigan Department of Transportation, Expenditures From Certain
Funds FY 2014-15 ....................................................................................................... 35
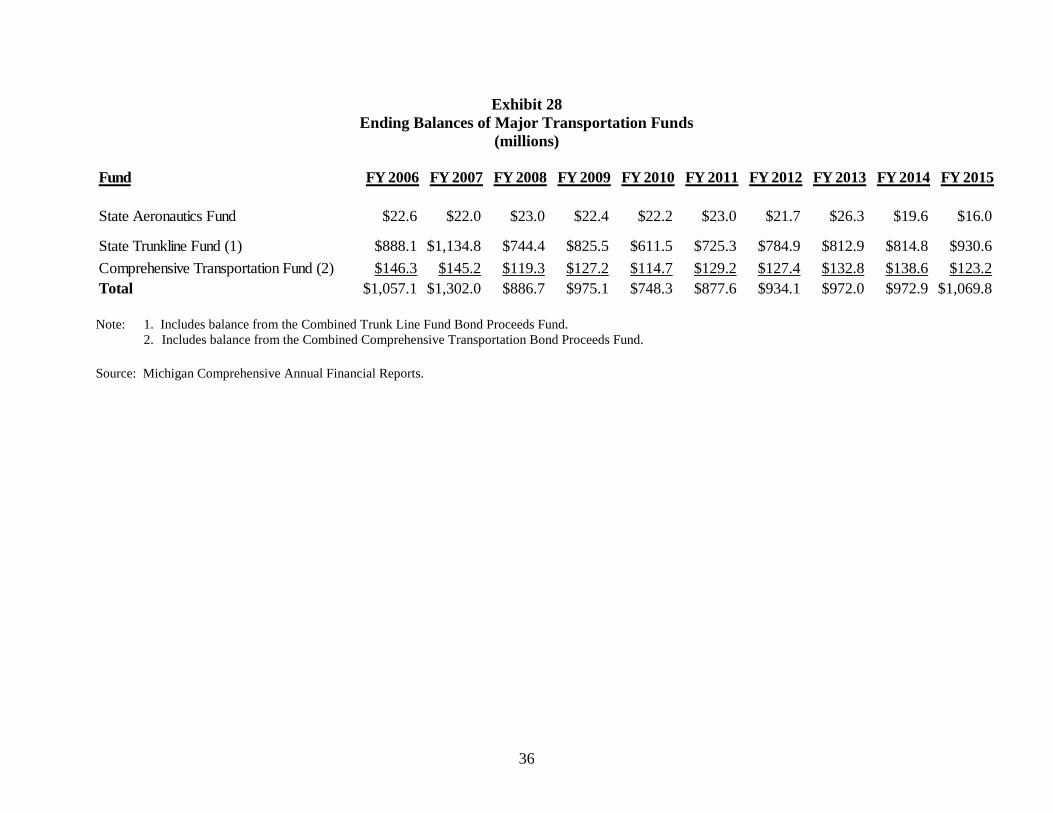
28 Ending Balances of Major Transportation Funds .......................................................... 36
29 Michigan Department of Transportation, Grants Made to Local
Governments FY 2014-15............................................................................................ 37
30 Chronology of Major Changes in Motor Fuel and Registration Taxes ......................... 44
31 Gasoline Tax Rankings by State, September 2015 ........................................................ 55
32 Michigan Motor Fuel Revenue History ......................................................................... 56
33 Michigan Motor Fuel Tax Rates .................................................................................... 58
34 Michigan Gasoline Taxes as a Percent of Total Michigan State Taxes ......................... 59
35 Michigan Gasoline Tax Revenues Adjusted for Inflation ............................................. 60
36 State Motor Fuel Tax Rates and Other Transportation-Related Taxes,
September 2015 ........................................................................................................... 62
37 State Motor Fuel Taxes 2014, Per Person and as Percent of Personal
Income.......................................................................................................................... 63
38 State-Administered Toll Roads and Crossing Facilities Revenue, 2012 ....................... 64
39 Michigan Motor Vehicle Registration Taxes ................................................................. 65

1
EXECUTIVE SUMMARY
Michigan’s Motor Fuel and Registration Taxes
Fiscal Year 2014-15
Michigan's transportation system receives funding from three major sources: state motor fuel
taxes, state motor vehicle registrations and fees, and federal highway fuel taxes. Transportation
revenues totaled $3.6 billion in fiscal year (FY) 2014-15, including proceeds from bond sales.
Federal funds provided $1,414.3 million for Michigan's transportation system in FY 2014-15.
Gasoline tax collections totaled $866.6 million in FY 2014-15 -- the highest gas tax revenue since
2007. With a 19 cent per gallon tax, the yield per 1 cent of tax was $45.6 million. Gasoline tax
revenues were up $46.0 million from the prior fiscal year. Effective January 1, 2017, the motor
fuel rate (which applies to both gasoline and diesel fuel) will rise to 26.3 cents per gallon. Effective
January 1, 2022 and each year thereafter, the motor fuel tax rate will be adjusted for inflation.
Diesel tax collections in FY 2014-15 totaled $136.7 million. Diesel fuel is taxed at 15 cents per
gallon. The yield per 1 cent of tax was $9.1 million.
State motor vehicle registration taxes provided $978.1 million in FY 2014-15. Other license and
permit fees and miscellaneous sources of revenue provided an additional $113.2 million in FY
2014-15.
In September 2015, the U.S. average combined state and federal gasoline tax was about 45 cents
per gallon (rounded to the nearest penny). The federal tax is 18.4 cents per gallon and the average
state tax is about 26.6 cents per gallon. The combined U.S. tax is considerably lower than other
countries. For example, the United Kingdom's tax rate is $4.43 per gallon and Japan's tax rate is
$2.09 per gallon.
In 2015, local governmental units in nine states levied a local gasoline tax. No local units in
Michigan may levy a gasoline tax. Michigan is one of six states that impose a sales tax on gasoline.
There are no toll roads in Michigan, while 28 other states collect revenue from toll roads. Michigan
currently operates three toll bridges.
Michigan local governments received over $1.5 billion of Michigan Department of Transportation
transfers in FY 2014-15, 45.1 percent of the total.
2
1. INTRODUCTION
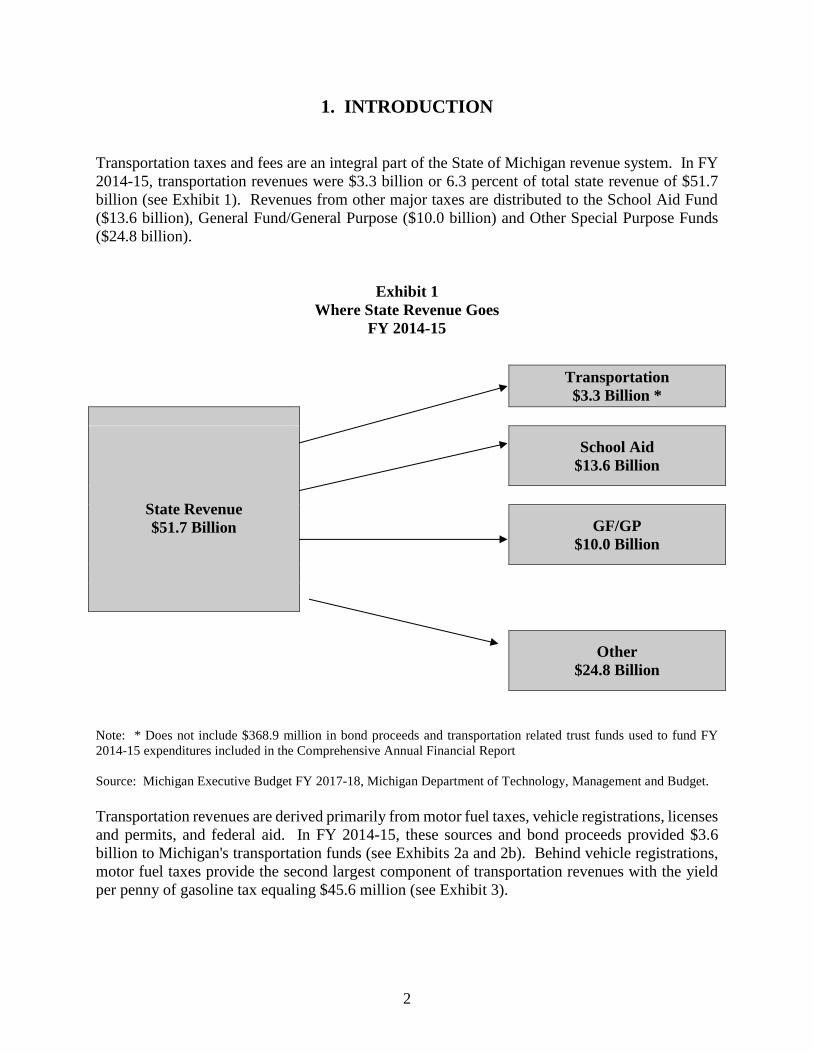
Transportation taxes and fees are an integral part of the State of Michigan revenue system. In FY
2014-15, transportation revenues were $3.3 billion or 6.3 percent of total state revenue of $51.7
billion (see Exhibit 1). Revenues from other major taxes are distributed to the School Aid Fund
($13.6 billion), General Fund/General Purpose ($10.0 billion) and Other Special Purpose Funds
($24.8 billion).
Exhibit 1
Where State Revenue Goes
FY 2014-15
Transportation
$3.3 Billion *
State Revenue
$51.7 Billion
School Aid
$13.6 Billion
GF/GP
$10.0 Billion
Other
$24.8 Billion
Note: * Does not include $368.9 million in bond proceeds and transportation related trust funds used to fund FY
2014-15 expenditures included in the Comprehensive Annual Financial Report
Source: Michigan Executive Budget FY 2017-18, Michigan Department of Technology, Management and Budget.
Transportation revenues are derived primarily from motor fuel taxes, vehicle registrations, licenses
and permits, and federal aid. In FY 2014-15, these sources and bond proceeds provided $3.6
billion to Michigan's transportation funds (see Exhibits 2a and 2b). Behind vehicle registrations,
motor fuel taxes provide the second largest component of transportation revenues with the yield
per penny of gasoline tax equaling $45.6 million (see Exhibit 3).

3
Exhibit 2a
FY 2015 Transportation Revenues, Revenue Sources
(millions)
Revenue Sources Amount
Gasoline Tax $866.6
Liquified Petroleum Gas (LPG) Tax 0.5
Diesel Fuel Tax and Motor Carrier Fuel Tax 136.7
Aviation Fuel Tax 6.4
Sales Tax 90.8
Vehicle Registrations 978.1
License and Permits 52.7
Miscellaneous Including Interest Earnings 68.3
Local Agencies 14.6
Federal Aid 1,414.3
Total $3,629.1
Exhibit 2b
FY 2015 Transportation Revenues, Fund Distribution
(millions)
Fund Amount
State Aeronautics Fund $83.3
State Trunkline Fund 940.2
Michigan Transportation Fund 2,021.4
Comprehensive Transportation Fund 215.3
Combined State Trunkline Bond Proc. 54.3
Combined Comprehensive Trans Proc 0.1
Transportation Related Trust Funds 314.5
Total $3,629.1
Source: Michigan Comprehensive Annual Report, Fiscal Year 2014-15.
4
Transportation taxes are levied to pay for roads, highways, bridges, and public transportation
throughout the state. The proceeds from these taxes cover costs associated with the maintenance
of existing infrastructure and the construction of new roads and bridges. The typical way to fund
transportation systems is to impose a user fee based on road use. User fees are a price paid for a
good or service provided by the government. Examples include toll roads and toll bridges. For
road use, the user fee could be based on an overall measure of miles driven and damage done to
roads from the weight of vehicles. Motor fuel taxes act as proxies for miles driven and weight of
the vehicle. In most cases, road use is related to an individual's consumption of motor fuel.
Although the relationship is not perfect, because some vehicles are more fuel efficient and some
vehicles damage roads to a greater extent, these motor fuel taxes and registration fees remain the
most common methods to generate revenues to pay for roads, bridges, and highways.
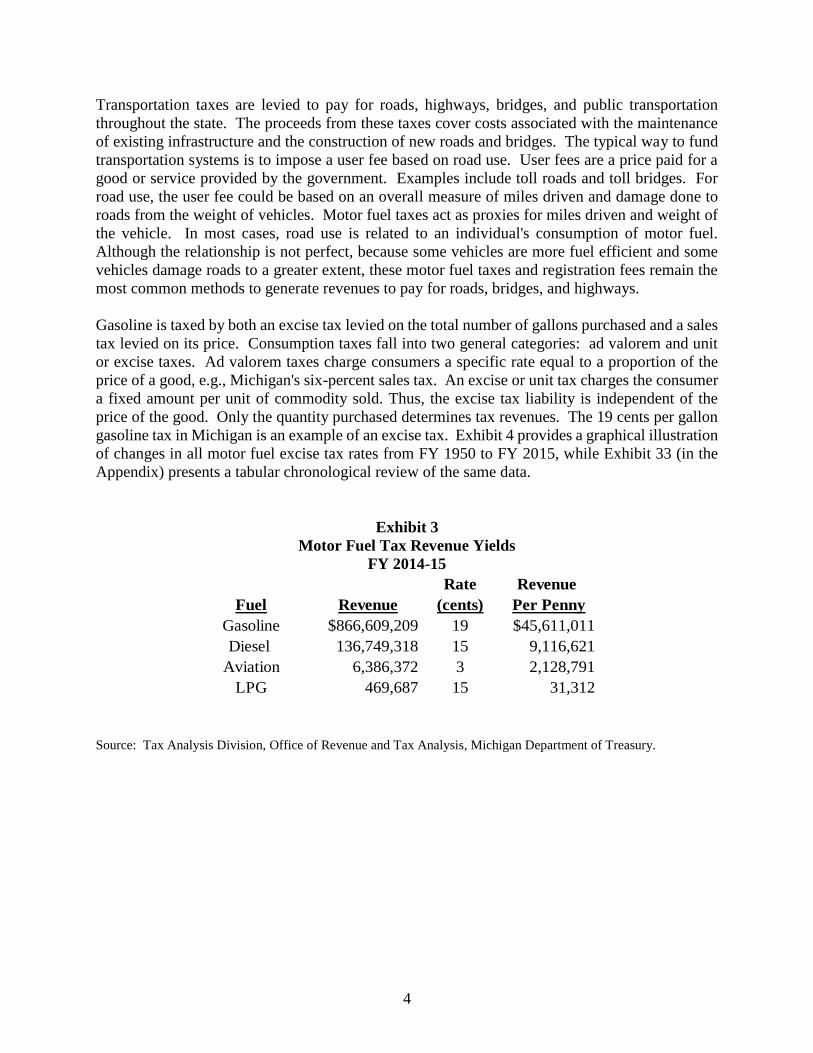
Gasoline is taxed by both an excise tax levied on the total number of gallons purchased and a sales
tax levied on its price. Consumption taxes fall into two general categories: ad valorem and unit
or excise taxes. Ad valorem taxes charge consumers a specific rate equal to a proportion of the
price of a good, e.g., Michigan's six-percent sales tax. An excise or unit tax charges the consumer
a fixed amount per unit of commodity sold. Thus, the excise tax liability is independent of the
price of the good. Only the quantity purchased determines tax revenues. The 19 cents per gallon
gasoline tax in Michigan is an example of an excise tax. Exhibit 4 provides a graphical illustration
of changes in all motor fuel excise tax rates from FY 1950 to FY 2015, while Exhibit 33 (in the
Appendix) presents a tabular chronological review of the same data.
Exhibit 3
Motor Fuel Tax Revenue Yields
FY 2014-15
Rate Revenue
Fuel Revenue (cents) Per Penny
Gasoline $866,609,209 19 $45,611,011
Diesel 136,749,318 15 9,116,621
Aviation 6,386,372 3 2,128,791
LPG 469,687 15 31,312
Source: Tax Analysis Division, Office of Revenue and Tax Analysis, Michigan Department of Treasury.

5
Exhibit 4
Motor Fuel Tax Rates
Note: Tax rates are at end of fiscal year.
Source: Michigan Department of Treasury.
0
5
10
15
20
1950 1960 1970 1980 1990 2000 2010
Cen
ts p
er
Gall
on
Gasoline = 19 cents
Aviation = 3 cents
Diesel = 15 cents
LPG = 15 cents

6
2. GASOLINE TAX Collections and Tax Rate
Gasoline tax collections totaled $866.6 million in FY 2014-15, yielding $45.6 million per one cent
of tax levied. Exhibit 5 provides a 56-year history of collections.
Exhibit 5
Gasoline Tax Revenue
(millions)
$0
$250
$500
$750
$1,000
$1,250
1960 1970 1980 1990 2000 2010
$866.6
(FY 2015)
$938.9
(FY 2002)
$680.6
(FY 1996)
Note: FY 1975-76 was 15-month fiscal year.
Source: Comprehensive Annual Financial Reports.
Gasoline tax revenues grew an average of 1.6 percent per year from FY 1984-85 to FY 1995-96,
when the tax rate held constant at 15 cents per gallon1. On August 1, 1997, the gasoline tax was
raised to 19 cents per gallon. (Exhibit 4 provides a graphical illustration of all motor fuel tax rates
from FY 1951 to FY 2015, and Exhibit 33 in the Appendix presents a tabular chronological review
of the same data.) Since FY 1997-98 (the first full fiscal year in which the gasoline tax stood at
19 cents), gasoline tax revenues have fallen 0.2 percent per year. A sharp rise in gasoline prices
played a major role in reducing gasoline consumption and hence lowered the per gallon gasoline
tax revenue between FY 1998 and FY 2014. Gasoline prices more than tripled between FY 1998
and FY 2014 – up from $1.09 per gallon to $3.53 per gallon. Strong economic growth in Asia,
coupled with geopolitical/military conflicts in and around many of the world’s major oil producing
nations, sharply increased oil prices. Between FY 1998 and FY 2014, oil prices more than
1 The Michigan gasoline tax was enacted in 1925 at 2 cents per gallon. In 1927 the tax rate
increased to 3 cents, where it remained until 1951, when it increased to 4.5 cents per gallon. After
several increases over the 1951 - 1983 period, the tax rate increased to 15 cents per gallon in 1984,
where it remained until 1997. Since August 1, 1997, (Public Act 83 of 1997), the gasoline tax rate
has been 19 cents per gallon. Refiners or importers of gasoline must prepay the tax.
Fiscal Year

7
quintupled -- rising from $16.20 per barrel to $99.30 per barrel. In FY 2015, oil prices fell sharply
– dropping $42.81 per barrel (43.1 percent). Consequently, the average price of gasoline in
Michigan dropped $0.97 per gallon in FY 2015. With the price decline, gasoline consumption
rose and gasoline tax revenues increased.
Exhibit 6 compares gallons of gasoline sold in Michigan (as reported to the Federal Highway
Agency), gasoline tax revenue, and average price of a gallon of Michigan gasoline for selected
fiscal years. Gasoline tax revenues are earmarked to the Michigan Transportation Fund (MTF) and
distributed by statutory and constitutional formula to local units of government and state
transportation funds. Suppliers are paid a 1.5 percent fee for the cost of remitting the gasoline tax
to the state. Suppliers are required to pay one-third of the fee to retailers.
The demand for gasoline is relatively income inelastic as changes in income have only a small
effect on the quantity purchased. While Michigan personal income increased 57.4 percent from
FY 1998 to FY 2015, gasoline tax revenue decreased 4.1 percent from FY 1998 to FY 2015. In
part, the decline in gasoline tax revenues is because technological advances have made motor
vehicles more fuel efficient.
Since the mid-1970s, the gasoline tax as a share of total state tax revenues has trended lower.
Between FY 1984 and FY 1997, the tax rate remained unchanged at 15 cents per gallon. Further
in 1994, School Aid Reform raised many existing state taxes and introduced new state taxes.
Between FY 1985 and FY 1993, the gasoline tax’s share of state revenues fell from 6.4 percent to
5.1 percent. Then, as tax reforms were enacted, the gasoline tax as a share of total state revenues
dropped to 3.7 percent in FY 1996.
The increase in the gasoline tax rate to 19 cents effective August 1997 raised the gasoline tax as a
share of total state tax revenues rose to 4.4 percent in FY 1998. After falling to 4.0 percent in FY
2000, the gasoline tax’s share of state taxes rebounded to 4.3 percent by 2002. However, the
gasoline tax’s share of total taxes steadily dropped over the next six years and fell to 3.3 percent
in FY 2008. In FY 2009, the gasoline tax’s share of state taxes rose to 3.6 percent, where the share
remained in FY 2010. However, the gasoline tax as a share of total state tax revenues fell in each
of the following two years and dropped to 3.3 percent in FY 2012. The share remained at 3.3
percent in FY 2013. However, in FY 2014, the gasoline tax’s share of state taxes fell to 3.2 percent,
where it remained in FY 2015. Exhibit 7 illustrates the declining share of the gasoline tax as a
percent of total state taxes.
Effective January 1, 2017, the motor fuel tax rate (which applies to both gasoline and diesel fuel)
will increase to 26.3 cents per gallon. Effective January 1, 2022 and each following year, the
motor fuel tax rate will increase by the lesser of 5.0 percent or the rate of inflation. If the consumer
price index declines, the motor fuel tax rate remains unchanged.

8
Exhibit 6
Michigan Gasoline Statistics
Selected Fiscal Years
Fiscal Year Gallons Tax Revenue
1985 3,867,627,365 $569,708,205 $1.26
1990 4,194,894,390 626,229,262 $1.12
1991 4,175,788,031 622,513,663 $1.21
1992 4,202,465,843 631,024,833 $1.10
1993 4,242,283,180 657,191,544 $1.08
1994 4,494,366,161 658,877,569 $1.06
1995 4,510,953,745 681,711,071 $1.10
1996 4,577,048,759 680,586,256 $1.17
1997 4,644,262,717 736,316,612 $1.23
1998 4,766,365,149 903,542,085 $1.09
1999 4,981,820,560 931,031,120 $1.08
2000 4,966,525,045 921,991,065 $1.48
2001 5,045,764,126 933,494,040 $1.57
2002 5,001,188,590 938,911,784 $1.31
2003 5,049,665,389 935,671,742 $1.55
2004 4,993,695,860 932,139,677 $1.75
2005 4,927,490,936 922,368,211 $2.16
2006 4,823,929,261 906,220,722 $2.57
2007 4,750,574,728 883,687,513 $2.64
2008 4,556,519,571 848,864,067 $3.47
2009 4,509,410,243 846,013,305 $2.28
2010 4,482,876,800 841,658,744 $2.73
2011 4,440,625,631 831,717,538 $3.47
2012 4,384,833,381 818,797,704 $3.64
2013 4,443,943,930 821,632,225 $3.64
2014 4,431,281,328 820,625,646 $3.53
2015 4,491,367,039 866,609,209 $2.56
Average Price
per Gallon of
Michigan Gasoline
Source: Motor Fuel Division and Tax Analysis Division, Michigan Department of Treasury and Michigan
Department of Transportation.
9
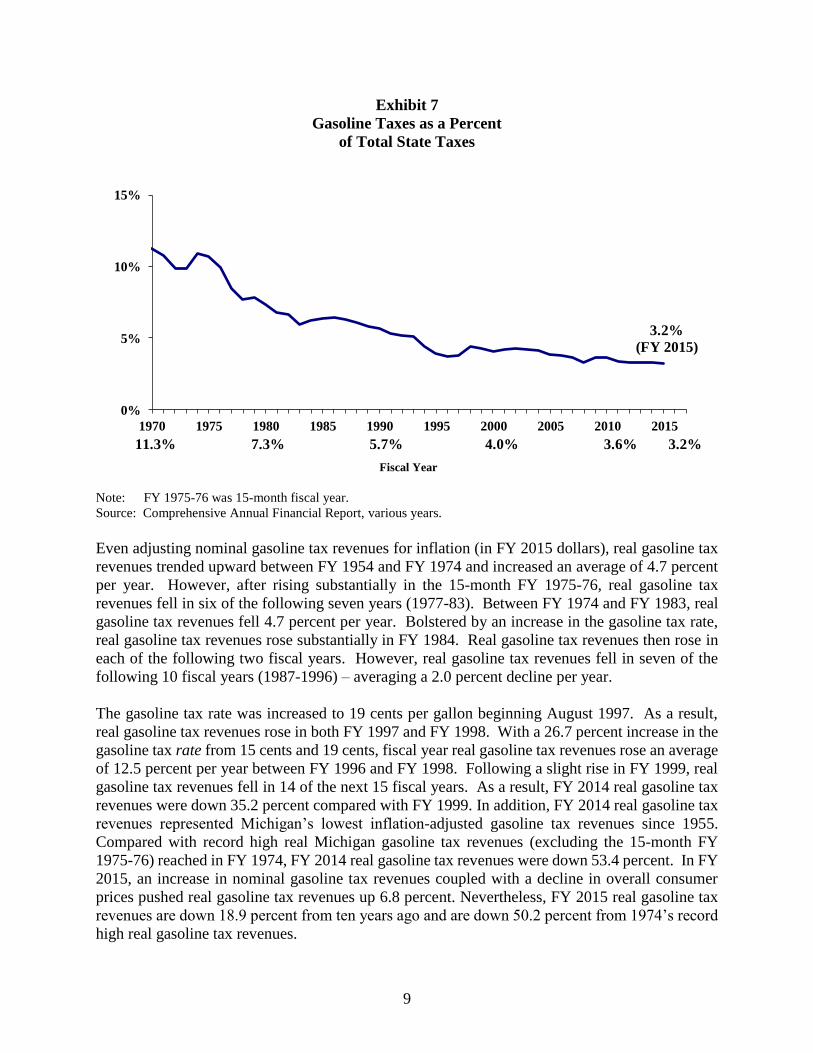
Exhibit 7
Gasoline Taxes as a Percent
of Total State Taxes
3.2%
(FY 2015)
0%
5%
10%
15%
1970 1975 1980 1985 1990 1995 2000 2005 2010 2015
1
3
11.3% 7.3% 5.7% 4.0% 3.6% 3.2%
Note: FY 1975-76 was 15-month fiscal year.
Source: Comprehensive Annual Financial Report, various years.
Even adjusting nominal gasoline tax revenues for inflation (in FY 2015 dollars), real gasoline tax
revenues trended upward between FY 1954 and FY 1974 and increased an average of 4.7 percent
per year. However, after rising substantially in the 15-month FY 1975-76, real gasoline tax
revenues fell in six of the following seven years (1977-83). Between FY 1974 and FY 1983, real
gasoline tax revenues fell 4.7 percent per year. Bolstered by an increase in the gasoline tax rate,
real gasoline tax revenues rose substantially in FY 1984. Real gasoline tax revenues then rose in
each of the following two fiscal years. However, real gasoline tax revenues fell in seven of the
following 10 fiscal years (1987-1996) – averaging a 2.0 percent decline per year.
The gasoline tax rate was increased to 19 cents per gallon beginning August 1997. As a result,
real gasoline tax revenues rose in both FY 1997 and FY 1998. With a 26.7 percent increase in the
gasoline tax rate from 15 cents and 19 cents, fiscal year real gasoline tax revenues rose an average
of 12.5 percent per year between FY 1996 and FY 1998. Following a slight rise in FY 1999, real
gasoline tax revenues fell in 14 of the next 15 fiscal years. As a result, FY 2014 real gasoline tax
revenues were down 35.2 percent compared with FY 1999. In addition, FY 2014 real gasoline tax
revenues represented Michigan’s lowest inflation-adjusted gasoline tax revenues since 1955.
Compared with record high real Michigan gasoline tax revenues (excluding the 15-month FY
1975-76) reached in FY 1974, FY 2014 real gasoline tax revenues were down 53.4 percent. In FY
2015, an increase in nominal gasoline tax revenues coupled with a decline in overall consumer
prices pushed real gasoline tax revenues up 6.8 percent. Nevertheless, FY 2015 real gasoline tax
revenues are down 18.9 percent from ten years ago and are down 50.2 percent from 1974’s record
high real gasoline tax revenues.
Fiscal Year

10
Gasoline tax revenues have lagged behind inflation for two reasons. First, the tax is an excise tax,
not an ad valorem tax. Second, increased fuel efficiency has slowed the growth in consumption.
Over the past ten fiscal years, nominal (not adjusted for inflation) gasoline taxes have declined an
average of 0.6 percent per year.
Exhibit 8
Real Gasoline Tax Revenue
(adjusted for inflation (in FY 2015 millions of dollars))
$1,741.5
$954.4
$1,252.9
$866.6
$0
$500
$1,000
$1,500
$2,000
1960 1970 1980 1990 2000 2010
(1974)
(1982)
(1999)
(2015)
Note: FY 1975-76 was 15-month fiscal year.
Source: Comprehensive Annual Financial Report, various years and U.S. Bureau of Labor Statistics..
Fuel Economy and Prices
Improvements in motor vehicle fuel economy have clearly contributed to lower gasoline tax
revenues. Possible oil shortages, higher gas prices, federal Corporate Average Fuel Economy
(CAFE) standards, and technology advances have all led automakers to manufacture more fuel-
efficient vehicles over the years. CAFE standards for new light vehicles have risen from 18.0
miles per gallon for model year 1978 to 33.0 miles per gallon for 2016. For 2016, the domestic
new car fleet average fuel economy stood at 37.0 mpg, while the import average was 37.8 mpg.
For model year 2016 light trucks, the fleet average fuel economy was 27.6 mpg. See Exhibits 9a
and 9b.
Nationally, the average passenger car’s gasoline consumption has decreased since 1970. In 1970,
the average passenger car consumed 760 gallons of gasoline per year in contrast to 527 gallons of
gasoline consumed in 2014. This represents a 30.6 percent decline in consumption of gasoline per
car. Travel per car is up from an average of 9,821 miles in 1970 to 11,287 miles in 2014, a 14.9
percent increase (see Exhibit 10). The fuel efficiency of the total fleet increased from 12.9 miles
per gallon in 1970 to 21.4 miles per gallon in 2014, a 65.5 percent increase. Thus, with fuel
efficiency gains outpacing vehicle miles traveled, overall gasoline consumption per vehicle has
decreased, helping to explain slower growth in motor fuel revenues.
Fiscal Year

11
Exhibit 9a
Average Fuel Economy
U.S. New Car Fleet
15.0
20.0
25.0
30.0
35.0
40.0
1978 1982 1986 1990 1994 1998 2002 2006 2010 2014
2016 Import CAFE
Actual 37.8 mpg
(thin dashed)2016 Domestic CAFE Actual 37.0 mpg (bold
dashed)
CAFE Standard
2016 = 36.8 mpg
Source: U.S. Department of Transportation, National Highway Traffic Safety Administration. 2015 and 2016
CAFE standard calculated by weighting 2015 (2016) domestic car standard times domestic 2014 car sales share plus
2015 (2016) import car standard times import 2014 car sales share (ORTA calculation).
Exhibit 9b
Average Fuel Economy
U.S. New Light Truck Fleet
15.0
20.0
25.0
30.0
1982 1986 1990 1994 1998 2002 2006 2010 2014
2016 Lt Trucks CAFE
Actual 27.6 mpg
(thin dashed)
Light Trucks
CAFE Standards
2016 = 28.8 mpg
Source: U.S. Department of Transportation, National Highway Transportation and Safety Agency.

12
Exhibit 10
Fuel Efficiency
Total U.S. Passenger Car Fleet
60
80
100
120
140
160
180
1975 1980 1985 1990 1995 2000 2005 2010
Index
19
75
=1
00
21.4 Miles/Gallon (2014)
11,287 Miles/Car (2014)
527 Gallons/Car (2014)
Source: U.S. Department of Transportation, Federal Highway Administration, Highway Statistics, various years.
From January 1991 to December 1999, average Michigan gasoline prices fluctuated from $0.92 a
gallon to $1.31 a gallon. In the spring of 2000, a combination of economic forces, system capacity
constraints, and environmental regulations pushed the price of Michigan gasoline to $1.95 a gallon
in June 2000. Between 2000 through 2002, Michigan average gasoline prices remained volatile,
declining to a $1.12 low in December 2001 after rising to a $1.95 per gallon high in June 2000.
Driven by sharp fluctuations in oil prices, Michigan gasoline prices fluctuated tremendously in
2008. Michigan gasoline prices rose from $3.00 per gallon in December 2007 to a record high of
$4.10 per gallon in June 2008 but then plummeted to $1.67 per gallon in December 2008. Oil
supply disruptions led to spikes in oil prices, and hence, spikes in gasoline prices. Major
disruptions were caused by hurricanes and storms, political events in major oil producing
countries, and unplanned outages in U.S. refineries and pipelines. Substantially more severe than
anticipated economic and financial declines pushed oil prices, and hence, gasoline prices, sharply
lower with gasoline prices falling to $1.67 per gallon in December 2008. With supply pressures
growing and demand slowly strengthening, gasoline prices rose to $4.03 per gallon in May 2011.
Between June 2011 and September 2014, gasoline prices fluctuated between $3.20 per gallon and
$4.00 per gallon with a median price of $3.65 per gallon. Gasoline prices plummeted with the
price falling below $2.00 per gallon in January 2015 before rising sharply to $2.80 per gallon in
July 2015. Then, gasoline prices headed downward and fell to $1.64 per in February 2016 before
rising to $2.33 per gallon in May 2016. Exhibits 11a and 11b show the monthly fluctuations of
the price of a gallon of Michigan gasoline between January 1982 and May 2016.

13
Exhibit 11a
Michigan Average Gasoline Price per Gallon
Source: Michigan Department of Transportation.
Exhibit 11b
Michigan Gasoline Price per Gallon (Three Month Average)
Source: Michigan Department of Transportation.
$2.12
(May 2016)
$0.00
$1.00
$2.00
$3.00
$4.00
1982 1984 1986 1988 1990 1992 1994 1996 1998 2000 2002 2004 2006 2008 2010 2012 2014 2016
Dec 2008 =
$1.67/gallon
June 2008
$4.10/gallon
Jan 1982-Dec 1998
Low = $0.88/gallon
High = $1.41/gallon
May 2016 =
$2.33/gallon
$0.00
$1.00
$2.00
$3.00
$4.00
$5.00
Jan-83 Jan-88 Jan-93 Jan-98 Jan-03 Jan-08 Jan-13
$3.69
(Aug 2014)
$4.01
(Jul/Aug 2008)
Jan 1983 - Dec 1998
Average: $1.13
High: $1.38, Low $0.88
$1.84
(Feb 2009)

14
Sales Tax
Michigan levies a six percent sales tax on the pump price of motor fuel, excluding state motor fuel
taxes. Six states, including Michigan, levy a sales tax on gasoline. For FY 2015, 27.9 percent of
one-cent of all auto-related sales tax collections (including the sales tax on motor fuel) is
distributed to the Comprehensive Transportation Fund (CTF).2 The remaining auto-related sales
tax collections go to the School Aid Fund and local government revenue sharing. In FY 2014-15,
the CTF sales tax transfer was $90.8 million.
Beginning October 1, 2016, and the first day of each calendar quarter thereafter, an amount equal
to the collections from two quarters immediately preceding the current calendar quarter of the 2
percent sales tax from the retail sale of aviation fuel shall be distributed to the State Aeronautics
Fund (35 percent) and the Qualified Airport Fund (65 percent). Similarly, an amount equal to the
collections of the 2 percent use tax from the use, storage, or consumption of aviation fuel shall be
distributed to the State Aeronautics Fund (35 percent) and the Qualified Airport Fund (65 percent).
Since May 1994, purchasers of gasoline from a refiner, pipeline terminal operator, or marine
terminal operator must prepay state sales tax equal to 6 percent of the statewide average retail price
of a gallon of self-serve unleaded regular gasoline as determined by the Department of Treasury.
Originally, Treasury was required to determine a prepay amount for gasoline every three months.
Beginning April 2013, the Department of Treasury is required to determine a prepay amount for
diesel fuel as well as gasoline. In addition, beginning April 2013, Treasury is required to determine
prepay amounts every month. Succeeding purchasers will pass the prepayment along until
reaching the retailer level. A retailer must reconcile any differences in prepaid sales tax on
gasoline/diesel and actual sales tax liability on the retailer’s sales tax return.
With sharp increases in gasoline prices, the prepay sales tax amount increased substantially.
Between the end of 2002 and early 2009, the prepay amount rose steadily from 5.8 cents to 18.5
cents in October 2008, where it remained through February 2009. With gasoline prices falling
sharply in early 2009, the prepay amount fell sharply to 11.6 cents in March 2009 and to 9.8 cents
in June 2009. In September 2009, the sales tax prepay amount rose to 12.4 cents, where the amount
stayed through May 2010. In June 2010, the prepay amount rose to 14.2 cents, where it remained
unchanged until rising to 17.6 cents in June 2011.
With high and fluctuating gasoline prices, the sales tax prepay amount ranged between 17.2 cents
and 21.3 cents between FY 2012 and FY 2014 with a median prepay amount of 20.5 cents. The
prepay amount rose to 21.3 cents in September 2011 and remained unchanged through February
2012. The prepay amount dropped to 17.9 cents in March 2012, but rose to 20.5 cents in June
2012. The prepay amount remained at 20.5 cents through February 2013. While dropping to 18.1
cents in March 2013, the prepay amount rose to 20.4 cents in April 2013 (the first month for which
Treasury was required to determine prepay amounts each month – instead of every three months).
2 The state constitution permits up to one-cent of auto-related sales tax collections to be
distributed to the CTF, while the Sales Tax Act provided that 27.9 percent of one-cent of auto-
related sales tax collections be distributed to the CTF.

15
Between April 2013 and September 2014, the prepay amount ranged between 17.2 cents and 21.1
cents. The prepay amount stayed just above 20 cents through August 2013 when the amount
equaled 21.1 cents. Beginning in September 2013, the prepay amount dropped in each of the next
six months with the amount falling to 17.2 cents in February 2014. The prepay amount rose each
month between March 2014 and June 2014, inclusive. In June 2014, the prepay amount increased
to 20.2 cents, where the amount stayed in July 2014. The prepay amount rose to 21.0 cents in
August 2014 and then fell to 19.6 cents in September 2014.
The gasoline prepay amount fell each month between October 2014 and March 2015, when the
amount dropped to 10.0 cents. The rate then rose each month between April 2015 and August
2015, when the amount rose to 15.0 cents. The prepay amount fell to 14.6 cents in September
2015.
The gasoline prepay amount fell each month between October 2015 and April 2016, when the
prepay amount dropped to 8.1 cents – the lowest gasoline prepay amount since March 2005. The
gasoline prepay amount then increased in May 2016 and June 2016, when the amount rose to 10.9
cents per gallon.
April 2013 marked the first month for which the Department of Treasury was required to determine
a prepay amount for diesel fuel. Between April 2013 and September 2014, the prepay amount for
diesel fuel ranged narrowly between 21.4 cents and 23.0 cents. With declines in eight of the 12
months in FY 2015, the diesel fuel prepay amount dropped from 21.5 cents in September 2014 to
15.1 cents in September 2015. Sharp drops in the diesel prepay amount in February 2015 and
March 2015 accounted for 5.3 cents of the net 6.4 cents decline between the end of FY 2014 and
the end of FY 2015. With declines in six of the first seven months of FY 2016, the diesel prepay
amount declined a net 4.7 cents between September 2015 and April 2016, when the prepay amount
fell to 10.4 cents. With slight increases over the following two months, the prepay amount rose to
11.2 cents in June 2016.
Michigan Underground Storage Tank Financial Assurance Fund
A 0.875-cent per gallon fee is levied on petroleum products sold in Michigan. Previously, the
fee’s revenues were placed in the Michigan Underground Storage Tank Financial Assurance Fund
(MUSTFA). The MUSTFA, created by Public Act 518 of 1988, assisted owners of underground
storage tank systems in meeting environmental standards mandated by the federal government.
As of June 29, 1995, MUSTFA no longer accepted new claims, with unpaid claims to be paid from
future fund revenues. (See Exhibit 12.)
Public Act 390 of 2004 created the Refined Petroleum Fund (RPF), transferred the balance of
approximately $60.0 million from the MUSTFA to the RPF and directed all future revenue from
a 0.875-cent per-gallon environmental regulatory fee on refined petroleum products to the new
Fund. RPF revenues are used for cleanup projects, debt service on cleanup bonds, administration
and program staff costs, and gasoline inspection programs. Only cleanup projects involving
petroleum-related contaminants qualify to receive RPF funding; these are usually leaking
underground storage tank (LUST) sites. Revenue from the per-gallon fee has declined with RPF
revenue falling from $59.7 million in FY 2006 to $32.7 million in FY 2015.

16
Exhibit 12
Michigan Underground Storage Tank Financial Assistance (MUSTFA)
And Refined Petroleum Fund (RPF) Revenues
Fiscal Year Amount
1989 $8,946,849
1990 $52,371,142
1991 $50,571,962
1992 $54,266,136
1993 $51,503,326
1994 $59,611,312
1995 $71,756,920
1996 $72,669,520
1997 $61,381,557
1998 $63,448,212
1999 $68,582,246
2000 $66,953,391
2001 $62,727,422
2002 $64,550,639
2003 $61,231,905
2004 $59,583,486
2005 $117,705,696
2006 $59,727,401
2007 $57,398,041
2008 $53,521,558
2009 $51,310,053
2010 $51,111,780
2011 $51,110,946
2012 $50,989,999
2013 $50,953,559
2014 $54,618,152
2015 $32,670,083
Total $1,561,273,293
Note: Effective October 12, 2004, the RPF fund was established and fee revenues formerly distributed into the
MUSTFA fund began to be distributed into the RPF fund. Pre-2005 figures represent MUSTFA fund revenue. Post-
2004 figures represent RPF revenues. 2005 revenues include MUSTFA fund amounts transferred into the RPF fund.
Source: Executive Budget, Detailed Statement of General and Special Revenue Funds table, various years.

17
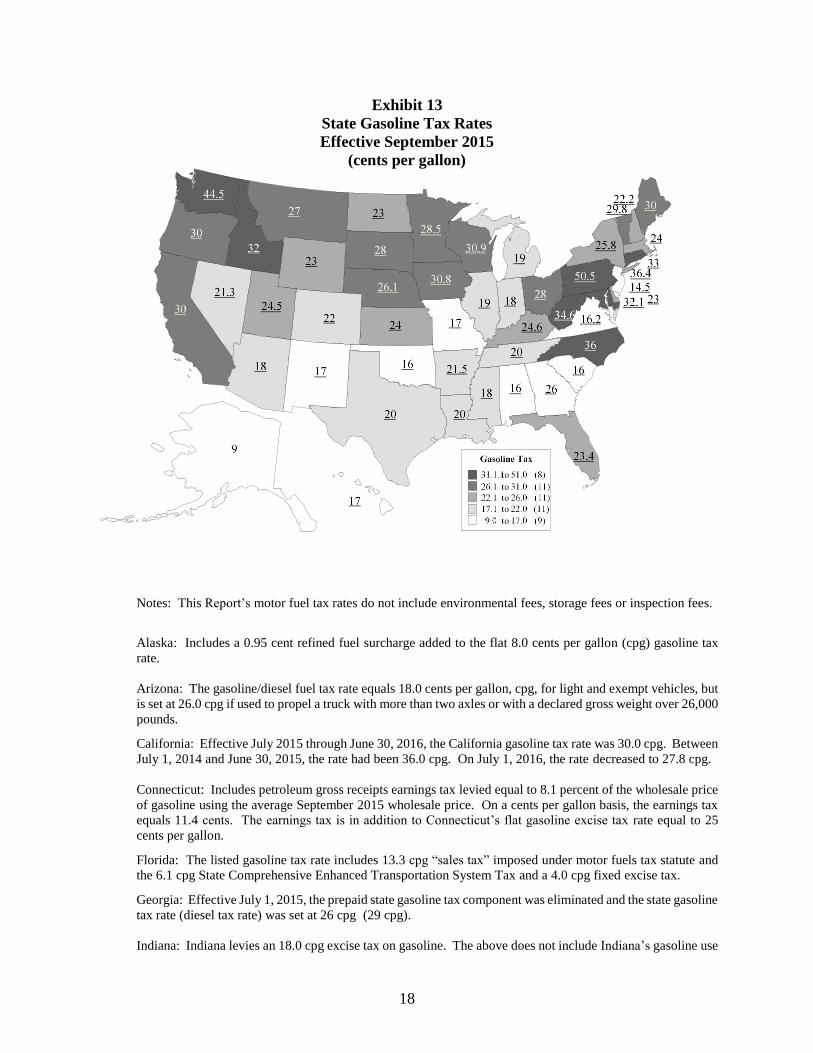
Comparisons to Other States
In September 2015, Michigan’s gasoline tax rate (19 cents per gallon) was one of the lowest,
ranking 37th nationally (see Exhibit 13 and Exhibit 31 in the Appendix). Pennsylvania had the
highest state gasoline tax rate of 50.5 cents per gallon. Alaska had the lowest gasoline tax rate at
9.0 cents per gallon. The median gasoline tax rate in September 2015 was 23.7 cents per gallon.
Comparing gasoline tax rates among states is complicated because states levy other additional
taxes that are based on per gallon consumption of gasoline. For example, New York levies a
gasoline tax rate of 8 cents per gallon, and also has a “business petroleum tax” of 17.8 cents per
gallon. While technically paid by business, the tax is levied on the consumption of gasoline on a
per gallon basis at the retail or wholesale level. Michigan is one of six states that levy sales tax on
gasoline. Besides having different sales tax rates, four of these states include the federal gasoline
tax in the sales tax base. California also includes the state gasoline tax in the sales tax base but
taxes gasoline at a reduced 2.25 percent sales tax rate. In addition, unlike Michigan, local units in
nine states currently levy a gasoline tax. Factoring in sales tax and maximum local gasoline taxes,
Michigan ranked 17th (see Exhibit 31, in the Appendix). In addition, in at least three states, some
local units impose a local sales tax on gasoline sales. Michigan does not allow any local unit to
impose sales or use taxes on any good or service.
Comparing all state motor fuel tax collections (gasoline, diesel, LPG, etc.), Michigan ranks among
the lowest both in motor fuel taxes per person and in motor fuel taxes as a percent of personal
income (see Exhibit 37 in the Appendix). In 2014, Michigan per person motor fuel taxes averaged
$95, ranking 43rd in the country. Michigan ranked 41st in motor fuel taxes as a percent of personal
income at 0.23 percent. North Dakota ranked first in motor fuel taxes per person at $302 per
person in motor fuel taxes, while West Virginia ranked first in motor fuel taxes as a percent of
personal income at 0.58 percent. Alaska ranked last in both categories with motor fuel taxes per
person at $43 and motor fuel taxes as a percent of personal income of 0.08 percent.
18
Exhibit 13
State Gasoline Tax Rates
Effective September 2015
(cents per gallon)
Notes: This Report’s motor fuel tax rates do not include environmental fees, storage fees or inspection fees.
Alaska: Includes a 0.95 cent refined fuel surcharge added to the flat 8.0 cents per gallon (cpg) gasoline tax
rate.
Arizona: The gasoline/diesel fuel tax rate equals 18.0 cents per gallon, cpg, for light and exempt vehicles, but
is set at 26.0 cpg if used to propel a truck with more than two axles or with a declared gross weight over 26,000
pounds.
California: Effective July 2015 through June 30, 2016, the California gasoline tax rate was 30.0 cpg. Between
July 1, 2014 and June 30, 2015, the rate had been 36.0 cpg. On July 1, 2016, the rate decreased to 27.8 cpg.
Connecticut: Includes petroleum gross receipts earnings tax levied equal to 8.1 percent of the wholesale price
of gasoline using the average September 2015 wholesale price. On a cents per gallon basis, the earnings tax
equals 11.4 cents. The earnings tax is in addition to Connecticut’s flat gasoline excise tax rate equal to 25
cents per gallon.
Florida: The listed gasoline tax rate includes 13.3 cpg “sales tax” imposed under motor fuels tax statute and
the 6.1 cpg State Comprehensive Enhanced Transportation System Tax and a 4.0 cpg fixed excise tax.
Georgia: Effective July 1, 2015, the prepaid state gasoline tax component was eliminated and the state gasoline
tax rate (diesel tax rate) was set at 26 cpg (29 cpg).
Indiana: Indiana levies an 18.0 cpg excise tax on gasoline. The above does not include Indiana’s gasoline use

19
tax rate (equal to the statewide average pre-tax retail price of gasoline times seven percent). Indiana no longer
levies a sales tax on gasoline. The use tax rate is revised monthly using an updated statewide average pre-tax
retail price of gasoline. In September 2015, the gasoline use tax rate was 14.1 cents.
Kentucky: Gasoline variable excise tax equals nine percent times the average wholesale price of one gallon
of gasoline, rounded to the nearest one-tenth of one cent. For the quarters beginning January 1, 2016, October
1, 2015, July 1, 2015 and April 1, 2015, the tax rate for gasoline is 24.6 cents per gallon. Effective April 1,
2015, the floor price was raised from $1.786 per gallon to $2.177 per gallon.
Maryland: Under the state’s motor fuel tax statute, Maryland imposes a sales and use tax equivalent rate equal
to a specified percentage times the average annual retail price of regular unleaded gasoline, excluding federal
and State taxes. The specified percentage increases over time to 5.0 percent. For September 2015, the
specified rate was 3.0 percent and the average annual retail price of regular unleaded gasoline was 251.10
cents. Thus, the per-gallon SUTE rate on gasoline in September 2015 equaled 7.50 cents. The sales tax
equivalent rate is included in the overall state motor fuel rate in the above map. Beginning July 1, 2013, the
excise tax rate on gasoline was indexed to inflation annually. In September 2015, the excise tax rate on
gasoline was 24.6 cents per gallon.
Nebraska: The state’s motor fuel rate consists of a fixed component and a variable component. The variable
component rate is updated every 6 months. In 2015H2, the gasoline tax rate consisted of a fixed rate of 10.3
cents per gallon, a variable rate component of 2.3 cents per gallon and a wholesale tax rate of 13.5 cents per
gallon.
Nevada: The state rate for motor fuel tax in Nevada is 21.25 cents per gallon, composed of 17.65 cents per
gallon on motor vehicle fuel (NRS 365.175(2)), plus an additional 3.6 cents per gallon tax (NRS 365.180(1).
In addition, all counties levy an optional 1.75 cents per gallon tax (NRS 365.190(1)) and a 1.00 cent per gallon
mandated county tax (NRS 365.192). Counties adopting a streets and highways plan may levy a tax not to
exceed 9 cents per gallon on motor fuel, except for aviation fuel and leaded racing fuel. (NRS 373.030).
New Hampshire: The State “road toll” tax imposed on the sales of motor fuel by distributors is 22.2 cents per
gallon (18 cents per gallon prior to July 1, 2014). Effective July 1, 2014, as required by statute, the “road toll”
tax rate was adjusted by multiplying the ratio of the annual average CPI-All Urban Consumers for the Boston,
Brocton, Nashua; MA-NH-ME-CT area in 2013 divided by the CPI-All Urban Consumers for the Boston,
Brocton, Nashua; MA-NH-ME-CT area for 2003. This CPI adjustment provision will be repealed upon
completion of the bonding for the widening of Interstate 93. Effective July 1, 2014, the State increased both
the gasoline and diesel tax by 4.2 cents per gallon to 22.2 cents per gallon. There have been no further
adjustments to the “road toll” tax rate since July 2014. Thus, the rate in September 2015 remained 22.2 cents
per gallon.
New Jersey: Includes 4.0 cents per gallon petroleum gross receipts tax.
New York: Includes 17.8 cents per gallon business petroleum tax.
North Carolina: Gasoline tax rate consists of a 17.5 cpg flat rate plus a variable wholesale component of 3.5
cpg or seven percent of the average wholesale price of motor fuel during the preceding six-month base period,
whichever is greater. For the period between April 1, 2015 and December 31, 2015, the combined rate was
36.0 cents per gallon (down from 37.5 cents in the prior period). Thus, the combined September 2015 gasoline
tax rate was 36.0 cents per gallon. Effective January 1, 2016 through June 30, 2016, the combined rate fell to
35.0 cents per gallon. The combined rate fell an additional 1.0 cent per gallon to 34.0 cents per gallon for
2016H2. Pennsylvania: Eliminated its excise tax on motor fuels and replaced the excise tax with a cpg equivalent tax
(oil company franchise tax) based on the average wholesale price per gallon. For calendar year 2015, as
specified in statute, the average wholesale price used $2.49 and the gasoline tax was 50.5 cents per gallon. For
diesel fuel, the rate is 64.2 cpg.
Vermont: In addition to 12.1 cent per gallon excise tax, includes 4.31 cents per gallon motor fuel transportation
infrastructure assessment and 13.4 cents per gallon gasoline and motor fuel tax assessment.

20
Virginia: The gasoline tax rate equals 5.1 percent of the statewide average wholesale pre-tax price of a gallon
of unleaded regular gasoline in cents per gallon. For calendar year 2015, the tax rate on gasoline was 16.2
cents per gallon. For the period July 1, 2013 through December 31, 2014, the tax rate was 11.1 cents per
gallon.
West Virginia: Gasoline tax rate includes a variable rate component equal to five percent of the average
wholesale price of gasoline (equal to 14.1 cents per gallon) along with a 20.5 cents per gallon fixes rate.
Sources: Commerce Clearing House, American Petroleum Institute, Federation of Tax Administrators, Federal
Highway Administration and various state revenue/treasury/taxation departments.
Comparisons to Other Nations
Motor fuel tax rates in other countries are much higher than U.S. rates. In September 2015, the
average combined federal and state gasoline tax rate in the U.S. was about 45 cents (rounded to
the nearest cent). For example, in September 2015, all motor fuel taxes in Japan totaled $2.09 per
gallon while British taxes are $4.43 per gallon. These higher taxes increase the average price of
gasoline per gallon to $4.26 per gallon in Japan and $6.41 per gallon in the United Kingdom.
Exhibit 14
World Motor Fuel Prices and Taxes
September 2015
(dollars per gallon)
$2.37$2.95
$4.26
$5.53 $5.77$6.41
US Canada Japan France Germany United Kingdom
Fuel Price Taxes
Note: U.S. tax rate is federal rate plus state weighted average. Prices are for premium gasoline except
for Canada, Japan, and the United States, which are for regular.
Source: U.S. Department of Energy, Energy Information Administration, International Energy Agency.

21
Comparisons to Other Fluids
Motor fuels are a very important part of the economy. Large increases in their prices can cause
economic slowdowns, while sustained low prices can spur economic growth. It is useful to keep
the price of gasoline in perspective. Some other household items are substantially more expensive
on a per-gallon basis as indicated in Exhibit 15.
Exhibit 15
Comparative Prices for Other Fluids
(2015 dollars per gallon)
$2.43 $2.76 $3.42
$5.42
$9.49$10.53
Gasoline Soft Drink Whole Milk Orange Juice Ice Cream Malt Beverage
(from concentrate)(from 2-liter
bottles)
Source: Gasoline price: U.S. Department of Energy, Energy Information Administration, International Energy
Agency. Other prices: U.S. Department of Labor, Bureau of Labor Statistics, 2015 averages.
Other Revenue
Michigan does not operate any toll roads unlike 28 other U.S. states (see Exhibit 16). As the map
indicates, these toll road states are concentrated in the Northeast and South. While not operating
toll roads, Michigan and six other states operate crossing facilities (bridges, tunnels, and ferries)
that charge fees. Michigan operates three toll bridges: the Blue Water Bridge, the Mackinaw
Bridge, and the International Bridge.
State toll and crossing facility revenues vary widely from state to state (see Exhibit 38, located in
the Appendix). In 2012, the latest year information on revenues from state toll and crossing
facilities is available, New Jersey ranked first, collecting $3,550.4 million. California ranked
second with $3,510.7 million and New York placed third at $2,744.2 million. In comparison,
Michigan collected $51.6 million in bridge toll revenues, while 20 states had no state-administered
toll roads or crossing facilities.

22
Exhibit 16
States with Highway Toll Roads
(January 2015)
Source: Federal Highway Administration.

23
3. DIESEL FUEL TAX Collections and Tax Rate
Michigan diesel fuel revenue collections totaled $136.7 million in FY 2014-15 with a tax rate of
15 cents per gallon, yielding $9.1 million per one cent of tax levied. In FY 2015, diesel fuel tax
revenues decreased for the first year since 2009. (see Exhibit 17).
Public Act 584 of 1996 raised the Motor Carrier Fuel Tax (MCFT) rate from 9 cents per gallon to
21 cents per gallon and allowed motor carriers to claim a credit of 6 cents per gallon for sales tax
paid for in-state purchases of fuel. Exhibit 4 provides a graphical illustration of all motor fuel tax
rates from FY 1951 to FY 2015, and Exhibit 33 in the Appendix presents a tabular chronological
review of the same data.
Exhibit 17
Diesel Fuel Tax Revenue
(millions)
$28.4
$85.9
$157.0
$117.7
$129.0
$136.7
$0
$20
$40
$60
$80
$100
$120
$140
$160
1960 1970 1980 1990 2000 2010
Notes: 1976 was a 15-month fiscal year. Diesel fuel revenue includes fees and licenses from FY 1980 to FY 2015.
Source: Michigan Comprehensive Annual Financial Reports.
Fiscal Year

24
Diesel Fuel Taxation
Prior to April 1, 2003, motor carriers paid diesel fuel tax in three different, complicated ways.
Laws passed in 20023 simplified the process effective April 1, 2003, and eliminated any tax
advantage for purchasing fuel outside of Michigan. For the following examples, it is assumed that
the sales and use tax on diesel fuel is 15 cents per gallon (the prepaid sales and use tax rate for
September 2015 (15.1 cents) rounded to the nearest whole cent).
The first example shown in Exhibit 18 is very straightforward. (All diesel sales tax amounts are
for September 2015). Diesel-powered light vehicles (under 13 tons) pay a 15 cents per gallon
diesel fuel tax at the pump and approximately 15 cents per gallon sales tax on each gallon Thus,
in September 2015, motorists paid approximately 30 cents total state tax on a gallon of diesel fuel.
Exhibit 18
Michigan Diesel Fuel Taxation
Diesel Powered Light Vehicles
Pump 15 cents diesel tax
15 cents sales tax
30 cents
The next three examples are for motor carriers. Exhibit 19 shows how diesel fuel is taxed for an
intrastate motor carrier. Before April 1, 2003, the intrastate motor carrier would have paid 9 cents
per gallon diesel fuel tax at the pump along with the 15 cents per gallon sales tax for a total of 24
cents per gallon. On the intrastate carrier’s MCFT return, the MCFT was 21 cents per gallon used.
However, a credit of 9 cents was given for the diesel fuel tax already paid, and a credit of 6 cents
was given for sales tax paid. Therefore, the intrastate motor carrier remitted 6 cents per gallon of
diesel fuel used. In total, the intrastate motor carrier paid a total of 30 cents (9 cents diesel tax, 6
cents MCFT and 15 cents sales tax). Beginning April 1, 2003, intrastate motor carriers simply pay
15 cents diesel tax and 15 cents sales tax at the pump.
3 Public Acts 667 - 669 of 2002.

25
Exhibit 19
Michigan Diesel Fuel Taxation
Michigan Intrastate Motor Carriers
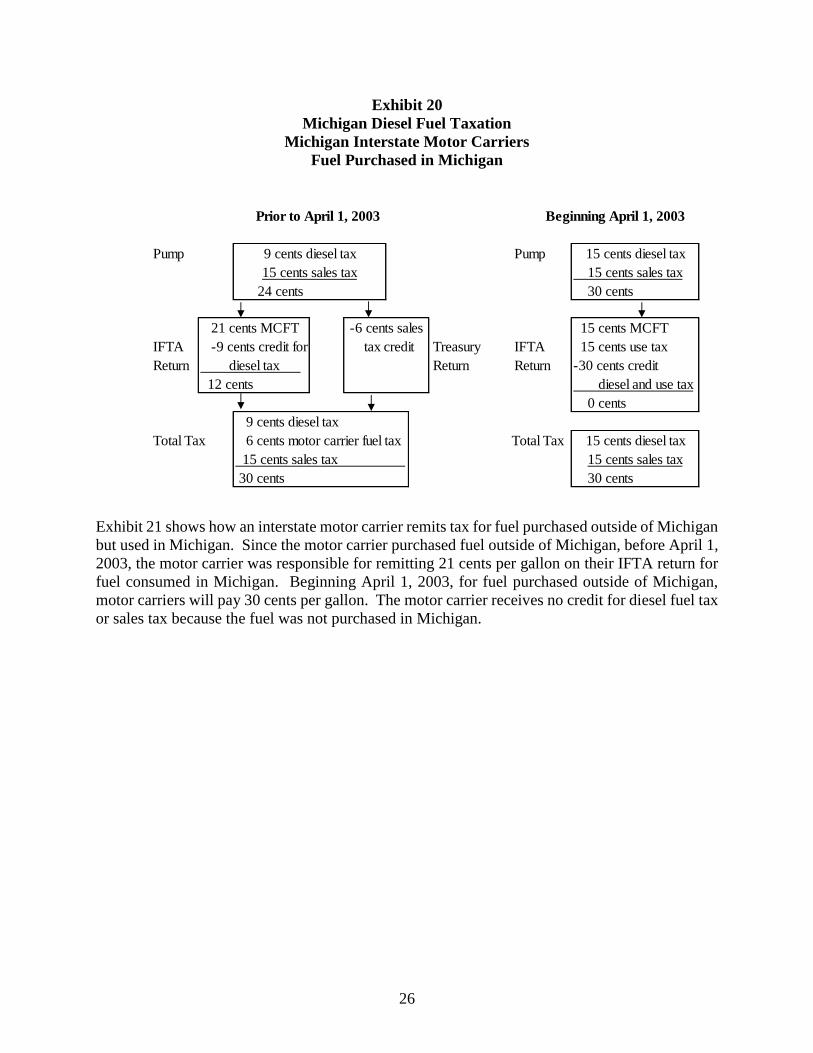
Exhibit 20 gives an example of how an interstate motor carrier remits diesel fuel tax for fuel
purchased in Michigan. Prior to April 1, 2003, the interstate motor carrier paid 24 cents at the
pump (9 cents diesel fuel tax plus 15 cents sales tax), remitted 12 cents on its International Fuel
Tax Agreement (IFTA) return and claimed from the Department of Treasury a 6 cent credit for
sales tax paid. If an interstate motor carrier purchased fuel in Michigan but consumed the fuel
outside the state, the motor carrier claimed a 24 cent per gallon refund (9 cents diesel fuel tax plus
15 cents for sales tax paid at the pump).
Beginning April 1, 2003, an interstate motor carrier pays 30 cents at the pump (15 cents diesel fuel
tax plus 15 cents sales tax), and owes no tax on its IFTA return (15 cents MCFT plus 15 cents use
tax less 30 cents credit). If an interstate motor carrier purchases fuel in Michigan but consumes
the fuel outside the state, the motor carrier will claim a 30 cent per gallon refund (15 cents diesel
fuel plus 15 cents for sales tax paid at the pump).
Prior to April 1, 2003 Beginning April 1, 2003
Pump 9 cents diesel tax Pump 15 cents diesel tax
15 cents sales tax 15 cents sales tax
24 cents 30 cents
MCFT Return 21 cents MCFT MCFT Return No longer used
-9 cents credit for diesel tax
-6 cents credit for sales tax paid
6 cents
Total Tax 9 cents diesel tax Total Tax 15 cents diesel tax
6 cents motor carrier fuel tax 15 cents sales tax
15 cents sales tax 30 cents
30 cents
26
Exhibit 20
Michigan Diesel Fuel Taxation
Michigan Interstate Motor Carriers
Fuel Purchased in Michigan
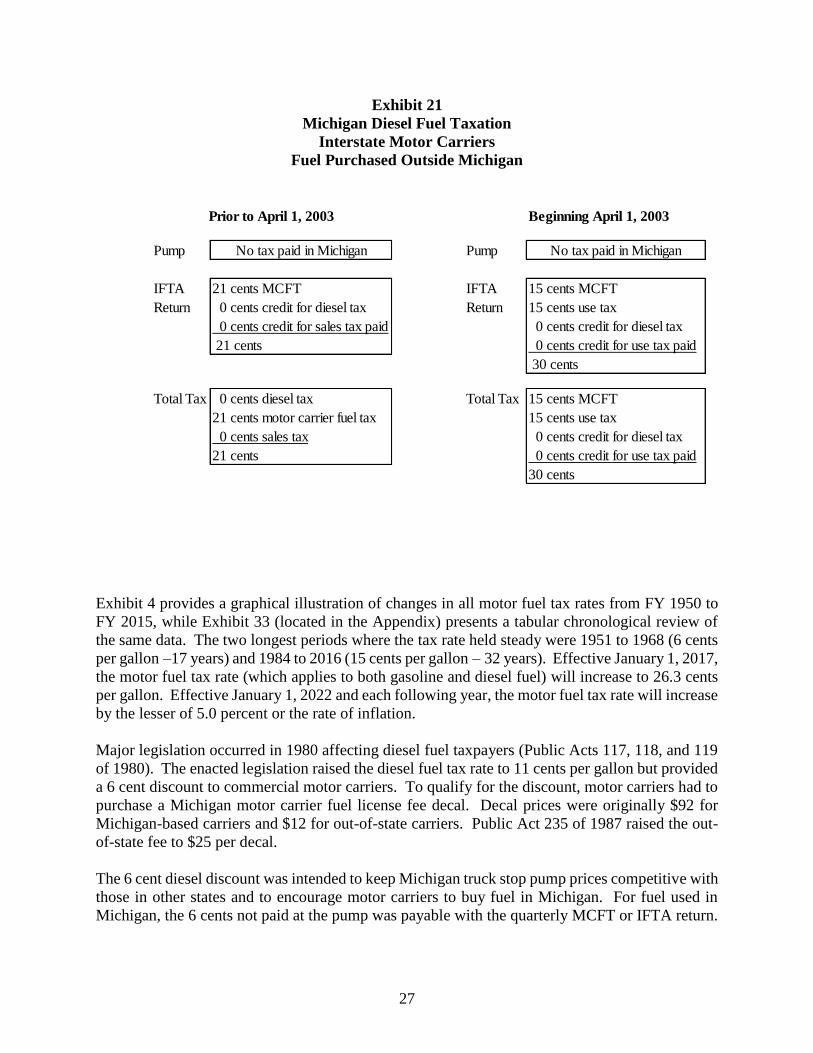
Exhibit 21 shows how an interstate motor carrier remits tax for fuel purchased outside of Michigan
but used in Michigan. Since the motor carrier purchased fuel outside of Michigan, before April 1,
2003, the motor carrier was responsible for remitting 21 cents per gallon on their IFTA return for
fuel consumed in Michigan. Beginning April 1, 2003, for fuel purchased outside of Michigan,
motor carriers will pay 30 cents per gallon. The motor carrier receives no credit for diesel fuel tax
or sales tax because the fuel was not purchased in Michigan.
Prior to April 1, 2003 Beginning April 1, 2003
Pump 9 cents diesel tax Pump 15 cents diesel tax
15 cents sales tax 15 cents sales tax
24 cents 30 cents
21 cents MCFT 15 cents MCFT
IFTA -9 cents credit for Treasury IFTA 15 cents use tax
Return diesel tax Return Return -30 cents credit
12 cents diesel and use tax
0 cents
9 cents diesel tax
Total Tax 6 cents motor carrier fuel tax Total Tax 15 cents diesel tax
15 cents sales tax 15 cents sales tax
30 cents 30 cents
-6 cents sales
tax credit
27
Exhibit 21
Michigan Diesel Fuel Taxation
Interstate Motor Carriers
Fuel Purchased Outside Michigan
Exhibit 4 provides a graphical illustration of changes in all motor fuel tax rates from FY 1950 to
FY 2015, while Exhibit 33 (located in the Appendix) presents a tabular chronological review of
the same data. The two longest periods where the tax rate held steady were 1951 to 1968 (6 cents
per gallon –17 years) and 1984 to 2016 (15 cents per gallon – 32 years). Effective January 1, 2017,
the motor fuel tax rate (which applies to both gasoline and diesel fuel) will increase to 26.3 cents
per gallon. Effective January 1, 2022 and each following year, the motor fuel tax rate will increase
by the lesser of 5.0 percent or the rate of inflation.
Major legislation occurred in 1980 affecting diesel fuel taxpayers (Public Acts 117, 118, and 119
of 1980). The enacted legislation raised the diesel fuel tax rate to 11 cents per gallon but provided
a 6 cent discount to commercial motor carriers. To qualify for the discount, motor carriers had to
purchase a Michigan motor carrier fuel license fee decal. Decal prices were originally $92 for
Michigan-based carriers and $12 for out-of-state carriers. Public Act 235 of 1987 raised the out-
of-state fee to $25 per decal.
The 6 cent diesel discount was intended to keep Michigan truck stop pump prices competitive with
those in other states and to encourage motor carriers to buy fuel in Michigan. For fuel used in
Michigan, the 6 cents not paid at the pump was payable with the quarterly MCFT or IFTA return.
Prior to April 1, 2003 Beginning April 1, 2003
Pump No tax paid in Michigan Pump No tax paid in Michigan
IFTA 21 cents MCFT IFTA 15 cents MCFT
Return 0 cents credit for diesel tax Return 15 cents use tax
0 cents credit for sales tax paid 0 cents credit for diesel tax
21 cents 0 cents credit for use tax paid
30 cents
Total Tax 0 cents diesel tax Total Tax 15 cents MCFT
21 cents motor carrier fuel tax 15 cents use tax
0 cents sales tax 0 cents credit for diesel tax
21 cents 0 cents credit for use tax paid
30 cents

28
However, the diesel discount provided several opportunities for tax non-compliance. The tax
non-compliance could occur for four reasons:
(1) users not legally entitled to the discount bought fuel at the reduced rate,
(2) retailers failed to remit the required 6 cents for diesel fuel taxed at 15 cents,
(3) motor carriers failed to file the required quarterly tax return and failed to pay with the
return the additional 6 cents per gallon on fuel used in Michigan either on the IFTA or
MCFT return, and
(4) interstate motor carriers underreported their gallons used in Michigan.
International Fuel Tax Agreement (IFTA)
On January 1, 1996, Michigan joined the IFTA, a federally mandated fuel tax reporting system.
Under IFTA, interstate motor carriers file a single fuel tax report in their home base state for fuel
taxes owed to states and provinces belonging to IFTA. The motor carriers pay all motor carrier
fuel taxes owed to all IFTA jurisdictions to the carrier’s home state; the home state then disburses
the taxes owed to each IFTA jurisdiction. In addition, IFTA helps make the administration of
MCFT laws uniform for interstate motor carriers, while participation allows jurisdictions to
provide mutual assistance in enforcing rules and collecting taxes. By having motor carriers register
only in their home state, IFTA simplifies enforcement and administration of motor fuel tax
collections. As of September 2015, 48 U.S. states and 10 Canadian provinces belonged to IFTA.
IFTA impacts Michigan motor carriers in different ways. Michigan-based IFTA motor carriers
file one combined IFTA report with the State of Michigan, rather than a separate report for each
IFTA-member jurisdiction in which the motor carrier operates. Motor carriers that operate in
Michigan but are based in other states remit Michigan motor carrier fuel taxes to their home base
state; the home base state will then remit these Michigan fuel taxes to Michigan. Before April 1,
2003, these motor carriers had to submit a separate claim to Michigan for their 6 cents per gallon
credit for sales tax paid. Beginning April 1, 2003, interstate motor carriers who buy diesel fuel in
Michigan claim their 6 percent use tax credit on their IFTA return. IFTA motor carriers based in
other states do not have to obtain a Michigan motor carrier decal, but before April 1, 2003, could
still purchase discounted diesel fuel in Michigan.

29
4. OTHER FUEL TAXES Liquefied Petroleum Gas
Liquefied petroleum gas (LPG) is an alternative fuel used to propel motor vehicles and is currently
taxed at 15 cents per gallon (Public Act 403 of 2000). (Exhibit 4 provides a graphical illustration
of all motor fuel tax rates from FY 1951 to FY 2015, and Exhibit 33 in the Appendix presents a
tabular chronological review of the same data.) LPG collections have totaled less than $0.5 million
per year since FY 2006-07, inclusive. In FY 2014-15, LPG revenues were $0.470 million (see
Exhibit 18), with a $0.03 million yield per one cent of tax levied. LPG tax revenue is restricted to
the MTF.
LPG, also known as propane, is comprised of a minimum of 90 percent propane, 2.5 percent
butane, ethane, and propylene. The most likely vehicles to use LPG as a source of fuel are farm
or fleet vehicles whose owners have access to propane refueling stations. LPG lowers maintenance
costs and prolongs engine life.
Under the 2015 roads funding package, liquefied petroleum is taxed as an “alternative fuel” and,
as such, will be taxed at the motor fuel tax rate effective January 1, 2017. In addition to liquefied
petroleum, “alternative fuel” also includes the following fuels when used in a motor vehicle:
natural gas, compressed natural gas (CNG), liquefied natural gas, hydrogen CNG and hythame.
See Chapter 7 (RECENT DEVELOPMENTS) for further detail.
Exhibit 22
Liquefied Petroleum Gas Tax Revenues
(millions)
$1.285
$1.040
$0.470
$0.0
$0.2
$0.4
$0.6
$0.8
$1.0
$1.2
$1.4
1970 1975 1980 1985 1990 1995 2000 2005 2010 2015
Note: 1976 was a 15-month fiscal year. Source: Michigan Comprehensive Annual Financial Reports.
Fiscal Year

30
Aviation Fuel
Enacted under Public Act 160 of 1931, aviation fuel is taxed at 3 cents per gallon. (Exhibit 4
provides a graphical illustration of all motor fuel tax rates from FY 1951 to FY 2015, and Exhibit
33 in the Appendix presents a tabular chronological review of the same data.) Airline operators
with interstate operations receive a 1.5 cent refund per gallon. In FY 2014-15, aviation fuel tax
collections totaled $6.4 million (see Exhibit 23), with a one cent of tax yield of $2.1 million after
refunds. Aviation fuel tax revenues go to the State Aeronautics Fund.
Exhibit 23
Aviation Fuel Tax Revenues
(millions)
$2.542
$6.816
$8.390
$5.344$5.026
$6.386
$0
$3
$6
$9
1970 1975 1980 1985 1990 1995 2000 2005 2010 2015
Note: 1976 was a 15-month fiscal year.
Source: Michigan Comprehensive Annual Financial Reports.
Fiscal Year

31
5. MOTOR VEHICLE REGISTRATION TAXES Motor Vehicle Weight and Value Tax
The State of Michigan levies an annual motor vehicle registration tax on all vehicles registered for
road use in the state. In FY 2014-15, motor vehicle registration taxes totaled $978.1 million with
tax revenues distributed to the MTF (see Exhibit 24 and Exhibit 39 in the Appendix for a tabular
chronological review of the same data).
Exhibit 24
Motor Vehicle Registration Tax
(millions)
$709.9
$842.1
$978.1
$0
$150
$300
$450
$600
$750
$900
1960 1965 1970 1975 1980 1985 1990 1995 2000 2005 2010 2015
$933.8
Note: 1976 was a 15-month fiscal year.
Source: Michigan Comprehensive Annual Financial Reports.
The state first imposed the registration tax in 1905, at which time motorists paid a one-time $2 fee
per registered automobile. By 1925, the state had moved to an annual registration tax based strictly
on vehicle weight. The weight tax remained in place until 1983.
Public Act 165 of 1983 replaced the vehicle weight registration tax with the current value
registration tax, effective October 1, 1983, for all passenger light vehicles. In a passenger vehicle’s
first registration year, vehicles with a list price under $30,000 are subject to a registration tax
according to a tax table under which the registration tax equals approximately 0.5 percent of the
list price. Passenger vehicles with a list price over $30,000 are subject to a registration tax equal
to 0.5 percent of the list price. The vehicle’s second, third, and fourth year registration tax equals
90 percent of the prior year’s tax. Thereafter, the registration tax remains the same. All other
vehicles subject to the vehicle tax, including passenger light vehicles from model year 1983 and
Fiscal Year
32
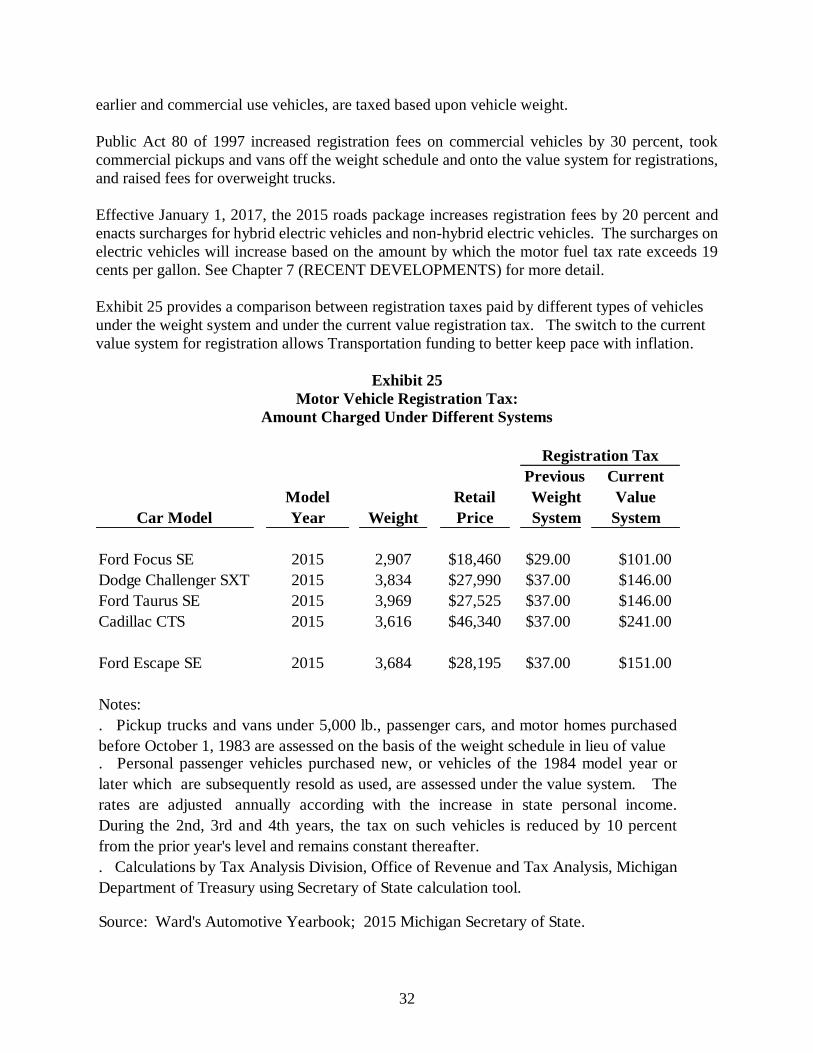
earlier and commercial use vehicles, are taxed based upon vehicle weight.
Public Act 80 of 1997 increased registration fees on commercial vehicles by 30 percent, took
commercial pickups and vans off the weight schedule and onto the value system for registrations,
and raised fees for overweight trucks.
Effective January 1, 2017, the 2015 roads package increases registration fees by 20 percent and
enacts surcharges for hybrid electric vehicles and non-hybrid electric vehicles. The surcharges on
electric vehicles will increase based on the amount by which the motor fuel tax rate exceeds 19
cents per gallon. See Chapter 7 (RECENT DEVELOPMENTS) for more detail. Exhibit 25 provides a comparison between registration taxes paid by different types of vehicles
under the weight system and under the current value registration tax. The switch to the current
value system for registration allows Transportation funding to better keep pace with inflation.
Exhibit 25
Motor Vehicle Registration Tax:
Amount Charged Under Different Systems
Registration Tax
Previous Current
Model Retail Weight Value
Car Model Year Weight Price System System
Ford Focus SE 2015 2,907 $18,460 $29.00 $101.00
Dodge Challenger SXT 2015 3,834 $27,990 $37.00 $146.00
Ford Taurus SE 2015 3,969 $27,525 $37.00 $146.00
Cadillac CTS 2015 3,616 $46,340 $37.00 $241.00
Ford Escape SE 2015 3,684 $28,195 $37.00 $151.00
Notes:
. Calculations by Tax Analysis Division, Office of Revenue and Tax Analysis, Michigan
Department of Treasury using Secretary of State calculation tool.
Source: Ward's Automotive Yearbook; 2015 Michigan Secretary of State.
. Personal passenger vehicles purchased new, or vehicles of the 1984 model year or
later which are subsequently resold as used, are assessed under the value system. The
rates are adjusted annually according with the increase in state personal income.
During the 2nd, 3rd and 4th years, the tax on such vehicles is reduced by 10 percent
from the prior year's level and remains constant thereafter.
. Pickup trucks and vans under 5,000 lb., passenger cars, and motor homes purchased
before October 1, 1983 are assessed on the basis of the weight schedule in lieu of value

33
Licenses and Permits
Michigan transportation revenue is also collected from license and permit fees and miscellaneous
sources. In FY 2014-15, these revenue sources totaled $113.2 million (see Exhibit 26 and Exhibit
39 in the Appendix for a tabular chronological review of the same data). These fees include motor
vehicle title fees, motor vehicle transfer fees, and moped registration fees. Approximately 31.5
percent of these monies are deposited into the MTF with the remaining money split among the
Aeronautics Fund, State Trunkline Fund (STF), and the Comprehensive Transportation Fund.
These revenues do not include motor carrier diesel license fees that have been grouped with diesel
fuel tax revenue.
Exhibit 26
Michigan Transportation
License and Permits, and Miscellaneous Revenue
(millions)
Source: Michigan Comprehensive Annual Financial Reports.
Note: FY 2011- FY 2015, inclusive, figures include several funds that were reclassified from transportation
related to capital funds beginning FY 2011.
$77.7
$99.9
$160.0
$207.8
$115.6
$113.2
$0
$50
$100
$150
$200
$250
1980 1985 1990 1995 2000 2005 2010 2015
Fiscal Year

34
6. TRANSPORTATION FUNDS Michigan Transportation Fund
Established by Public Act 51 of 1951, the Michigan Transportation Fund (MTF) is the primary
means of distributing state revenues for transportation purposes. After distribution of revenue
from off-road gasoline use to the Recreation Improvement Fund and after transfers to other
departments for transportation-related functions, revenues are distributed by a complicated
formula to the State Trunkline Fund, county road commissions, cities and villages, and the
Comprehensive Transportation Fund. The MTF received $2,021.4 million in FY 2014-15 (see
Exhibit 2). Of this amount, $1,201.8 million was distributed by formulas to county road
commissions, cities and villages (see Exhibit 29).
State Trunkline Fund
The State Trunkline Fund (STF) was established by Public Act 51 of 1951, and it provides monies
for construction and maintenance of the state highway system. The MTF transfers and federal and
local contributions provide most of the revenue for the STF. Any fund balance in the STF not
reserved at year-end is used for road and bridge construction projects. The STF also issues bonds
to finance construction and maintenance of state highways whose proceeds are accounted for in
the STF Bond Proceeds Fund. Each bond issue is accounted for separately. The STF own source
revenues were $940.2 million in FY 2014-15 (see Exhibit 2). In addition, MTF distributions to
the STF allowed for total STF expenditures of $1.8 billion (see Exhibit 27). At the end of FY
2014-15, $930.6 million remained available to finance future years’ projects (see Exhibit 28).
Comprehensive Transportation Fund
Created by Public Act 327 of 1972, the Comprehensive Transportation Fund (CTF) assists in the
planning and development of public transportation systems within Michigan. The CTF’s principal
use is for operating grants to local transit systems. The CTF also provides grants for intercity
freight, intercity passenger, and transit development. CTF revenue sources include transfers from
the MTF, a portion of vehicle-related sales tax, and federal and local monies. The CTF also issues
bonds to finance construction and acquisition of comprehensive transportation projects whose
proceeds are accounted for in the Comprehensive Transportation Bond Proceeds Fund. Each bond
issue is accounted for separately. The CTF revenues were $215.3 million in FY 2014-15 (see
Exhibit 2), excluding MTF transfers. The fund's ending balance for FY 2014-15 was $123.2
million (including bond proceeds). (See Exhibit 28).
35
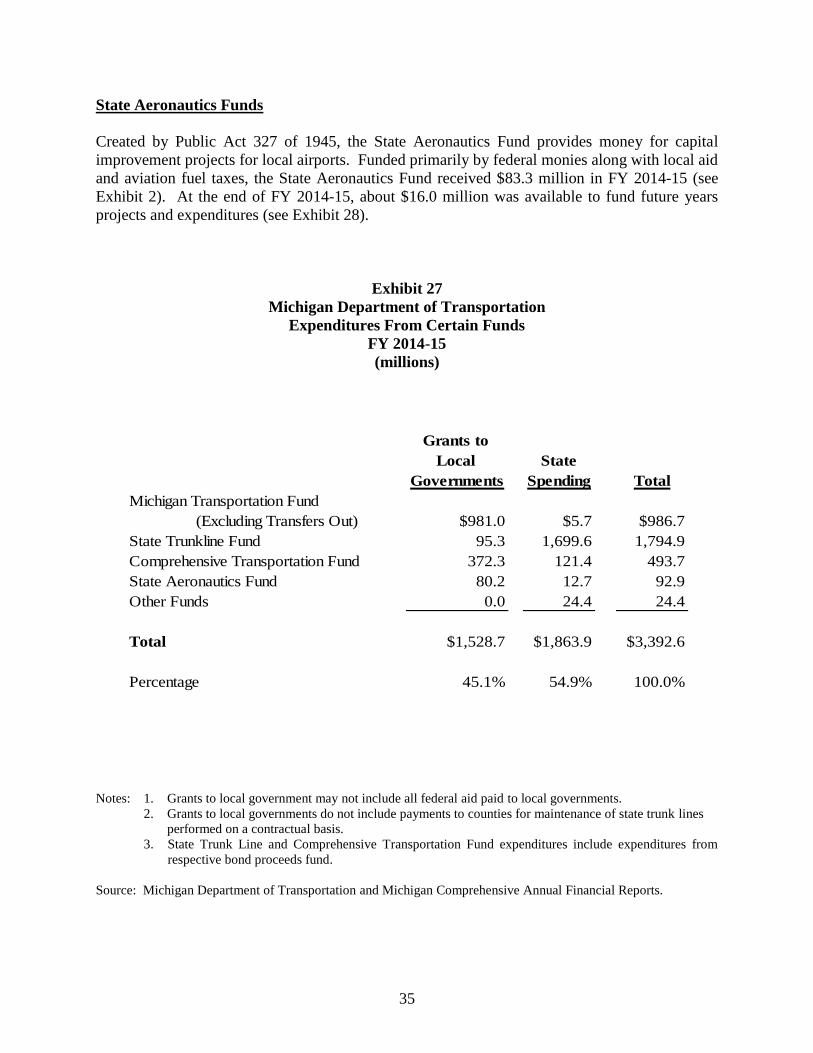
State Aeronautics Funds
Created by Public Act 327 of 1945, the State Aeronautics Fund provides money for capital
improvement projects for local airports. Funded primarily by federal monies along with local aid
and aviation fuel taxes, the State Aeronautics Fund received $83.3 million in FY 2014-15 (see
Exhibit 2). At the end of FY 2014-15, about $16.0 million was available to fund future years
projects and expenditures (see Exhibit 28).
Exhibit 27
Michigan Department of Transportation
Expenditures From Certain Funds
FY 2014-15
(millions)
Grants to
Local State
Governments Spending Total
Michigan Transportation Fund
(Excluding Transfers Out) $981.0 $5.7 $986.7
State Trunkline Fund 95.3 1,699.6 1,794.9
Comprehensive Transportation Fund 372.3 121.4 493.7
State Aeronautics Fund 80.2 12.7 92.9
Other Funds 0.0 24.4 24.4
Total $1,528.7 $1,863.9 $3,392.6
Percentage 45.1% 54.9% 100.0%
Notes: 1. Grants to local government may not include all federal aid paid to local governments.
2. Grants to local governments do not include payments to counties for maintenance of state trunk lines
performed on a contractual basis.
3. State Trunk Line and Comprehensive Transportation Fund expenditures include expenditures from
respective bond proceeds fund.
Source: Michigan Department of Transportation and Michigan Comprehensive Annual Financial Reports.
36
Exhibit 28
Ending Balances of Major Transportation Funds
(millions)
Fund FY 2006 FY 2007 FY 2008 FY 2009 FY 2010 FY 2011 FY 2012 FY 2013 FY 2014 FY 2015
State Aeronautics Fund $22.6 $22.0 $23.0 $22.4 $22.2 $23.0 $21.7 $26.3 $19.6 $16.0
State Trunkline Fund (1) $888.1 $1,134.8 $744.4 $825.5 $611.5 $725.3 $784.9 $812.9 $814.8 $930.6
Comprehensive Transportation Fund (2) $146.3 $145.2 $119.3 $127.2 $114.7 $129.2 $127.4 $132.8 $138.6 $123.2
Total $1,057.1 $1,302.0 $886.7 $975.1 $748.3 $877.6 $934.1 $972.0 $972.9 $1,069.8
Note: 1. Includes balance from the Combined Trunk Line Fund Bond Proceeds Fund.
2. Includes balance from the Combined Comprehensive Transportation Bond Proceeds Fund.
Source: Michigan Comprehensive Annual Financial Reports.

37
Exhibit 29
Michigan Department of Transportation
Grants Made to Local Governments
FY 2014-15
(millions)
Formula Grants to Local Governments
Michigan Transportation Fund Grants to Counties $624.4
Michigan Transportation Fund Grants to Cities and Villages 356.6
Local Program Fund Grants to Counties 21.2
Local Program Fund Grants to Cities and Villages 11.8
Bus Operating Assistance Grants 187.8
Total Formula Grants 1,201.8
Project Grants to Local Governments
Economic Development Fund $51.9
Other State Trunkline Fund Grants 10.4
Other Comprehensive Transportation Fund Grants 184.5
Airport Development 80.2
Total Project Grants 327.0
Total Grants to Local Governments $1,528.7
Source: Michigan Department of Transportation.

38
7. RECENT DEVELOPMENTS In November 2015, the Michigan legislature passed and the Governor signed a seven-bill road
funding package. Below is a brief summary of the 2015 road funding package (Public Acts 174-
180).
Motor Fuel Taxes
Effective January 1, 2017, Public Act 176 of 2015:
Increases the motor fuel tax on gasoline from 19 cents per gallon to 26.3 cents per gallon.
Increases the motor fuel tax rate on diesel fuel from 15 cents per gallon to 26.3 cents per
gallon.
Requires that, beginning 2022, the Department of Treasury must adjust the motor fuel tax
rate by the lesser of the inflation rate or five percent rounded to the nearest 0.1 cent. The
inflation rate equals the change in the U.S. all urban consumers CPI in the directly prior
fiscal year unless the change is negative. If the change is negative, the inflation rate, for
purposes of the Act, equals zero.
The Act increases the initial civil penalty for using dyed diesel fuel on public roads or
highways from $200 to $1,000 and increases the second violation civil penalty from $200
to $5,000. The civil penalty for a third or subsequent violation remains unchanged at
$5,000.
For commercial users, imposes the motor fuel tax to alternative fuels. (Effective January
1, 2018, the Act imposes the motor fuel tax to alternative fuels on persons other than
commercial users or alternative fuel dealers.). The Act
o Defines alternative fuel to include natural gas, compressed natural gas (CNG),
liquefied natural gas, liquefied petroleum, hydrogen CNG and hythame.
o Establishes “gallon equivalent” amounts for alternative fuels. For an alternative
fuel, the motor fuel tax equals the motor fuel tax rate times the alternative fuel’s
gallon equivalent. For example, for compressed natural gas, the gallon equivalent
amount is 5.660 pounds or 126.67 cubic feet at 60 degrees Fahrenheit and one
atmosphere of pressure.
o Repeals the $50 license fee on liquefied petroleum gas dealers.
o Provides for a $500 alternative fuel dealer license and a $50 alternative fuel
commercial user license.
39
Effective January 1, 2017, Public Act 178 of 2015 amended the Motor Carrier Fuel Tax Act to:
Apply the per-gallon or per-gallon- equivalent fuel tax rates under Public Act 176 to motor
carrier purchases of alternative fuel, in addition to motor fuel.
Include gasoline in the definition of “motor fuel” (which meant only diesel fuel prior to
2017).
Define “alternative fuel” and “alternative fuel dealers” as they are defined in PA 176.
Sales Tax on Motor Fuels
Public Act 177 of 2015 amends the Streamlined Sales and Use Revenue Equalization Act to:
Impose a specific tax on motor fuel used in qualified commercial motor vehicles by
interstate carriers.
Provide that the specific tax equals the quarterly statewide average price of a gallon of
undyed diesel fuel or self-serve gasoline, as applicable, multiplied by six percent.
Require the tax on alternative fuel be based on a cents-per-gallon rate or a cents-per-gallon
equivalent rate, as applicable.
Require the Department of Treasury to determine and certify the statewide average price
per gallon of unleaded gasoline and undyed diesel fuel on a quarterly basis. If a statewide
average is not readily available, the department of treasury may use regional or national
average prices per gallon.
Registration Fees
Effective January 1, 2017, Public Act 174 of 2015:
Increases registration fees by 20 percent on passenger vehicles based on the vehicle’s list
price, rounded to the nearest whole dollar amount. Thus, for example, the Act increases
the registration fee for a new $20,000 list price passenger vehicle from $103 to $124.
Raises by 20 percent registration fees on commercial vehicles under the elected gross
weight schedule, rounding to the nearest whole dollar amount. Thus, for example, the Act
increases the registration for a 26,000 gross weight commercial truck from $558 to $670.
Enacts new surcharges for hybrid electric and non-hybrid electric vehicles
o $30 for hybrid electric vehicles weighing 8,000 pounds or less.
40
o $100 for hybrid vehicles weighing more than 8,000 pounds.
o $100 for non-hybrid electric vehicles weighing 8,000 pounds or less.
o $200 for non-hybrid vehicles weighing more than 8,000 pounds.
Provides for increases to the surcharge amounts for hybrid electric and non-hybrid electric
vehicles that are tied to the number of whole cents by which the motor fuel tax exceeds 19
cents with a $2.50 increase per whole cents above 19 cents for hybrid electric vehicles and
a $5.00 increase per whole cents above 19 cents for non-hybrid electric vehicles. With
PA 175’s 7.3 cents per gallon increase in the motor fuel rate above 19.0 cents per gallon
effective January 1, 2017, the road package:
o Adds a surcharge amount of $47.50 on hybrid electric vehicles weighing 8,000 or
less pounds ($30 plus $2.50*(seven whole cents)).
o Adds a $117.50 surcharge to the registration tax on hybrid electric vehicles
weighing more than 8,000 pounds ($100 plus $2.50*(seven whole cents)).
o Adds a surcharge of $135 to the registration tax on non-hybrid electric vehicles
weighing 8,000 or less pounds ($100 plus $5.00*(seven whole cents)).
o Adds a $235 surcharge to the registration tax on non-hybrid electric vehicles
weighing more than 8,000 pounds ($200 plus $5.00*(seven whole cents).
As the motor fuel tax rate is adjusted upward for inflation beginning January 1, 2022 (PA
176), the hybrid electric vehicle and non-hybrid electric vehicle surcharge amounts will
increase further above their January 1, 2017 amounts based upon the number of whole
cents that the motor fuel tax exceeds 27 cents.
Michigan Transportation Fund
Public Act 175 of 2015 enacted the following changes to the Michigan Transportation Fund
Statute:
Revenue Sources
PA 175 allows the Treasurer to receive into the Michigan Transportation Fund (MTF)
monies/assets from any source. Prior to the Act, the State Treasurer was permitted to
deposit only motor fuel tax revenue and registration tax revenue into the MTF.
PA 179 amended the Income Tax Act to allocate to the Michigan Transportation Fund from
income tax revenue the following amounts:
$150.0 million in FY 2019
$325.0 million in FY 2020
$600.0 million in FY 2021 and all subsequent fiscal years.
PA 179 requires the allocation to be distributed using the MTF distribution formula, after
the deduction of specific amounts.

41
Roads Innovation Fund
PA 175 establishes the “Roads Innovation Fund.” Beginning in fiscal year 2017, the Act
requires that the first $100.0 million in fuel tax revenue be deposited each fiscal year into
the Roads Innovation Fund until the adoption of a one-time concurrent resolution of the
Legislature releasing money from the Fund. Monies in the Roads Innovation Fund in the
Fund at the end of a fiscal year shall not lapse to the General Fund. Further, all interest
and earnings of the Fund’s money shall be credited to the Fund.
Once released, the Roads Innovation Fund’s monies -- after specified earmarks -- shall be
distributed according to the Michigan Transportation Fund formula with 10 percent going
to the Comprehensive Transportation Fund. The remaining 90 percent shall be distributed
using the Michigan Transportation Fund distribution formula: 39.1 percent to the State
Trunkline Fund, 39.1 percent to county road commissions and 21.8 percent to cities and
villages.
Distribution of Transportation Funds
The Act makes the following changes to the distribution of funds:
Increases the MTF earmark for debt service from $43.0 million to $50.0 million.
Establishes the Grade Crossing Surface Account within the State Trunkline Fund
(STF) and allows that up to $3.0 million may be appropriated each year to the newly
created Account.
Lowers the maximum percentage of State Trunkline Fund distributions that the
Department of Transportation may spend on administrative expenses from 10.0
percent to 8.0 percent.
For cities in which more than 10.0 million passengers used public transportation in
the prior fiscal year, the Act allows that city, with Department of Transportation
approval, to use up to 20.0 percent of the money that city receives from the
Michigan Transportation Fund for public transit purposes.
Other Major Provisions
PA 175 requires the Department of Transportation to establish the Roads Innovation Task
Force to evaluate road materials and construction cost that could yield higher quality and
longer lasting roads at lower costs over the lifespan of roads. The Act further requires that
the Department of Transportation, county road commissions, cities and villages to get
warranties for road pavement projects costing more than $2.0 million and all construction
projects undertaken after the Act’s enactment.

42
Income Tax
Public Act 179 of 2015 made the following changes to homestead property tax credit statute: :
Increase the total amount of the homestead property tax credit from $1,200 to
$1,500 beginning with tax year 2018 and require annual adjustments for inflation
beginning in 2021. Adjust the credit amount for inflation beginning with tax year
2021.
Require that the homestead credit to be based on property taxes that exceed 3.2
percent (down from 3.5 percent) of total household resources
Require the credit to be based on 23 percent of gross rent paid (up from 20 percent)
beginning tax year 2018.
Require annual inflation adjustments in the maximum taxable value of a homestead
for which the credit may be claimed beginning tax year 2012.
Raise the minimum total household resources threshold from $41,000 to $51,000
effective tax year 2018. Adjust the threshold for inflation beginning with tax year
2021.
Public Act 180 of 2015 amended the Income Tax Act to reduce the individual income tax rate for
a tax year beginning on and after January 1, 2023, if the percentage increase in General
Fund/General Purpose revenue from the prior fiscal year exceeded a positive inflation rate for the
same period, according to a formula prescribed by the Act.

43
8. APPENDIX
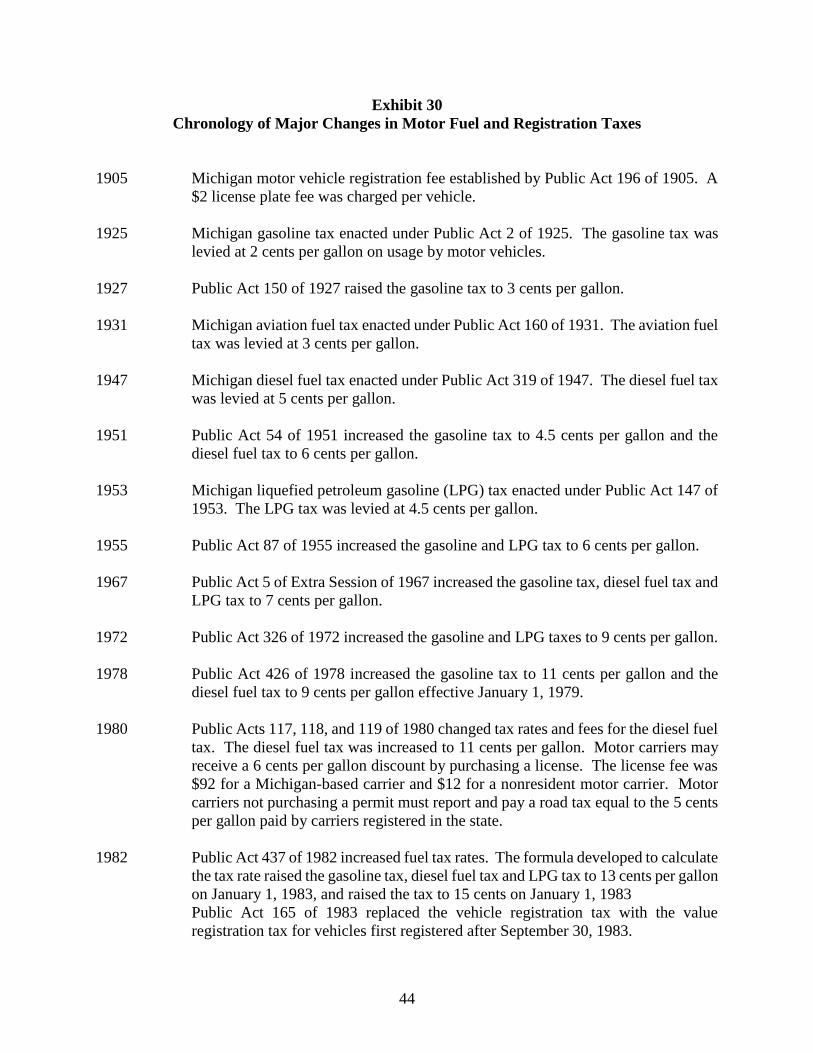
44
Exhibit 30
Chronology of Major Changes in Motor Fuel and Registration Taxes
1905 Michigan motor vehicle registration fee established by Public Act 196 of 1905. A
$2 license plate fee was charged per vehicle.
1925 Michigan gasoline tax enacted under Public Act 2 of 1925. The gasoline tax was
levied at 2 cents per gallon on usage by motor vehicles.
1927 Public Act 150 of 1927 raised the gasoline tax to 3 cents per gallon.
1931 Michigan aviation fuel tax enacted under Public Act 160 of 1931. The aviation fuel
tax was levied at 3 cents per gallon.
1947 Michigan diesel fuel tax enacted under Public Act 319 of 1947. The diesel fuel tax
was levied at 5 cents per gallon.
1951 Public Act 54 of 1951 increased the gasoline tax to 4.5 cents per gallon and the
diesel fuel tax to 6 cents per gallon.
1953 Michigan liquefied petroleum gasoline (LPG) tax enacted under Public Act 147 of
1953. The LPG tax was levied at 4.5 cents per gallon.
1955 Public Act 87 of 1955 increased the gasoline and LPG tax to 6 cents per gallon.
1967 Public Act 5 of Extra Session of 1967 increased the gasoline tax, diesel fuel tax and
LPG tax to 7 cents per gallon.
1972 Public Act 326 of 1972 increased the gasoline and LPG taxes to 9 cents per gallon.
1978 Public Act 426 of 1978 increased the gasoline tax to 11 cents per gallon and the
diesel fuel tax to 9 cents per gallon effective January 1, 1979.
1980 Public Acts 117, 118, and 119 of 1980 changed tax rates and fees for the diesel fuel
tax. The diesel fuel tax was increased to 11 cents per gallon. Motor carriers may
receive a 6 cents per gallon discount by purchasing a license. The license fee was
$92 for a Michigan-based carrier and $12 for a nonresident motor carrier. Motor
carriers not purchasing a permit must report and pay a road tax equal to the 5 cents
per gallon paid by carriers registered in the state.
1982 Public Act 437 of 1982 increased fuel tax rates. The formula developed to calculate
the tax rate raised the gasoline tax, diesel fuel tax and LPG tax to 13 cents per gallon
on January 1, 1983, and raised the tax to 15 cents on January 1, 1983
Public Act 165 of 1983 replaced the vehicle registration tax with the value
registration tax for vehicles first registered after September 30, 1983.

45
1987 Public Act 235 of 1987 increased the nonresident motor carrier license fee to $25.
1992 Public Act 225 of 1992 changed collection point on taxes for gasoline from
wholesalers to refiners/importers and for the first 9 cents of tax on diesel fuel from
retailers to refiners/importers.
1996 Public Act 584 of 1996 increased the MCFT on diesel fuel from 9 cents per gallon
to 21 cents per gallon. A credit of 6 cents per gallon was provided for the amount
of sales tax paid per gallon for in-state fuel purchases. Also, due to the International
Fuel Tax Agreement (IFTA), Michigan can no longer require that out-of-state
truckers purchase a decal to receive the diesel discount.
1997 Public Act 83 of 1997 increased the gasoline tax from 15 cents per gallon to 19
cents per gallon effective August 1, 1997. Public Act 80 of 1997 increased
registration fees on commercial vehicles by 30 percent, took commercial pickups
and vans off the weight schedule and onto the value system for registrations and
raised fees for overweight trucks.
2000 Public Act 403 of 2000 repealed and recodified the Motor Fuel Tax Act. The Act
implemented a dyed diesel fuel program along with other measures to prevent tax
evasion. It also minimized unnecessary regulatory burden on industry while
providing the information needed to effectively administer and enforce the motor
fuel tax.
2002 Public Acts 667 – 669 of 2002 repealed the motor carrier 6 cent diesel discount;
reduced the motor carrier fuel tax rate from 21 cents per gallon to 15 cents per
gallon eliminating the 6 cent sales tax credit; and imposed a 6 percent use tax on
diesel fuel used by interstate motor carriers, allowing a credit for fuel purchased in
Michigan.
2003 Public Act 139 of 2003 amended the General Sales Tax Act to change the statutory
distribution of motor vehicle-related sales tax credited to the Comprehensive
Transportation Fund (CTF). Effective FY 2004 and FY 2005 only, the sales tax
earmark for the CTR was reduced from 27.9 percent of 25 percent sales tax
collected at 4 percent on motor fuels, motor vehicles, and motor vehicle-related
sales, to 24 percent of 25 percent sales tax collected at 4 percent on motor fuels,
motor vehicles, and motor vehicle-related sales.
Public Acts 151 and 152 of 2003 amended the Michigan Vehicle Code (PA 300 of
1949) to increase, and/or redistribute, effective October 1, 2003, a number of fees
currently provided under the Code – driver license fees, vehicle title and registration
service fees, and automobile dealer license fees. The bill also created three new
state-restricted funds (the Transportation Administration Collection Fund (TACF),
the Traffic Law Enforcement and Safety Fund, and the Trooper Recruit School
Fund); provided for a new regulatory fee for the purpose of regulating highway

46
safety; and provided for the allocation of current and increased fee revenue.
2004 Under the Michigan Transportation Fund Act, a city or village could not spend
MTF funds for the construction of local streets unless the money was matched by
local revenues. Also, funds designated for the major street system could be used
for the local street system, but the money had to be matched equally by local
revenue expenditures on the major street system or State trunk line highways.
Public Act 9 of 2004 amended the Michigan Transportation Fund Act to provide
that surplus money returned from the MTF for expenditure on the major street
system may be spent on preservation of the local street system, without regard to
the amount of local revenue spent, until January 1, 2009.
Public Act 163 of 2004 amended the Michigan Vehicle Code to provide that,
effective February 1, 2005, a vehicle registration that was issued by the Secretary
of State for a motorcycle would expire on the owner's birthday, rather than on
March 31 under current law. The bill also deleted a provision requiring a tax on
one-half the rate otherwise imposed by the Code to be collected for all motorcycles
registered after September 30 for the period ending on March 31.
Public Act 172 and 175 of 2004 authorized the state's participation in the
Streamlined Sales Tax Project, a multi-state effort to simplify and modernize sales
and use tax collection and administration as a means of reducing the burden of
collecting these taxes on sellers. Public Act 172 amended the Use Tax Act to make
complementary changes for the state to be in compliance with the agreement, and
Public Act 175 created the Streamlined Sales and Use Tax Revenue Equalization
Act. Under the new law, the 6 percent credit in the use tax act that replaced the 6
cent sales tax credit in the motor carrier fuel tax, and a 6 percent use tax on diesel
fuel purchased by interstate motor carriers were moved to the new streamlined sales
and use tax revenue equalization act. With the change, the revenue from the 6
percent tax is deposited in the MTF.
Public Act 384 of 2004 amended the Michigan Transportation Fund Act (PA 51 of
1951) to establish a Local Bridge Fund, which effective October 1, 2004 replaced
the Critical Bridge Fund/Program. The newly created fund will receive an annual
$5 million earmark from the MTF, plus an earmark of certain revenue from the
Motor Fuel Tax Act: a quarter cent of the gasoline excise tax in TY 2005, and a
half-cent of the gasoline excise tax in subsequent fiscal years.
Public Act 390 of 2004 amended Part 215 (Underground Storage Tank Financial
Assurance) of the Natural Resources and Environmental Protection Act by creating
the Refined Petroleum Fund, and a new sunset date for the 7/8 cent per gallon
regulatory fee on refined petroleum products. Under the new law, the MUSTFA
fee will be collected until December 31, 2010. Those revenues will be deposited
into the newly created fund, and used to finance debt service on Clean Michigan
Initiative Bonds, environmental cleanup programs in the Department of

47
Environmental Quality, and consumer protection programs in the Department of
Agriculture.
2005 Public Act 5 of 2005 amended the Michigan Transportation Fund Act to lower the
population threshold at which a township and a county road commission may enter
into a contract for the preservation of the county local road system within the
township (from a township population of at least 40,000 to 15,000, and eliminated
the county population requirement of at least 500,000); and increase the amount
that a contracting road commission may pay to a contracting township for local
road preservation.
Public Act 141 of 2005 amended the Michigan Vehicle Code to redirect the $5.00
expedited service fee and the $8.00 transfer fee currently deposited in to the MTF
to the Transportation Administration Collection Fund (TACF) for fiscal year 2005,
and 2005 and 2006, respectively.
Public Acts 172 through 174 of 2005 amend PA 222 of 1972 (an act which provides
for a state personal identification card), the Michigan Vehicle Code, and the Natural
Resources and Environmental Protection Act, to direct revenue from commercial
look-up fees to the TACF.
2006 Public Act 82 of 2006 amended the Michigan Transportation Fund law to specify
that the funds required to be spent for non-motorized transportation services and
facilities would have to be used for construction, improvement, or preservation of
those services and facilities
Public Act 268 of 2006 amended the Motor Fuel Tax Act to do the following (1)
Reduce the tax on certain gasoline that is at least 70 percent ethanol from 19 cents
per gallon to 12 cents per gallon for 10 years or less and similarly reduce the diesel
tax on fuel that is at least five percent biodiesel from 15 cents per gallon to 12 cents
per gallon. (2) Require an annual determination of the difference between the
amount of revenue collected under the bill and the amount that would have been
collected under the regular tax rates. (3) Require the Legislature to appropriate the
amount of the difference to the Michigan Transportation Fund (MTF). Public Act
346 of 2006 made parallel amendments the Motor Carrier Fuel Tax Act for motor
fuel containing at least five percent biodiesel that is consumed in qualified
commercial motor vehicles on the public roads or highways within Michigan –
lowering the road tax rate on this alternative fuel from 15 cents per gallon to 12
cents per gallon.
Public Act 277 of 2006 amended the Motor Fuel Tax Act to exclude leaded racing
fuel from the terms “gasoline” and “motor fuel”, and to define “leaded racing fuel”
as a fuel other than diesel fuel that is leaded and at least 100 octane and is used in
vehicles on a racetrack and thus exempt leaded racing fuel from the gasoline/diesel
tax.
Public Act 82 of 2006 amended the Michigan Transportation Fund law to specify

48
that the funds required to be spent for non-motorized transportation services and
facilities would have to be used for construction, improvement, or preservation of
those services and facilities
Public Act 338 of 2006 amended Public Act 51 of 1951, the Michigan
Transportation Fund (MTF) law to increase from 25% to 50% the maximum
amount that a city or village may transfer from its annual major street funding for
the local street system (unless it is following an asset management process).
Public Act 82 of 2006 amended the Michigan Transportation Fund law to specify
that the funds required to be spent for non-motorized transportation services and
facilities would have to be used for construction, improvement, or preservation of
those services and facilities
2008 Public Acts 25 and 26 of 2008 amended the Aeronautics Code and the Motor Fuel
Tax Act, respectively, to exempt aviation fuel that was purchased to formulate
leaded racing fuel (LRF) from the aviation fuel tax and the motor fuel tax.
Public Act 399 of 2008 amended the Natural Resources and Environmental
Protection Act to do the following, for fees paid on or after July 1, 2009: (a)
Increase snowmobile registration and renewal fees from $22 to $30. (b) Allocate
the amount of the fee increase to the Permanent Snowmobile Trail Easement
Subaccount. (c) Dedicate $19, rather than $14, of each registration fee to law
enforcement for snowmobile programs and (d) Discontinue the allocation of $5
from each fee to the Recreational Snowmobile Trail Improvement Subaccount.
Public Act 400 of 2008 increased the snowmobile trail permit sticker fee from $25
to $35 for fiscal years 2009-10 and 2010-2011 and to $45 for the next five fiscal
years, and then requires the fee to be adjusted every five years to reflect changes in
the consumer price index. The Act also created the Permanent Snowmobile Trail
Easement Subaccount and requires proceeds from the sale of land or the termination
of easements or agreements under the bill to be deposited into the Trail Easement
Subaccount.
Public Act 487 of 2008 amended the MTF law to require that, for fiscal year 2009-
10 and each subsequent fiscal year, the Governor and the State Budget Director
include in the annual budget an appropriation from a fund or funds, other than the
Comprehensive Transportation Fund, to a street railway equal to the difference
between its annual operating expenses and revenue, but not more than 8.0 percent
of the total private investment in the street railway.
Public 584 of 2008 implemented the Unified Carrier Registration Agreement, the
motor carrier regulation plan developed pursuant to the Unified Carrier Registration
Act of 2005. In doing so, the Act

49
Requires that money received under the Motor Carrier Act be
appropriated to the Public Service Commission and the Department of
State Police in a manner consistent with a requirement of the UCR Act.
Deletes a requirement that at least 90 percent of the fees collected in
excess of $1.4 million annually be deposited in the Truck Safety Fund;
and requires, instead, at least $750,000 or 10 percent of the collected
fees, whichever was greater, to be deposited in the Fund.
Limits to intrastate motor vehicles provisions assessing an annual
administrative fee against motor carriers, and delete requirements that a
motor carrier licensed in Michigan pay an annual fee for each vehicle it
operates that is registered in Michigan and operating entirely in
interstate commerce.
Deletes provisions establishing an annual fee for each interstate or
foreign motor carrier vehicle operated in Michigan and licensed in
another state or Canadian province, and allowing the PSC to enter into
a reciprocal agreement with a state or province that does not charge
vehicles licensed in Michigan economic regulatory fees or taxes
2010 Public Act 143 of 2010 increased from 30 percent to 50 percent, the share of a
county road commission’s Michigan Transportation Fund primary road system
funds that may be used on the county local road system, as opposed to the county
primary road system. Primary roads are those that are selected on the basis of
greatest general importance to the county; local road system constitute the
remaining roads.
Public Act 261 of 2010 amends the Michigan Transportation Fund (MTF) law, to
allow funds returned to cities and villages to be used for certain transportation-
related capital outlay projects by adding these projects a fifth priority after the four
priorities present in the law before PA 261’s enactment.
2011 Public Act 119 of 2011 removed the stipulation that no monies raised from a
county’s general real or personal property taxes may be diverted under the Act that
allows that county’s board of commissioners to transfer a part of the county’s
general fund surplus to the county road fund.
Public Act 159 of 2011 made numerous amendments to the Michigan Vehicle Code
including:
Delay from October 1, 2011 to October 1, 2015, the sunset on the
requirements that various fees be deposited in the Transportation
Administration Collection Fund (TACF) and the sunset on specific fees
related to vehicle registration and certification of title applications
Delay from December 31, 2012 until October 1, 2015, the sunset on a
tire disposal surcharge.

50
Increase the fee for a vehicle group designation from $25 to $35 as of
January 31, 2012, and require the additional $10 to be used to defray the
cost of compliance with federal regulations.
2012 Public 225 of 2012 allocates 18 percent of fiscal year 2013 General Sales Tax
revenue going to the General Fund (“4 percent sales tax”) on motor fuel to the State
Trunkline Fund (STF). The 4 percent sales tax revenue newly allocated to the STF
will be spent for Federal highway fund matching purposes, subject to a $100 million
limit; and then to county road commissions, cities, and villages for highway, road,
and street projects and related purposes. The Act also requires a deposit to the CTF
of at least 27.9% of the 4% sales tax on sales of motor fuel, motor vehicles, and
vehicle parts and accessories (rather than at least 27.9% of the balance remaining
after the distributions to the school aid fund (SAF) and revenue sharing).
Public Acts 387 through 391 amend Michigan Statute to provide for a Regional
Transit Authority. Public Act 387 created a new act (the Regional Transit Authority
(RTA) Act). The new act establishes a new Regional Transit Authority within "a
public transit region." Initially the Regional Transit Authority created by the bill
would be composed of the counties of Wayne, Oakland, Macomb, and Washtenaw;
however, other adjacent counties could join the authority under a process provided
in the legislation. Public Act 388 amends the Michigan Vehicle Code by adding
new section 801j that allows a Regional Transit Authority to charge an additional
"vehicle registration fee" of not more than $1.20 for each $1,000 of the vehicle's
list price as used in calculating the "fee.” The RTA fee would require the approval
of the voters in the public transit region. PA 388 also authorizes the Secretary of
State to collect the RTA registration fee authorized for credit to the Regional Transit
Authority. Public Act 389 amended the Michigan Zoning Enabling Act to make
the act subject to the Regional Transit Authority Act. Public Act 390 authorized
the Michigan Department of Transportation or a local road agency to enter into an
operating license agreement with a regional transit authority. Public Act 391
amends several sections of the Comprehensive Transportation Fund dealing with
the distribution of money from the Fund.
Based on a 2009 Michigan Department of Transportation cost study, Public Act
421 of 2012 increases the amounts that road agencies are obligated to pay annually
to railroads under Section 315 of the Railroad Code of 1993 for the maintenance of
rail grade crossings.
Beginning September 30, 2014, Public Acts 466, 506 and 507 of 2012 establish
new requirements for certain counties, county road commissions, and other local
road agencies (cities and villages) to obtain any Michigan Transportation Fund
(MTF) monies. For new employees/plans, the Acts establish upper limits on
employer contributions (as percent of base salary) to defined contribution
retirement plans and on defined benefit pension multipliers. The Acts set lower
limits on the number of years of service used to calculate defined benefit plan
payments and on the share of health insurance premiums paid by employees.

51
Effective April 2013, Public Act 509 expands the requirement for prepayment for
a portion of the sales tax (already required for gasoline) to diesel fuel. In addition,
the previous requirement that Treasury determine the prepayment rate on a
quarterly basis was replaced by a requirement that Treasury determine the
prepayment rate on a monthly basis – for both gasoline and diesel fuel.
2013 Public Acts 159 amended the General Sales Tax Act so that sales tax would be sales
tax would be charged on the difference between the price of a new or used motor
vehicle, recreational vehicle, or titled watercraft and the agreed-upon value of any
trade-in (“sales tax on the difference”). Beginning December 15, 2013, the amount
that may be exempted from the sales tax base is the lesser of $2,000 or the agreed-
upon value of the trade-in. The Act phases in the percent of the difference that may
be exempted from the net sales tax base starting with allowing 10 percent of the
difference to be exempted in FY 2014 and then rising to 20 percent in FY 2015, 35
percent in FY 2016, 50 percent in FY 2017, 75 percent in FY 2018 and 100 percent
after FY 2018.
2014 Proposal 15-1 was approved by more than two-thirds of the Senate and the House
of Representatives and thus the Proposal was sent to Michigan voters in May 2015.
If approved, the Proposal would have amended the Michigan Constitution as
follows:
Eliminated sales/use taxes on gasoline/diesel fuel for vehicles on public
roads.
Increased portion of use tax dedicated to School Aid Fund (SAF).
Expanded use of SAF to community colleges and career/technical
education, and prohibit use for 4-year colleges/universities
In addition, if approved, the Proposal would have:
Increased sales/use tax to 7%, as authorized by constitutional amendment.
Increased gasoline/diesel fuel tax and adjust annually for inflation,
increase vehicle registration fees, and dedicate revenue for roads and other
transportation purposes.
Expanded competitive bidding and warranties for road projects.
Increased earned income tax credit.
Note: At the special May 2015 election, voters rejected Proposal 15-1.

52
2015 Public Act 78 of 2015 extended, from September 30, 2015 to September 30, 2019,
the expiration of the regulatory fee levied on various trucks, tractors, and other
specified vehicles utilized for commercial or organizational purposes. PA 78 also
delayed expiration of various fees administered by the Department of State that are
deposited into the Transportation Administration Collection Fund (TACF). Fees
deposited into the TACF are used to defray administrative costs for the Department
of State.
Beginning January 01, 2017, Public Act 174 of 2015 increases registration fees by
20 percent on passenger vehicles based on the vehicle’s list price. PA 174 also
raises by 20 percent registration fees on commercial vehicles under the elected
gross weight schedule. In addition, PA 174 also provides for additional registration
taxes for hybrid electric and nonhybrid electric vehicles. The Act imposes
registration tax surcharge of $30 for hybrid electric vehicles weighing 8,000 pounds
or less and a surcharge of $100 for hybrid vehicles weighing more than 8,000
pounds. In addition to the $30/$100 surcharge base amount, the surcharge on
hybrid electric vehicles are increased an additional $2.50 for each one cent that the
motor fuel tax rate is above 19.0 cents per gallon.
The Act imposes a registration tax surcharge of $100 for non-hybrid electric
vehicles weighing 8,000 pounds or less and imposes a surcharge of $200 for non-
hybrid vehicles weighing more than 8,000 pounds. In addition to the $100/$200,
the registration tax base surcharge on non-hybrid electric vehicles is increased an
additional $5.00 for each one cent that the motor fuel tax rate is above 19.0 cents
per gallon.
As the motor fuel tax rate is adjusted upward for inflation beginning January 1,
2022 (see PA 176 below), the amount added to the registration taxes on hybrid and
non-hybrid will increase based on the amount of whole cents that the motor fuel
rate is above 19 cents.
Public Act 175 of 2015 amends Public Act 51 of 1951 (Michigan Transportation
Fund (MTF) Statute). Prior to PA 175’s enactment, the State Treasurer was
permitted to deposit only motor fuel tax and registration tax revenue into the MTF.
PA 175 established the Roads Innovation Fund. Beginning in FY 2017, the Act
requires that the first $100.0 million in fuel tax revenue be deposited each fiscal
year into the Roads Innovation Fund until the adoption of a one-time concurrent
resolution of the Legislature releasing money from the Fund. Once released, the
Fund’s monies -- after specified earmarks-- shall be distributed according to the
Michigan Transportation Fund formula with 10 percent going to the
Comprehensive Transportation Fund. The remaining 90 percent shall be
distributed using the Michigan Transportation Fund distribution formula: 39.1
percent to the State Trunkline Fund, 39.1 percent to county road commissions and
21.8 percent to cities and villages. The Act increases the earmark for debt service
from $43.0 million to $50.0 million. The Act also lowers the maximum percentage
of Trunkline Fund distributions that the Department of Transportation may spend
on administrative expenses from 10.0 percent to 8.0 percent. Further, the Act

53
establishes the Grade Crossing Surface Account within the State Trunkline Fund
which may receive up to $3.0 million per year. For cities in which more than 10.0
million passengers used public transportation in the prior fiscal year, the Act allows
that city, with Department of Transportation approval, to use up to 20.0 percent of
the money that city receives from the Michigan Transportation Fund for public
transit purposes.
PA 175 requires the Department of Transportation to establish the Roads
Innovation Task Force to evaluate road materials and construction cost that could
yield higher quality and longer lasting roads at lower costs over the lifespan of
roads. The Act further requires that the Department of Transportation, county road
commissions, cities and villages to get warranties for road pavement projects
costing more than $2.0 million and all construction projects undertaken after the
Act’s enactment.
Public Act 176 of 2015 increases the motor fuel tax on gasoline from 19 cents per
gallon to 26.3 cents per gallon. The Act also increases the motor fuel tax rate on
diesel fuel from 15 cents per gallon to 26.3 cents per gallon. Beginning 2022, the
Department of Treasury must adjust the motor fuel tax rate by the lesser of the
inflation rate and five percent and round to the nearest 0.1 cent. The inflation rate
equals the change in the U.S. all urban consumers in the directly prior fiscal year
unless the change is negative. If the change is negative, the inflation rate equals
zero.
The Act increases the initial civil penalty for using dyed diesel fuel on public roads
or highways from $200 to $1,000 and increases the second violation civil penalty
from $200 to $5,000. The civil penalty for a third or subsequent violation remains
unchanged at $5,000.
Effective January 1, 2017, the Act imposes the motor fuel tax on alternative fuels
for alternative fuel dealers and alternative fuel commercial users. Effective January
1, 2018, the Act imposes the motor fuel tax on alternative fuels for persons who are
neither an alternative fuel dealer nor commercial user. As defined by the Act,
alternative fuel includes natural gas, compressed natural gas (CNG), liquefied
natural gas, liquefied petroleum, hydrogen CNG and hythame The Act establishes
“gallon equivalent” amounts for alternative fuels. For an alternative fuel, the motor
fuel tax equals the motor fuel tax rate times the alternative fuel’s gallon equivalent.
For example, for compressed natural gas, the gallon equivalent amount is 5.660
pounds or 126.67 cubic feet at 60 degrees Fahrenheit and one atmosphere of
pressure.
The Act provides for a $500 alternative fuel dealer license and a $50 alternative
commercial user license. The Act also repeals the $50 license fee for LPG.

54
Public Act 177 of 2015 amends the Streamlined Sales and Use Revenue
Equalization Act to impose a specific tax on motor fuel used in qualified
commercial motor vehicles by interstate carriers, and require the tax on alternative
fuel to be based on a per-gallon equivalent to motor fuel. The specific tax equals
the quarterly statewide average price of a gallon of undyed diesel fuel or self-serve
gasoline, as applicable, multiplied by six percent. The department of treasury is
required to determine and certify the statewide average price per gallon of unleaded
gasoline and undyed diesel fuel on a quarterly basis. If a statewide average is not
readily available, the department of treasury may use regional or national average
prices per gallon.
Public Act 178 of 2015 applies the per-gallon or per-gallon-equivalent fuel tax
rates under Public Act 176 to motor carrier purchases of alternative fuel, in addition
to motor fuel, beginning January 1, 2017. Includes gasoline in the definition of
“motor fuel” (which meant only diesel fuel prior to 2017). Defines “alternative
fuel” and “alternative fuel dealers” as they are defined in PA 176.
Public Act 179 of 2015 amends the Income Tax Act to: Allocate to the Michigan
Transportation Fund from income tax revenue: $150.0 million in FY 2019; $325.0
million in FY 2020; and $600.0 million in FY 2021 and all subsequent fiscal years.
Require the allocation to be distributed as provided in Public Act 51 of 1951 for the
distribution of the balance of the MTF after the deduction of specific amounts.

55
Exhibit 31
Gasoline Tax Rankings by State
September 2015
(cents per gallon)
State Gasoline
Tax with Sales Tax
State State Gasoline and Maximum Local
Gasoline Tax Rank Tax with Sales Tax Rank Gasoline Taxes Rank
Alabama 16.0 46 16.0 46 24.0 30
Alaska 9.0 50 9.0 50 9.0 50
Arizona 18.0 39 18.0 41 18.0 44
Arkansas 21.5 32 21.5 36 21.5 38
California 30.0 11 36.9 3 36.9 5
Colorado 22.0 31 22.0 35 22.0 37
Connecticut 36.4 3 36.4 4 36.4 7
Delaware 23.0 27 23.0 31 23.0 33
Florida 23.4 26 23.4 30 36.6 6
Georgia 26.0 20 26.0 25 26.0 27
Hawaii 17.0 42 26.1 23 44.1 4
Idaho 32.0 8 32.0 12 32.0 15
Illinois 19.0 37 33.6 8 44.6 3
Indiana 18.0 39 32.1 10 32.1 13
Iowa 30.8 10 30.8 15 30.8 19
Kansas 24.0 24 24.0 28 24.0 30
Kentucky 24.6 22 24.6 26 24.6 28
Louisiana 20.0 34 20.0 38 20.0 40
Maine 30.0 11 30.0 16 30.0 20
Maryland 32.1 7 32.1 10 32.1 13
Massachusetts 24.0 24 24.0 28 24.0 30
Michigan 19.0 37 31.2 13 31.2 17
Minnesota 28.5 15 28.5 19 28.5 22
Mississippi 18.0 39 18.0 41 21.0 39
Missouri 17.0 42 17.0 43 17.0 45
Montana 27.0 18 27.0 22 27.0 25
Nebraska 26.1 19 26.1 23 26.1 26
Nevada 21.3 33 21.3 37 31.3 16
New Hampshire 22.2 30 22.2 34 22.2 36
New Jersey 14.5 49 14.5 49 14.5 49
New Mexico 17.0 42 17.0 43 17.0 45
New York 25.8 21 34.5 7 34.5 11
North Carolina 36.0 4 36.0 5 36.0 8
North Dakota 23.0 27 23.0 31 23.0 33
Ohio 28.0 16 28.0 20 28.0 23
Oklahoma 16.0 46 16.0 46 16.0 47
Oregon 30.0 11 30.0 16 35.0 9
Pennsylvania 50.5 1 50.5 1 50.5 1
Rhode Island 33.0 6 33.0 9 33.0 12
South Carolina 16.0 46 16.0 46 16.0 47
South Dakota 28.0 16 28.0 20 28.0 23
Tennessee 20.0 34 20.0 38 20.0 40
Texas 20.0 34 20.0 38 20.0 40
Utah 24.5 23 24.5 27 24.5 29
Vermont 29.8 14 29.8 18 29.8 21
Virginia 16.2 45 16.2 45 19.2 43
Washington 44.5 2 44.5 2 45.5 2
West Virginia 34.6 5 34.6 6 34.6 10
Wisconsin 30.9 9 30.9 14 30.9 18
Wyoming 23.0 27 23.0 31 23.0 33
Sources: Sources: Commerce Clearing House, Federation of Tax Administrators, Federal Highway Administration,
American Petroleum Institute and revenue/taxation departments in various states.

56
Exhibit 32
Michigan Motor Fuel Revenue History
Liquefied
Fiscal Gasoline Tax Diesel Fuel Petroleum Aviation Fuel
Year Revenue Revenue* Revenue Revenue
1956 $130,961,671 $1,249,857 $67,853 $571,402
1957 133,407,898 1,426,389 67,131 761,679
1958 133,818,382 1,588,005 77,951 849,111
1959 135,496,651 1,941,655 72,620 880,685
1960 142,789,451 2,510,539 69,612 962,448
1961 144,426,700 2,828,688 70,330 982,406
1962 148,103,666 3,340,036 79,430 1,109,821
1963 153,087,531 3,949,215 86,258 1,195,797
1964 161,406,978 4,729,550 86,335 1,032,144
1965 170,747,556 5,860,153 96,022 1,338,337
1966 181,660,659 7,087,586 106,287 1,646,505
1967 187,235,437 7,983,849 107,041 2,136,185
1968 209,989,524 9,648,641 120,654 2,486,798
1969 242,556,482 11,953,982 125,286 3,213,298
1970 256,858,580 13,173,736 129,001 3,556,796
1971 266,473,195 13,944,833 142,748 3,261,618
1972 281,878,162 15,877,405 162,813 2,879,953
1973 328,716,356 18,686,540 194,846 3,176,143
1974 377,584,888 19,542,204 236,919 3,465,785
1975 373,818,635 18,680,365 255,532 3,258,367
1976 486,325,904 24,842,248 313,544 4,001,229
1977 402,755,827 22,959,514 282,813 3,705,705
1978 413,188,311 24,696,828 274,235 3,873,510
1979 472,280,488 30,417,938 297,822 4,462,639
1980 448,192,599 30,861,342 358,859 3,431,017
1981 417,491,808 28,358,625 543,443 3,543,699
1982 430,961,796 31,673,186 825,249 2,911,342
1983 433,052,572 36,531,879 1,072,670 2,542,207
1984 527,680,752 48,596,242 1,285,380 3,277,720
1985 569,708,205 54,763,729 1,273,922 3,896,310
1986 595,729,891 57,469,568 1,088,072 4,271,737
1987 604,479,419 60,881,145 950,226 5,219,748
1988 628,520,349 67,251,468 912,318 5,659,592
1989 624,951,721 71,479,395 954,007 5,605,366
1990 626,229,262 69,945,463 1,044,455 6,815,683
1991 622,513,663 69,884,933 971,290 6,184,456
1992 631,024,833 71,930,644 1,002,404 6,566,513
1993 657,191,544 84,876,025 1,068,636 7,360,801
1994 658,877,569 88,963,786 1,089,271 7,809,245
1995 681,711,071 95,047,310 816,254 7,772,204
1996 680,586,256 83,674,911 1,076,765 7,974,804
1997 736,316,612 85,912,538 1,051,127 6,698,560
1998 903,542,085 118,242,235 1,017,898 6,867,759
1999 931,031,120 134,545,842 798,258 8,389,628

57
Exhibit 32 cont.
Michigan Motor Fuel Revenue History
Liquefied
Fiscal Gasoline Tax Diesel Fuel Petroleum Aviation Fuel
Year Revenue Revenue* Revenue Revenue
2000 $921,991,065 $143,461,574 $1,039,944 $7,732,150
2001 933,494,040 133,184,171 966,056 6,705,528
2002 938,911,784 142,977,457 891,352 6,698,836
2003 935,671,742 156,952,935 560,752 7,401,938
2004 932,139,677 140,515,681 623,861 7,721,014
2005 922,368,211 146,335,499 463,887 6,718,713
2006 906,220,722 148,599,481 571,586 5,974,483
2007 883,687,513 143,806,436 367,880 6,334,663
2008 848,864,067 140,095,617 415,034 5,344,254
2009 846,013,305 117,671,767 398,560 5,691,549
2010 841,658,744 120,121,889 337,918 5,421,677
2011 831,717,538 125,639,800 346,151 5,621,413
2012 818,797,704 126,821,282 350,457 5,026,508
2013 821,632,225 128,970,822 395,001 5,026,431
2014 820,625,646 137,854,345 392,999 5,056,196
2015 866,609,209 136,749,318 469,687 6,386,372
Source: Michigan Department of Treasury
* From FY 1980 to 2015, diesel fuel revenue includes diesel fuel tax, motor carrier diesel fuel tax and motor
carrier diesel license fees.
** 1976 was a 15-month fiscal year.

58
Exhibit 33
Michigan Motor Fuel Tax Rates
(cents per gallon)
Fiscal Fiscal
Year Year Gasoline Diesel LPG Aviation
1925 1925-1926 2 na na na
1927 1927-1930 3 na na na
1931 1931-1946 3 na na 3
1947 1947-1950 3 5 na 3
1951 1951-1953 4.5 6 na 3
1954 1954 4.5 6 4.5 3
1955 1955 4.5/6 6 4.5/6 3
1956 1956-1967 6 6 6 3
1968 1968 6/7 6/7 6/7 3
1969 1969-1972 7 7 7 3
1973 1973 7/9 7 7/9 3
1974 1974-1978 9 7 9 3
1979 1979 9/11 7/9 9/11 3
1980 1980 11 9/11 11 3
1981 1981-1982 11 11 11 3
1983 1983 11/13 11/13 11/13 3
1984 1984 13/15 13/15 13/15 3
1985 1985-1996 15 15 15 3
1997 1997 15/19 15 15 3
1998 1998-2015 19 15 15 3
Source: Michigan Department of Treasury
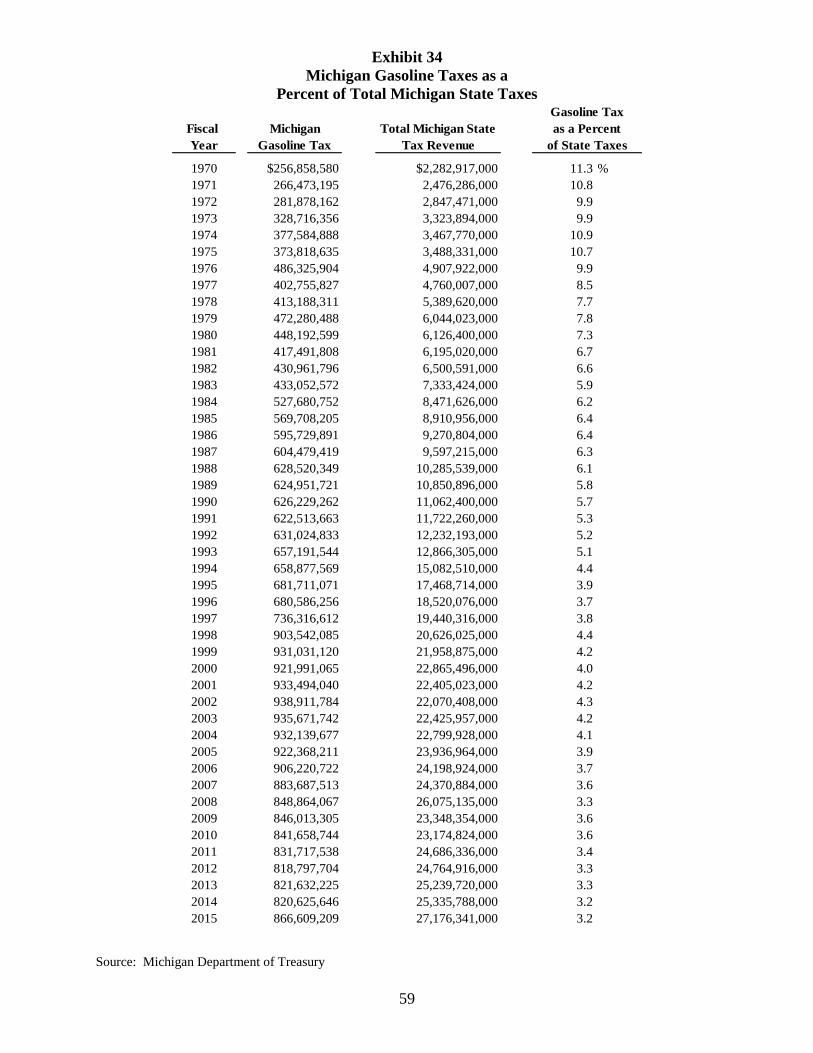
59
Exhibit 34
Michigan Gasoline Taxes as a
Percent of Total Michigan State Taxes
Fiscal Michigan Total Michigan State
Year Gasoline Tax Tax Revenue
1970 $256,858,580 $2,282,917,000 11.3 %
1971 266,473,195 2,476,286,000 10.8
1972 281,878,162 2,847,471,000 9.9
1973 328,716,356 3,323,894,000 9.9
1974 377,584,888 3,467,770,000 10.9
1975 373,818,635 3,488,331,000 10.7
1976 486,325,904 4,907,922,000 9.9
1977 402,755,827 4,760,007,000 8.5
1978 413,188,311 5,389,620,000 7.7
1979 472,280,488 6,044,023,000 7.8
1980 448,192,599 6,126,400,000 7.3
1981 417,491,808 6,195,020,000 6.7
1982 430,961,796 6,500,591,000 6.6
1983 433,052,572 7,333,424,000 5.9
1984 527,680,752 8,471,626,000 6.2
1985 569,708,205 8,910,956,000 6.4
1986 595,729,891 9,270,804,000 6.4
1987 604,479,419 9,597,215,000 6.3
1988 628,520,349 10,285,539,000 6.1
1989 624,951,721 10,850,896,000 5.8
1990 626,229,262 11,062,400,000 5.7
1991 622,513,663 11,722,260,000 5.3
1992 631,024,833 12,232,193,000 5.2
1993 657,191,544 12,866,305,000 5.1
1994 658,877,569 15,082,510,000 4.4
1995 681,711,071 17,468,714,000 3.9
1996 680,586,256 18,520,076,000 3.7
1997 736,316,612 19,440,316,000 3.8
1998 903,542,085 20,626,025,000 4.4
1999 931,031,120 21,958,875,000 4.2
2000 921,991,065 22,865,496,000 4.0
2001 933,494,040 22,405,023,000 4.2
2002 938,911,784 22,070,408,000 4.3
2003 935,671,742 22,425,957,000 4.2
2004 932,139,677 22,799,928,000 4.1
2005 922,368,211 23,936,964,000 3.9
2006 906,220,722 24,198,924,000 3.7
2007 883,687,513 24,370,884,000 3.6
2008 848,864,067 26,075,135,000 3.3
2009 846,013,305 23,348,354,000 3.6
2010 841,658,744 23,174,824,000 3.6
2011 831,717,538 24,686,336,000 3.4
2012 818,797,704 24,764,916,000 3.3
2013 821,632,225 25,239,720,000 3.3
2014 820,625,646 25,335,788,000 3.2
2015 866,609,209 27,176,341,000 3.2
as a Percent
of State Taxes
Gasoline Tax
Source: Michigan Department of Treasury
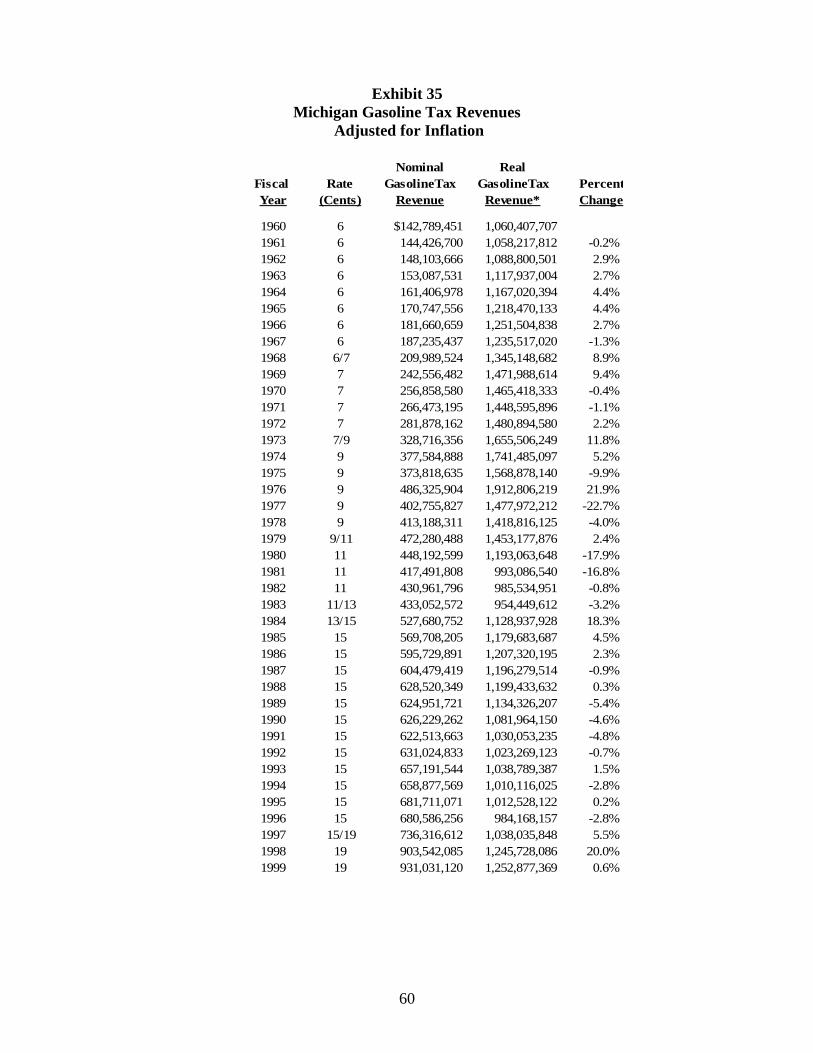
60
Exhibit 35
Michigan Gasoline Tax Revenues
Adjusted for Inflation
Nominal Real
Fiscal Rate GasolineTax GasolineTax Percent
Year (Cents) Revenue Revenue* Change
1960 6 $142,789,451 1,060,407,707
1961 6 144,426,700 1,058,217,812 -0.2%
1962 6 148,103,666 1,088,800,501 2.9%
1963 6 153,087,531 1,117,937,004 2.7%
1964 6 161,406,978 1,167,020,394 4.4%
1965 6 170,747,556 1,218,470,133 4.4%
1966 6 181,660,659 1,251,504,838 2.7%
1967 6 187,235,437 1,235,517,020 -1.3%
1968 6/7 209,989,524 1,345,148,682 8.9%
1969 7 242,556,482 1,471,988,614 9.4%
1970 7 256,858,580 1,465,418,333 -0.4%
1971 7 266,473,195 1,448,595,896 -1.1%
1972 7 281,878,162 1,480,894,580 2.2%
1973 7/9 328,716,356 1,655,506,249 11.8%
1974 9 377,584,888 1,741,485,097 5.2%
1975 9 373,818,635 1,568,878,140 -9.9%
1976 9 486,325,904 1,912,806,219 21.9%
1977 9 402,755,827 1,477,972,212 -22.7%
1978 9 413,188,311 1,418,816,125 -4.0%
1979 9/11 472,280,488 1,453,177,876 2.4%
1980 11 448,192,599 1,193,063,648 -17.9%
1981 11 417,491,808 993,086,540 -16.8%
1982 11 430,961,796 985,534,951 -0.8%
1983 11/13 433,052,572 954,449,612 -3.2%
1984 13/15 527,680,752 1,128,937,928 18.3%
1985 15 569,708,205 1,179,683,687 4.5%
1986 15 595,729,891 1,207,320,195 2.3%
1987 15 604,479,419 1,196,279,514 -0.9%
1988 15 628,520,349 1,199,433,632 0.3%
1989 15 624,951,721 1,134,326,207 -5.4%
1990 15 626,229,262 1,081,964,150 -4.6%
1991 15 622,513,663 1,030,053,235 -4.8%
1992 15 631,024,833 1,023,269,123 -0.7%
1993 15 657,191,544 1,038,789,387 1.5%
1994 15 658,877,569 1,010,116,025 -2.8%
1995 15 681,711,071 1,012,528,122 0.2%
1996 15 680,586,256 984,168,157 -2.8%
1997 15/19 736,316,612 1,038,035,848 5.5%
1998 19 903,542,085 1,245,728,086 20.0%
1999 19 931,031,120 1,252,877,369 0.6%

61
Exhibit 35 (continued)
Michigan Gasoline Tax Revenues
Adjusted for Inflation
Nominal Real
Fiscal Rate GasolineTax GasolineTax Percent
Year (Cents) Revenue Revenue* Change
2000 19 $921,991,065 1,200,166,123 -4.2%
2001 19 $933,494,040 1,176,685,888 -2.0%
2002 19 $938,911,784 1,158,844,596 -1.5%
2003 19 $935,671,742 1,126,291,725 -2.8%
2004 19 $932,139,677 1,107,436,530 -1.7%
2005 19 $922,368,211 1,069,156,523 -3.5%
2006 19 $906,220,722 1,013,440,650 -5.2%
2007 19 $883,687,513 972,846,698 -4.0%
2008 19 $848,864,067 908,949,550 -6.6%
2009 19 $846,013,305 914,023,301 0.6%
2010 19 $841,658,744 900,868,747 -1.4%
2011 19 $831,717,538 867,745,877 -3.7%
2012 19 $818,797,704 834,126,460 -3.9%
2013 19 $821,632,225 821,632,225 -1.5%
2014 19 $820,625,646 811,604,851 -1.2%
2015 19 $866,609,209 866,609,209 6.8%
* Adjusted by Detroit Consumer Price Index to 2015 dollars.

62
Exhibit 36
State Motor Fuel Tax Rates and
Other Transportation-Related Taxes, September 2015
(cents) IFTA
Gasoline Diesel Motor Carrier Local State Sales Tax Highway
State Tax Rate Tax Rate Tax Rate Gasoline Tax on Gasoline Toll Roads
Alabama 16.0 19.0 19.0 Yes Yes
Alaska 9.0 9.0 9.0
Arizona 18.0 18.0 26.0
Arkansas 21.5 22.5 22.5
California 30.0 13.0 45.0 Yes Yes
Colorado 22.0 20.5 20.5 Yes
Connecticut 36.4 50.3 50.3
Delaware 23.0 22.0 22.0 Yes
Florida 23.4 24.6 33.7 Yes Yes
Georgia 26.0 29.0 29.0
Hawaii 17.0 17.0 26.1 Yes Yes
Idaho 32.0 32.0 32.0
Illinois 19.0 21.5 42.7 Yes Yes Yes
Indiana 18.0 16.0 27.0 Yes Yes
Iowa 30.8 32.5 32.5
Kansas 24.0 26.0 26.0 Yes
Kentucky 24.6 21.6 31.8
Louisiana 20.0 20.0 20.0 Yes
Maine 30.0 31.2 31.2 Yes
Maryland 32.1 32.9 32.9 Yes
Massachusetts 24.0 24.0 24.0 Yes
Michigan 19.0 15.0 28.7 Yes
Minnesota 28.5 28.5 28.5 Yes
Mississippi 18.0 18.0 18.0 Yes
Missouri 17.0 17.0 17.0
Montana 27.0 27.8 27.8
Nebraska 26.1 26.1 26.1
Nevada 21.3 27.0 27.0 Yes Yes
New Hampshire 22.2 22.2 22.2 Yes
New Jersey 14.5 17.5 17.5 Yes
New Mexico 17.0 21.0 21.0
New York 25.8 24.1 40.1 Yes Yes
North Carolina 36.0 36.0 36.0 Yes
North Dakota 23.0 23.0 23.0
Ohio 28.0 28.0 28.0 Yes
Oklahoma 16.0 13.0 13.0 Yes
Oregon 30.0 30.0 30.0 Yes
Pennsylvania 50.5 64.2 64.2 Yes
Rhode Island 33.0 33.0 33.0
South Carolina 16.0 16.0 16.0 Yes
South Dakota 28.0 28.0 28.0
Tennessee 20.0 17.0 17.0
Texas 20.0 20.0 20.0 Yes
Utah 24.5 24.5 24.5 Yes
Vermont 29.8 31.0 31.0 Yes
Virginia 16.2 20.2 23.7 Yes Yes
Washington 44.5 44.5 44.5 Yes Yes
West Virginia 34.6 34.6 34.6 Yes
Wisconsin 30.9 30.9 32.9
Wyoming 23.0 23.0 24.0
Sources: Commerce Clearing House, Federation of Tax Administrators, Federal Highway Administration, American Petroleum
Institute and revenue/taxation departments in various states.
Sources: Commerce Clearing House, Federation of Tax Administrators, Federal Highway Administration, American Petroleum Institute and revenue/taxation departments in various states. Virginia has a local option sales tax on motor fuel.
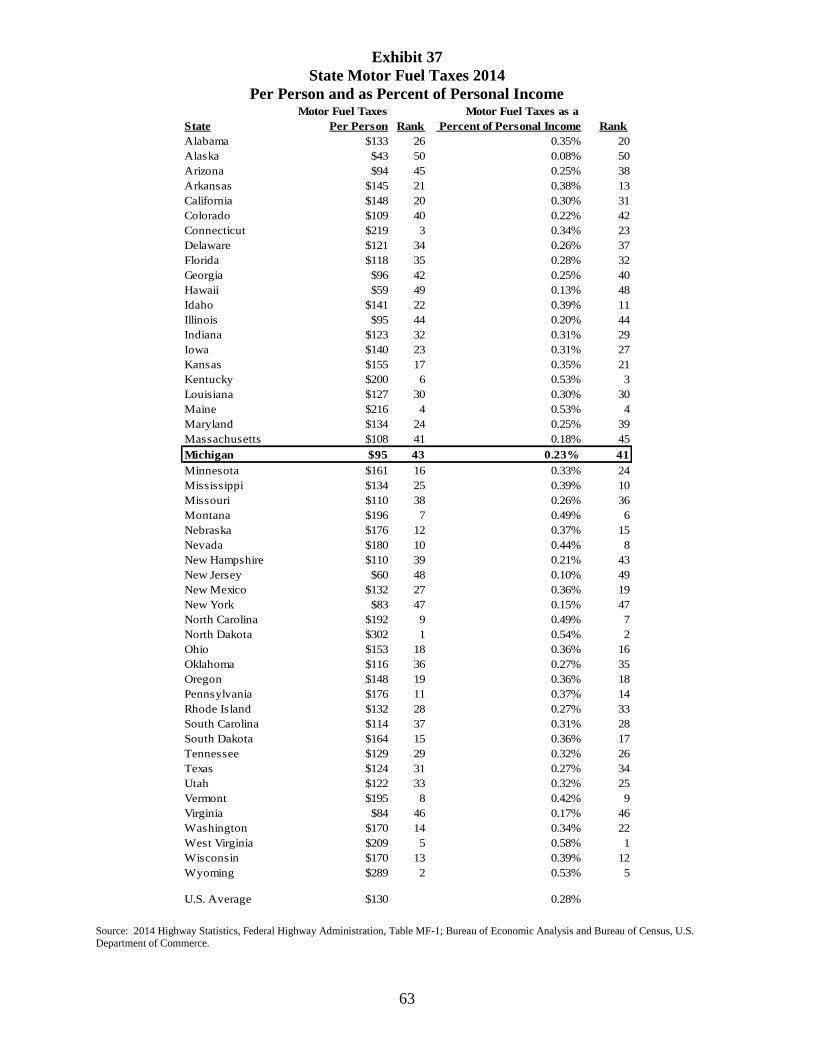
63
Exhibit 37
State Motor Fuel Taxes 2014
Per Person and as Percent of Personal Income Motor Fuel Taxes Motor Fuel Taxes as a
State Per Person Rank Percent of Personal Income Rank
Alabama $133 26 0.35% 20
Alaska $43 50 0.08% 50
Arizona $94 45 0.25% 38
Arkansas $145 21 0.38% 13
California $148 20 0.30% 31
Colorado $109 40 0.22% 42
Connecticut $219 3 0.34% 23
Delaware $121 34 0.26% 37
Florida $118 35 0.28% 32
Georgia $96 42 0.25% 40
Hawaii $59 49 0.13% 48
Idaho $141 22 0.39% 11
Illinois $95 44 0.20% 44
Indiana $123 32 0.31% 29
Iowa $140 23 0.31% 27
Kansas $155 17 0.35% 21
Kentucky $200 6 0.53% 3
Louisiana $127 30 0.30% 30
Maine $216 4 0.53% 4
Maryland $134 24 0.25% 39
Massachusetts $108 41 0.18% 45
Michigan $95 43 0.23% 41
Minnesota $161 16 0.33% 24
Mississippi $134 25 0.39% 10
Missouri $110 38 0.26% 36
Montana $196 7 0.49% 6
Nebraska $176 12 0.37% 15
Nevada $180 10 0.44% 8
New Hampshire $110 39 0.21% 43
New Jersey $60 48 0.10% 49
New Mexico $132 27 0.36% 19
New York $83 47 0.15% 47
North Carolina $192 9 0.49% 7
North Dakota $302 1 0.54% 2
Ohio $153 18 0.36% 16
Oklahoma $116 36 0.27% 35
Oregon $148 19 0.36% 18
Pennsylvania $176 11 0.37% 14
Rhode Island $132 28 0.27% 33
South Carolina $114 37 0.31% 28
South Dakota $164 15 0.36% 17
Tennessee $129 29 0.32% 26
Texas $124 31 0.27% 34
Utah $122 33 0.32% 25
Vermont $195 8 0.42% 9
Virginia $84 46 0.17% 46
Washington $170 14 0.34% 22
West Virginia $209 5 0.58% 1
Wisconsin $170 13 0.39% 12
Wyoming $289 2 0.53% 5
U.S. Average $130 0.28%
Source: 2014 Highway Statistics, Federal Highway Administration, Table MF-1; Bureau of Economic Analysis and Bureau of Census, U.S.
Department of Commerce.
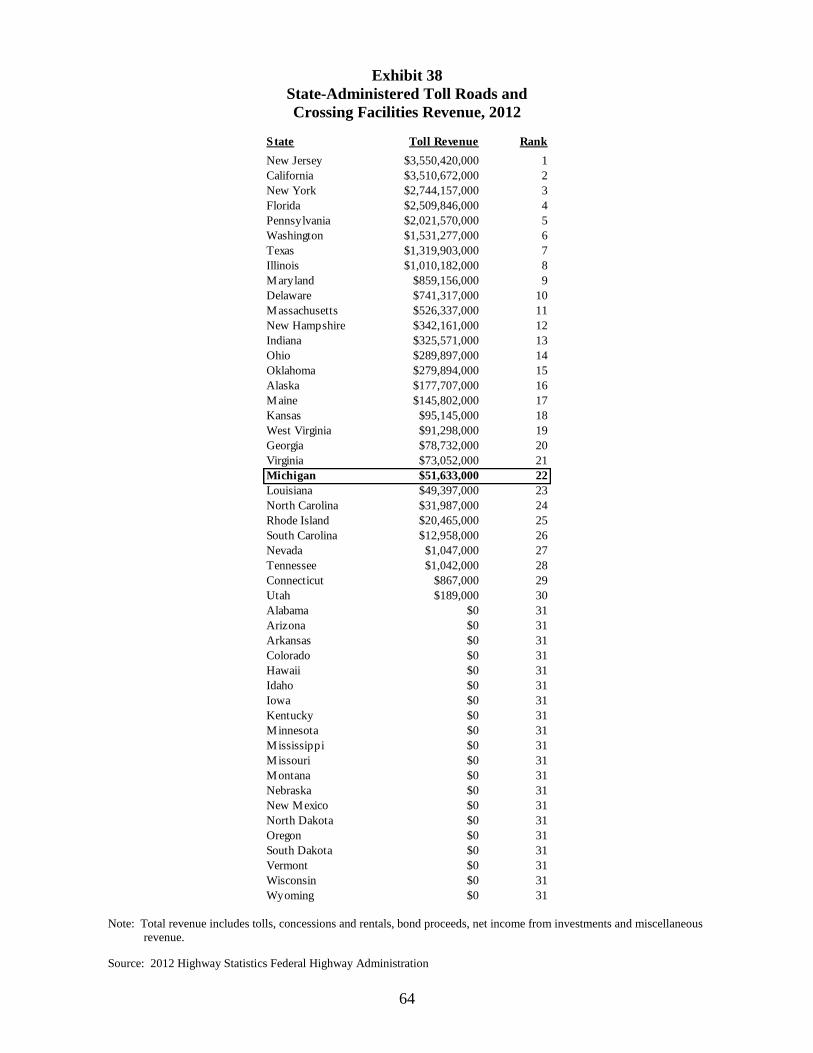
64
Exhibit 38
State-Administered Toll Roads and
Crossing Facilities Revenue, 2012
State Toll Revenue Rank
New Jersey $3,550,420,000 1
California $3,510,672,000 2
New York $2,744,157,000 3
Florida $2,509,846,000 4
Pennsylvania $2,021,570,000 5
Washington $1,531,277,000 6
Texas $1,319,903,000 7
Illinois $1,010,182,000 8
Maryland $859,156,000 9
Delaware $741,317,000 10
Massachusetts $526,337,000 11
New Hampshire $342,161,000 12
Indiana $325,571,000 13
Ohio $289,897,000 14
Oklahoma $279,894,000 15
Alaska $177,707,000 16
Maine $145,802,000 17
Kansas $95,145,000 18
West Virginia $91,298,000 19
Georgia $78,732,000 20
Virginia $73,052,000 21
Michigan $51,633,000 22
Louisiana $49,397,000 23
North Carolina $31,987,000 24
Rhode Island $20,465,000 25
South Carolina $12,958,000 26
Nevada $1,047,000 27
Tennessee $1,042,000 28
Connecticut $867,000 29
Utah $189,000 30
Alabama $0 31
Arizona $0 31
Arkansas $0 31
Colorado $0 31
Hawaii $0 31
Idaho $0 31
Iowa $0 31
Kentucky $0 31
Minnesota $0 31
Mississippi $0 31
Missouri $0 31
Montana $0 31
Nebraska $0 31
New Mexico $0 31
North Dakota $0 31
Oregon $0 31
South Dakota $0 31
Vermont $0 31
Wisconsin $0 31
Wyoming $0 31
Note: Total revenue includes tolls, concessions and rentals, bond proceeds, net income from investments and miscellaneous
revenue.
Source: 2012 Highway Statistics Federal Highway Administration

65
Exhibit 39
Michigan Motor Vehicle Registration Taxes
Motor Vehicle Licenses,
Fiscal Registration Permits and
Year Taxes Miscellaneous
1956 $63,386,404 $7,164,232
1957 66,107,708 6,071,121
1958 63,096,982 7,053,765
1959 64,483,983 12,394,776
1960 67,143,071 6,019,279
1961 67,137,714 5,768,690
1962 68,272,798 7,981,511
1963 70,931,922 3,821,461
1964 73,953,110 9,046,524
1965 77,911,496 10,304,000
1966 81,190,953 11,717,000
1967 82,640,929 14,812,000
1968 85,653,690 9,847,000
1969 114,545,531 11,508,000
1970 122,655,292 13,196,000
1971 126,664,196 11,822,000
1972 134,973,154 23,532,000
1973 143,877,500 24,085,000
1974 149,741,376 33,615,000
1975 151,426,516 18,678,000
1976 163,485,628 38,310,000
1977 166,993,061 30,403,000
1978 173,363,943 39,606,000
1979 235,343,000 53,941,000
1980 236,249,529 77,731,000
1981 211,009,832 83,859,000
1982 213,531,008 68,913,000
1983 237,724,622 51,390,000
1984 255,862,631 64,520,000
1985 286,683,713 74,401,000
1986 299,980,206 69,994,000
1987 315,941,648 64,487,000
1988 363,183,844 102,788,000
1989 397,038,510 124,929,000
1990 409,819,989 128,753,000
1991 420,162,272 121,552,000
1992 441,775,914 99,909,000
1993 462,458,099 117,348,000
1994 494,250,965 127,211,000
1995 521,156,108 160,008,000
1996 564,416,538 146,038,000
1997 596,452,461 126,256,000
1998 664,781,693 149,650,000
1999 709,869,374 143,460,000
Source: Michigan Department of Treasury (continued on next page).

66
Exhibit 39 (continued)
Michigan Motor Vehicle Registration Taxes
Motor Vehicle Licenses,
Fiscal Registration Permits and
Year Taxes Miscellaneous
2000 $755,096,882 $144,770,000
2001 777,903,036 141,863,000
2002 827,347,381 139,015,000
2003 844,695,019 141,550,000
2004 933,822,335 129,592,000
2005 863,366,561 141,870,000
2006 867,663,304 152,312,000
2007 871,726,279 142,249,000
2008 855,035,864 207,830,000
2009 839,653,571 94,418,000
2010 842,106,016 98,553,000
2011 859,674,914 113,326,000
2012 876,064,203 107,548,000
2013 906,529,973 115,640,000
2014 940,556,338 109,285,000
2015 978,145,533 113,197,000
Source: Michigan Department of Treasury.